Article

Health Risk Assessment for Exposure to Benzene in Petroleum Refinery Environments

1
Griffith School of Engineering, Griffith University, Nathan Campus, Brisbane, QLD 4111, Australia
2
Griffith School of Environment, Griffith University, Nathan Campus, Brisbane, QLD 4111, Australia
*
Author to whom correspondence should be addressed.
Int. J. Environ. Res. Public Health 2015, 12(1), 595-610; https://doi.org/10.3390/ijerph120100595
Submission received: 27 October 2014 / Accepted: 6 January 2015 / Published: 12 January 2015

Abstract

:
The health risk resulting from benzene exposure in petroleum refineries was calculated using data from the scientific literature from various countries throughout the world. The exposure data was collated into four scenarios from petroleum refinery environments and plotted as cumulative probability distributions (CPD) plots. Health risk was evaluated for each scenario using the Hazard Quotient (HQ) at 50% (CEXP50) and 95% (CEXP95) exposure levels. Benzene levels were estimated to pose a significant risk with HQ50 > 1 and HQ95 > 1 for workers exposed to benzene as base estimates for petroleum refinery workers (Scenario 1), petroleum refinery workers evaluated with personal samplers in Bulgarian refineries (Scenario 2B) and evaluated using air inside petroleum refineries in Bulgarian refineries (Scenario 3B). HQ50 < 1 were calculated for petroleum refinery workers with personal samplers in Italian refineries (Scenario 2A), air inside petroleum refineries (Scenario 3A) and air outside petroleum refineries (Scenario 4) in India and Taiwan indicating little possible adverse health effects. Also, HQ95 was < 1 for Scenario 4 however potential risk was evaluated for Scenarios 2A and 3A with HQ95 > 1. The excess Cancer risk (CR) for lifetime exposure to benzene for all the scenarios was evaluated using the Slope Factor and Overall Risk Probability (ORP) methods. The result suggests a potential cancer risk for exposure to benzene in all the scenarios. However, there is a higher cancer risk at 95% (CEXP95) for petroleum refinery workers (2B) with a CR of 48,000 per 106 and exposure to benzene in air inside petroleum refineries (3B) with a CR of 28,000 per 106.

1. Introduction

Petroleum refineries and petrochemical plants are major sources of Volatile Aromatic Hydrocarbons (VAHs) in the environment [1]. Benzene is a major VAH emitted during petroleum refinery operations [2] and has been widely used as a solvent in industries such as printing and the manufacture of shoes [3]. It is a confirmed human carcinogen [4] and epidemiological studies have shown it causes the occurrence of acute and chronic leukemia, even at low concentrations [5]. Acute exposure to high benzene concentrations can also affect the central nervous system and cause dizziness, headaches and nausea, while chronic exposure can give rise to more serious adverse health effects such as blood disease, haematotoxicity, genotoxicity, increased levels of persistent chromosome aberrations, reproductive effects and mortality [6,7,8].
Where possible, the use of benzene in manufacturing processes has been reduced by replacement with less hazardous compounds. Hence, benzene is now generally regarded as almost exclusively a product of petroleum refining [9]. Workers in petroleum refineries, including those involved in loading and transportation of petroleum products, may have some level of exposure to benzene [10].
Occupational exposure limits (OELs) have been introduced by various organizations for the management of benzene exposure. As reported in [11] benzene concentrations in modern refineries in Italy have been reported to be less than 3 mg/m3, but investigations of petroleum refinery workers in Bulgaria found benzene concentrations levels higher than 3 mg/m3 [2]. Exposure to benzene for petroleum refinery workers has been studied in several different countries and a significant body of exposure data is available in the scientific literature. However health risk assessments for benzene other than comparisons with guidelines are rare in the scientific literature.
Health risk assessment for exposure to toxic pollutants is usually carried out to evaluate the adverse effects using single data points to quantify the risk. However, risk assessment using probabilistic techniques utilizes probability distributions to estimate the risk thereby giving an evaluation of variability [12,13,14,15]. This technique gives a quantitative description of uncertainty and variability in evaluating the risk of adverse health effects [16]. In previous work [17,18] we have developed novel techniques for the characterization of human health risk assessment using probabilistic techniques. Previously we have used probabilistic techniques to evaluate the health effects of volatile aromatic hydrocarbons, benzene, toluene and xylene on workers and customers in service stations serving petrol fuel for motor vehicles. This allowed us to overview international data indicating that service station attendants and mechanics repairing dispensing petrol pumps had a significant health risk due to exposure to benzene.
The aim of this study was to collect and collate exposure data for benzene in petroleum refineries environment on a global scale and conduct a risk assessment to evaluate the possible adverse health effects.

2. Methodology

2.1. Research Strategy

The strategy used in this research involved collection and collation of benzene exposure data and guideline values from the scientific literature. Like data sets presented in Table 1, were combined together and then divided into Scenarios according to location and setting. The data sets for each Scenario were used to develop Cumulative Probability Distribution (CPD) plots. From the CPD plots, the Hazard Quotient and Cancer Risk were evaluated at 50% (CEXP50) and 95% (CEXP95) cumulative probability of benzene exposure levels. The CEXP50 level gave an evaluation relevant to most of the exposed population while CEXP95 was relevant to the 5% most exposed group. On the other hand, Overall Risk Probability was an estimated value relative to the whole population.
Table 1. Investigations of benzene concentrations in petroleum refineries.
ReferenceDescriptionCountrySampling Method
[11]Cytogenic biomonitoring on a group of petroleum refinery workersItaly (two different Italian petroleum refineries)P *
[2]Cytogenic effects of Bulgarian petroleum refinery workers chronically exposed to benzeneBulgaria (NEFTOCHIM oil company in Burgas)P * and S *
[19]Retrospective exposure assessment for benzene in the Australian petroleum industryAustralia (nine companies with employees participating in health watch)BE *
[20]Ensuring comparability of benzene exposure estimates across three nested case-control studies in the petroleum industry in support of a pooled epidemiological analysisCanada, Australia, United KingdomBE *
[21]Retrospective estimation of exposure to benzene in a leukaemia case-control study of petroleum marketing and distribution workers in the United KingdomUnited Kingdom (four companies in the petroleum marketing and distribution industry in the UK)BE *
[1]Seasonal variation of toxic benzene emissions in petroleum refineryIndia (Digboi petroleum refinery at GowahatiS *
[22]Monitoring and analysis of volatile organic compounds around an oil refineryItaly (a petroleum refinery in Valle Galeria, Rome)S *
[10]Volatile organic compounds in ambient air of Kaohsiung petroleum refineryTaiwan, Kaohsiung refineryS *
* P, personal sampling; S, static sampling; BE, base estimate.

2.1.1. Data Collection

Data sets for benzene exposure in petroleum refinery environments used in this study were gathered from the scientific literature using various search engines such as Google, Web of Knowledge, PubMed, Toxnet, Medline and Science Direct. Each reference provided one or more sets of benzene measurements, with each set representing measurements for a sampling location, activity or occupation (Table 1) [1,2,10,11,19,20,21,23].

2.1.2. Criteria for Data Selection

The health risk was focused on evaluating exposure data on benzene concentrations in the ambient air of petroleum refineries. Only data sets reported as individual concentrations and base estimates concentrations were utilized for consistency since a number of data sets were reported as mean concentrations. These data sets (mean data) were not included in the risk assessment analysis since they cannot be combined and interpreted with the datasets on individual measurements and base estimates.

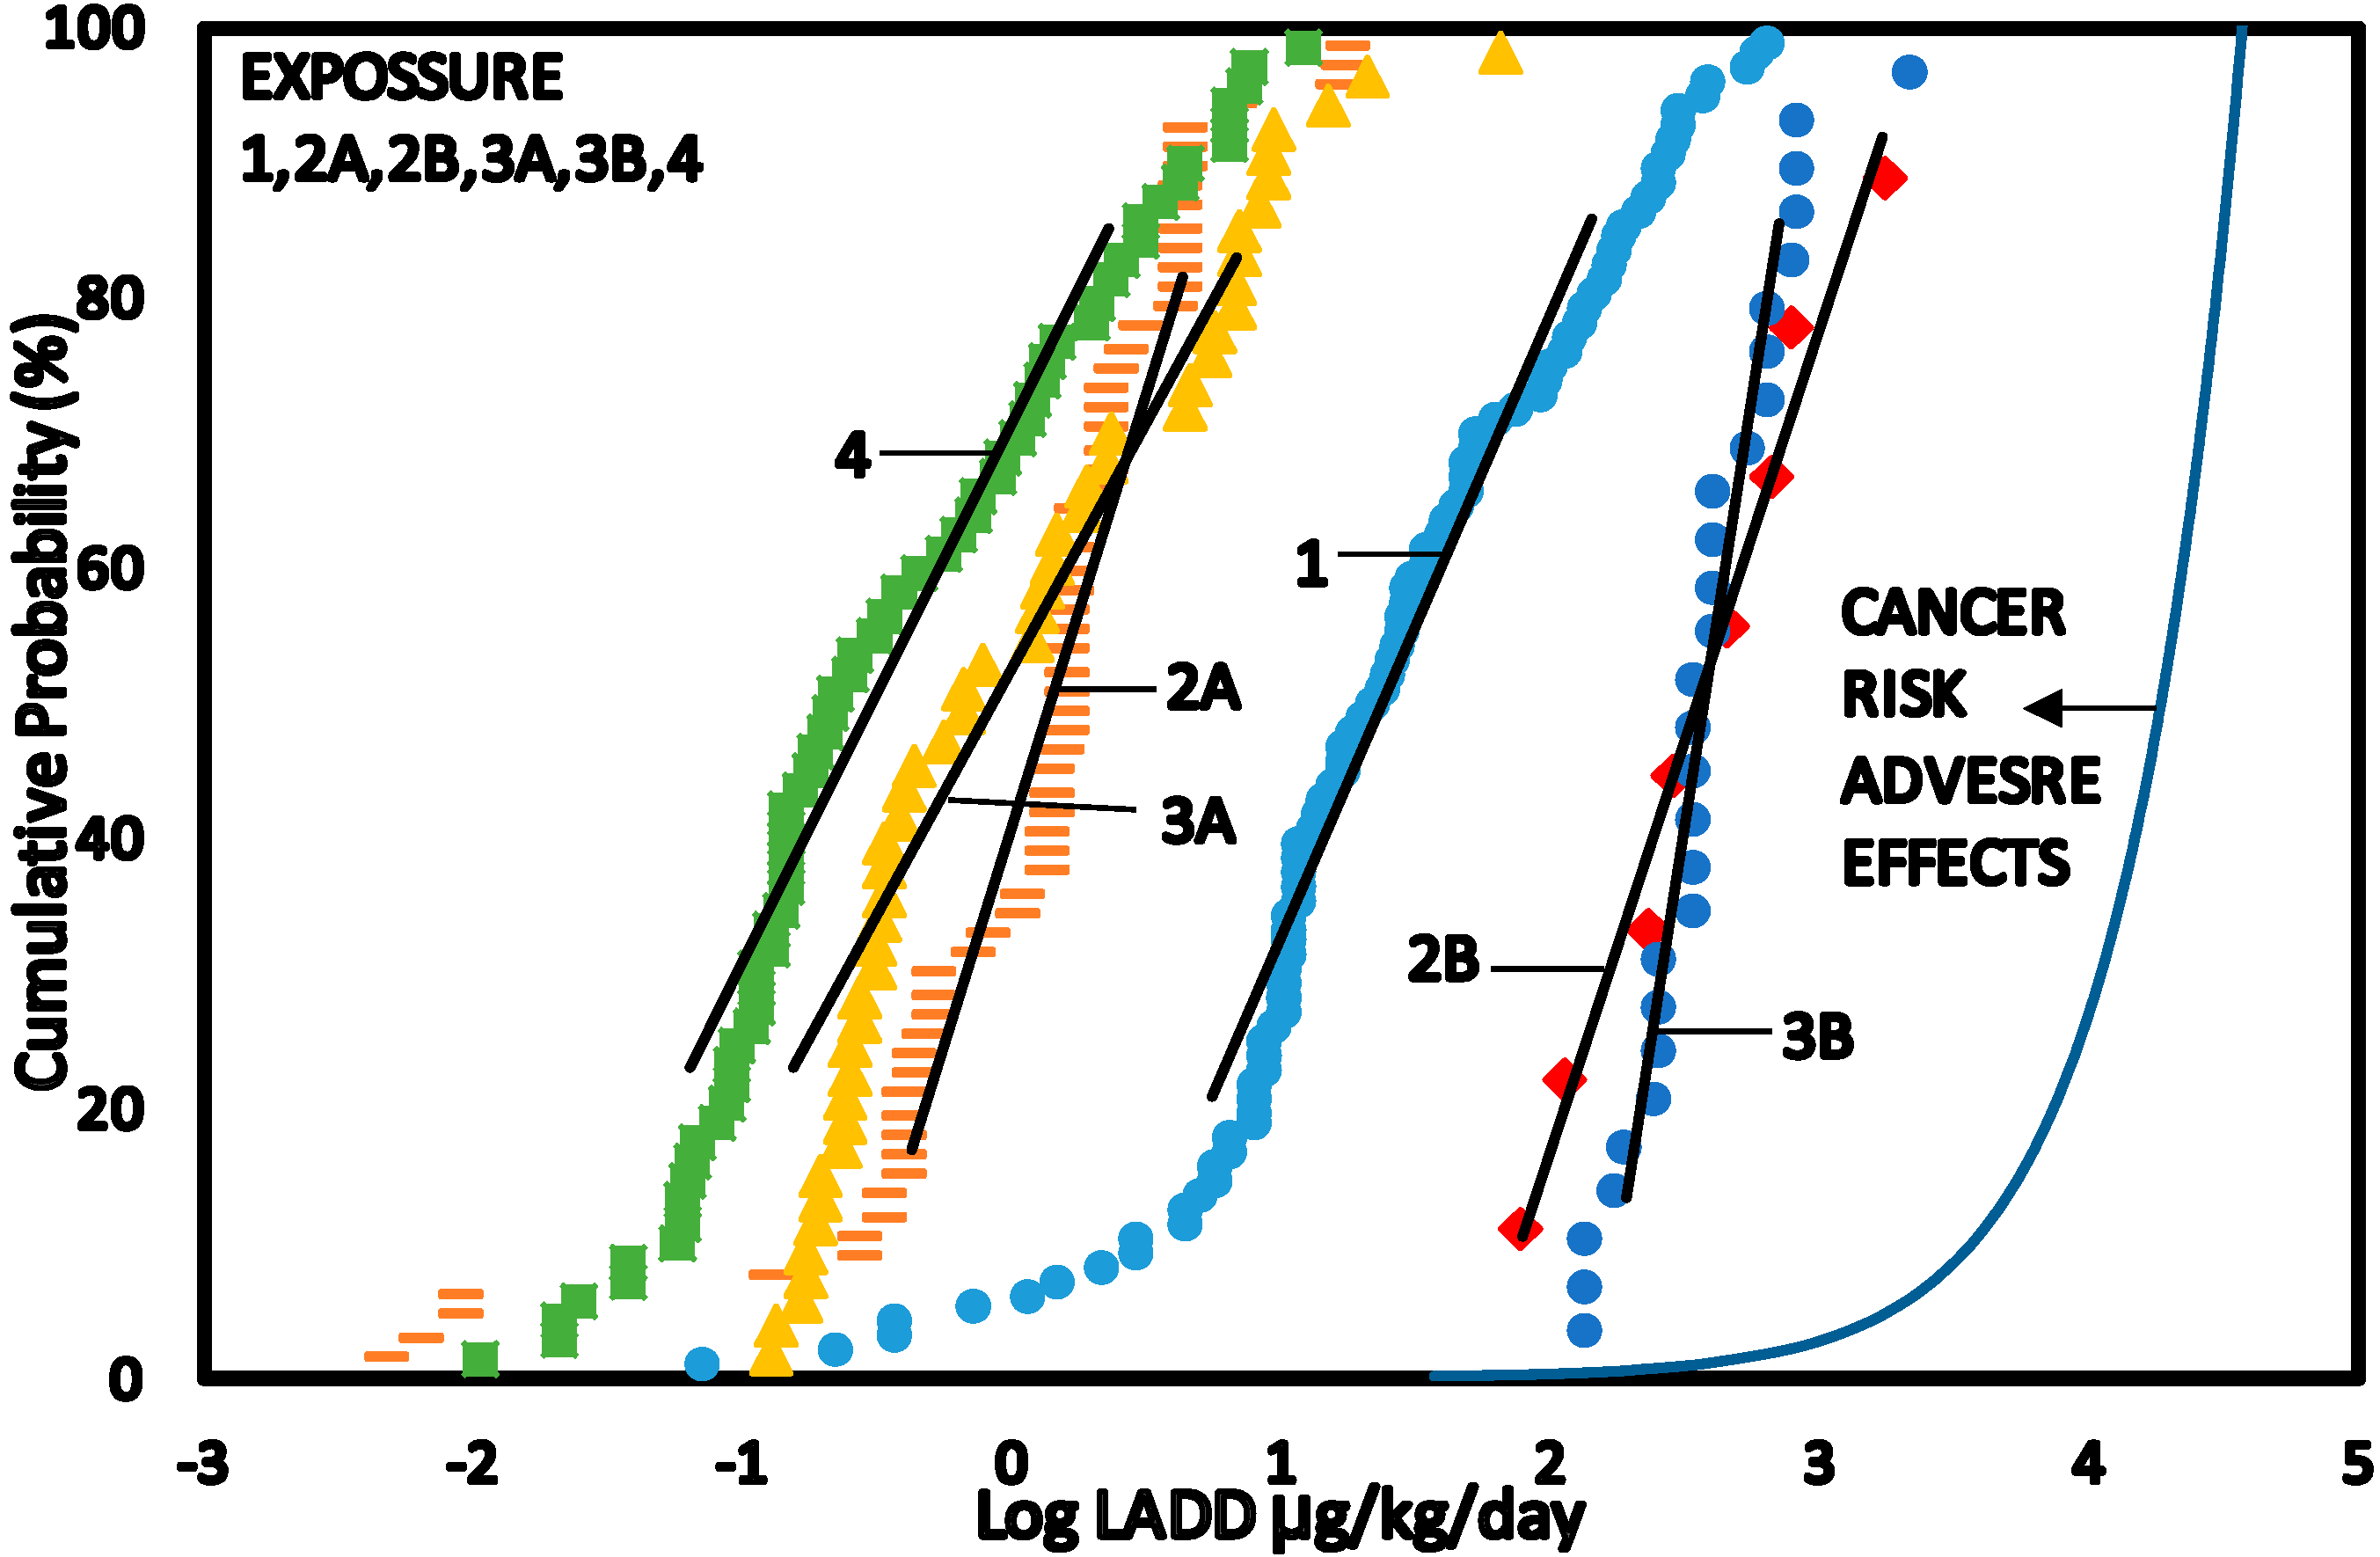
2.1.3. Preparation of Probability Distribution Plots

The data sets for benzene exposure were used to develop Cumulative Probability Distribution (CPD) plots by using Microsoft Excel. CP (%) was calculated from Equation (1):
C P ( % )   =   ( i / n + 1 )   × 100
where CP is cumulative probability (%); i, ith point; n, total number of data points. The linear regression equations of the CPD plots were usually calculated between approximately 10%–90% of the Cumulative Probability distribution since this represents the approximately linear part of the CPD plots when a normal distribution occurs.

2.1.4. Guideline Values for Benzene

The exposure limits for occupational exposure to benzene from various organizations such as European Commission, OSHA, NIOSH, ACIGH and SWA and Air Quality Guidelines (AQGs) and United Kingdom are summarized in Table 2 [22,24,25,26,27]. Exposure evaluation of benzene concentrations in the various scenarios were for occupational and general population exposure. Occupational exposure limits were used to compare exposures to benzene for Scenarios 1, 2A, 2B, 3A and 3B (occupational exposure), while Air Quality Guideline (AQGs) were used to compare exposure to benzene in Scenario 4 (exposure to people external to the petroleum refineries).

2.2. Data Analysis

2.2.1. Background

The data sets were obtained from the publications listed in Table 1. The benzene concentration data were converted from mg/m3, ppm and ppb to a uniform unit of µg/m3. The data sets that were used to develop CPD plots for exposure to benzene were categorized into Scenarios as outlined below.

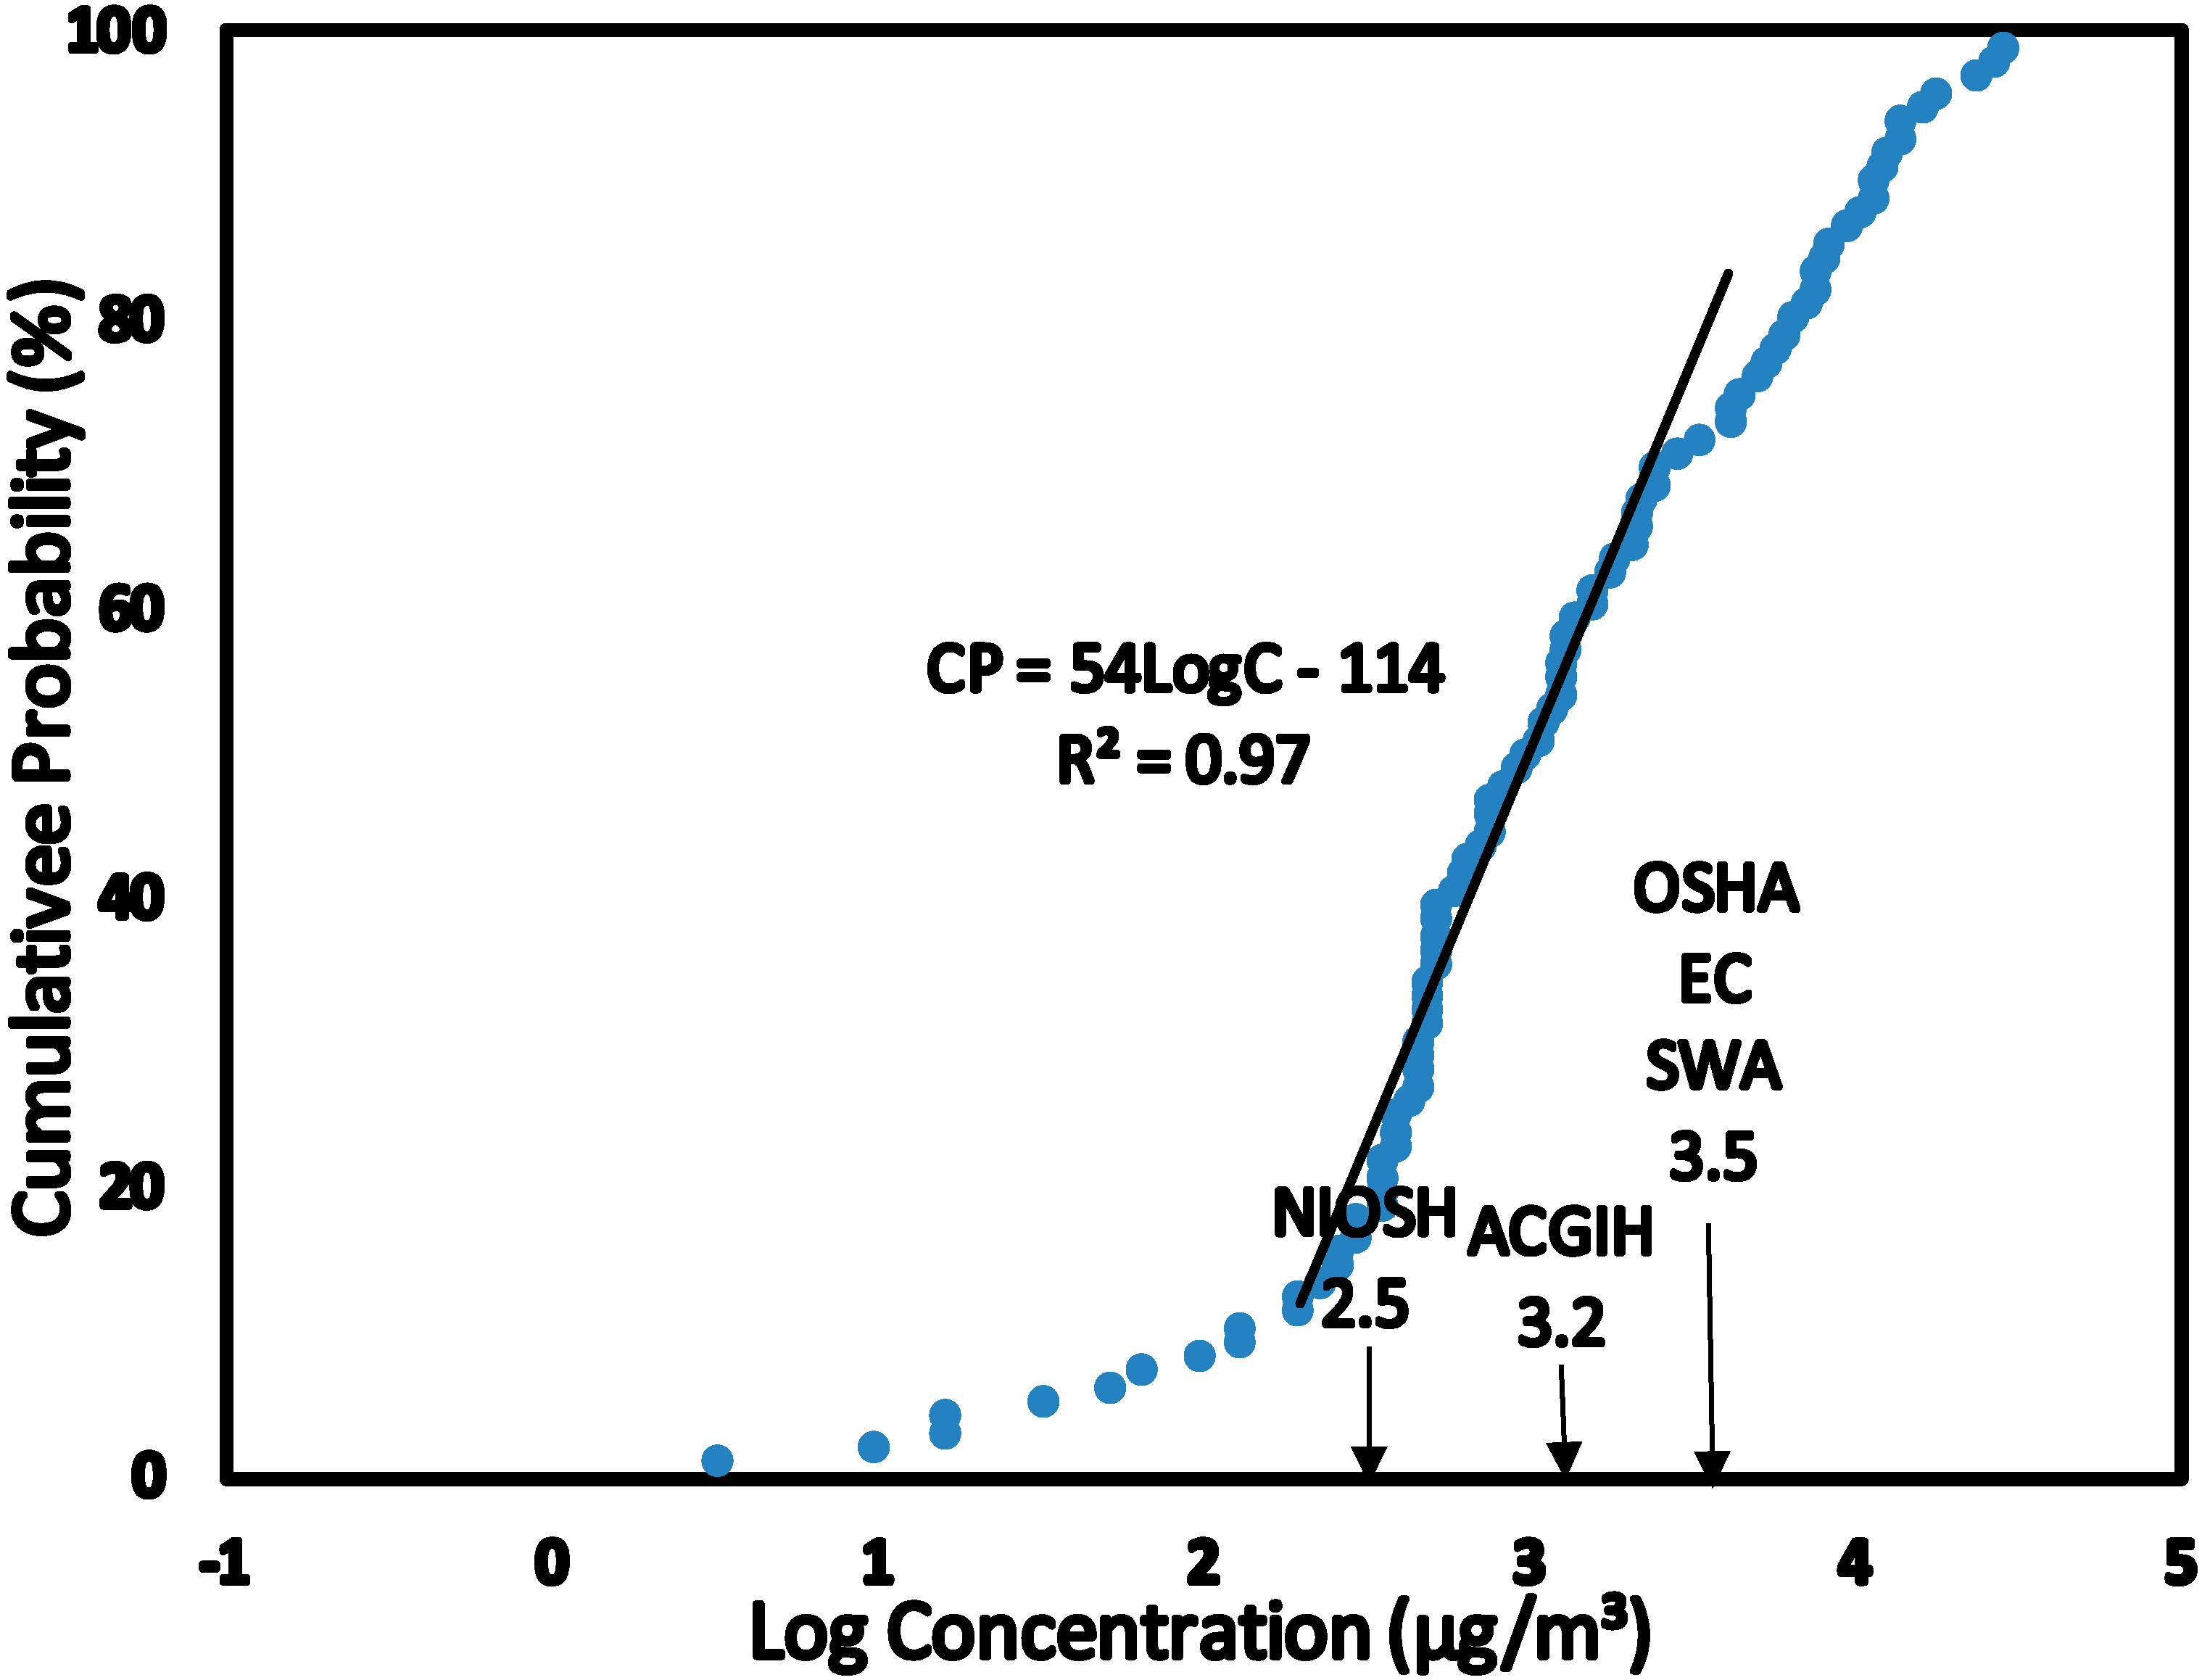
2.2.2. Scenario 1—Exposure to Benzene as Base Estimate Concentrations for Petroleum Refinery Workers

This scenario represents benzene concentrations collected as base estimate concentrations for retrospective benzene exposures in petroleum industries from studies using similar methods in deriving the base estimates from benzene measurements. The studies were for early 1940 to 1996 for the Australian study [19]; 1909 to 1989 for the Canadian study [20]; 1902 to 1992 for the United Kingdom study [21]. Base estimates were calculated for available measurements of benzene concentrations during these periods. However, in situations were measured benzene data was not available, benzene exposure was estimated to derive the base estimate. The data sets used in this Scenario were obtained from [19,20,21].
Table 2. Standards and guidelines for exposure to benzene.
Regulatory BodyDescriptionBenzene Concentration (µg/m3)
Occupational Exposure Limits (OEL)
American Conference of Governmental Industrial Hygienists (ACGIH), USAThreshold Limit Values (TLV)1600
Occupational Safety and Health Administration (OSHA), USAPermissible Exposure Limit (PEL)3250
National Institute for Occupational Safety and Health (NIOSH), USARecommended Exposure Limit (REL)325
Safe Work Australia (SWA)Occupational Exposure limit (OEL)3250
European Directives 2000/39/EC and 97/42/EC (ED)Limit Value (LV)3250
Air Quality Guidelines (AQGs)
European Union Directives 2000/69/ECAnnual mean5
Expert Panel on Air Quality Standards (EPAQS), United KingdomAnnual mean16.25

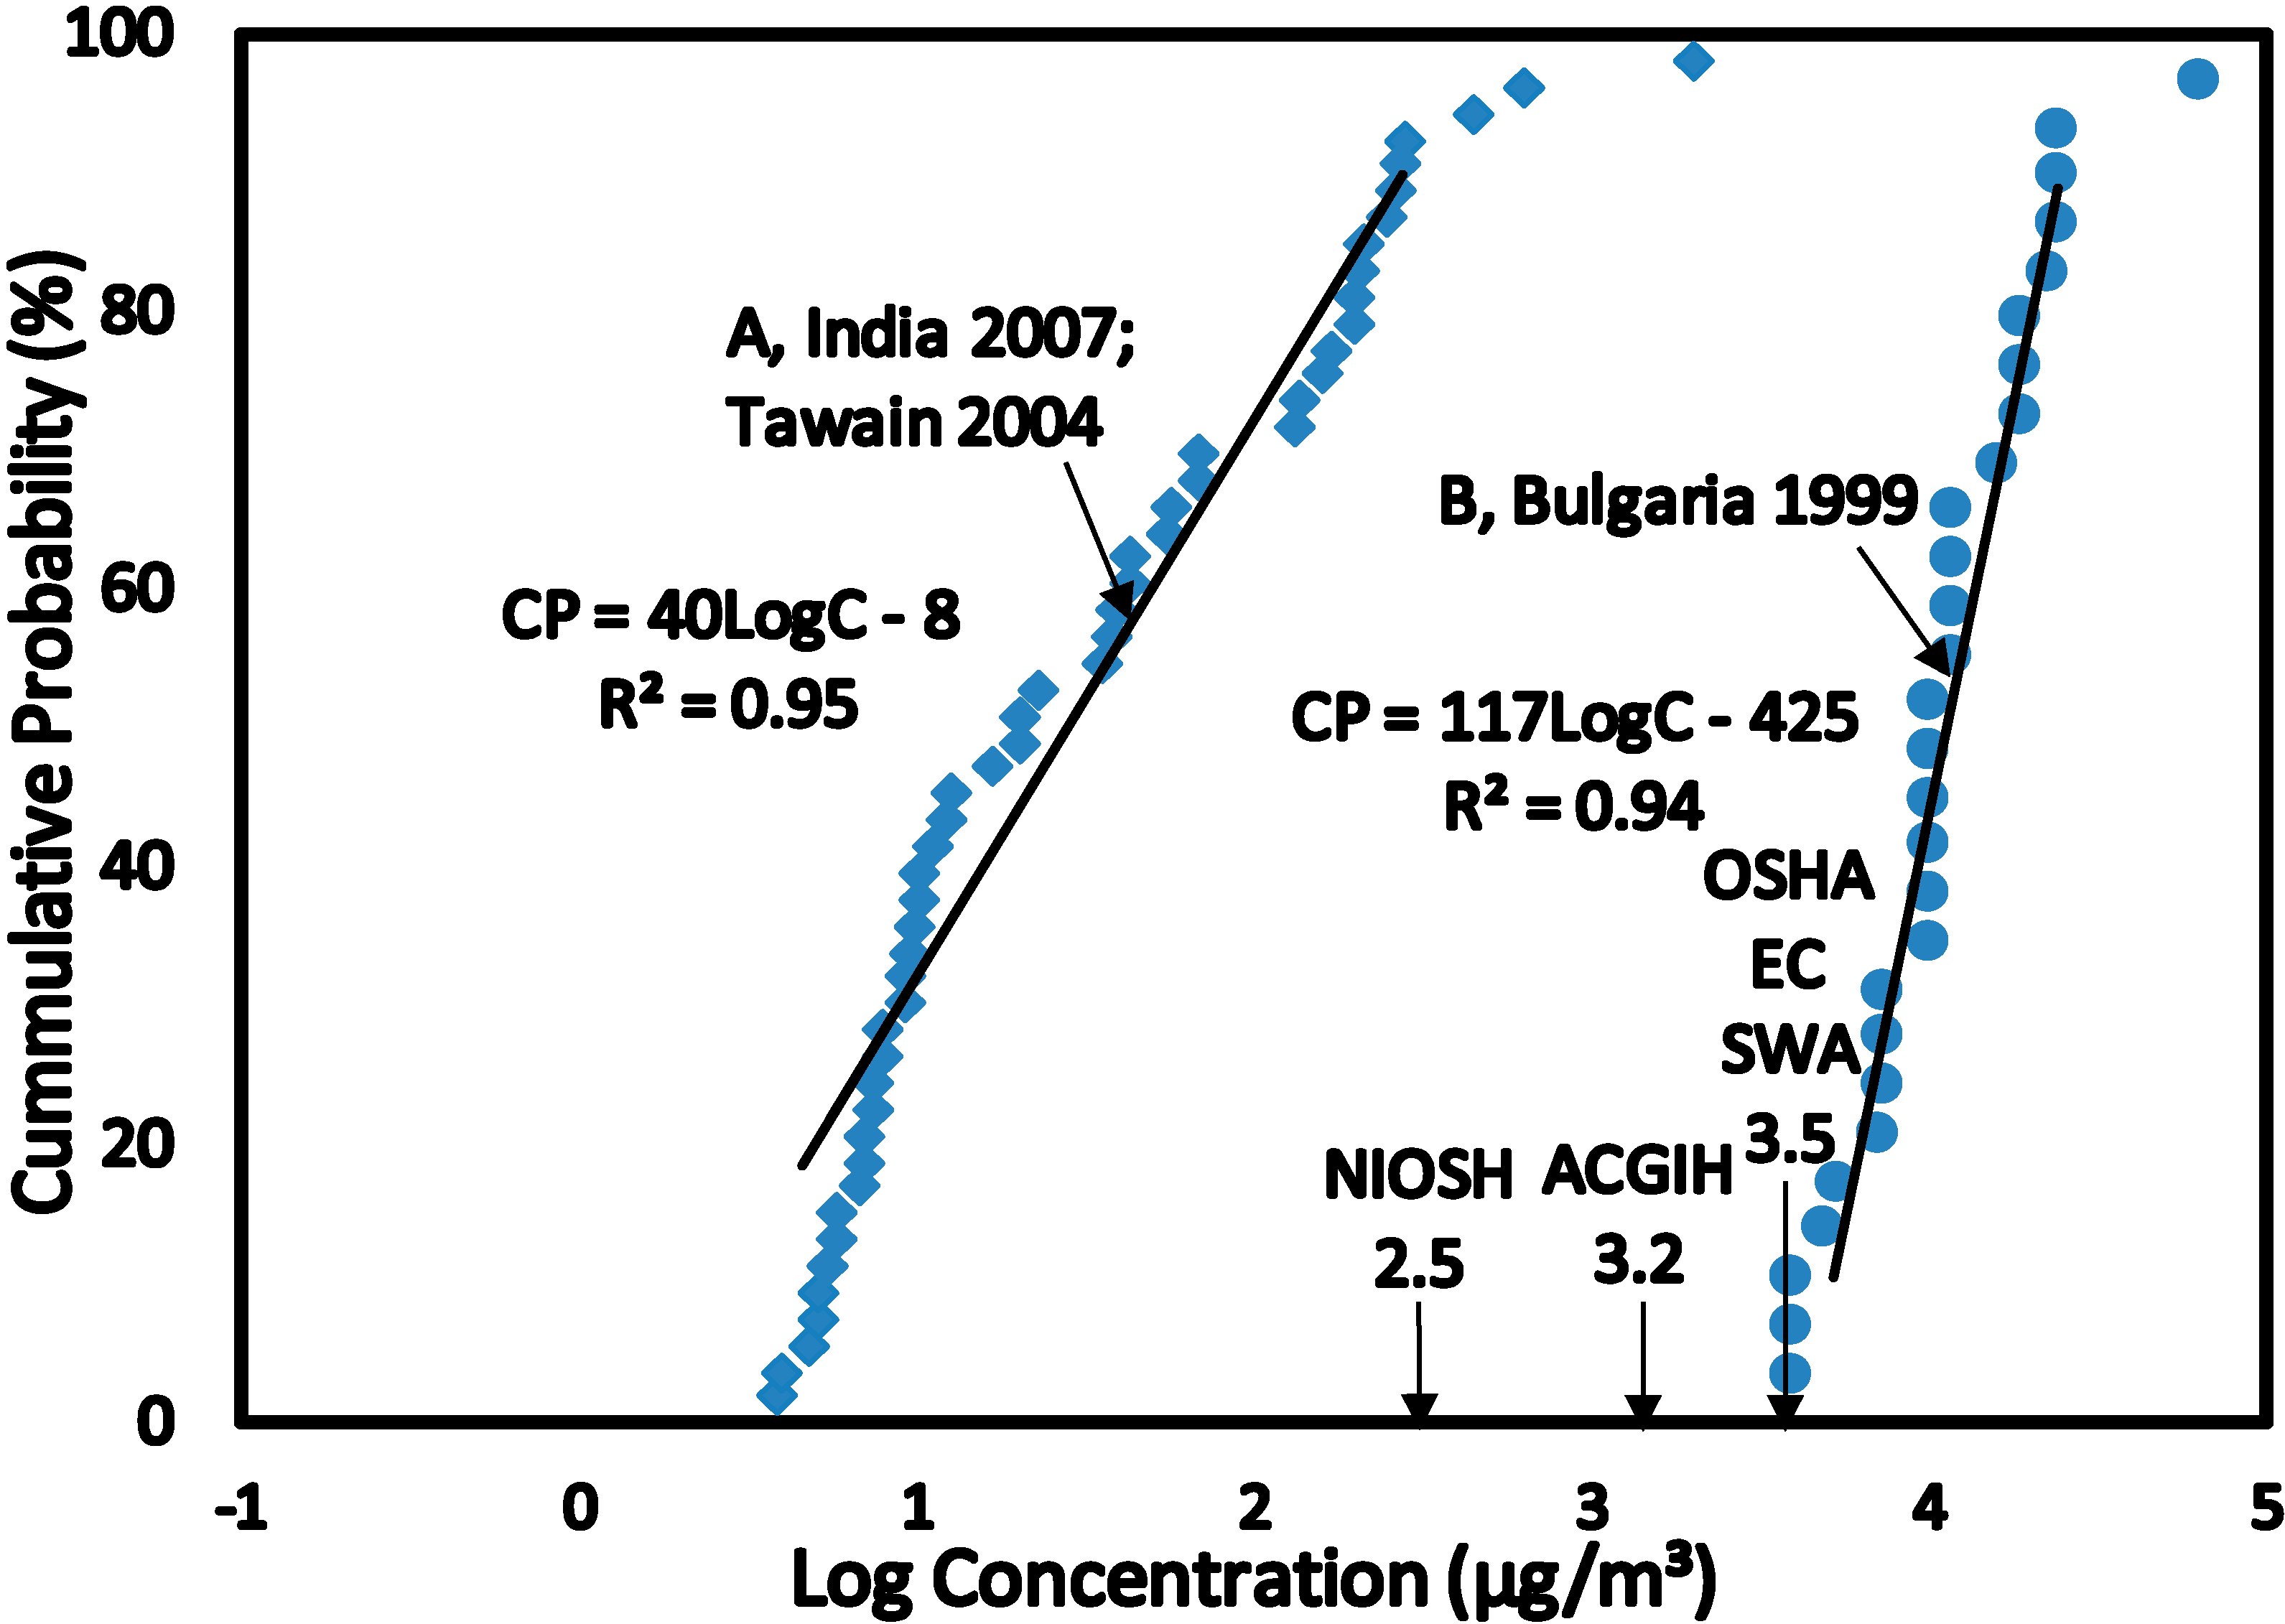
2.2.3. Scenario 2—Exposure to Benzene for Petroleum Refinery Workers

This scenario was for petroleum refinery workers in different occupation within the petroleum refineries exposed to benzene. The concentrations of benzene in air were collected by the workers wearing personal air sampling pumps. The data sets used in this scenario were obtained from [2,11].

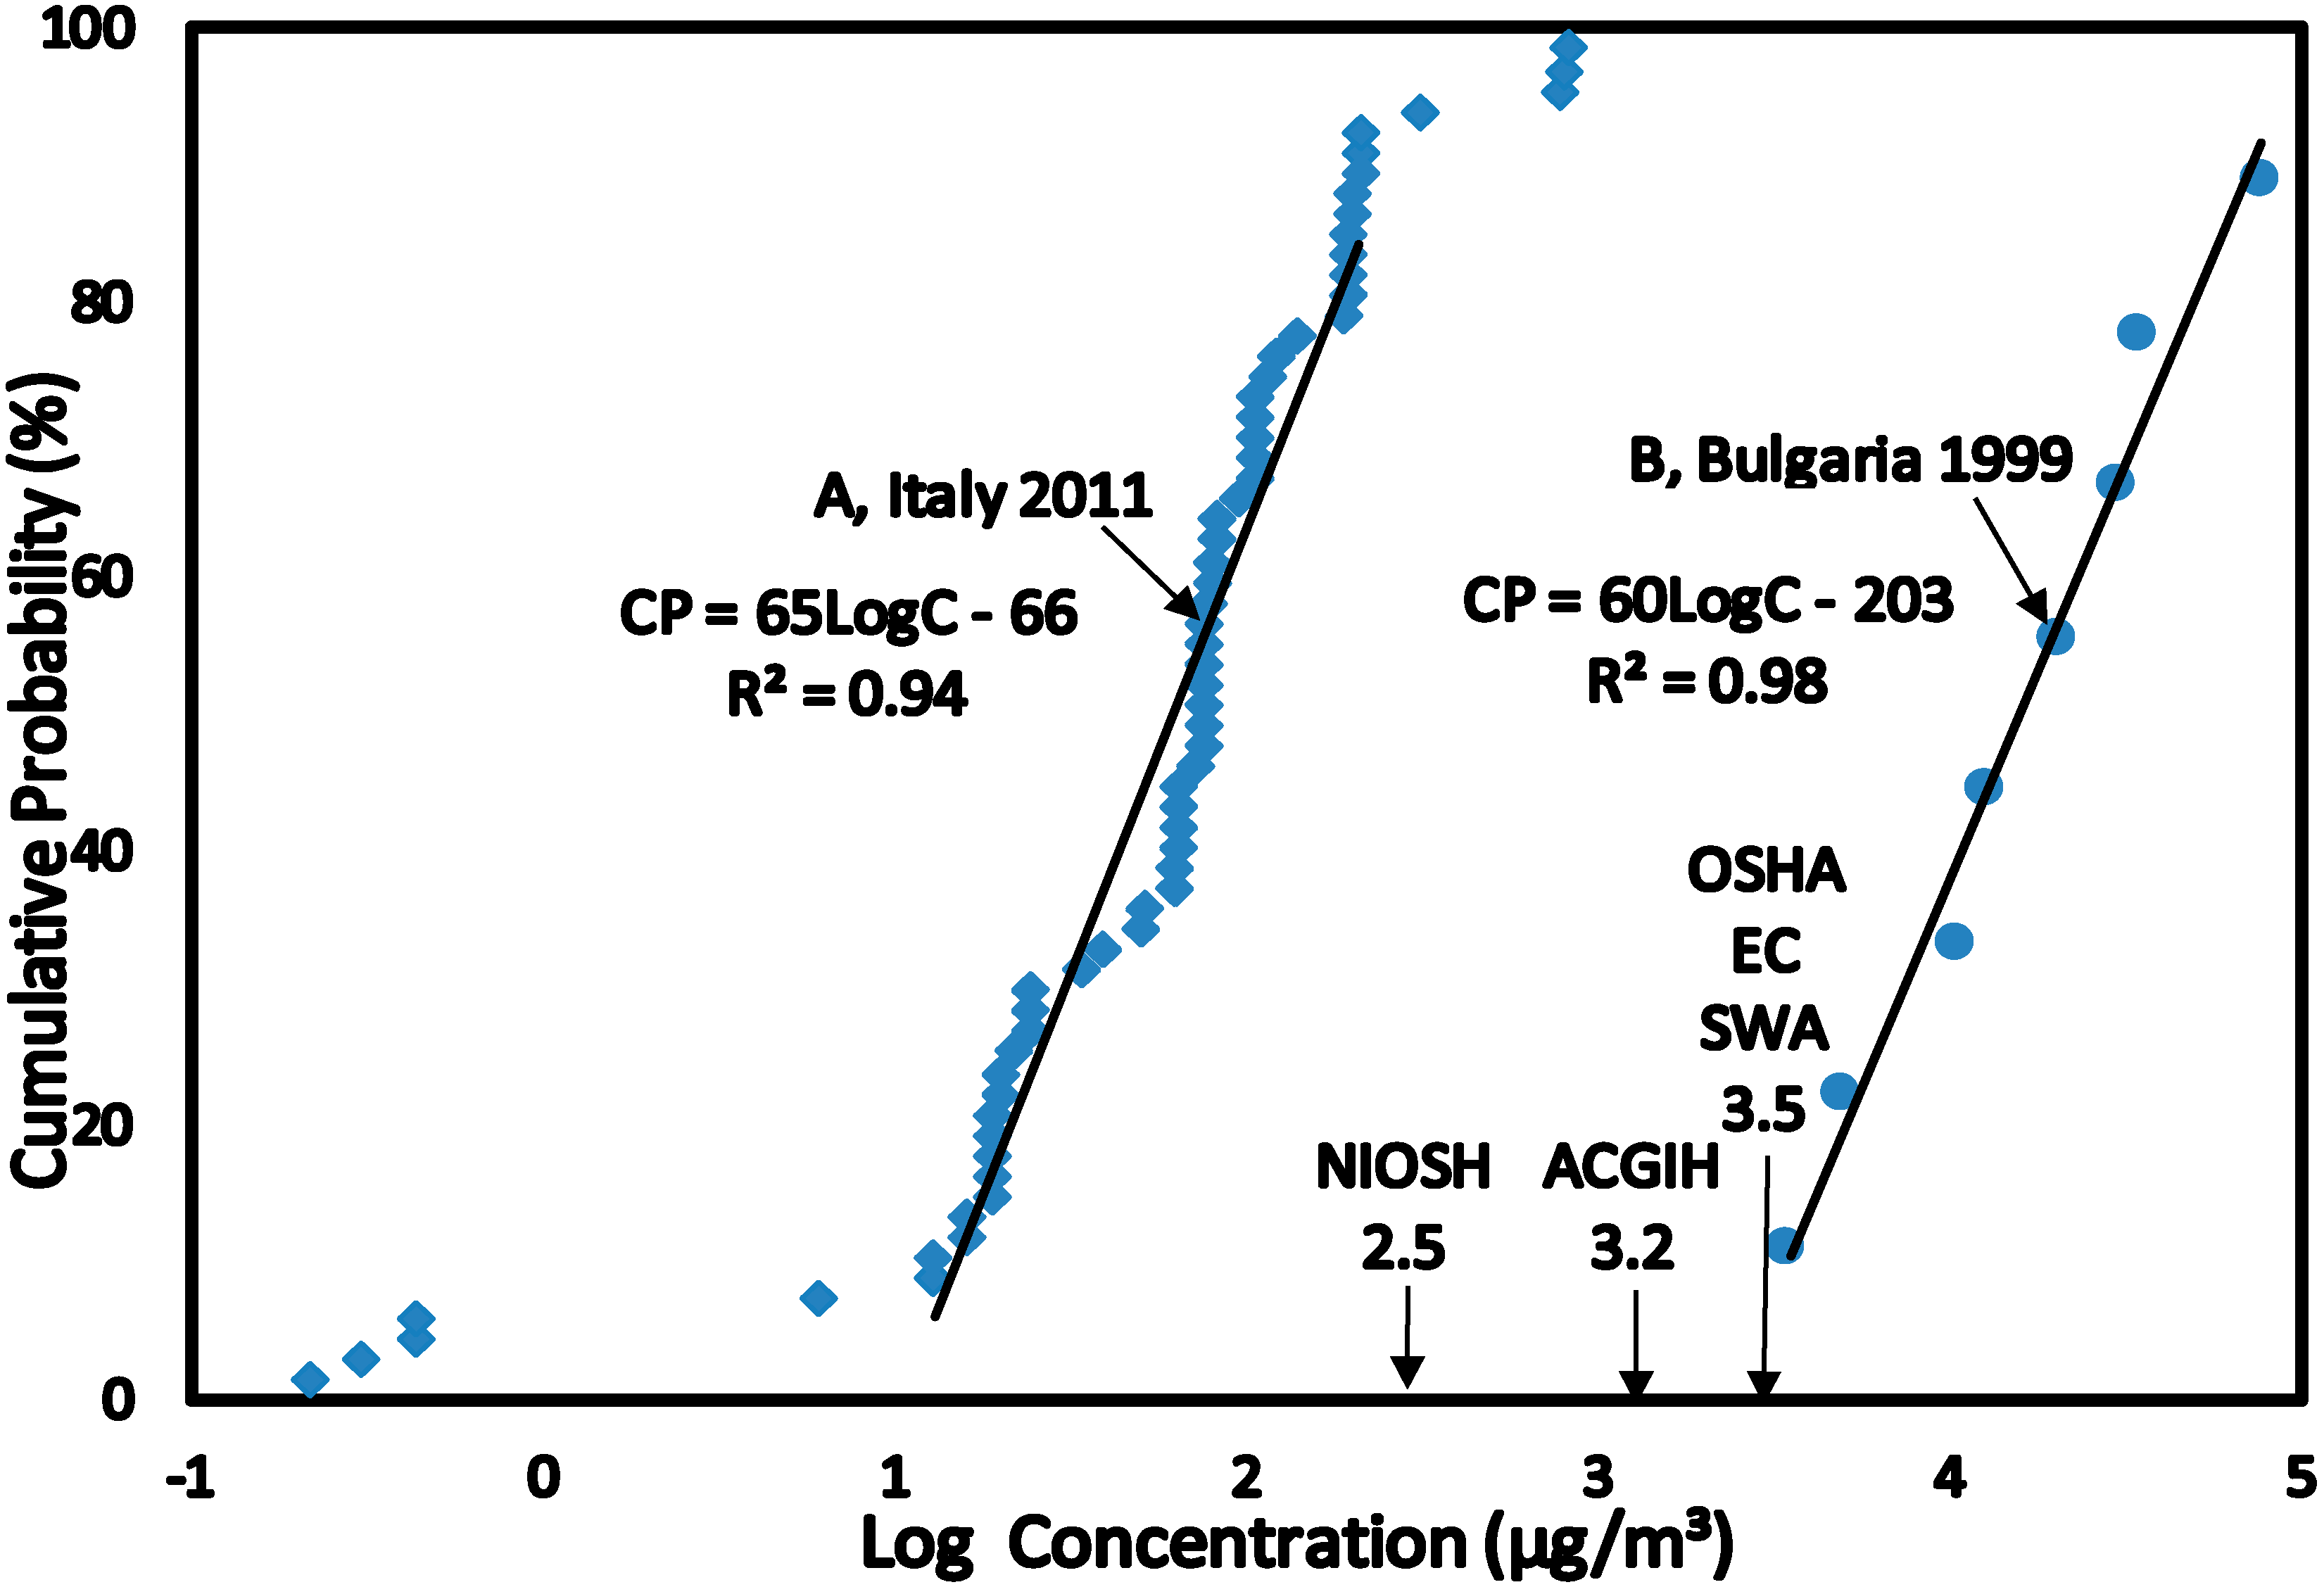
2.2.4. Scenario 3—Benzene Concentrations in Air Inside the Petroleum Refineries

The data sets were derived from air samples of benzene taken within various work locations inside the petroleum refineries. Measurements of benzene concentration levels were obtained by using air sampling pumps positioned at various locations inside the petroleum refineries. The data sets used in this scenario were obtained from [1,2,10].

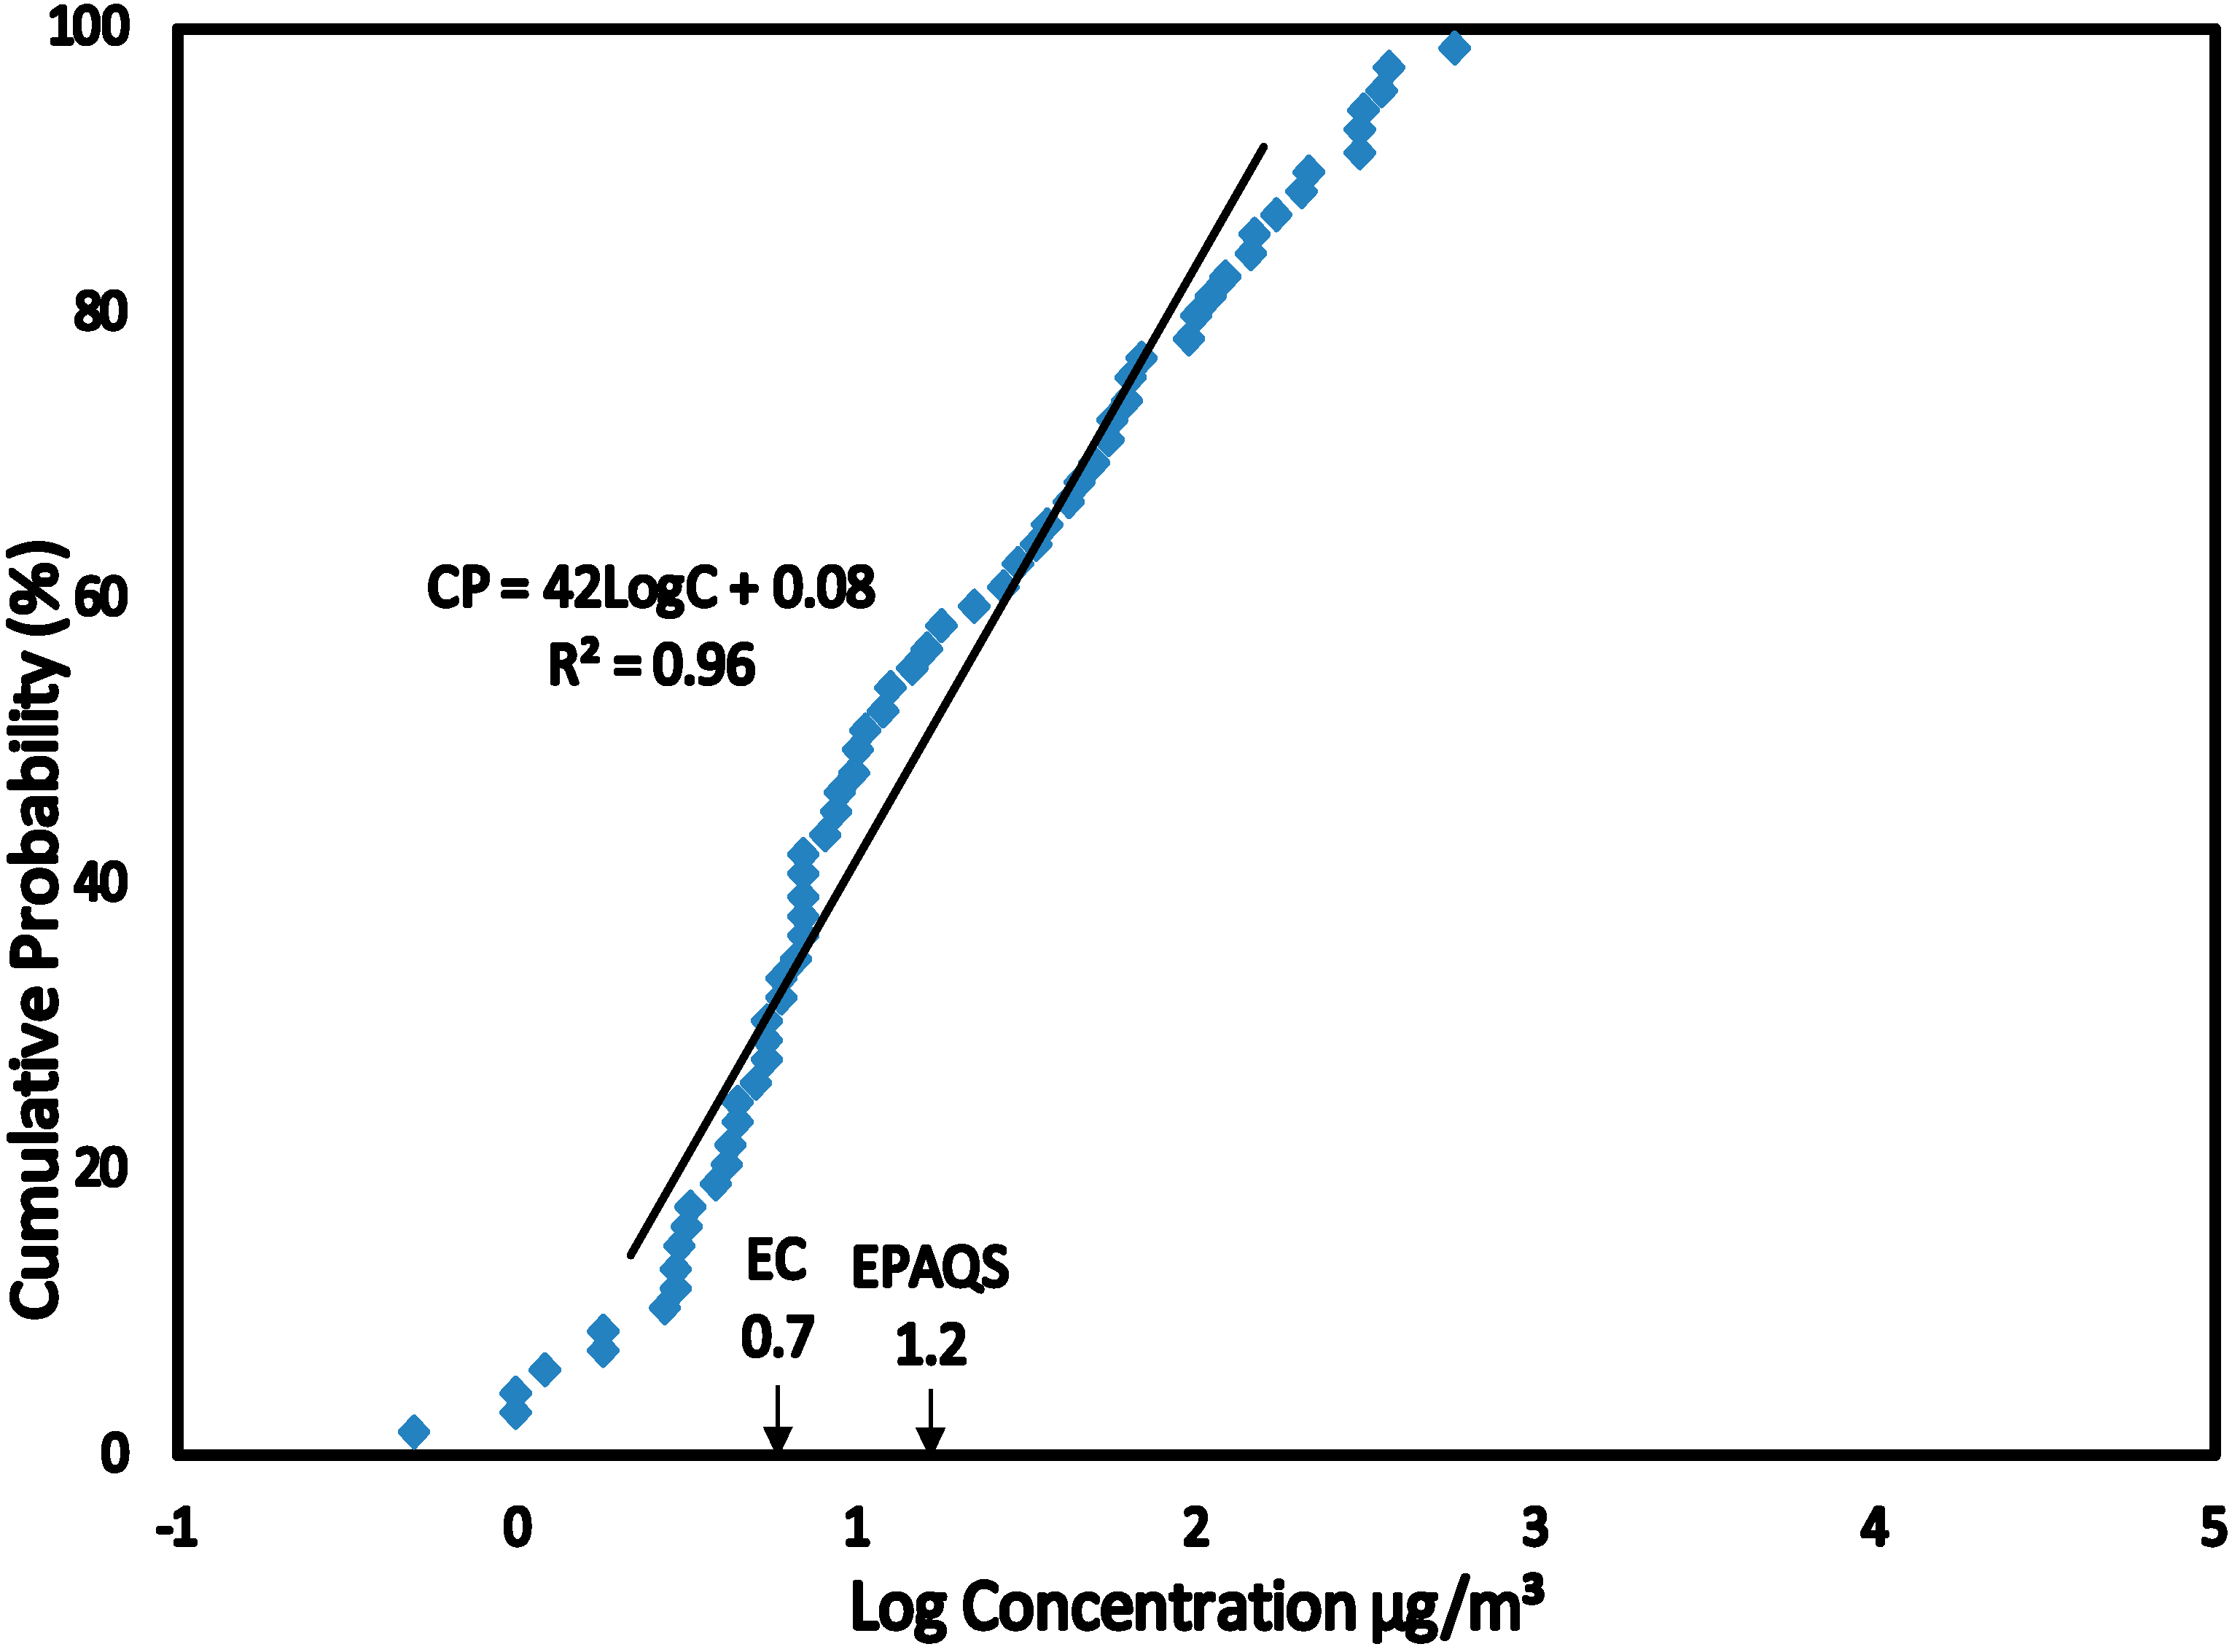
2.2.5. Scenario 4—Benzene Concentrations in Air Outside the Petroleum Refineries

The data sets obtained for this scenario were for emissions of benzene from petroleum refineries to the immediate surroundings giving exposure to people living near the petroleum refineries. Benzene concentrations were obtained around the petroleum refineries at a maximum distance of 2 km by using air sampling pumps at different sampling locations near the petroleum refineries. The data sets used in this scenario were obtained from [1,10,22].

2.3. Risk Characterization

2.3.1. Exposure Calculation

The data sets for exposure to benzene were categorized into related Scenarios 1 to 4 (see Section 3.1) and converted into CPD plots (see Figure 1, Figure 2, Figure 3 and Figure 4). This allowed the estimation of the CEXP50 (the median level which represents the main group) and CEXP95 representing the highest exposed group in the population levels of exposure of the population within each scenario. The benzene concentrations (Scenario 1 to 4) were converted from µg/m3 to µg/kg/day in terms of Lifetime Average Daily Dose (LADD) using values summarized in Table 3. The LADD were used in calculating the Hazard Quotient, Cancer Risk and Overall Risk Probability. The values of USEPA Inhalation Reference Dose (RfD) and Slope Factor (SF) for estimating the HQ and CR were summarized in Table 3 [28,29,30].
The Lifetime Average Daily Doses (LADD) (µg/kg/day) for exposure to benzene concentrations were calculated for all Scenarios using the default values in Table 3 with Equation (2):
L A D D =   [ C E X P   × I R   × E L ×   E D ] / [ B W   × L T ]
where CEXP is exposure concentration (µg/m3); IR, Inhalation Rate (m3/day); EL, Exposure Length (day/day); ED, the Exposure Duration (days); BW, Body Weight (kg); LT, Lifetime (days).
Figure 1. SCENARIO 1—Exposure to Benzene as Base Estimates for Petroleum Refinery Workers. Retrospective exposure to benzene concentrations as base estimate concentrations for petroleum refinery workers in Australia (1940 to 1989), Canada (1902 to 1996) and United Kingdom (1906 to 1989). Base estimate concentration data for years prior to 1970 is based on modelling and is included in this plot.
Ijerph 12 00595 g001
Figure 2. SCENARIO 2—Exposure to Benzene for Petroleum Refinery Workers. Exposure to benzene concentrations in air measured using personal sampling techniques for petroleum refinery workers in Italy (A) 2011 and Bulgaria (B) 1999.
Ijerph 12 00595 g002
Figure 3. SCENARIO 3—Benzene Concentrations in Air inside Petroleum Refineries. Benzene concentrations in air measured by static sampling techniques inside petroleum refineries in India (A) 2007 and Taiwan (A) 2004 and in Bulgaria (B) 1999.
Ijerph 12 00595 g003
Figure 4. SCENARIO 4—Benzene Concentrations in Air outside Petroleum Refineries. Benzene concentrations in air measured by static sampling techniques around the petroleum refineries in India (2000), Italy (2004) and Taiwan (2008) at a maximum distance of 2 km.
Ijerph 12 00595 g004
Table 3. Summary of default exposure factors.
ParameterUnitDefault Value
Lifetime (LT)years70
Body Weight (BW)kg70
Exposure Length (EL)day/day0.33 (8 h/day) (workers)
0.17 (4 h/day) (outdoor)
Exposure Duration (ED)years25 (commercial/industrial)
30 (residential)
Inhalation Rate (IR)m3/day20
Inhalation Reference Dose (RfD)mg/kg/day0.0085
Slope Factor(mg/kg/day)−10.0273
LT = 7 days/week × 52 weeks/year × 70 years = 25,480 days (Scenario 1 to 4); ED = 5 days/week × 48 weeks/year × 25 years = 6000 days (Scenario 1and 2); ED = 7 days/week × 52 weeks/year × 25 years = 9100 days (Scenario 3); ED = 7 days/week × 52 weeks/year × 30 years = 10,920 days (Scenario 4); EL = 0.33 day/day (8 h/day) (Scenarios 1, 2 and 3); EL = 0.17 day/day (4 h/day) (Scenario 4).

2.3.2. Use of the Hazard Quotient (HQ)

The HQ method of risk characterization was used to estimate the adverse health effects for exposure to benzene. The USEPA Reference Dose (RfD) derived for benzene was used to estimate the HQ for all Scenarios by using Equation (3). Benzene exposures were estimated at the median level (CEXP50) which represents the main group of individuals and the 95% level (CEXP95) representing the highest exposed group in the population. This highly exposed group occurs at a level of 5% in the population and the median group represents over 50% in the population. Benzene concentrations at CEXP50 and CEXP95 were obtained from the CPD plots (Figure 1, Figure 2, Figure 3 and Figure 4) and converted to LADD using Equation (2). HQ was estimated at CEXP50 and CEXP95 using Equation (3):
H Q = L A D D / R f D
where HQ is the Hazard Quotient; LADD, lifetime average daily dose (µg/kg/day); RfD, USEPA reference dose (µg/kg/day) (Table 3).

2.3.3. Cancer Risk

Cancer risk is expressed as excess risk of developing cancer over a lifetime of exposure (70 years).
The USEPA inhalation slope factor derived for benzene was used to quantitatively estimate the excess cancer risk at CEXP50 and CEXP95 in terms of lifetime exposure (LADD) in the various scenarios by using Equation (4):
Cancer Risk = LADD (µg/kg/day) × SF (µg/kg/day)−1
where SF is slope factor for benzene (Table 3).

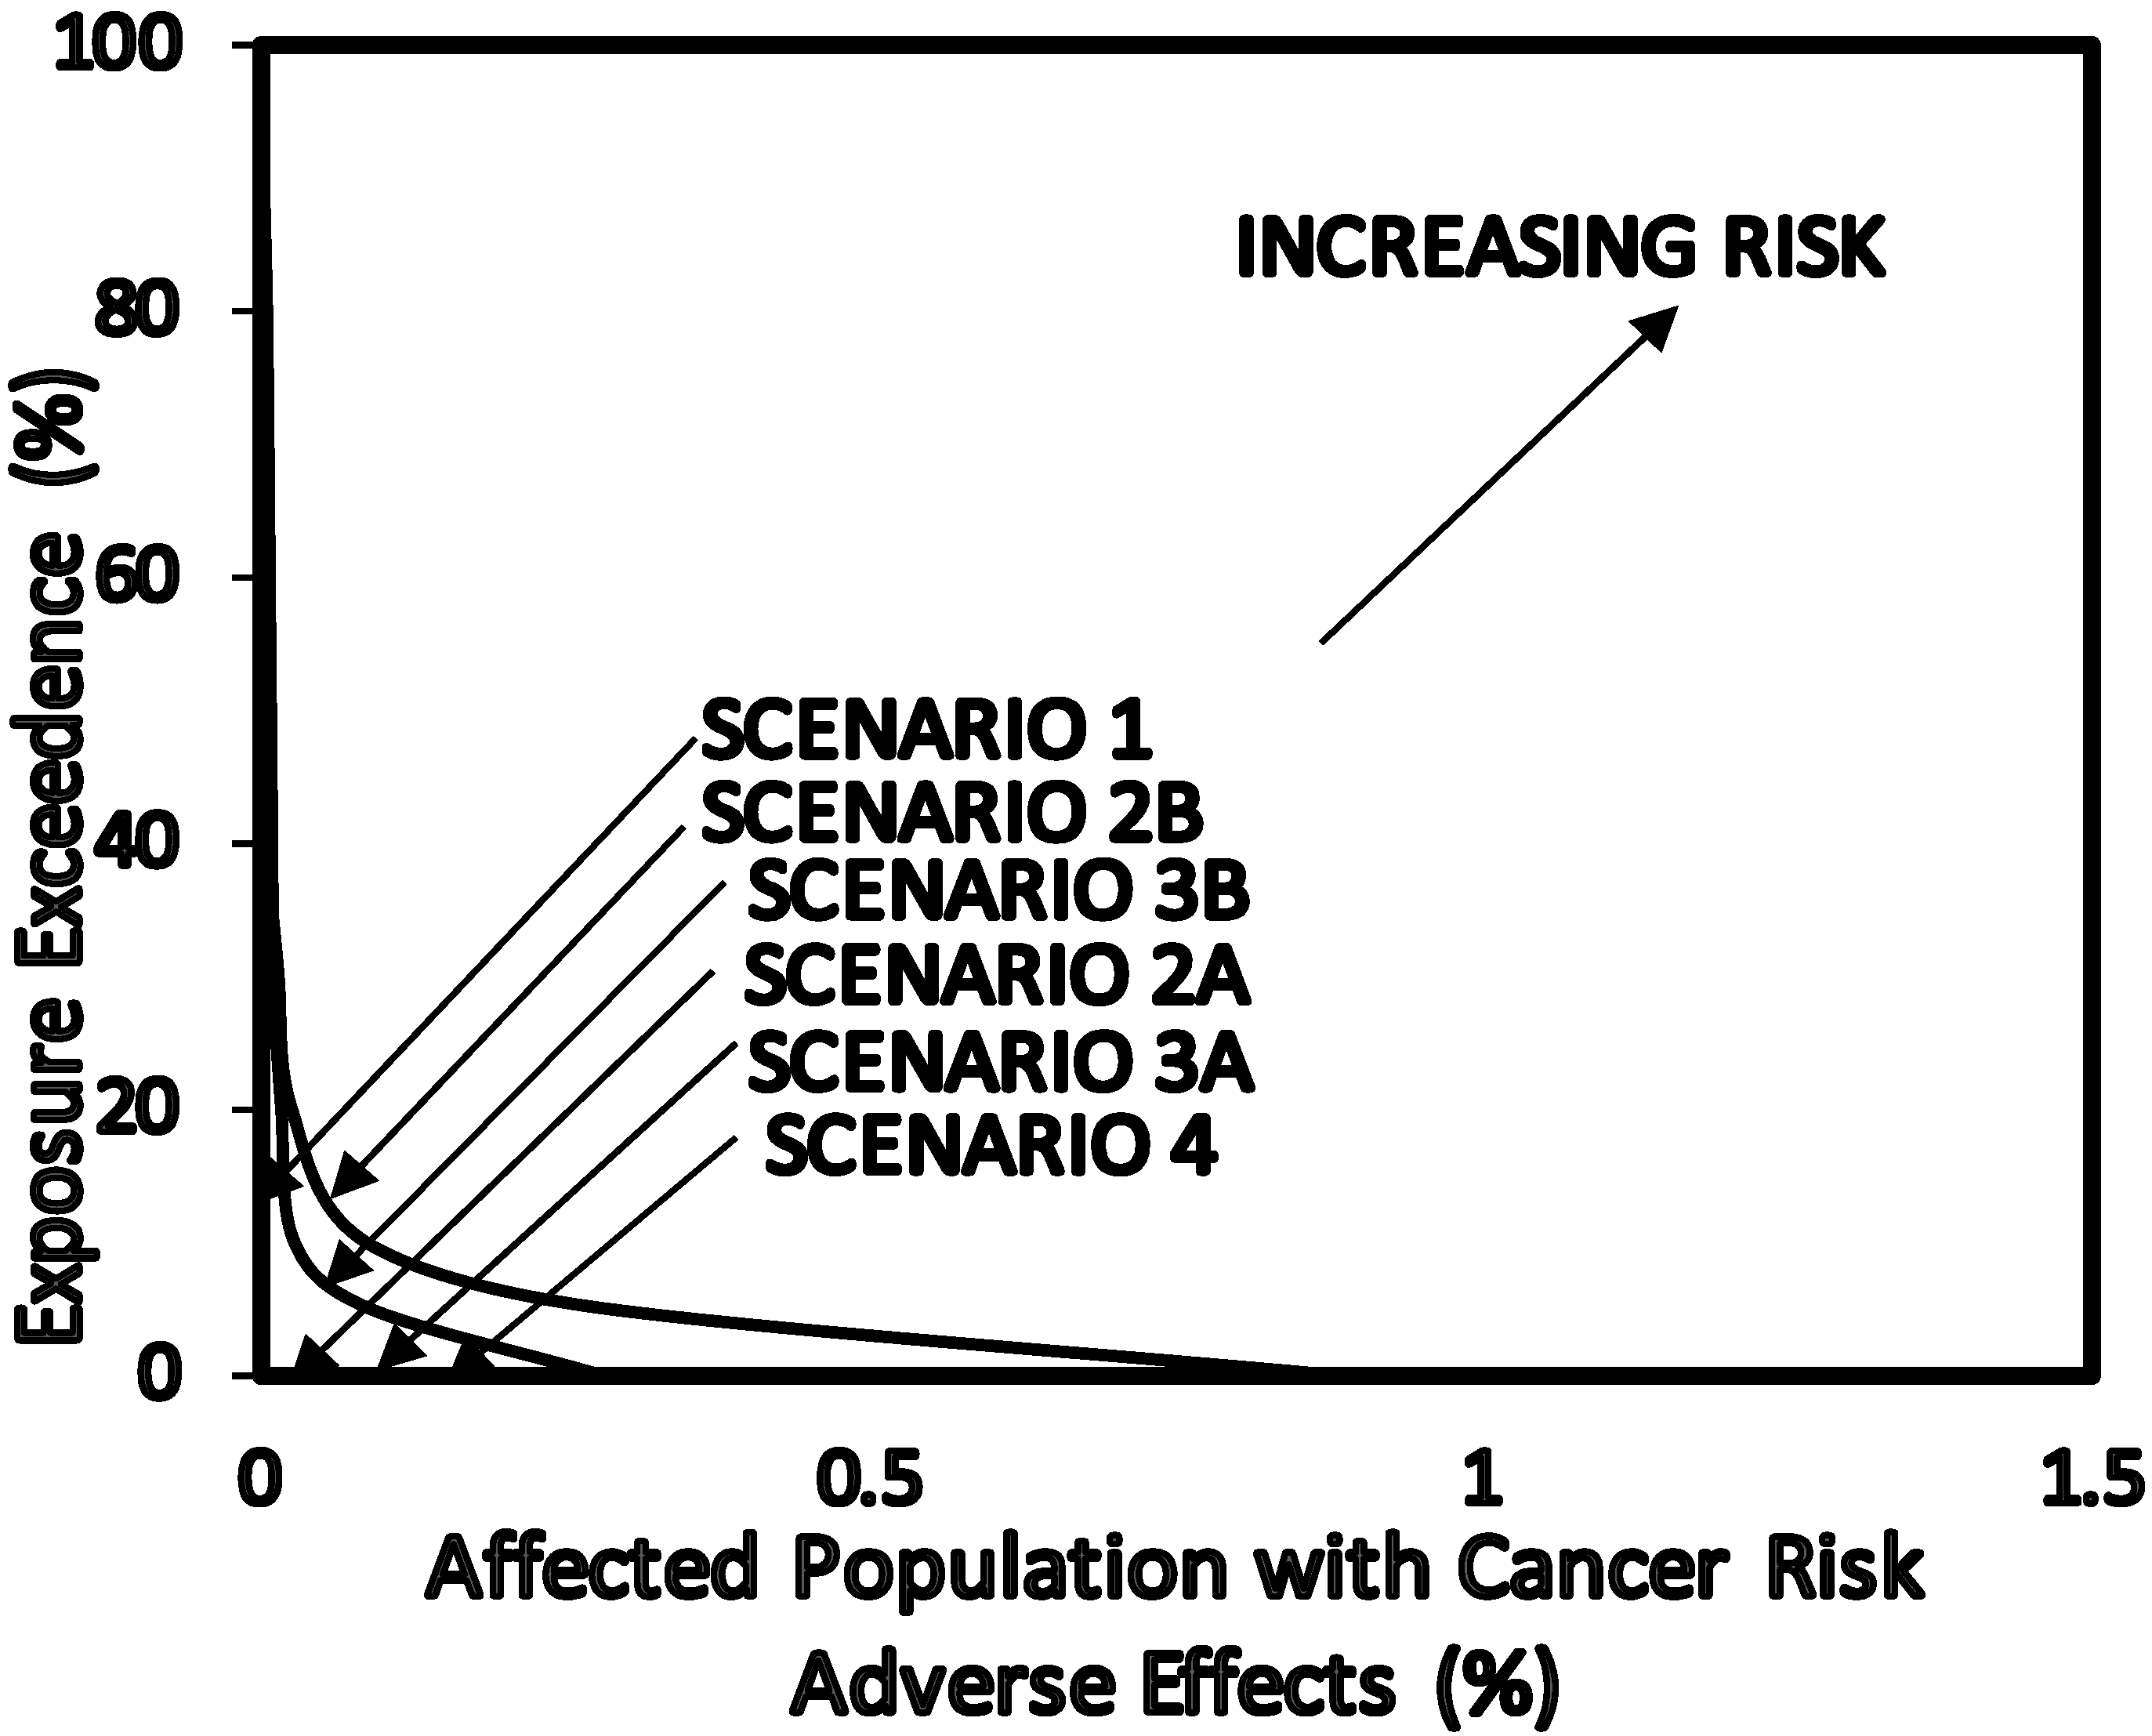
2.3.4. Evaluation Using Overall Risk Probability (ORP)

The ORP method is based on the use of Overall Risk Probability (ORP) curve. The ORP curve is the plot of exposure exceedence values (1—CP) against the corresponding CP values for dose-adverse effects (Figure 5).
Figure 5. CPD plots of exposure to benzene as Lifetime Average Daily Dose (LADD) for Scenario 1–4 and cancer risk adverse effects dose—Response relationship.
Ijerph 12 00595 g005
A detailed description of overall risk probability in risk assessment has been discussed in [16]. The CPD plots for benzene exposure were derived from the data sets for benzene concentrations that were converted to Life Time Average Daily Dose (LADD) and the calculated cancer risk adverse effect relationship obtained using Equation (4) (Figure 5).

3. Results and Discussion

3.1. Scenario 1—Exposure to Benzene as Base Estimates for Petroleum Refinery Workers

The CPD plot as shown in Figure 1 is for exposure to benzene concentrations for refinery workers in Australia, Canada and United Kingdom from 1902 to 1996. The linear equation has a slope of 54 and correlation coefficient (R2) of 0.97 indicating a normal distribution. At CEXP50, exposure to benzene was higher than NIOSH REL but lower than ACIGH TLV, OSHA PEL, EC LV and SWA OEL. However, at CEXP95 exposure to benzene was higher than NIOSH REL, ACIGH TLV, OSHA PEL, EC LV and SWA OEL. The workers in the highly exposed group reported by the high exposure concentrations in the CPD plots were workers involved in activities such as drum fillers, large terminal operator, gauging, line pigging, rail car loading, refueling, tanker loading and cleaning.

3.2. Scenario 2—Exposure to Benzene for Petroleum Refinery Workers

The CPD plots (Figure 2) are for exposure to benzene concentrations for petroleum refinery workers in Italy, 2011 (A) and Bulgaria, 1999 (B). The linear regression equations had correlation coefficients (R2) > 0.94 for both CPD plots indicating normal distributions. The CPD plots of Scenario 2A and 2B have almost identical slopes of 65 and 60, respectively. This implies that there was a comparatively wide range of benzene concentration distribution. At CEXP50 and CEXP95 exposure to benzene for Scenario 2A was lower than NIOSH REL, ACIGH TLV, OSHA PEL, EC LV and SWA OEL. While at CEXP50 and CEXP95 exposure to benzene in Scenario 2B was higher than NIOSH REL, ACIGH TLV, OSHA PEL, EC LV and SWA OEL. The high exposure to benzene was for workers in transport and storage of petroleum products facility, benzene manufacturing plant and ethylbenzene—styrene manufacturing plant.

3.3. Scenario 3—Benzene Concentrations in Air Inside the Petroleum Refineries

The CPD plots in Figure 3 is for benzene concentrations in the air for petroleum refinery in India (A), Taiwan (A) and Bulgaria (B). The linear regression equations had correlation coefficients (R2) > 0.94 for both CPD plots indicating high level of linearity in the distributions. The slope for Scenario 3C is 40 while Scenario 3A has a slope of 117, indicating a relatively wide range of benzene concentration distribution for both CPD plots. At CEXP50 and CEXP95 exposure to benzene for Scenario 3A was lower than NIOSH REL, ACIGH TLV, OSHA PEL, EC LV and SWA OEL. While at CEXP50 and CEXP95 exposure to benzene in Scenario 3B was higher than NIOSH REL, ACIGH TLV, OSHA PEL, EC LV and SWA OEL. The high exposure to benzene was for workers in transport and storage of petroleum products facility, benzene manufacturing plant and ethylbenzene—styrene manufacturing plant.

3.4. Scenario 4—Benzene Concentrations in Air Outside the Petroleum Refineries

The concentrations of benzene in the air measured outside the petroleum refineries in India, Italy and Taiwan were plotted as CPD plots (Figure 4). The linear regression equations had a correlation coefficient (R2) > 0.96 indicating a high level of linearity in the distribution and a normal distribution. The slope for CPD plot (Figure 4) was 42 indicating a relatively wide range of benzene concentrations. The exposure to benzene outside the refineries was compared to the Air Quality Guidelines (AQG) presented in Table 2. At CEXP50 benzene concentration levels were higher than AQG for European Commission but lower than AQG for United Kingdom and at CEXP95 indicated that exposures to benzene were higher than AQG for European Commission but lower than AQG for United Kingdom (Figure 4).

3.5. Risk Characterization

3.5.1. Hazard Quotient (HQ)

The calculated LADD at CEXP50 and CEXP95 for exposure to benzene was used in estimating the HQ (Equation (3)) and the results were summarized in Table 4. HQ50 were < 1 for petroleum refinery workers (Scenario 2A), benzene concentrations in air inside the petroleum refineries (Scenario 3A), and benzene concentrations in air outside the petroleum refineries (Scenario 4). This result suggests minimal risk to the majority of the population in these exposure Scenarios (2A, 3A and 4). Also, HQ95 was <1 for Scenario 4 suggesting minimal risk to the high exposed group. However, HQ95 were >1 for Scenarios 2A and 3A indicating possible risk to adverse effects. HQ50 and HQ95 for lifetime exposure to benzene for Scenario 1 (base estimates for petroleum refinery workers), 2B (exposure to benzene for petroleum refinery workers) and 3B (benzene concentrations in air inside the petroleum refineries) were >1 indicating possible adverse health effects for the main group of exposed individuals and the high exposed.

3.5.2. Cancer Risk Calculated

The excess CR was calculated for exposure to benzene at the median level (CEXP50) which represents the main group of exposed individuals and the 95% level (CEXP95) representing the highest exposed group in the population (Scenarios 1 to 4) and the results were presented in Table 4. The results suggest different levels of cancer risk for chronic exposure to benzene for the main group and highest exposed group in the various Scenarios. At CEXP50, the excess cancer risk in terms of lifetime exposure to benzene for Scenario 2A (petroleum refinery workers), 3A (benzene concentrations in air inside the petroleum refineries) and 4 (benzene concentrations in air outside the petroleum refineries) are very low in the range of 6 to 18 per 106 as compared to Scenario 1 (base estimates for petroleum refinery workers), 2B (petroleum refinery workers) and 3B (benzene concentrations in air inside the petroleum refineries) that is in the range of 590 to 10,000 per 106. On the other hand, at CEXP95, the highly exposed group that occurs at a level of 5% in the population, the excess cancer risk in terms of lifetime exposure to benzene for Scenario 2A (petroleum refinery workers), 3A (benzene concentrations in air inside the petroleum refineries) and 4 (benzene concentrations in air outside the petroleum refineries) are very low in the range of 200 to 460 per 106 as compared to Scenario 1 (base estimates for petroleum refinery workers), 2B (petroleum refinery workers) and 3B (benzene concentrations in air inside the petroleum refineries) that is in the range of 10,000 to 48,000 per 106. The cancer risk estimated at CEXP95 is only for 5% of the exposed population. The significance difference in the cancer risk estimated is as a result of higher concentration levels of benzene observed in 2B (petroleum refinery workers) and 3B (benzene concentrations in air inside the petroleum refineries) that was 17 to 1400 and 4.6 to 230 times higher than Scenarios 1 to 4 at (CEXP50) and (CEXP95) respectively.

3.5.3. Overall Risk Probability (ORP)

Cancer risk adverse dose—response relationship are shown in Figure 5. The ORP plots are shown in Figure 6.The area under the ORP curves were calculated to obtain values of Overall Risk Probability (Table 4). ORP of 0.17% (1700 per 106) was obtained for Scenario 1 (base estimates for petroleum refinery workers), 0.011% (110 per 106) for Scenario 2A (petroleum refinery workers), 4.8% (48,000 per 106) for Scenario 2B (exposure to benzene for petroleum refinery workers), 0.015% (150 per 106) for Scenario 3A (benzene concentrations in air inside the petroleum refineries), 1.7% (17,000 per 106) for Scenario 3B (benzene concentrations in air inside the petroleum refineries) and 0.009% (110 per 106) for Scenario 4 (benzene concentrations in air outside the petroleum refineries).
Overall the ORP and the CR are in reasonable agreement (Table 4). The difference between the ORP method and CR method is that the CR were calculated for the highly exposed group (CEXP95) and the main group of individuals (CEXP50) in the population, while with ORP all of the exposed population were taken into consideration as shown in Table 4.
Figure 6. Overall risk probability (ORP) for cancer risk as a result of exposure to benzene concentrations in petroleum refinery environments.
Ijerph 12 00595 g006
Table 4. Health risk characterization for exposure to benzene.
ScenarioCEXP50LADD50 (µg/kg/Day)CEXP95LADD95 (µg/kg/Day)HQ at LADD50HQ at LADD95CR per 106 at LADD50CR per 106 at LADD95CR per 106 Estimated by ORP
Scenario 1 (Base Estimate)9802217,0003802.54459010,0001700
Scenario 2A (Refinery workers)751.7690160.201.945420110
Scenario 2B (Refinery workers)17,00037079,00018004321010,00048,00044,000
Scenario 3A (Inside Refinery)220.6480140.0681.818460150
Scenario 3B (Inside Refinery)11,00034028,000100039120920028,00017,000
Scenario 4 (Outside refinery)120.213507.30.0240.856.0200110

4. Conclusions

Benzene levels were estimated to pose a significant risk with HQ50 > 1 and HQ95 > 1 for workers exposed to benzene as base estimates for petroleum refinery workers (Scenario 1), petroleum refinery workers evaluated with personal samplers in Bulgarian refineries (2B) and evaluated using air concentrations inside petroleum refineries in Bulgarian refineries (3B). On the other hand HQ50 were <1 for lifetime exposure to benzene in petroleum refinery workers (Scenario 2A), benzene concentrations in air inside the petroleum refineries (Scenario 3A), and benzene concentrations in air outside the petroleum refineries (Scenario 4) suggesting minimal risk to the majority of the population in these exposure Scenarios. HQ95 was <1 for Scenario 4 suggesting minimal risk to the high exposed group however, HQ95 were >1 for Scenarios 2A and 3A indicating possible risk to human health for the high exposed group. The excess cancer risk for lifetime exposure to benzene for all the Scenarios was evaluated using the Slope Factor method at CEXP50 and CEXP95 and also using the ORP method. The two methods showed a reasonable level of agreement. With the ORP method, workers in petroleum refineries in Scenario 2B were observed to have the highest cancer risk 44,000 per 106 followed by those evaluated with data from air inside the petroleum refineries in Scenario 3B with cancer risk of 17,000 per 106 and base estimates for petroleum refinery workers Scenario 1 with cancer risk of 1700 per 106.

Acknowledgments

This work was supported by Griffith University Postgraduate Scholarship Award (scholarship for doctoral study) and Delta State Government Nigeria.

Author Contributions

This work was carried out while Benjamin Edokpolo was a Ph.D. candidate at Griffith University with Qiming Jimmy Yu and Des Connell as his supervisors. The supervisors provided general and specific guidance on the conduct of the research as well as the preparation of the paper for publication.

Conflicts of Interest

The authors declare no conflict of interest.

References

  1. Rao, P.S.; Ansari, M.F.; Gavane, A.G.; Pandit, V.I.; Nema, P.; Devotta, S. Seasonal variation of toxic benzene emissions in petroleum refinery. Environ. Monit. Assess. 2007, 128, 323–328. [Google Scholar] [CrossRef] [PubMed]
  2. Mirkova, E.; Lalchev, S.; Alexandrova, E.; Antov, G.; Panev, T.; Tchohadjieva, D.; Gavrilova, N. Cytogenetic effects in lymphocytes of Bulgarian petroleum refinery workers chronically exposed to benzene: Comparisons of the cytokinesis—Block micronucleus assay and metaphase chromosome analysis. Eur. J. Gen Mol. Toxicol. 1999, 1999, 1–25. [Google Scholar]
  3. World Health Organization. Guidelines for Indoor Air Quality: Selected Pollutants; World Health Organization Regional Office for Europe: Copenhagen, Denmark, 2010. [Google Scholar]
  4. Agents Classified by the IARC Monographs, Volumes 1–111. Available online: http://monographs.iarc.fr/ENG/Classification/ClassificationsAlphaOrder.pdf (accessed on 8 January 2015).
  5. Rinsky, R.A.; Smith, A.B.; Hornung, R. Benzene and leukemia: An epidemiological risk assessment. N. Eng. J. Med. 1987, 316, 1044–1050. [Google Scholar] [CrossRef]
  6. Nordlinder, R.; Ramnnas, O. Exposure to benzene at different workplaces in Sweden. Ann. Occup. Hyg. 1987, 31, 345–355. [Google Scholar] [PubMed]
  7. World Health Organization (WHO). Air Quality Guidelines for EuropeWHO Regional Publications, European Series, No. 91; 2nd ed.; WHO Regional Office for Europe: Copenhagen, Denmark, 2000. [Google Scholar]
  8. Agency for Toxic Substances and Disease Registry. Toxicological Profile for Benzene; US Department of Health and Human Services: Atlanta, GA, USA, 2007. [Google Scholar]
  9. Capleton, A.C.; Levy, L.S. An overview of occupational benzene exposures and occupational exposure limits in Europe and North America. Chem. Biol. Interact. 2005, 153, 43–53. [Google Scholar] [CrossRef] [PubMed]
  10. Lin, T.Y.; Sree, U.; Tseng, S.H.; Chiu, K.H.; Wu, C.H.; Lo, J.G. Volatile organic compound in ambient air of Kaohsiung petroleum refinery in Taiwan. Atmos. Environ. 2004, 38, 4111–4122. [Google Scholar] [CrossRef]
  11. Basso, E.; Cevoli, C.; Papacchini, M.; Tranfo, G.; Mansi, A.; Testa, A. Cytogenetic biomonitoring on a group of petroleum refinery workers. Environ. Mol. Mutagen. 2011, 52, 440–447. [Google Scholar]
  12. Edokpolo, B.; Qiming, J.Y.; Connell, D. Health risk assessment of ambient air concentrations of benzene, toluene and xylene (btx) in service station environments. Int. J. Environ. Res. Public Health 2014, 11, 6354–6374. [Google Scholar] [CrossRef] [PubMed]
  13. Connell, D.W.; Fung, C.N.; Minh, T.B.; Tanabe, S.; Lama, P.K.S.; Wong, B.S.F.; Lama, M.H.W.; Wong, L.C.; Wu, R.S.S.; Richardson, B.J. Risk to breeding success of fish-eating Ardeids due to persistent organic contaminants in Hong Kong: Evidence from organochlorine compounds in eggs. Water Res. 2003, 37, 459–467. [Google Scholar] [CrossRef] [PubMed]
  14. Djohan, D.; YU, J.; Connell, D.; Christensen, E. Health risk assessment of chlorobenzenes in the air of residential houses using probabilistic techniques. J. Toxicol. Environ. Health 2007, 70, 1594–1603. [Google Scholar] [CrossRef]
  15. Hamidin, N.; Yu, Q.J.; Connell, D.W. Human health risk assessment of chlorinated disinfection by-products in drinking water using a probabilistic approach. Water Resour. 2008, 42, 3263–3274. [Google Scholar]
  16. Cao, Q.; Yu, Q.; Connell, D. Health risk characterisation for environmental pollutants with a new concept of overall risk probability. J. Hazard. Mater. 2011, 187, 480–488. [Google Scholar] [CrossRef] [PubMed]
  17. Yu, Q.J.; Cao, Q.; Connell, D. An overall risk probability-based method for quantification of synergistic and antagonistic effects in health risk assessment for mixtures: Theoretical concepts. Environ. Sci. Pollut. Res. 2012, 19, 2627–2633. [Google Scholar] [CrossRef]
  18. Phung, D.T.; Connell, D.; Miller, G.; Chu, C. Probabilistic assessment of chlorpyrifos exposure to rice farmers in Vietnam. J. Expo. Sci. Environ. Epidemiol. 2012, 22, 417–423. [Google Scholar] [CrossRef] [PubMed]
  19. Glass, D.C.; Adams, D.D.; Manuell, R.W.; Bisby, J.A. Retrospective exposure assessment for benzene in the Australian petroleum industry. Ann. Occup. Hyg. 2000, 44, 301–320. [Google Scholar] [CrossRef]
  20. Glass, D.C.; Armstrong, T.W.; Pearlman, E.D.; Verma, D.K.; Schnatter, A.R.; Rushton, L. Ensuring comparability of benzene exposure estimates across three nested case-control studies in the petroleum industry in support of a pooled epidemiological analysis. Chemo-Biol. Interact. 2010, 184, 101–111. [Google Scholar] [CrossRef]
  21. Lewis, S.J.; Bell, G.M.; Cordingley, N.; Pearlman, E.D.; Rushton, L. Retrospective estimation of exposure to benzene in a leukaemia case-control study of petroleum marketing and distribution workers in the United Kingdom. Occup. Environ. Med. 1997, 54, 167–175. [Google Scholar] [CrossRef] [PubMed]
  22. Gariazzo, C.; Pelliccioni, A.; Sallusti, F.; Cecinato, A. Monitoring and analysis of volatile organic compounds around an oil refinery. Water Air Soil Pollut. 2005, 167, 17–38. [Google Scholar]
  23. Chemical-Specific Reference Values for Benzene (CASRN 71-43-2). Available online: http://nepis.epa.gov/Exe/ZyPDF.cgi/P100KJIX.PDF?Dockey=P100KJIX.PDF (accessed on 8 January 2015).
  24. NIOSH Pocket Guide to Chemical Hazards. Available online: http://www.cdc.gov/niosh/npg/npgd0049.html (accessed on 8 January 2015).
  25. Safe Work Australia Workplace Exposure Standards for Airborne Contaminants. Available online: http://www.safeworkaustralia.gov.au/sites/SWA/about/Publications/Documents/639/Workplace_Exposure_Standards_for_Airborne_Contaminants.pdf (accessed on 8 January 2015).
  26. European Union. Directive 2000/69/EC of the European parliament and of the council of 16 November 2000 relating to limit values for benzene and carbon monoxide in ambient air. Off. J. 2000, 313, 12–21. [Google Scholar]
  27. Expert Panel on Air Quality Standards. Benzene, Department of the Environment Expert Panel on Air Quality Standards; HMSO: London, UK, 1994. [Google Scholar]
  28. Badjagbo, K.; Loranger, S.; Moore, S.; Tardif, R.; Sauvé, S. BTEX exposures among automobile mechanics and painters and their associated health risks. Hum. Ecol. Risk assess. Int. J. 2010, 16, 301–316. [Google Scholar]
  29. United State Environmental Protection Agency. Risk Assessment Guidance for Superfund: Human Health Evaluation Manual Supplemental Guidance “Standard Default Exposure Factors”; OSWER Directive: Washington, DC, USA, 1991; Volume 1, pp. 1–16.
  30. The Risk Assessment Information System. Toxicity and Physical Properties of Chemicals. Available online: http://rais.ornl.gov/cgi-bin/tools/TOX_search?select=chem (accessed on 8 January 2015).

