
Applying an Ecohealth Perspective in a State of the Environment Report: Experiences of a Local Public Health Unit in Canada

Abstract
:1. Introduction
2. Methods
2.1. Define the Purpose, Target Groups, and Scope
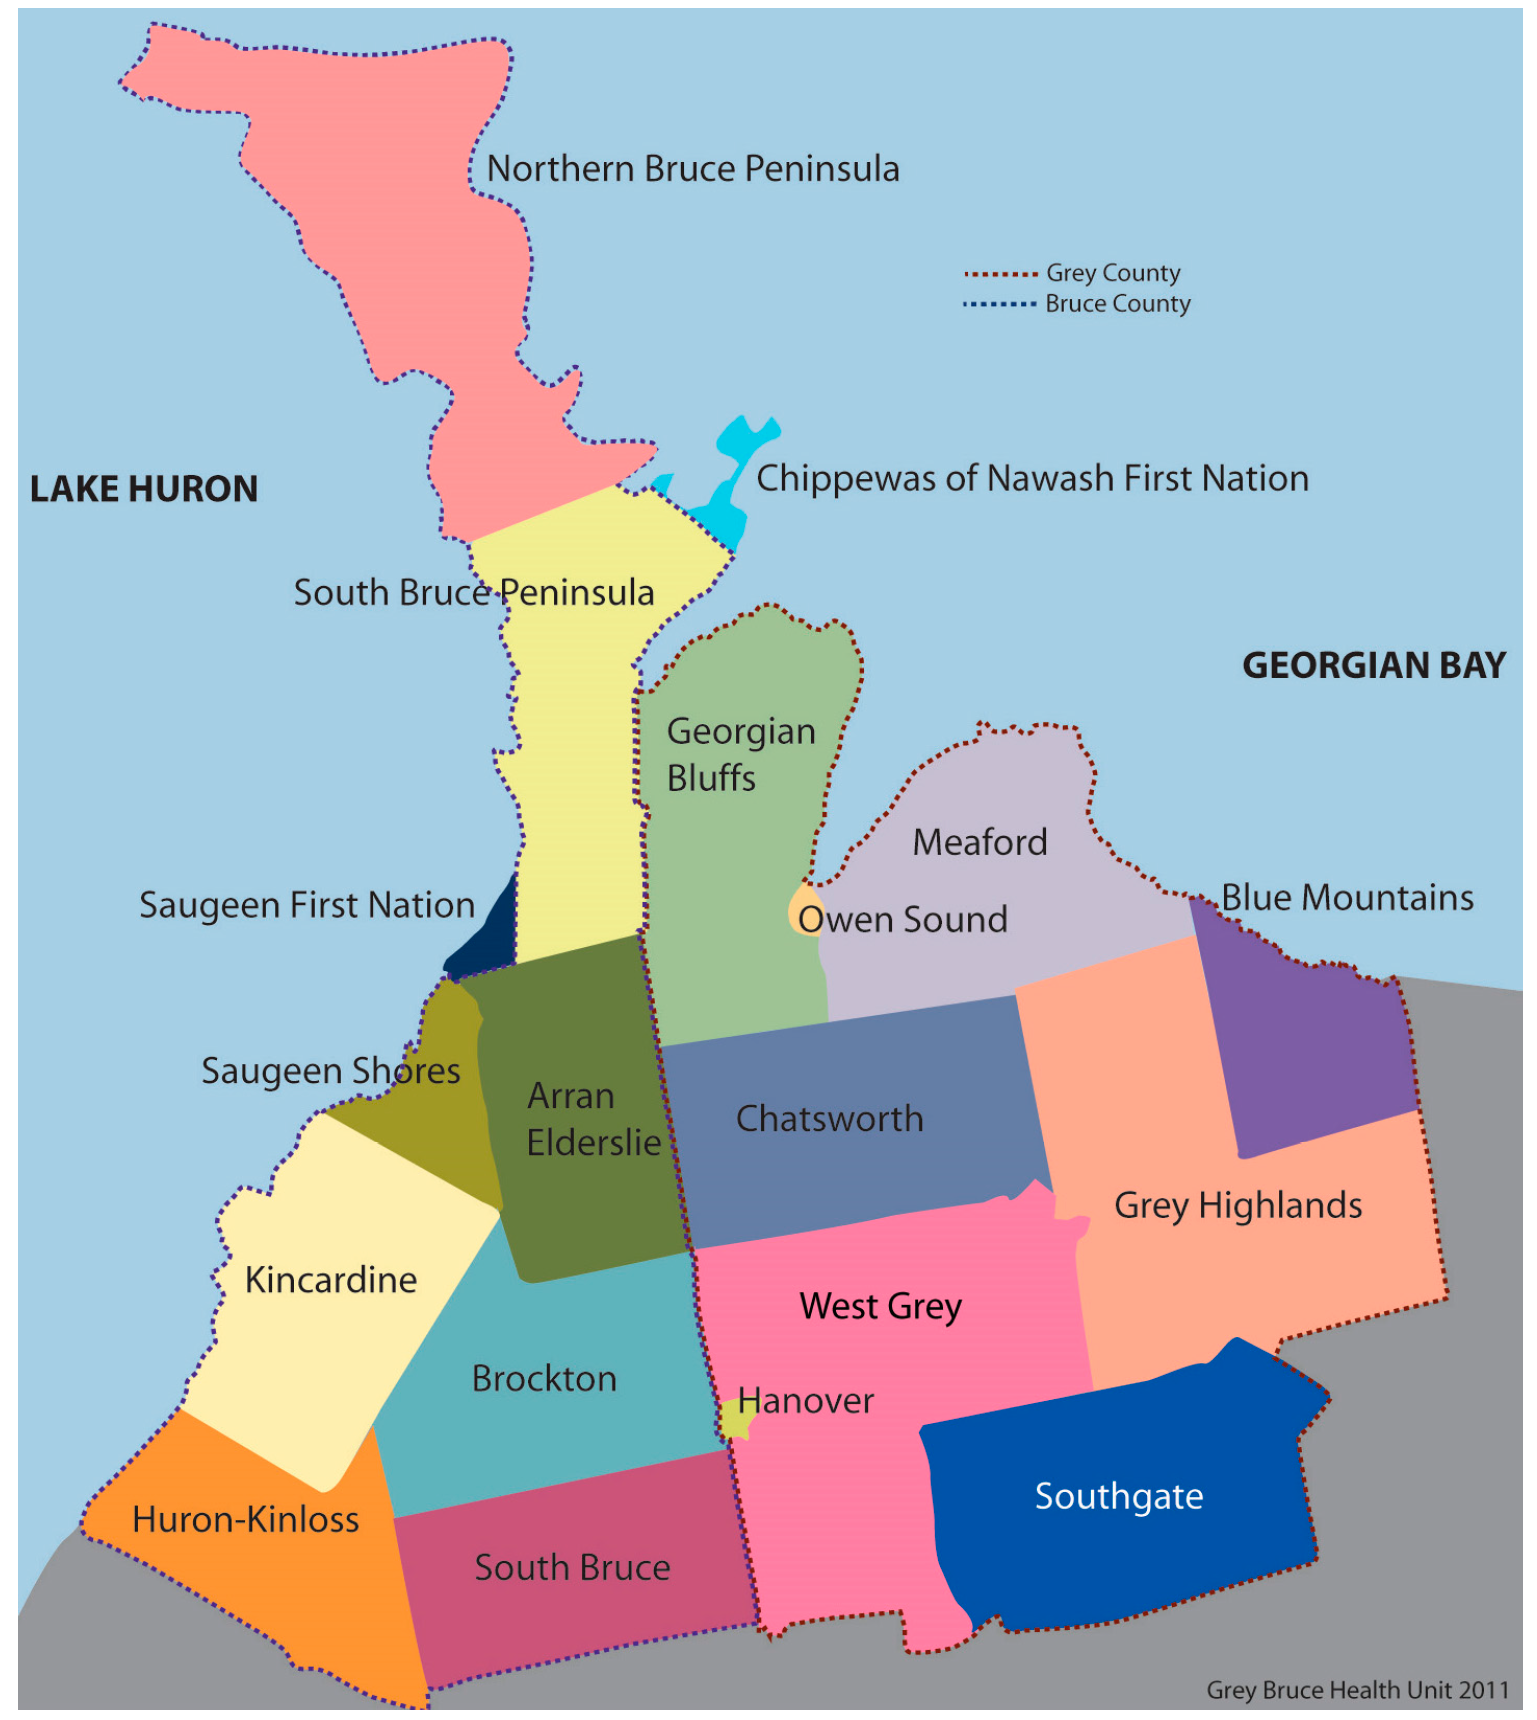
2.2. Geographic Location
2.3. Team
2.4. Choosing a Framework

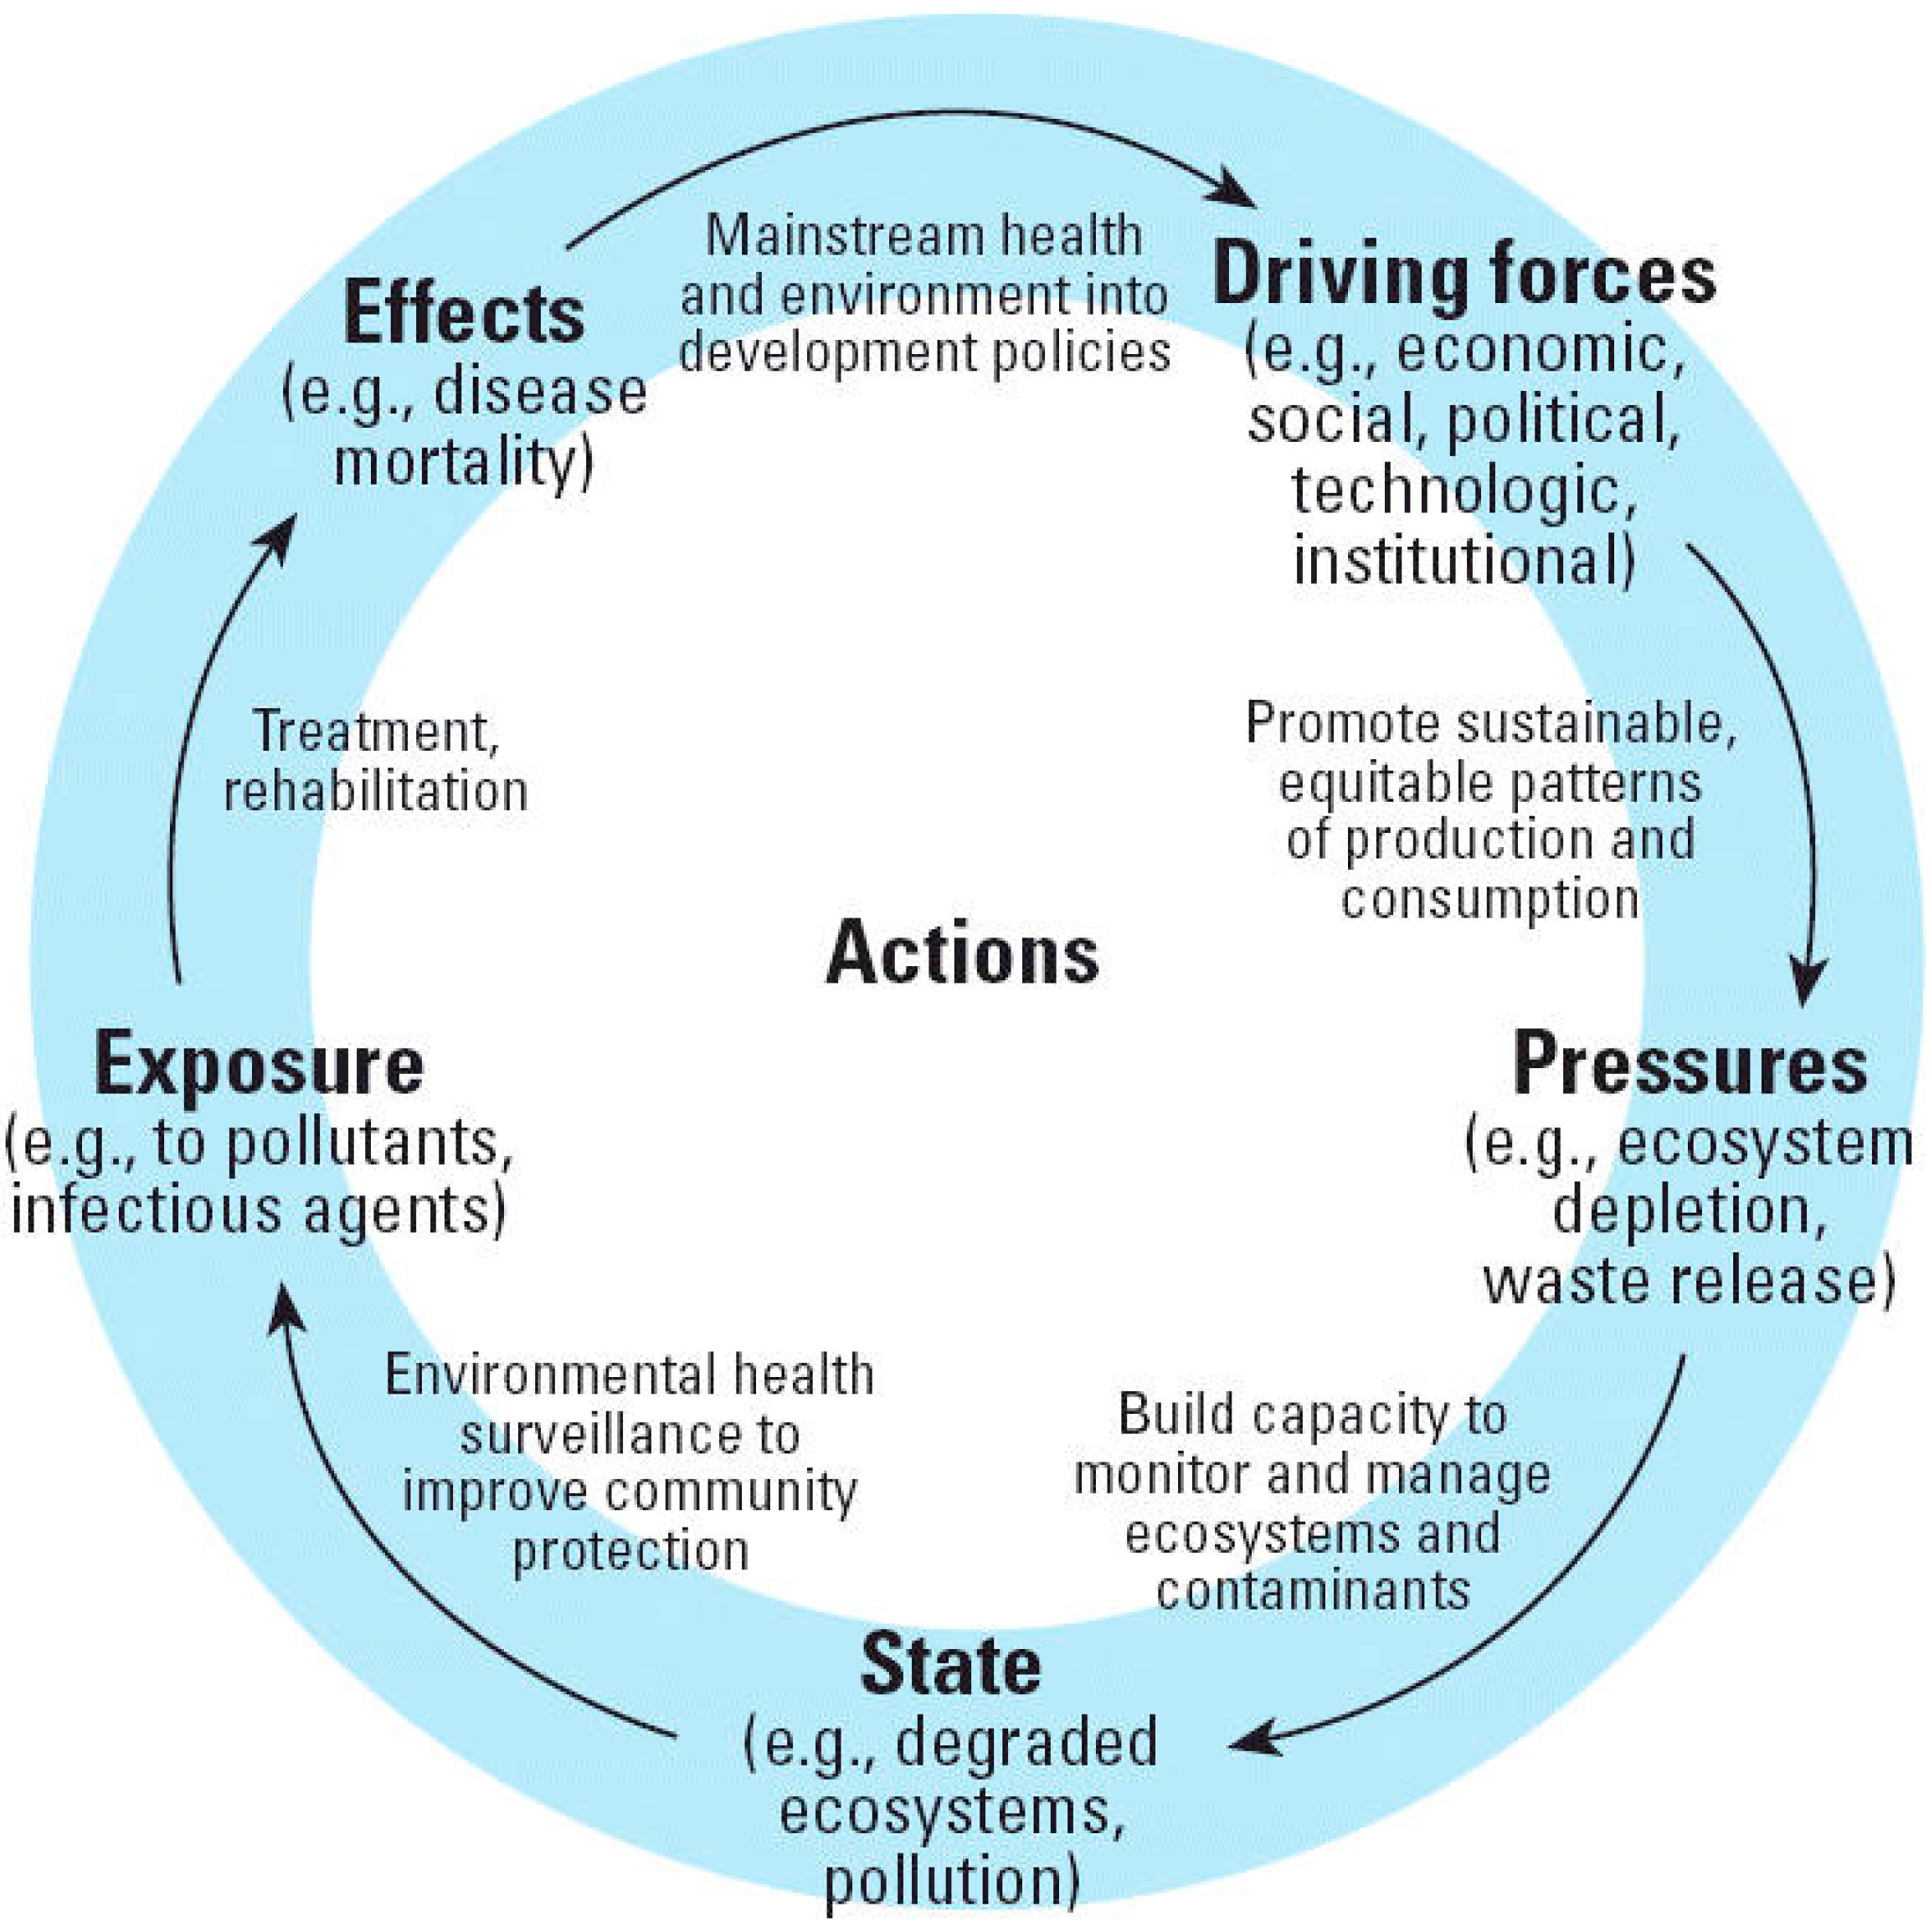
2.5. Use of the DPSEEA Framework
2.6. Indicators and Data Collection
3. Results
3.1. Indicators

| Data Collected | Indicator | Summary of Indicator Findings | Data Source(s) |
|---|---|---|---|
| Land | |||
| Energy | Energy consumption and greenhouse gas emission levels | Baseline energy consumption and greenhouse gas emissions were recently established for 2011 | Ontario Ministry of Energy Energy use and greenhouse gas emissions report |
| Waste |
|
| Waste Diversion Ontario Residential Generally Accepted Principles Diversion Rates |
| Agriculture |
|
| Statistics Canada Census of Agriculture |
| Soil |
|
| Statistics Canada Census of Agriculture |
| Air | |||
| Climate Change |
|
| Ministry of the Environment and Climate Change weather stations Public Health Ontario Health profile supplementary data tables |
| Air | |||
| Air quality |
|
| -Ministry of the Environment and Climate Change weather station, smog advisory statistics |
| Water | |||
| Drinking water quality |
|
| GBHU † adverse reports dataset, Laboratory Results Management Application database Public Health Ontario Laboratories Water Testing Information System Electronic Notification |
| Surface water quality | Benthic invertebrates, total phosphorus and E. coli levels | 23 out of 34 watersheds (68%) in Grey-Bruce were rated as “excellent” or “good” surface water quality in 2013 | Grey Sauble Watershed Report Card 2013 and Saugeen Valley Watershed Report Card 2013 |
| Ground water quality | Nitrite, nitrate and chloride levels | All wells (17) in the Saugeen Valley conservation area were rated as “excellent” ground water quality in 2013 | Saugeen Valley Watershed Report Card 2013 |
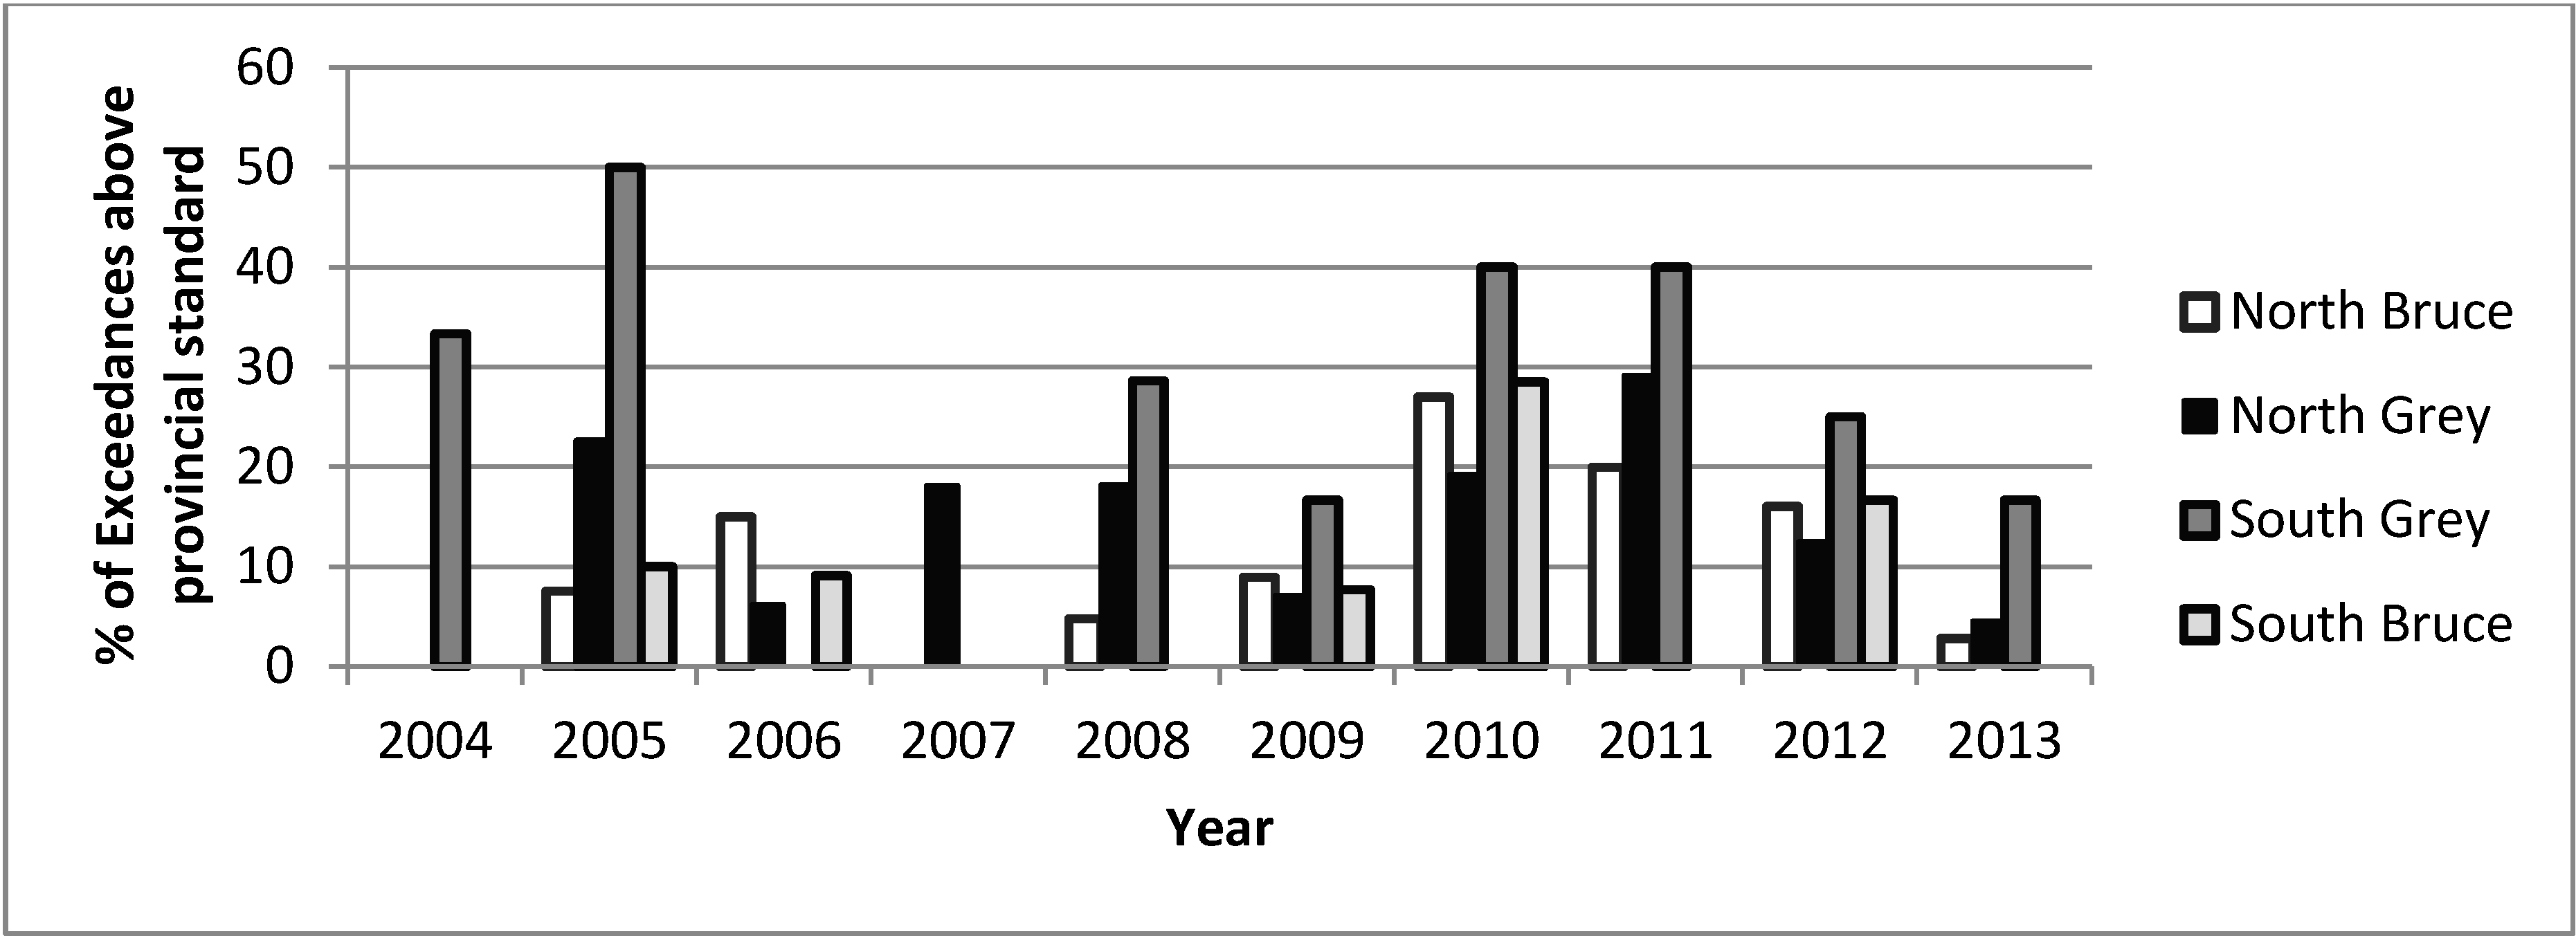
| Beach water quality | # of exceedances in provincial beach water quality standards | # of exceedances in provincial beach water quality standards ‡ appeared to be low from 2004–2013 | GBHU †, beach management reports |
| Water quantity | Water levels of Lake Huron-Michigan | Water levels of Lakes Huron-Michigan appeared * to be decreasing over time | National Oceanic and Atmospheric Administration |

| Data Collected | Indicator | Summary of Ecological Indicator Findings | Data Source(s) |
|---|---|---|---|
| Vectors |
|
| GBHU † vector-borne disease annual reports |
| Biodiversity | -# of species at risk | -66 species were identified as “species at risk” Grey-Bruce | Ministry of Natural Resources and Forestry Species at risk |
| Fish | -Data not available | -Data not available | -Data not available |
| Forests |
| 26 out of 34 watersheds (76%) in Grey-Bruce were rated as “excellent” or “good” forest condition in 2013 | Grey Sauble Watershed Report Card 2013 and Saugeen Valley Watershed Report Card 2013 |
| Wetlands | % wetland cover | 7 out of 10 watersheds (70%) in the Saugeen Valley conservation area were rated as “excellent” wetland condition in 2013 | Saugeen Valley Watershed Report Card 2013 |
3.2. DPSEEA Framework
| Vectors | Forests | Wetlands | |
|---|---|---|---|
| Driving forces | Climate change, population growth, economic growth | ||
| Pressures | Warming temperatures, agricultural expansion, developmental expansion | ||
|
|
| |
| State | # of ticks submitted for testing has increased from 2010 to 2013, # of ticks identified as Ixodes scapularis was low, and no ticks have tested positive for Borrelia burgdoferi | Forest conditions for the majority of watersheds in Grey-Bruce were rated as “excellent” or “good” condition according to % forest cover, % forest interior, and % riparian cover in 2013 | Wetland conditions for the majority of watersheds in the Saugeen Valley conservation area were rated as “excellent condition” according to % wetland cover in 2013 |
| Exposure | Bite of a tick (for Lyme disease) or mosquito (for WNV † and or EEEV † | N/A | N/A |
| Effect |
| N/A | N/A |
| Action |
|
|
|
4. Discussion
5. Conclusions
Acknowledgments
Author Contributions
Conflicts of Interest
References
- Eyles, J.; Furgal, C.M. Indicators in environmental health: Identify and selecting common sets. Can. J. Public Health 2002, 93, S62–S67. [Google Scholar]
- Heo, S.; Lee, J.T. Study of environmental health problems in Korea using integrated environmental health indicators. Int. J. Environ. Res. Public Health 2013, 10, 3140–4156. [Google Scholar] [CrossRef] [PubMed]
- Gosselin, P.; Furgal, C.M. Challenges and directions for environmental public health indicators and surveillance. Can. J. Public Health. 2002, 3, S5–S8. [Google Scholar]
- Eyles, J. Health, environmental assessments and population health: Tools for a complex process. Can. J. Public Health 1999, 90, S31–S34. [Google Scholar] [PubMed]
- Jorgensen, S.E.; Costanza, R.; Xu, F.L. Handbook of Ecological Indicators for Assessment of Ecosystem Health; CRC Press, Taylor & Francis Group: New York, NY, USA, 2005. [Google Scholar]
- Rump, P.C. State of the Environment Reporting: Source Book of Methods and Approaches; Division of Environment Information and Assessment, United Nations Environment Programme: Nairobi, Kenya, 1996. [Google Scholar]
- Sheehy, G. Organizational and Spatial Frameworks for State of the Environment Reporting; Environment Canada: Ottawa, ON, Canada, 1989. [Google Scholar]
- OECD. The State of the Environment; Organization for Economic Cooperation and Development: Paris, France, 1985. [Google Scholar]
- OECD. The State of the Environment; Organization for Economic Cooperation and Development: Paris, France, 1991. [Google Scholar]
- The Worldwatch Institute. State of the World 2014: Governing for Sustainability; Island Press: Washington, DC, USA, 2014. [Google Scholar]
- Bird, P.M.; Rapport, D.J. State of the Environment Report for Canada; Canadian Government Publishing Centre: Ottawa, ON, Canada, 1986. [Google Scholar]
- Environment Canada. The State of Canada’s Environment; Environment Canada: Ottawa, ON, Canada, 1991. [Google Scholar]
- CCME. State of the Environment Reporting Guidelines for CCME Member Jurisdictions; Canadian Council of Ministers of the Environment: Winnipeg, Man, Canada, 1995. [Google Scholar]
- Campbell, M.E.; Maclaren, V.W. An overview of municipal state of the environment reporting in Canada. Can. J. Public Health 1995, 86, 408–413. [Google Scholar] [PubMed]
- Town of Oakville. State of the Environment Report 2012. Available online: http://www.oakville.ca/assets/general%20-%20environment/SOER2012.pdf (accessed on 12 October 2014).
- City of Windsor. City of Windsor’s ROSE: Report on the State of our Environment. Available online: http://www.citywindsor.ca/residents/environment/Environmental-Master-Plan/Documents/FINAL%20Rose_2013.pdf (accessed on 12 October 2014).
- CPHA. Human and Ecosystem Health. In Canadian Perspectives, Canadian Action; Canadian Public Health Association: Ottawa, ON, Canada, 1992. [Google Scholar]
- Hancock, T. Health, human development and the community ecosystem: Three ecological models. Health Promot. Int. 1993, 8, 41–47. [Google Scholar] [CrossRef]
- Webb, J.C.; Mergler, D.; Parks, M.W.; Saint-Charles, J.; Spiegel, J.; Waltner-Toews, D.; Yassi, A.; Woollard, R.F. Tools for thoughtful action: The role of ecosystem approaches to health in enhancing public health. Can. J. Public Health 2010, 101, 439–441. [Google Scholar] [PubMed]
- Blockstein, D.E.; McManus, K.M. Integrating Environment and Human Health: A report of the Seventh National Conference on Science, Policy and the Environment; National Council for Science and the Environment: Washington, DC, USA, 2007. [Google Scholar]
- Coutts, C.; Forkink, A.; Weiner, J. The portrayal of natural environment in the evolution of the ecological public health paradigm. Int. J. Environ. Res. Public Health 2014, 11, 1005–1019. [Google Scholar] [CrossRef] [PubMed]
- Harrison, G. Renfrew County State of the Environment Report 2004. Available online: http://rc-stewardshipcouncil.ca/pdfs/state%20of%20the%20environment.pdf (accessed on 12 October 2014).
- York Region Health Services Department. Focus on Our Environment: York Region’s State of the Environment Report; The Regional Municipality of York: Newmarket, ON, Canada, 2005. [Google Scholar]
- Lam, S.; Leffley, A.; Hart, B.; Cole, D.C. Grey-Bruce’s State of the Environment Report 2014; Grey Bruce Health Unit: Owen Sound, ON, Canada. Available online: http://www.publichealthgreybruce.on.ca/HOME/Publications/Reports/General/Grey-Bruce’s%20SOER%20Nov2014final.pdf (accessed on 27 September 2014).
- Grey Bruce Health Unit. About Us. Available online: http://www.publichealthgreybruce.on.ca/HOME/Misc/AboutUs.htm (accessed on 27 September 2014).
- Statistics Canada. Census of Population, Population and Dwelling Counts, for Canada, Provinces and Territories. Available online: http://www12.statcan.gc.ca/census-recensement/2011/dp-pd/hlt-fst/pd-pl/Table-Tableau.cfm?LANG=Eng&T=101&S=50&O=A (accessed on 12 October 2014).
- Waheed, B.; Khan, F.; Veitch, B. Linkage-based frameworks for sustainability assessment: Making a case for Driving Force-Pressure-State-Exposure-Effect-Action (DPSEEA) frameworks. Sustainability 2009, 1, 441–463. [Google Scholar] [CrossRef]
- OECD. Environmental Indicators for Agriculture: Volume 1 Concepts and Frameworks; Organization for Economic Cooperation and Development: Paris, France, 1999. [Google Scholar]
- EEA. Environmental signals 2000—Environmental assessment report No 6; European Environment Agency: Copenhagen, Denmark, 2000. [Google Scholar]
- Von Schirnding, Y. Health in Sustainable Development Planning: The Role of Indicators; World Health Organization: Geneva, Switzerland, 2002. [Google Scholar]
- Rapport, D.J.; Singh, A. An EcoHealth-based framework for state of the environment reporting. Ecol. Indic. 2006, 6, 409–428. [Google Scholar]
- Liu, H.Y.; Bartonova, A.; Pascal, M.; Smolders, R.; Skjetne, E.; Dusinka, M. Approaches to integrated monitoring for environmental health impact assessment. Environ. Health 2002, 11, 1–13. [Google Scholar]
- Hambling, T.; Weinstein, P.; Slaneye, D. A review of frameworks for developing environmental health indicators for climate change and health. Int. J. Environ. Res. Public Health 2011, 8, 2854–2875. [Google Scholar] [CrossRef] [PubMed]
- Carneiro, F.F.; Oliveira, M.L.C.; Netto, G.F.; Galvao, L.A.C.; Cancio, J.A.; Bonini, E.M.; Corvalan, C.F. Meeting report: Development of environmental health indicators in Brazil and other countries in the Americas. Environ. Health Perspect. 2006, 114, 1407–1408. [Google Scholar] [CrossRef] [PubMed]
- Von Schirnding, Y. Health-environment indicators in the context of sustainable development. Can. J. Public Health 2002, 93, S9–S15. [Google Scholar] [PubMed]
- Corvalán, C.; Briggs, D.; Zielhuis, G. Decision-Making in Environmental Health: From Evidence to Action; World Health Organization: Geneva, Switzerland, 2000. [Google Scholar]
- Cole, D.C.; Eyles, J.; Gibson, B.L. Indicators of human health in ecosystems: What do we measure? Sci. Total Environ. 1998, 224, 201–213. [Google Scholar] [CrossRef] [PubMed]
- Ministry of Environment and Energy. Water Management: Policies, Guidelines, Provincial Water Quality Objectives of the MINISTRY of the ENVIRONMENT; Queen’s Printer for Ontario: Toronto, ON, Canada, 1994.
- Ministry of the Environment. Air Quality in Ontario Report for 2011; Queen’s Printer for Ontario: Toronto, ON, Canada, 2013.
- CCME. Guidance Document on Achievement Determination: Canada-Wide Standards for Particulate Matter and Ozone; Canadian Council of Ministers of the Environment: Winnipeg, MB, Canada, 2007.
- Ministry of Environment. O. Reg. 169/03. Available online: http://www.e-laws.gov.on.ca/html/regs/english/elaws_regs_030169_e.htm (accessed on 12 October 2014).
- MOH. Environmental Health Indicators for New Zealand 2008; Ministry of Health: Wellington, New Zealand, 2009.
- Trees Ontario. A Healthy Dose of Green: A Prescription for a Healthy Population; Trees Ontario: Toronto, ON, Canada, 2012. [Google Scholar]
© 2014 by the authors; licensee MDPI, Basel, Switzerland. This article is an open access article distributed under the terms and conditions of the Creative Commons Attribution license (http://creativecommons.org/licenses/by/4.0/).
Share and Cite
Lam, S.; Leffley, A.; Cole, D.C. Applying an Ecohealth Perspective in a State of the Environment Report: Experiences of a Local Public Health Unit in Canada. Int. J. Environ. Res. Public Health 2015, 12, 16-31. https://doi.org/10.3390/ijerph120100016
Lam S, Leffley A, Cole DC. Applying an Ecohealth Perspective in a State of the Environment Report: Experiences of a Local Public Health Unit in Canada. International Journal of Environmental Research and Public Health. 2015; 12(1):16-31. https://doi.org/10.3390/ijerph120100016
Chicago/Turabian StyleLam, Steven, Alanna Leffley, and Donald C. Cole. 2015. "Applying an Ecohealth Perspective in a State of the Environment Report: Experiences of a Local Public Health Unit in Canada" International Journal of Environmental Research and Public Health 12, no. 1: 16-31. https://doi.org/10.3390/ijerph120100016
APA StyleLam, S., Leffley, A., & Cole, D. C. (2015). Applying an Ecohealth Perspective in a State of the Environment Report: Experiences of a Local Public Health Unit in Canada. International Journal of Environmental Research and Public Health, 12(1), 16-31. https://doi.org/10.3390/ijerph120100016