A Biomarker Found in Cadmium Exposed Residents of Thailand by Metabolome Analysis


Abstract
:1. Introduction
2. Experimental Section
2.1. Study Subjects

| Control (N = 10) | Cd Toxicosis Cases (N = 10) | |||||||
|---|---|---|---|---|---|---|---|---|
| Mean | SD | Min–Max | Mean | SD | Min–Max | P-Value | ||
| Age | years | 67 | 8.6 | 48–77 | 71 | 10.6 | 49–82 | NS |
| Gender ratio | Men/Women | 4/6 | 4/6 | |||||
| Height | cm | 151.6 | 4.9 | 143–159 | 149.5 | 8.7 | 137–168 | NS |
| Weight | kg | 56.3 | 6.7 | 45–65 | 47.4 | 11.9 | 29–65 | NS |
| BMI | kg/m2 | 23.8 | 3.1 | 18.0–28.9 | 21.3 | 5.4 | 12.1–31.8 | NS |
| Urinary Cd # | μg/g Cr | 0.87 | 1.6 | 0.43–2.1 | 11.5 | 1.2 | 9.2–18.7 | *** |
| Urinary β2-MG # | μg/g Cr | 132 | 1.7 | 62–278 | 33,266 | 2.3 | 10,366–138,413 | *** |
| Urinary NAG # | U/g Cr | 4.1 | 1.4 | 2.6–6.5 | 14.5 | 1.5 | 9.5–29.4 | *** |
| Urinary amino acids # | μg/g Cr | 96 | 1.3 | 70.9–171.9 | 124 | 1.2 | 99.6–167.4 | * |
| Urinary proline # | μg/g Cr | 4.1 | 1.4 | 2.3–6.6 | 5.8 | 1.6 | 2.8–11.5 | NS |
| Serum Cr | mg/dl | 0.93 | 0.18 | 0.6–1.2 | 1.62 | 0.7 | 1.1–3.4 | * |
| RBC | ×10,000 | 508 | 44 | 434–599 | 406 | 56 | 333–514 | *** |
| Hb | g/dl | 13.5 | 1.7 | 11.3–16.3 | 11.5 | 1.1 | 10.2–13.6 | ** |
| Ht | % | 42.2 | 4.5 | 36.4–50.3 | 35.1 | 3.2 | 31.1–41.0 | ** |
| Hypertension | N(%) | 5 | (50) | 6 | (60) | NS | ||
| Diabetes meritus | N(%) | 0 | (0) | 0 | ( 0) | NS | ||
| Nephrolithiasis | N(%) | 1 | (10) | 3 | (30) | NS | ||
2.2. Urine Collection and the Measurement of Renal and Exposure Markers
2.3. Metabolomics Analysis and Quantification Analysis by GC-MS
2.4. Measurements of Detected Biomarker and Minerals in Urine for All Samples on the Second Step of the Study
2.5. Data Analysis
3. Results and Discussion
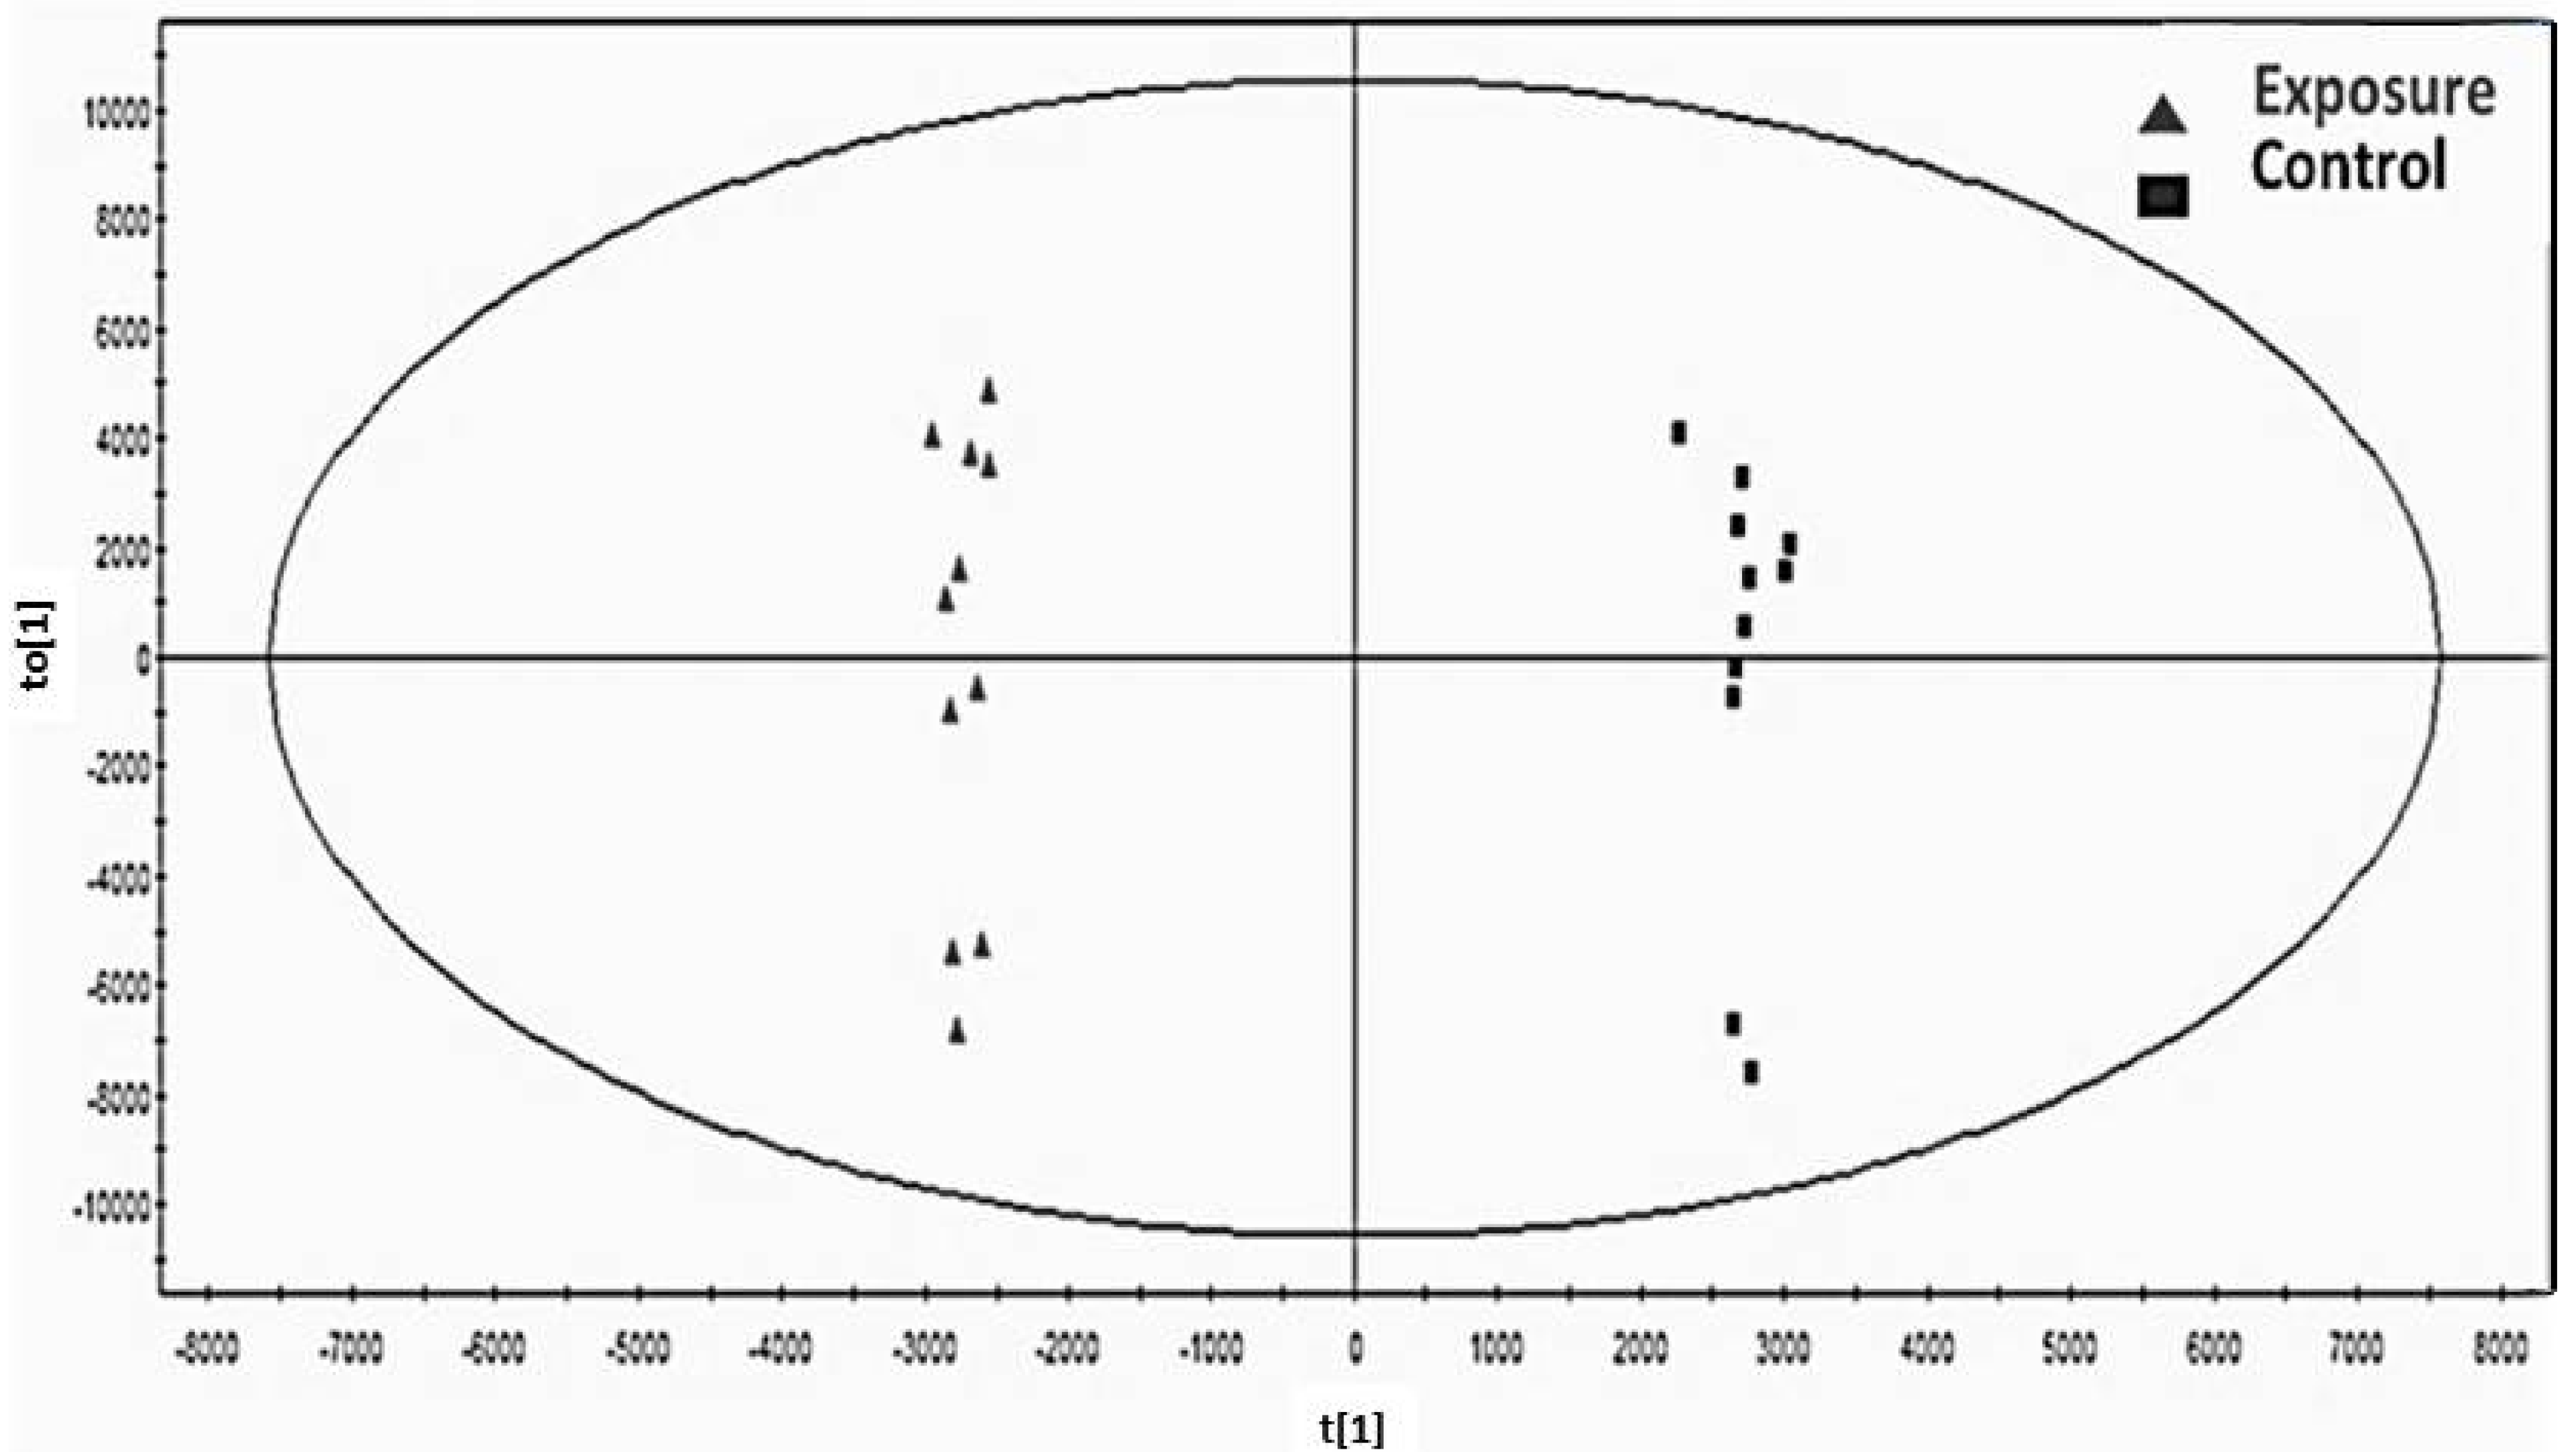
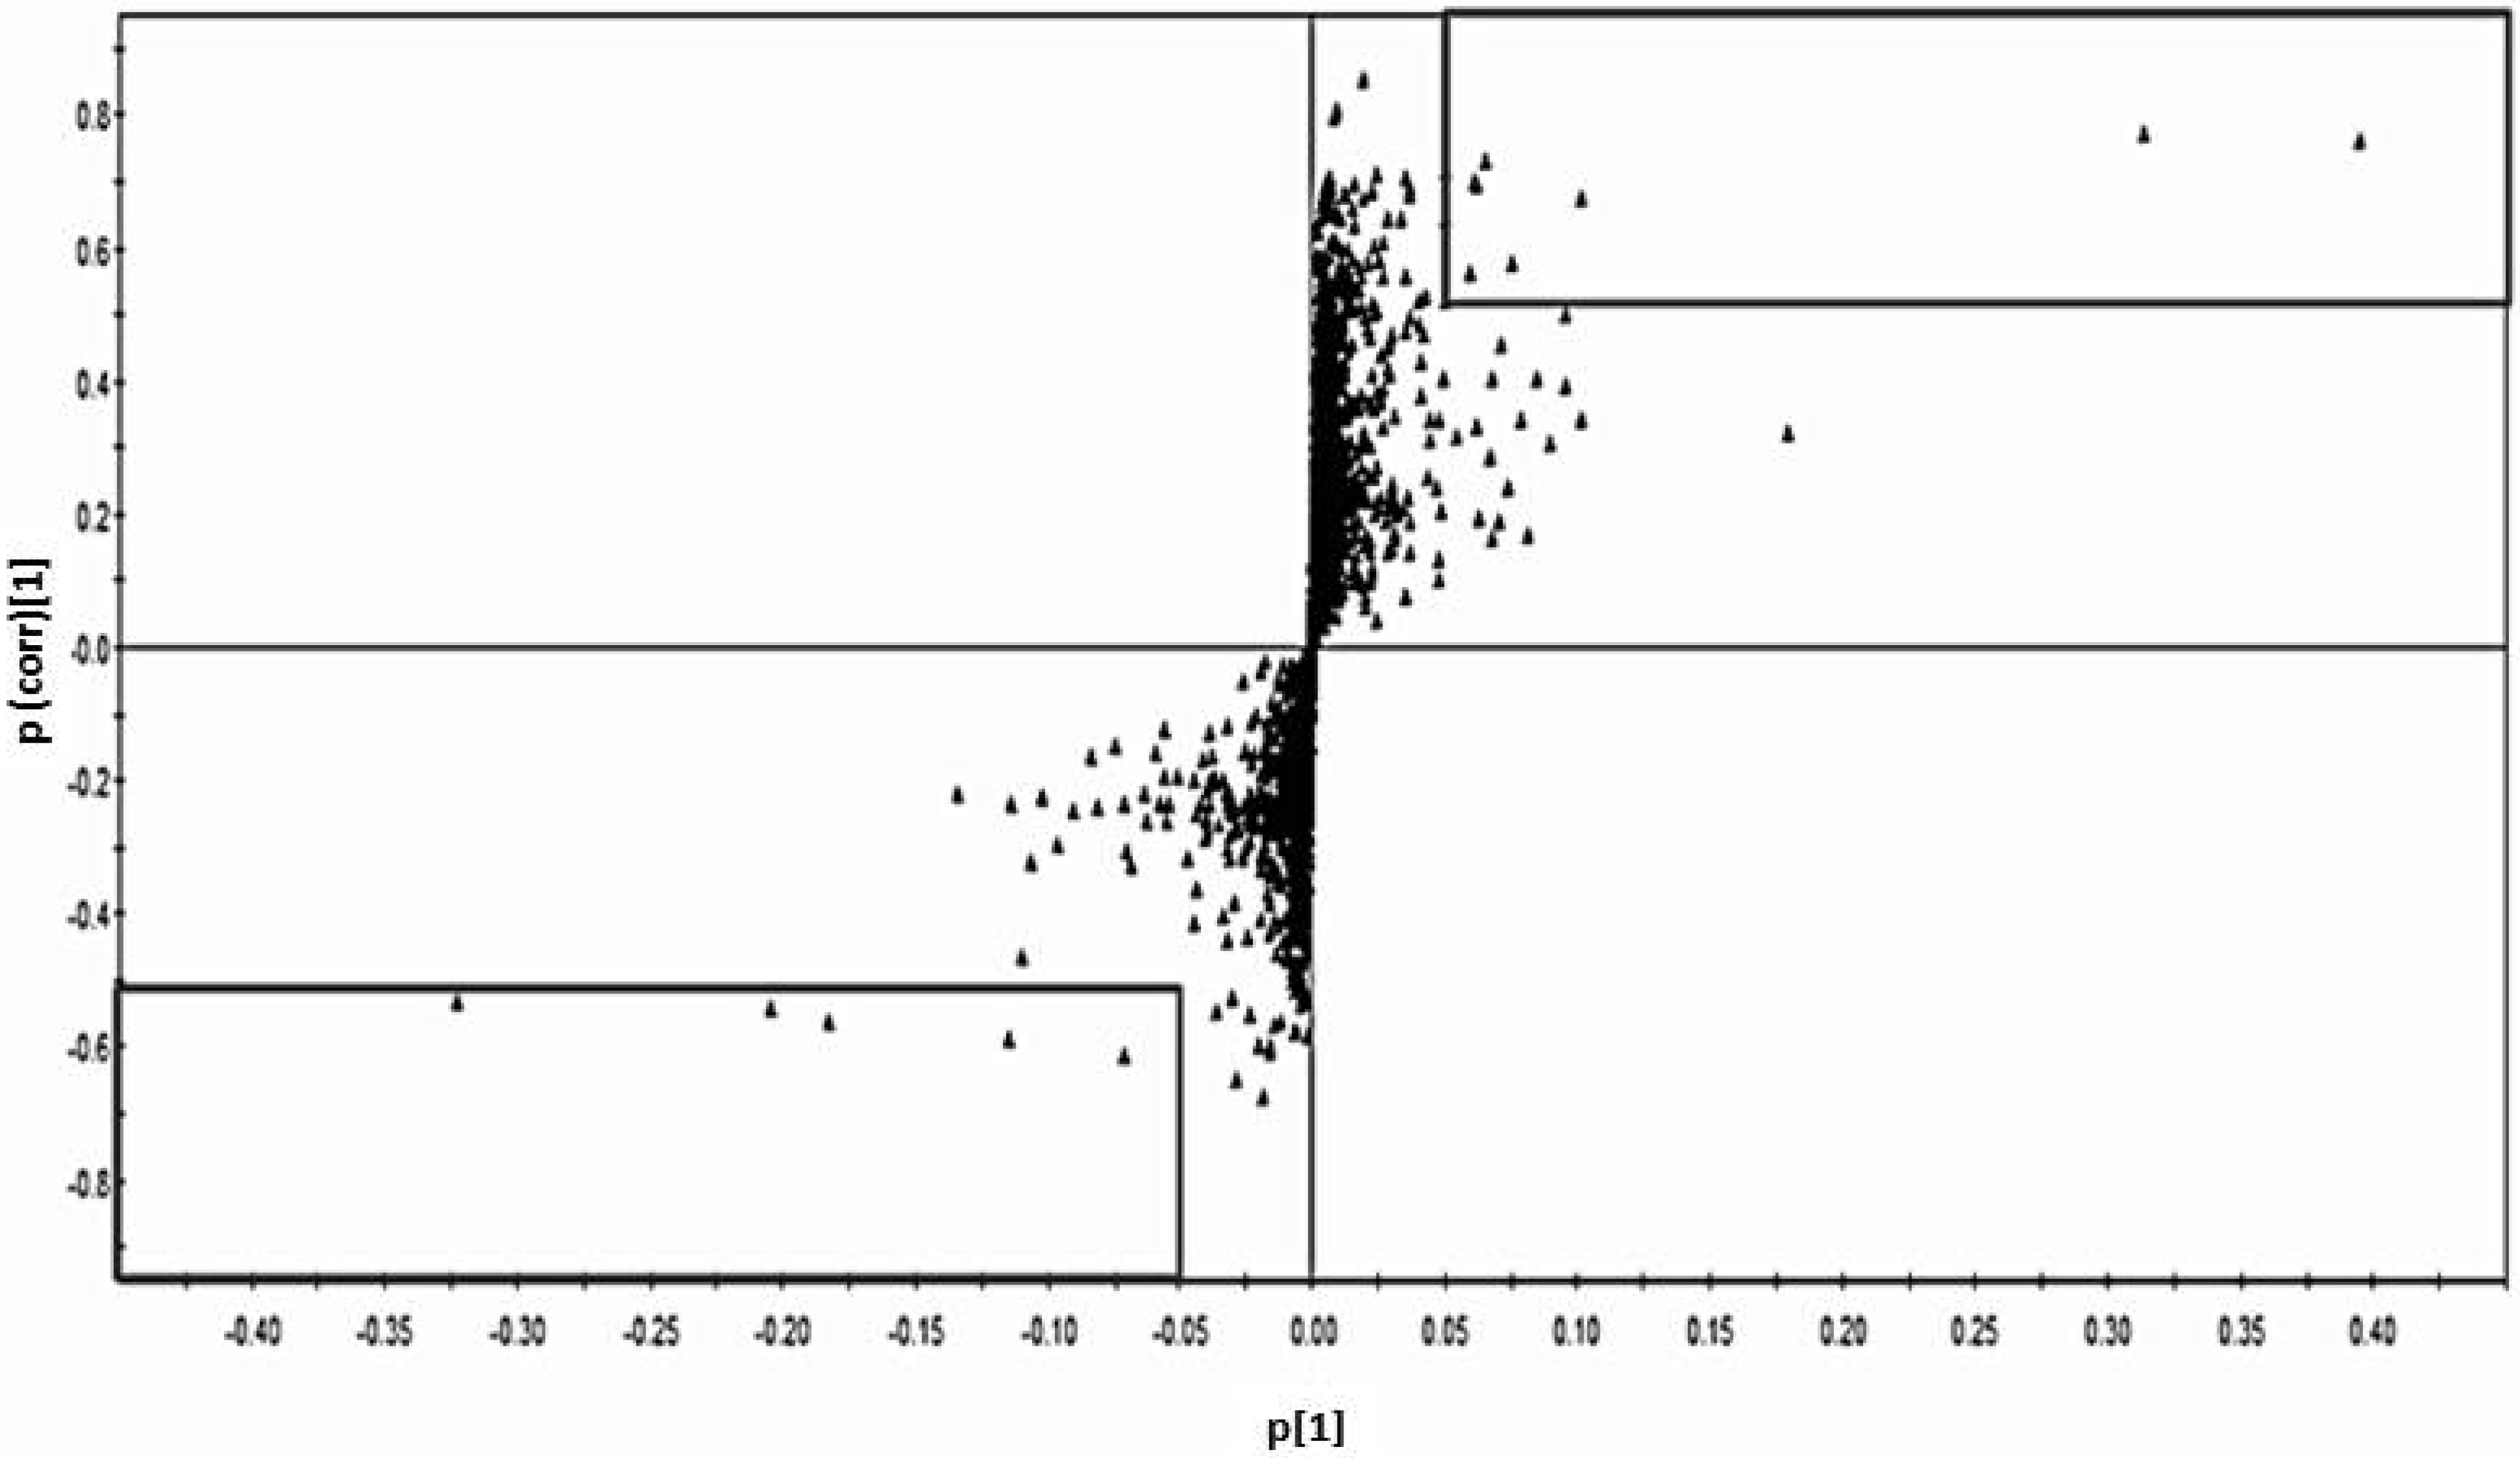
3.1. Determination of Biomarkers Specific to Cd Exposed Subjects in Thailand
 ) and control group (■) with no variation between two groups.
) and control group (■) with no variation between two groups.
) and control group (■) with no variation between two groups.
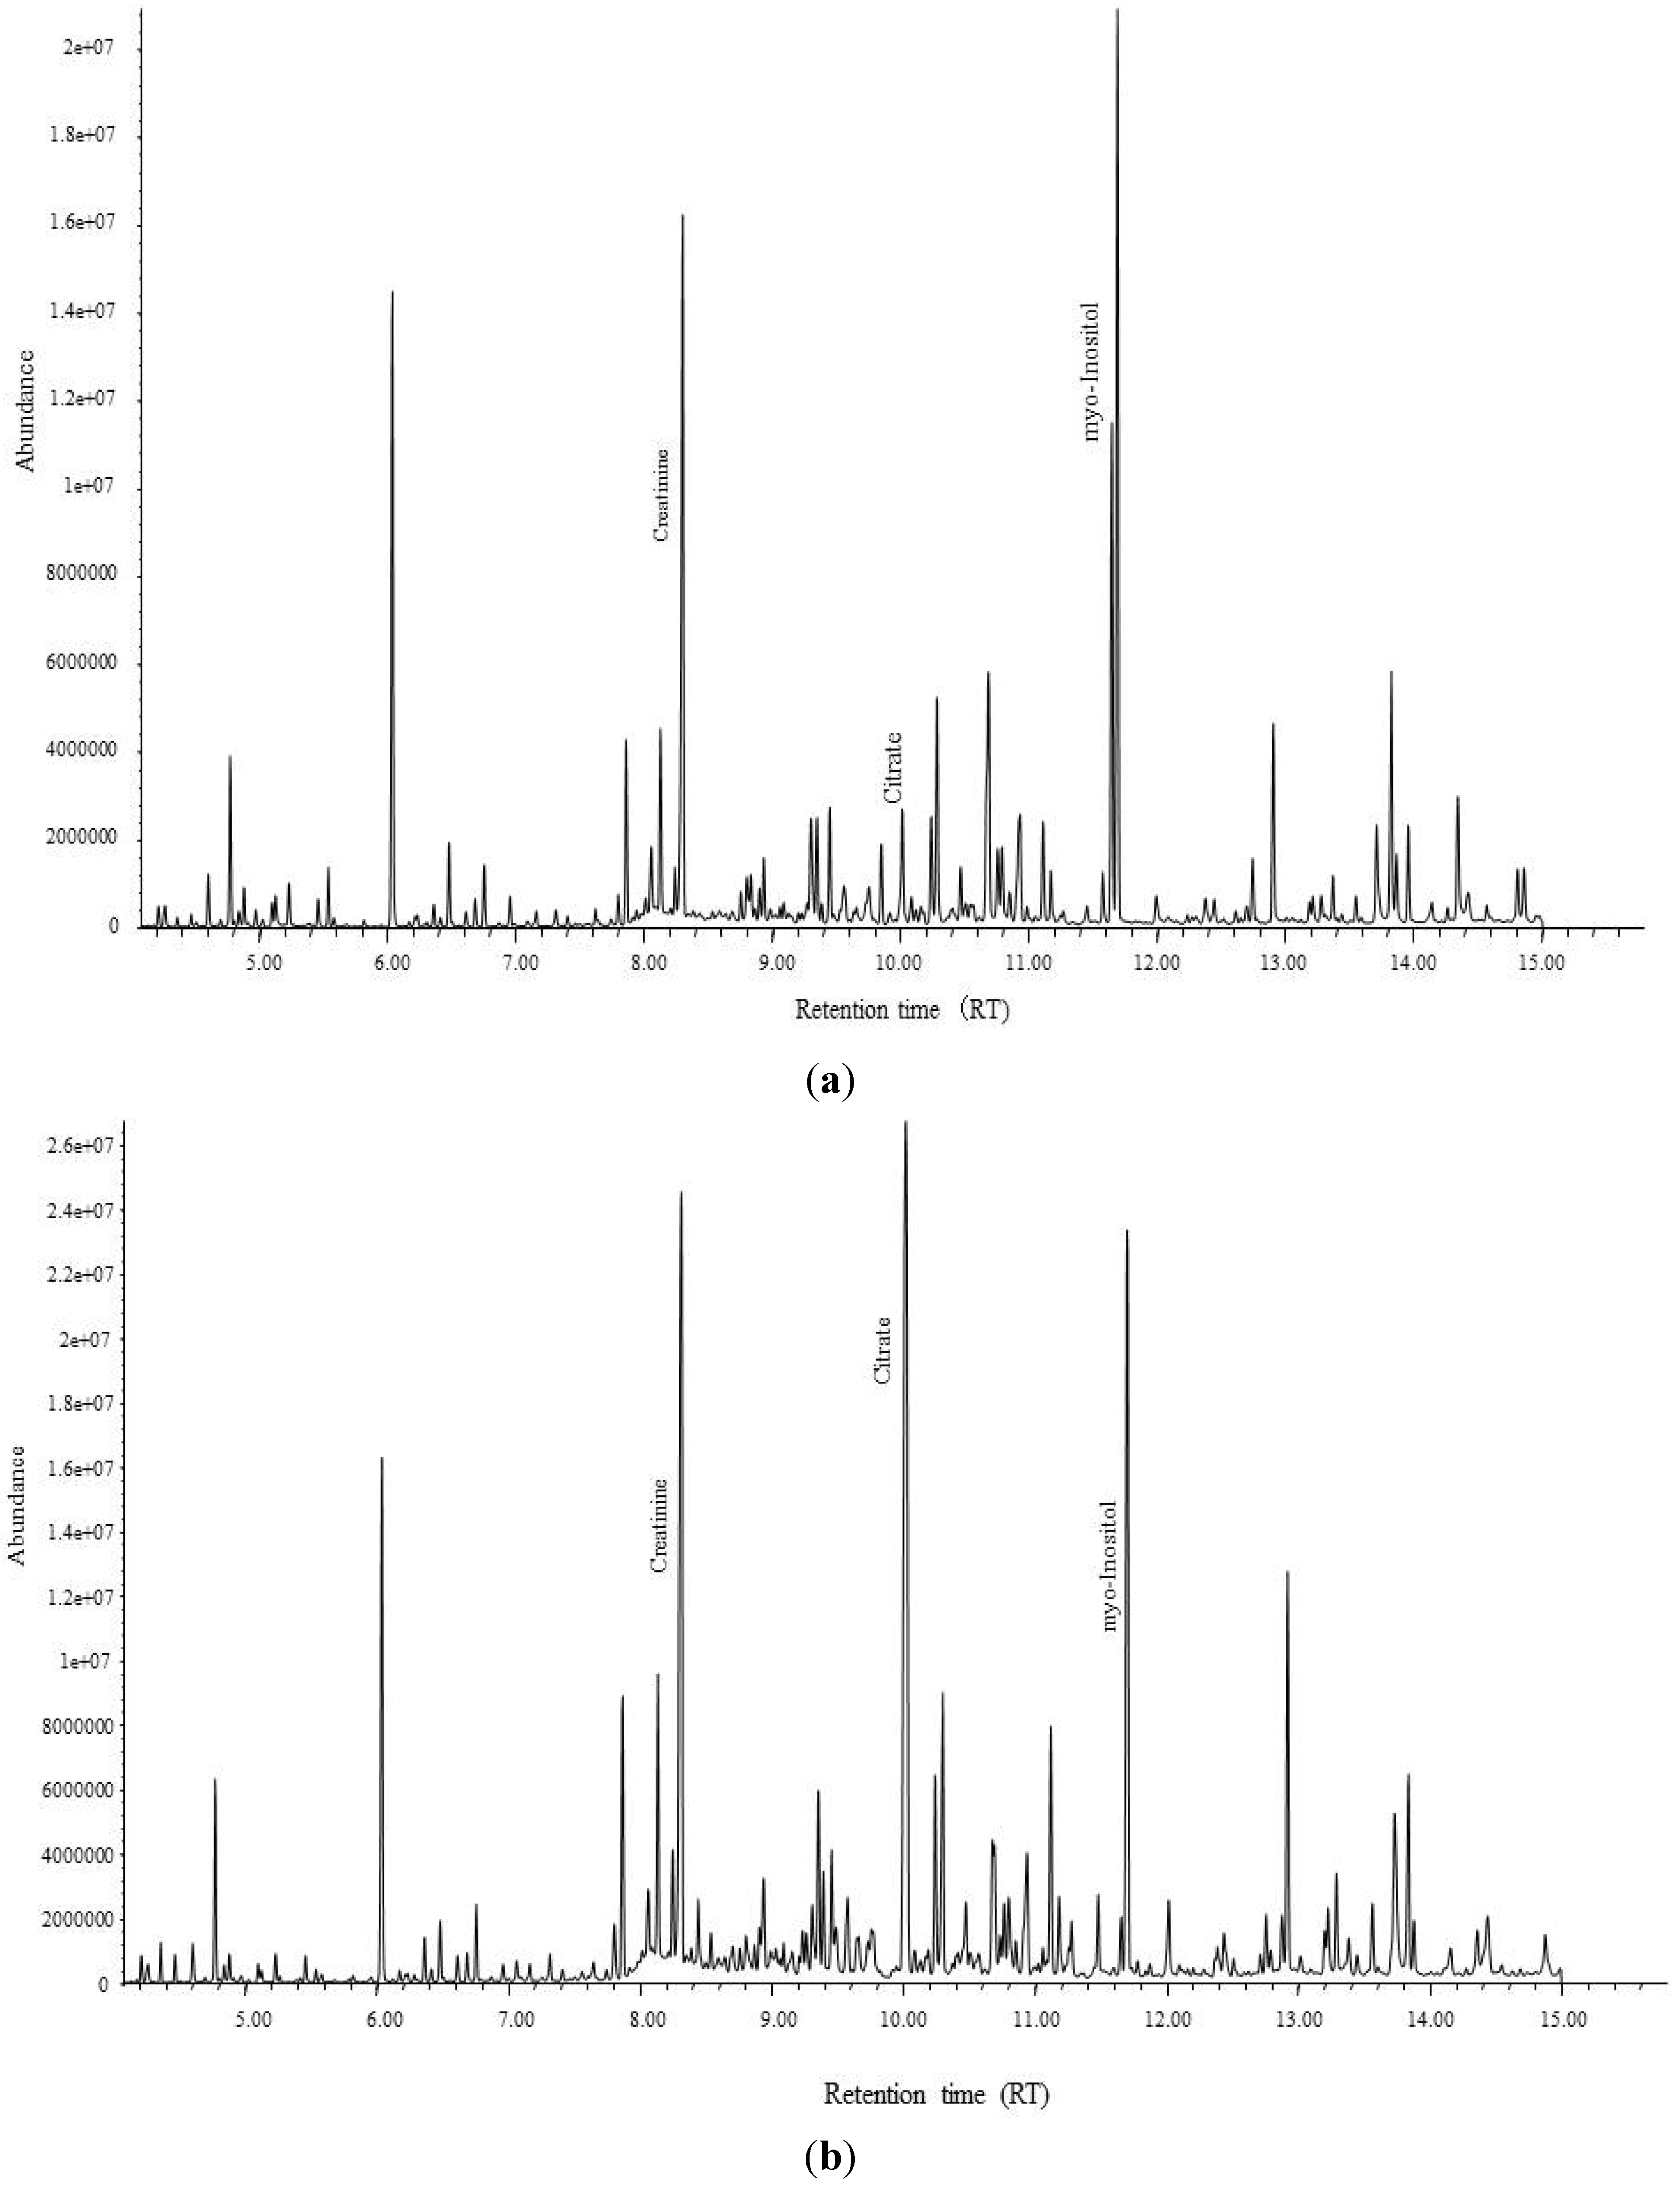
3.2. Differences of Present Results in Thai Population from Previous Metabolomics Studies
| Controls | Cd toxicosis cases | |||||
|---|---|---|---|---|---|---|
| (N = 10) | (N = 10) | |||||
| Mean | SD | Mean | SD | P-Value | ||
| Urinary citrate | mmol/molCr | 3.94 | 1.42 | 0.93 | 2.37 | *** |
| Urinary myo-inositol | mmol/molCr | 0.22 | 2.51 | 1.26 | 3.07 | *** |
3.3. The relationships of Detected Biomarkers and Cd Exposure
| Area | Non-Polluted | Polluted | Model | Comparison | |||||
|---|---|---|---|---|---|---|---|---|---|
| Control | Low exposed | High exposed | ANOVA | between groups | |||||
| Mean | SD | Mean | SD | Mean | SD | P-value | P-value | ||
| Men | N = 50 | N = 39 | N = 44 | ||||||
| Citrate# | 0.18 | 2.18 | 0.10 | 2.63 | 0.05 | 2.61 | 0.000 | **: C-L, ***: C-H | |
| Ca# | 0.05 | 2.51 | 0.05 | 2.37 | 0.06 | 2.30 | 0.523 | NS | |
| P# | 0.26 | 1.61 | 0.23 | 2.16 | 0.23 | 1.72 | 0.485 | NS | |
| Mg# | 0.04 | 1.56 | 0.04 | 1.67 | 0.04 | 1.68 | 0.336 | NS | |
| Ca/Citrate | 0.54 | 0.81 | 0.84 | 1.29 | 1.61 | 1.57 | 0.000 | ***: C-H | |
| Mg/Citrate | 0.32 | 0.32 | 0.58 | 0.77 | 1.28 | 1.51 | 0.000 | ***: C-H | |
| Women | N = 50 | N = 47 | N = 38 | ||||||
| Citrate# | 0.28 | 2.02 | 0.13 | 3.12 | 0.07 | 2.93 | 0.000 | ***: C-L, ***: C-H | |
| Ca# | 0.07 | 2.28 | 0.06 | 2.49 | 0.08 | 2.70 | 0.481 | NS | |
| P# | 0.34 | 1.49 | 0.28 | 1.63 | 0.30 | 1.73 | 0.176 | NS | |
| Mg# | 0.04 | 1.78 | 0.05 | 1.59 | 0.05 | 1.60 | 0.211 | NS | |
| Ca/Citrate | 0.43 | 1.01 | 0.91 | 1.23 | 1.79 | 1.73 | 0.000 | ***: C-H | |
| Mg/Citrate | 0.27 | 0.51 | 0.72 | 0.9 | 1.20 | 1.01 | 0.000 | *: C-L, ***: C-H | |
3.4. The Relationships of Detected Biomarkers and Renal Effects
| Citrate | Ca | P | Mg | Ca/Citrate | Mg/Citrate | ||||||||
|---|---|---|---|---|---|---|---|---|---|---|---|---|---|
| Men (N = 133) | |||||||||||||
| Cd | −0.482 | *** | 0.067 | −0.122 | 0.084 | 0.448 | *** | 0.463 | *** | ||||
| β2-MG | −0.323 | *** | −0.034 | −0.128 | 0.182 | * | 0.275 | ** | 0.360 | *** | |||
| NAG | −0.112 | −0.175 | * | −0.034 | 0.057 | 0.038 | 0.115 | ||||||
| Women (N = 135) | |||||||||||||
| Cd | −0.504 | *** | 0.151 | −0.089 | 0.108 | 0.574 | *** | 0.554 | *** | ||||
| β2-MG | −0.497 | *** | −0.011 | −0.030 | 0.058 | 0.465 | *** | 0.499 | *** | ||||
| NAG | −0.159 | 0.015 | −0.033 | 0.116 | 0.160 | 0.129 | * | ||||||
| Explanatory Factors | Citrate | Ca/Ctrate | Mg/Ctrate | ||||
|---|---|---|---|---|---|---|---|
| β | P−Value | β | P−Value | β | P−Value | ||
| Men | (N = 133) | ||||||
| Model 1 | Age | −0.050 | −0.119 | 0.031 | |||
| Smoking | 0.030 | −0.311 | −0.130 | ||||
| Cd | −0.451 | *** | 0.311 | *** | 0.349 | *** | |
| Model 2 | Age | 0.004 | −0.200 | * | −0.042 | ||
| Smoking | 0.018 | −0.110 | −0.114 | ||||
| Cd | −0.373 | *** | 0.193 | 0.243 | * | ||
| β2-MG | −0.155 | 0.233 | * | 0.209 | |||
| Model 3 | Age | −0.058 | −0.112 | −0.025 | |||
| Smoking | 0.028 | −0.126 | −0.142 | ||||
| Cd | −0.458 | *** | 0.316 | ** | 0.302 | ** | |
| NAG | 0.024 | −0.021 | 0.166 | ||||
| Women | (N = 135) | ||||||
| Model 1 | Age | −0.152 | 0.070 | 0.220 | ** | ||
| Smoking | −0.107 | 0.213 | 0.116 | ||||
| Cd | −0.445 | *** | 0.329 | *** | 0.341 | *** | |
| Model 2 | Age | 0.021 | −0.043 | 0.077 | |||
| Smoking | −0.084 | 0.197 | * | 0.096 | |||
| Cd | −0.271 | ** | 0.215 | * | 0.196 | * | |
| β2-MG | −0.382 | *** | 0.250 | * | 0.317 | ** | |
| Model 3 | Age | −0.213 | * | 0.113 | 0.269 | ** | |
| Smoking | −0.122 | 0.224 | ** | 0.129 | |||
| Cd | −0.485 | *** | 0.358 | *** | 0.373 | *** | |
| NAG | 0.152 | −0.109 | −0.122 | ||||
3.5. Cd Pollution and Nephrolithiasis
4. Conclusions
Acknowledgments
Author Contributions
Conflicts of Interest
References
- Nogawa, K. Itai-Itai Disease and Follow-Up Studies: An Interpretation of Cadmium in the Environment Part 2 Health Effects; Wiley: New York, NY, USA, 1981. [Google Scholar]
- Nogawa, K.; Kobayashi, E.; Honda, R.; Ishizaki, A.; Kawano, S.; Matsuda, H. Renal dysfunctions of inhabitants in a cadmium-polluted area. Environ. Res. 1980, 23, 13–23. [Google Scholar]
- Nogawa, K.; Kido, T. Biological monitoring of cadmium exposure in Itai-Itai disease epidemiology. Int. Arch. Occup. Environ. Health 1993, 65, S43–S46. [Google Scholar] [CrossRef]
- Simmons, R.W.; Pongsakul, P.; Saiyasitpanich, D.; Klinphoklap, S. Elevated levels of cadmium and zinc in paddy soils and elevated levels of cadmium in rice grain downstream of a zinc mineralized area in Thailand: Implications for public health. Environ. Geochem. Health 2005, 27, 501–511. [Google Scholar] [CrossRef]
- Swaddiwudhipong, W.; Limpatanachote, P.; Mahasakpan, P.; Krintratun, S.; Padungtod, C. Cadmium-exposed population in Mae Sot District, Tak Province: 1. Prevalence of high urinary cadmium levels in the adults. J. Med. Asso. Thai 2007, 90, 143–148. [Google Scholar]
- Teeyakasem, W.; Nishijo, M.; Honda, R.; Satarug, S.; Swaddiwudhipong, W.; Ruangyuttikarn, W. Monitoring of cadmium toxicity in a Thai population with high-level environmental exposure. Toxicol. Let. 2007, 169, 185–195. [Google Scholar] [CrossRef]
- World Health Organization (WHO). Environmental Health Criteria 134 Cadmium; World Health Organization, International Programme on Chemical Safety, WHO: Geneva, Switzerland, 1992. [Google Scholar]
- Honda, R.; Swaddiwudhipong, W.; Nishijo, M.; Mahasakpan, P.; Teeyakasem, W.; Ruangyuttikarn, W.; Satarug, S.; Padungtod, C.; Nakagawa, H. Cadmium induced renal dysfunction among residents of rice farming area downstream from a zinc-mineralized belt in Thailand. Toxicol. Lett. 2010, 198, 26–32. [Google Scholar] [CrossRef]
- Nambunmee, K.; Honda, R.; Nishijo, M.; Swaddiwudhipong, W.; Nakagawa, H.; Ruangyuttikarn, W. Bone resorption acceleration and calcium reabsorption impairment in a Thai population with high cadmium exposure. Toxicol. Mech. Meth. 2010, 20, 7–13. [Google Scholar] [CrossRef]
- Swaddiwudhipong, W.; Mahasakpan, P.; Limpatanachote, P.; Krintratun, S. An association between urinary cadmium and urinary stone disease in persons living in cadmium-contaminated villages in northwestern Thailand: A population study. Environ. Res. 2011, 111, 579–583. [Google Scholar] [CrossRef]
- Swaddiwudhipong, W.; Limpatanachote, P.; Mahasakpan, P.; Krintratun, S.; Punta, B.; Funkhiew, T. Progress in cadmium-related health effects in persons with high environmental exposure in northwestern Thailand: A five-year follow-up. Environ. Res. 2012, 112, 194–198. [Google Scholar] [CrossRef]
- Simpson, M.; McKelvie, J. Environmental metabolomics: New insights into earthworm ecotoxicity and contaminant bioavailability in soil. Analyt. Bioanalyt. Chem. 2009, 394, 137–149. [Google Scholar] [CrossRef]
- Kuhara, T. Metabolome Profiling of Human Urine with Capillary Gas Chromatography/Mass Spectrometry. In Metabolomics; Tomita, M., Nishioka, T., Eds.; Springer: Tokyo, Japan, 2005; pp. 53–74. [Google Scholar]
- Pasikanti, K.K.; Ho, P.C.; Chan, E.C.Y. Gas chromatography/mass spectrometry in metabolic profiling of biological fluids. J. Chromatogr. B 2008, 871, 202–211. [Google Scholar] [CrossRef]
- Ruangyuttikarn, W.; Panyamoon, A.; Nambunmee, K.; Honda, R.; Swaddiwudhipong, W.; Nishijo, M. Use of the kidney injury molecule-1 as a biomarker for early detection of renal tubular dysfunction in a population chronically exposed to cadmium in the environment. Springerplus 2013, 2. [Google Scholar] [CrossRef]
- Fukushima, M. A simple method for estimation of free proline in urine. Jap. J. Pub. Health 1973, 20, 659–665. [Google Scholar]
- Griffin, J.L.; Walker, L.A.; Shore, R.F.; Nicholson, J.K. Metabolic profiling of chronic cadmium exposure in the rat. Chem. Res. Toxicol. 2001, 14, 1428–1434. [Google Scholar] [CrossRef]
- Boudonck, K.J.; Mitchell, M.W.; Nemet, L.; Keresztes, L.; Nyska, A.; Shinar, D.; Rosenstock, M. Discovery of metabolomics biomarkers for early detection of nephrotoxicity. Toxicol. Pathol. 2009, 37, 280–292. [Google Scholar] [CrossRef]
- Sieber, M.; Wagner, S.; Rached, E.; Amberg, A.; Mally, A.; Dekant, W. Metabonomic study of ochratoxin a toxicity in rats after repeated administration: Phenotypic anchoring enhances the ability for biomarker discovery. Chem. Res. Toxicol. 2009, 22, 1221–1231. [Google Scholar] [CrossRef]
- Hwang, G.S.; Yang, J.Y.; Ryu, D.H.; Kwon, T.H. Metabolic profiling of kidney and urine in rats with lithium-induced nephrogenic diabetes insipidus by (1)H-NMR-based metabonomics. Am. J. Physiol. Renal. Physiol. 2010, 298, F461–F470. [Google Scholar] [CrossRef]
- Nicholson, J.K.; Higham, D.P.; Timbrell, J.A.; Sadler, P.J. Quantitative high resolution 1H NMR urinalysis studies on the biochemical effects of cadmium in the rat. Mol. Pharmacol. 1989, 36, 398–404. [Google Scholar]
- Ellis, J.; Athersuch, T.; Thomas, L.; Teichert, F.; Perez-Trujillo, M.; Svendsen, C.; Spurgeon, D.; Singh, R.; Jarup, L.; Bundy, J.; et al. Metabolic profiling detects early effects of environmental and lifestyle exposure to cadmium in a human population. BMC Med. 2012, 10. [Google Scholar] [CrossRef]
- Thomas, L.D.; Hodgson, S.; Nieuwenhuijsen, M.; Jarup, L. Early kidney damage in a population exposed to cadmium and other heavy metals. Environ. Health Persp. 2009, 117, 181–184. [Google Scholar]
- Suvagandha, D.; Nishijo, M.; Kuhara, T.; Ohse, M.; Honda, R.; Ruangyuttikarn, W.; Swaddiwudhipong, W.; Aoshima, K.; Morikawa, Y.; Nakagawa, H. Urinary metabolome analysis of cadmium toxicosis cases in Japanese polluted area. Abstract. Jpn. J. Hyg. 2012, 67. Available online: https://getinfo.de/app/Urinary-metabolome-analysis-of-cadmium-toxicosis/id/BLSE%3ARN310268274 (accessed on 18 February 2014).
- Sato, K.; Kusaka, Y.; Zhang, Q.; Li, B.; Okada, K.; Nakakuki, K.; Muraoka, R. Citrate uptake by isolated rat renal brush border membrane vesicles in cadmium-intoxicated rats. Ind. Health 1997, 35, 388–393. [Google Scholar]
- Heing-Smith, K.S.; Gambala, C.T.; Hamm, L.L. Citrate and succinate transport in proximal tubular cells. Am. J. Physiol. Renal. Physiol. 2000, 278, F492–F498. [Google Scholar]
- Tanner, G.A.; Tanner, J.A. Dietary citrate treatment of polycystic kidney disease in rats. Nephron. 2003, 93, 14–20. [Google Scholar] [CrossRef]
- Musialik, D. Urinary excretion of β2-MG in patients with active metabolic stone disease. Int. Uril. Nephrol. 1989, 21, 381–387. [Google Scholar] [CrossRef]
- Gadola, L.; Noboa, O.; Marquez, M.N.; Rodriguez, M.J.; Nin, N.; Boggia, J.; Ferreiro, A.; Garcia, S.; Ortega, V.; Musto, M.L.; et al. Calcium citrate ameliorates the progression of chronic renal injury. Kidney Int. 2004, 65, 1224–1230. [Google Scholar] [CrossRef]
- Elinder, G.C.; Edling, C.; Lindberg, E.; Kagedal, B.; Vesterberg, O. Assessment of renal function in workers previously exposed to cadmium. Br. J. Ind. Med. 1985, 42, 754–760. [Google Scholar]
- Jarup, L.; Elinder, G.C. Incidence of renal stones among cadmium exposed battery workers. Br. J. Ind. Med. 1993, 50, 598–602. [Google Scholar]
- Nimmannit, S.; Malasit, P.; Susaengrat, W.; Ong-Aj-Yooth, S.; Vasuvattakul, S.; Pidetcha, P.; Shayakul, C.; Nilwarangkur, S. Prevalence of endemic distal renal tubular acidosis and renal stone in the northeast of Thailand. Nephron 1996, 72, 604–610. [Google Scholar] [CrossRef]
- Susaengrat, W.; Kochakarn, W.; Ruangraksa, C.; Domrongkitchaiporn, S. Urinary risk factors for recurrent calcium stone formation in Thai stone formers. J. Med. Assoc. Thai 2007, 90, 688–698. [Google Scholar]
Appendix
| Explanatory Factors | Citrate | Ca/Ctrate | Mg/Ctrate | ||||
|---|---|---|---|---|---|---|---|
| β | P-Value | β | P-Value | β | P-Value | ||
| Men | (N = 55) | ||||||
| Model 1 | Age | −0.010 | −0.075 | 0.014 | |||
| Cd | −0.555 | *** | 0.341 | * | 0.381 | ** | |
| Model 2 | Age | 0.110 | −0.200 | * | −0.042 | ||
| Cd | −0.388 | ** | 0.193 | 0.243 | * | ||
| β2−MG | −0.310 | 0.233 | * | 0.209 | |||
| Model 3 | Age | −0.009 | −0.037 | −0.047 | |||
| Cd | −0.555 | *** | 0.380 | * | 0.320 | * | |
| NAG | 0.003 | −0.119 | 0.188 | ||||
| Women | (N = 112) | ||||||
| Model 1 | Age | −0.178 | 0.145 | 0.232 | ** | ||
| Cd | −0.427 | *** | 0.264 | ** | 0.286 | *** | |
| Model 2 | Age | −0.021 | 0.004 | 0.080 | |||
| Cd | −0.285 | ** | 0.136 | 0.148 | |||
| β2−MG | −0.321 | ** | 0.288 | * | 0.312 | * | |
| Model 3 | Age | −0.269 | ** | 0.247 | * | 0.307 | ** |
| Cd | −0.468 | *** | 0.310 | ** | 0.320 | ** | |
| NAG | 0.199 | * | −0.223 | * | −0.163 | ||
© 2014 by the authors; licensee MDPI, Basel, Switzerland. This article is an open access article distributed under the terms and conditions of the Creative Commons Attribution license (http://creativecommons.org/licenses/by/3.0/).
Share and Cite
Suvagandha, D.; Nishijo, M.; Swaddiwudhipong, W.; Honda, R.; Ohse, M.; Kuhara, T.; Nakagawa, H.; Ruangyuttikarn, W. A Biomarker Found in Cadmium Exposed Residents of Thailand by Metabolome Analysis. Int. J. Environ. Res. Public Health 2014, 11, 3661-3677. https://doi.org/10.3390/ijerph110403661
Suvagandha D, Nishijo M, Swaddiwudhipong W, Honda R, Ohse M, Kuhara T, Nakagawa H, Ruangyuttikarn W. A Biomarker Found in Cadmium Exposed Residents of Thailand by Metabolome Analysis. International Journal of Environmental Research and Public Health. 2014; 11(4):3661-3677. https://doi.org/10.3390/ijerph110403661
Chicago/Turabian StyleSuvagandha, Dhitiwass, Muneko Nishijo, Witaya Swaddiwudhipong, Ruymon Honda, Morimasa Ohse, Tomiko Kuhara, Hideaki Nakagawa, and Werawan Ruangyuttikarn. 2014. "A Biomarker Found in Cadmium Exposed Residents of Thailand by Metabolome Analysis" International Journal of Environmental Research and Public Health 11, no. 4: 3661-3677. https://doi.org/10.3390/ijerph110403661
APA StyleSuvagandha, D., Nishijo, M., Swaddiwudhipong, W., Honda, R., Ohse, M., Kuhara, T., Nakagawa, H., & Ruangyuttikarn, W. (2014). A Biomarker Found in Cadmium Exposed Residents of Thailand by Metabolome Analysis. International Journal of Environmental Research and Public Health, 11(4), 3661-3677. https://doi.org/10.3390/ijerph110403661