The Relation between Scores on Noise Annoyance and Noise Disturbed Sleep in a Public Health Survey

Abstract
:1. Introducton
- does the relation between responses to questions on noise annoyance and sleep disturbance depend on the sound source or type of sound, such as intermittent or meaningful sound?
- does this relation depend on personal factors such as age, distress or use of sleeping drugs?
2. Methods
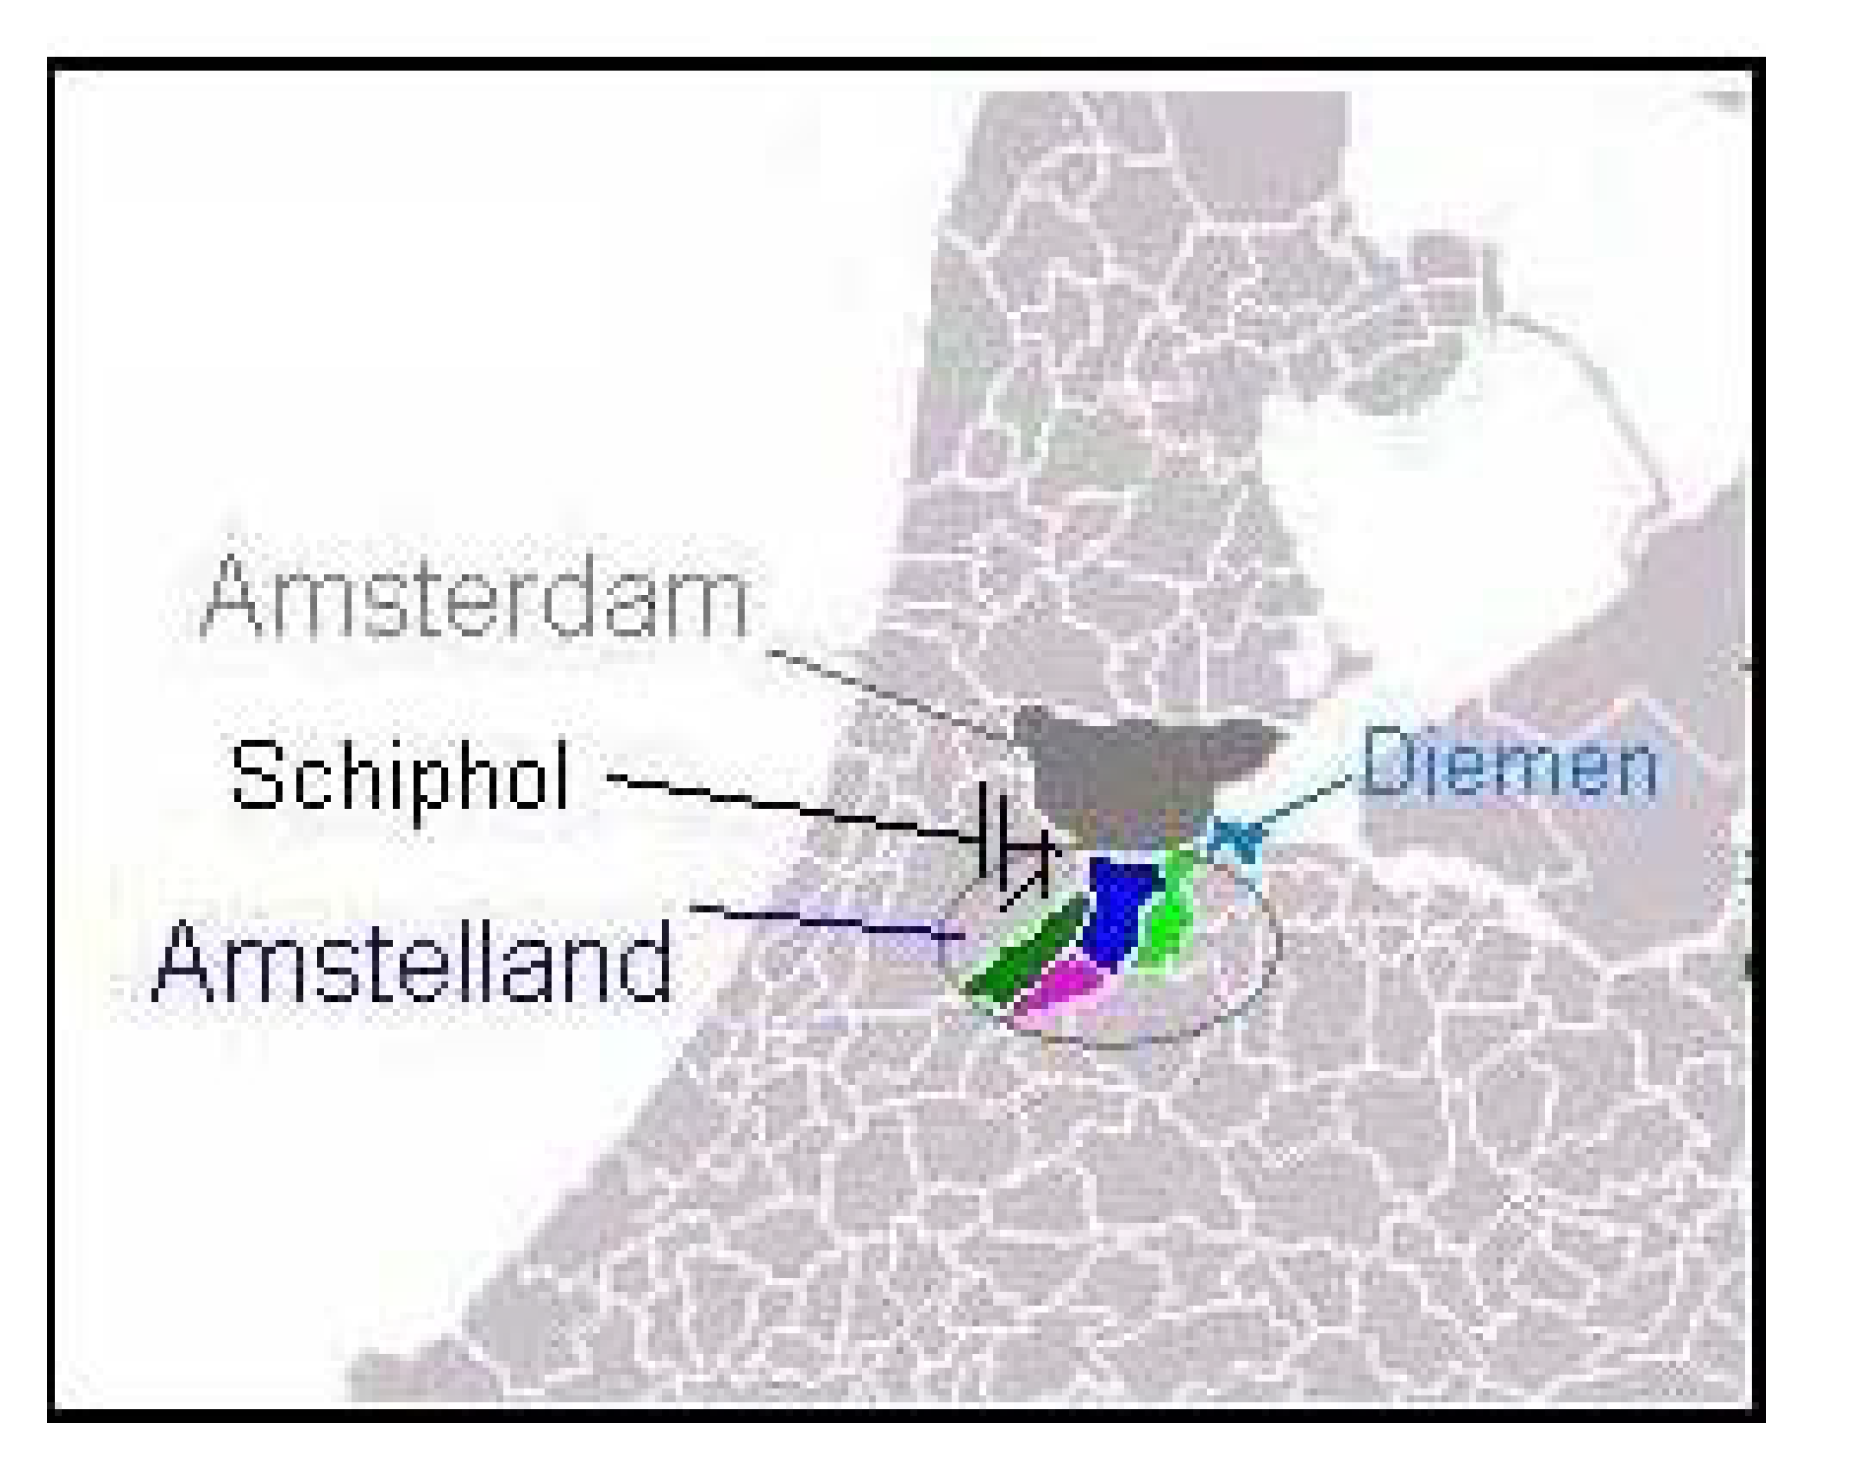
2.1. Study Group


| Age group | 19–34 | 35–49 | 50–64 | 65–74 | 75+ | All |
|---|---|---|---|---|---|---|
| response rate | 34% | 45% | 63% | 77% | 65% | 56% |
| # respondents | 570 | 584 | 814 | 999 | 850 | 3817 |
| % male | 39% | 42% | 47% | 48% | 43% | 44% |
2.2. Noise Questions in the Questionnaire
“ Below is a scale from 0 to 10 where you can indicate to what degree you are annoyed, disturbed or irritated when you are at home. If you are not annoyed at all, please tick a 0, if you are extremely annoyed, please tick a 10. If you are somewhere in between, please tick a number between 0 and 10. If the sound is not present in your home, you can tick this in the last column.Thinking about the past 12 months, which number from 0 to 10 indicates best to what degree you are annoyed, disturbed or irritated from sound from sources listed below when you are at home? Please put a tick on every line.”
“To what degree is your sleep disturbed when you are at home from sound from sources listed below? Think about the situation in the past 12 months. Please tick every line.”
- Traffic on roads with a speed limit higher than 50 km/h (‘highway traffic’)
- Traffic on roads with a speed limit of 50 km/h or less (‘city traffic’)
- Trains
- Urban or regional tram and metro (‘trams’)
- Aircraft
- Schiphol airport (taxiing, engine testing and/or other ground activities) (‘airport’)
- Industry (includes smaller and bigger businesses and factories)
- Neighbours
- Mopeds or scooters with and without licence (‘scooters’)
- Other (not reported here).
2.3. Characteristics of Noise Source
2.4. Individual Characteristics in the Questionnaire
- Age (19–64, 65+)
- Gender (male, female)
- Perceived health (excellent/good, moderate/bad)
- Use of sleeping drugs (high = at least once every two weeks, low = less)
- Risk to suffer from anxiety/depression (high, medium/low)
- Feeling lonely (high, low)
- Satisfied with house (scale 1–10: yes = score 6–10, no = 1–5)
- Satisfied with living environment/neighbour-hood (scale 1–10: yes = score 6–10, no = 1–5)
- Living alone (yes, no)
2.5. Analysis
3. Results
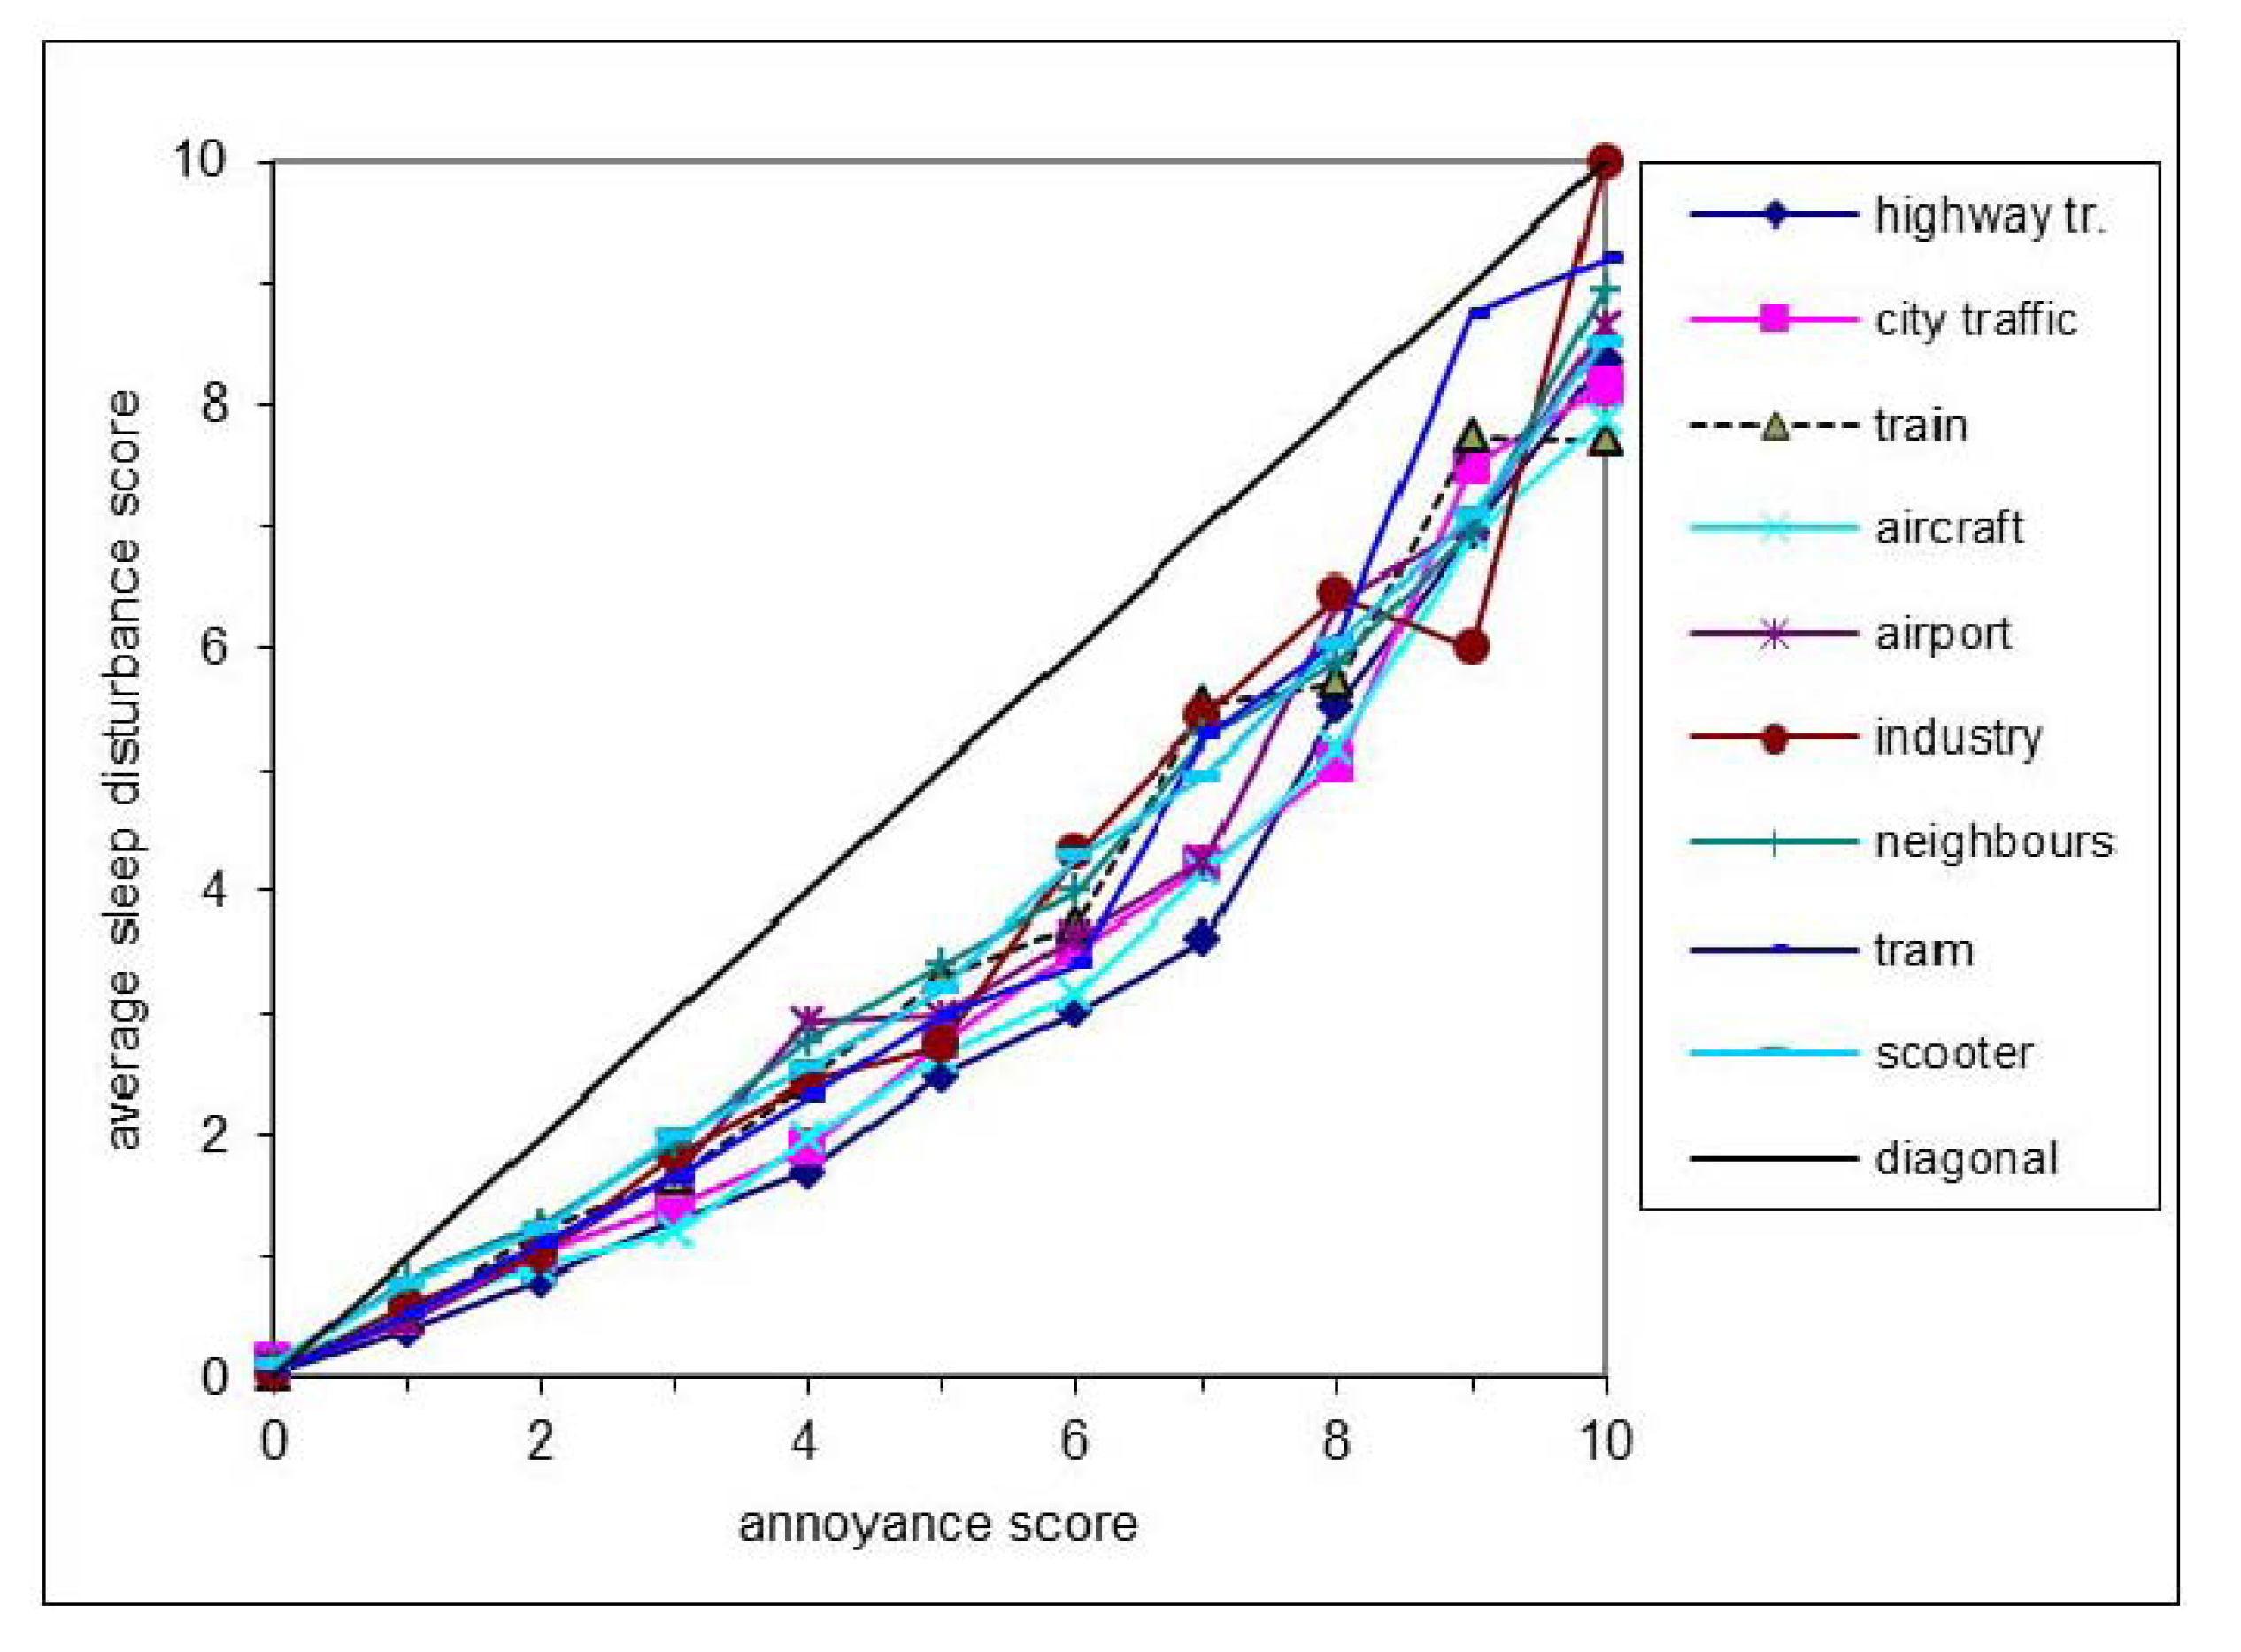
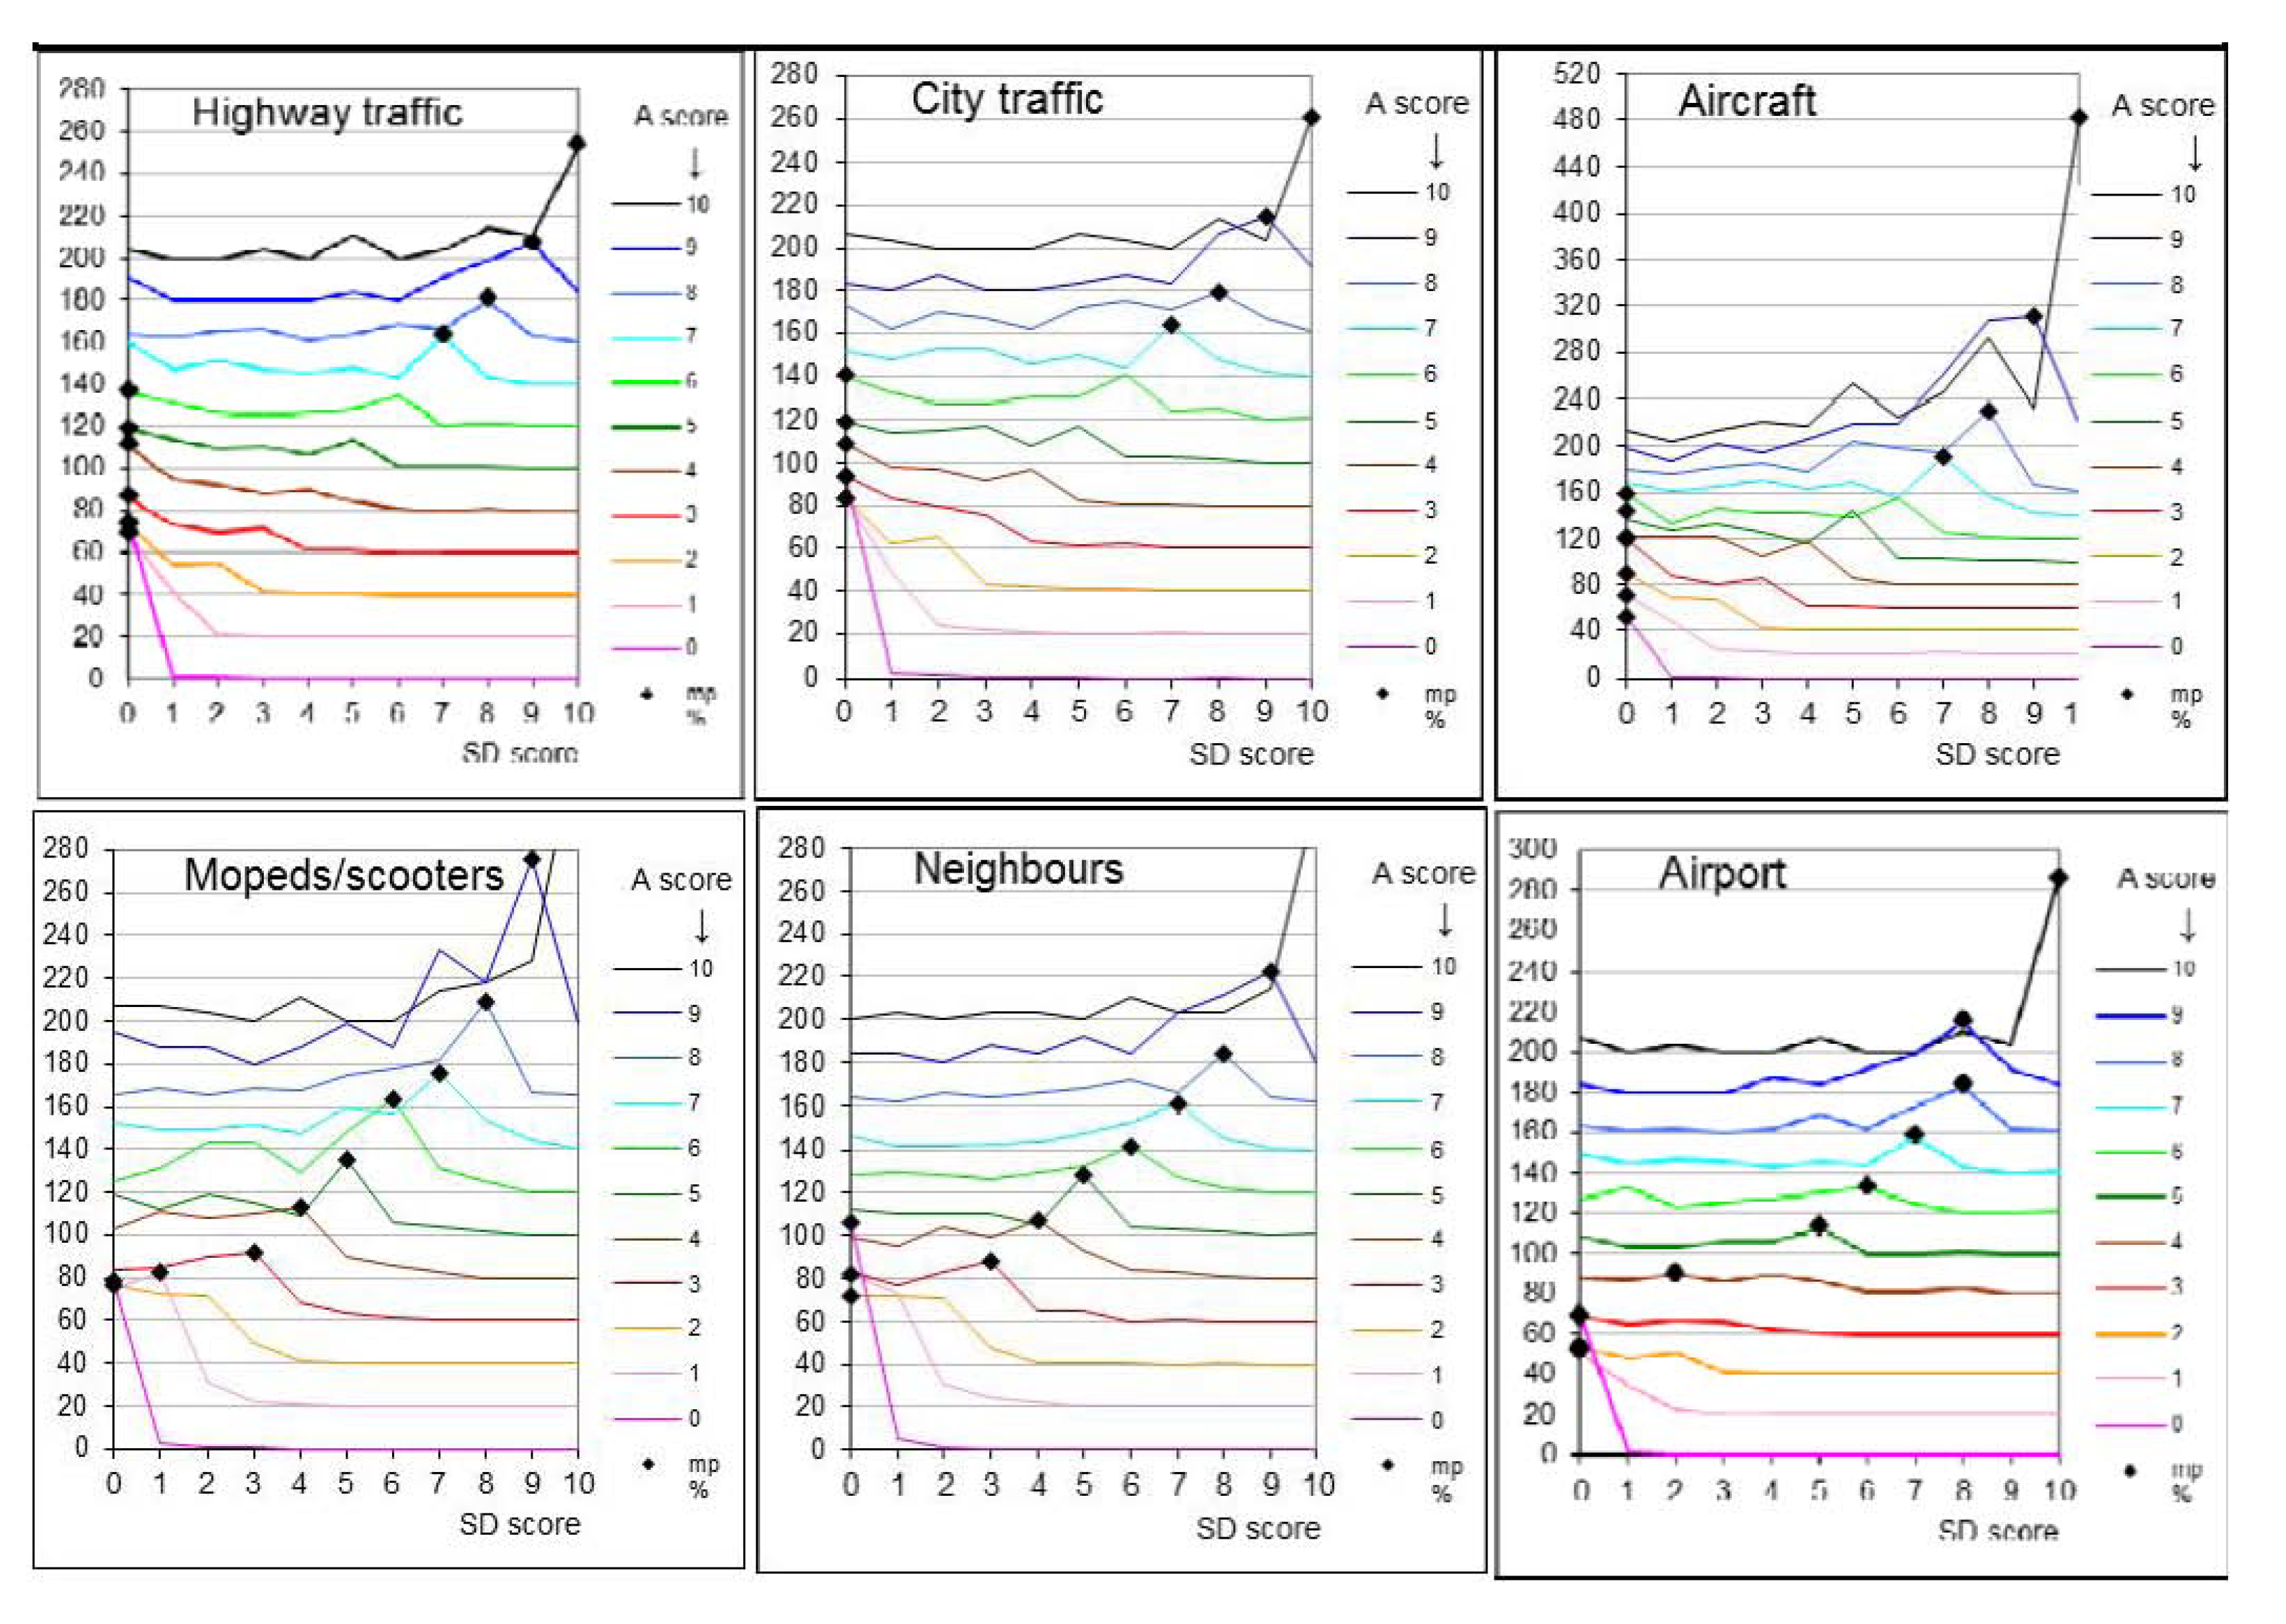
3.1. Results with Respect to Noise Source
| Noise source | # Respondents that hear source | Corr. coeff. SD vs. A | %A (4 ≤ A < 8) | %HA (8 ≤ A) | %SD (4 ≤ SD < 8) | %HSD (8 ≤ SD) |
|---|---|---|---|---|---|---|
| Aircraft | 2,589 | 0.76 | 34% | 22% | 22% | 11% |
| Scooters | 2,326 | 0.80 | 27% | 12% | 18% | 8% |
| Airport | 1,101 | 0.83 | 21% | 10% | 14% | 7% |
| City traffic (≤50 km/h) | 1,972 | 0.74 | 22% | 7% | 12% | 4% |
| Neighbours | 2,137 | 0.80 | 19% | 7% | 13% | 5% |
| Highway traffic (>50 km/h) | 1,451 | 0.75 | 24% | 7% | 11% | 4% |
| Trains | 794 | 0.84 | 14% | 5% | 9% | 2% |
| Industry/businesses | 792 | 0.83 | 10% | 3% | 6% | 3% |
| Trams/metro | 856 | 0.82 | 10% | 3% | 6% | 2% |
| Annoyed (4 ≤ A < 8) | Highly annoyed (8 ≤ A) | |||||||
|---|---|---|---|---|---|---|---|---|
| Noise source | %A | Average Aes | Average SD | Noise source | %HA | Average Aes | Average SD | |
| Scooters | 27% | 1.8 | 3.7 | Tram | 9% | 1.4 | 7.2 | |
| Neighbours | 19% | 1.6 | 3.6 | Airport | 10% | 1.6 | 7.2 | |
| Industry | 10% | 1.8 | 3.6 | Industry | 3% | 1.5 | 7.0 | |
| Airport | 21% | 2.1 | 3.5 | Neighbours | 7% | 1.8 | 7.0 | |
| Trains | 14% | 1.8 | 3.5 | Scooters | 12% | 1.8 | 6.9 | |
| Tram | 21% | 2.0 | 3.2 | Trains | 5% | 2.1 | 6.6 | |
| City traffic | 22% | 2.4 | 3.1 | City traffic | 7% | 2.2 | 6.6 | |
| Aircraft | 34% | 2.5 | 3.0 | Aircraft | 22% | 2.4 | 6.4 | |
| Highway traffic | 24% | 2.8 | 2.7 | Highway traffic | 7% | 2.5 | 6.1 | |
| Scooters | Neighbours | Industry | Airport | Trains | Tram | City traffic | Aircraft | Highway traffic | |
|---|---|---|---|---|---|---|---|---|---|
| Scooters | x | 0.10 | 0.21 | 0.23 | 0.52 | 0.67 | 0.99 | ||
| Neighbours | x | 0.17 | 0.19 | 0.48 | 0.63 | 0.95 | |||
| Industry | 0.15 | x | 0.11 | 0.13 | 0.42 | 0.57 | 0.89 | ||
| Airport | 0.30 | 0.17 | 0.15 | x | 0.40 | 0.46 | |||
| Trains | −0.33 | −0.46 | −0.48 | x | 0.38 | 0.44 | |||
| Tram | 0.33 | 0.20 | 0.18 | x | 0.09 | 0.15 | |||
| City traffic | −1.09 | −0.46 | −1.12 | x | 0.06 | 0.38 | |||
| Aircraft | −0.50 | −0.63 | −0.65 | −0.80 | −0.17 | −0.83 | 0.29 | x | 0.32 |
| Highway traffic | −0.34 | −0.47 | −0.49 | 0.45 | 0.16 | x |
3.2. Influence of Individual Characteristics
| Noise type → Characteristic | Highway Traffic | City Traffic | Aircraft |
|---|---|---|---|
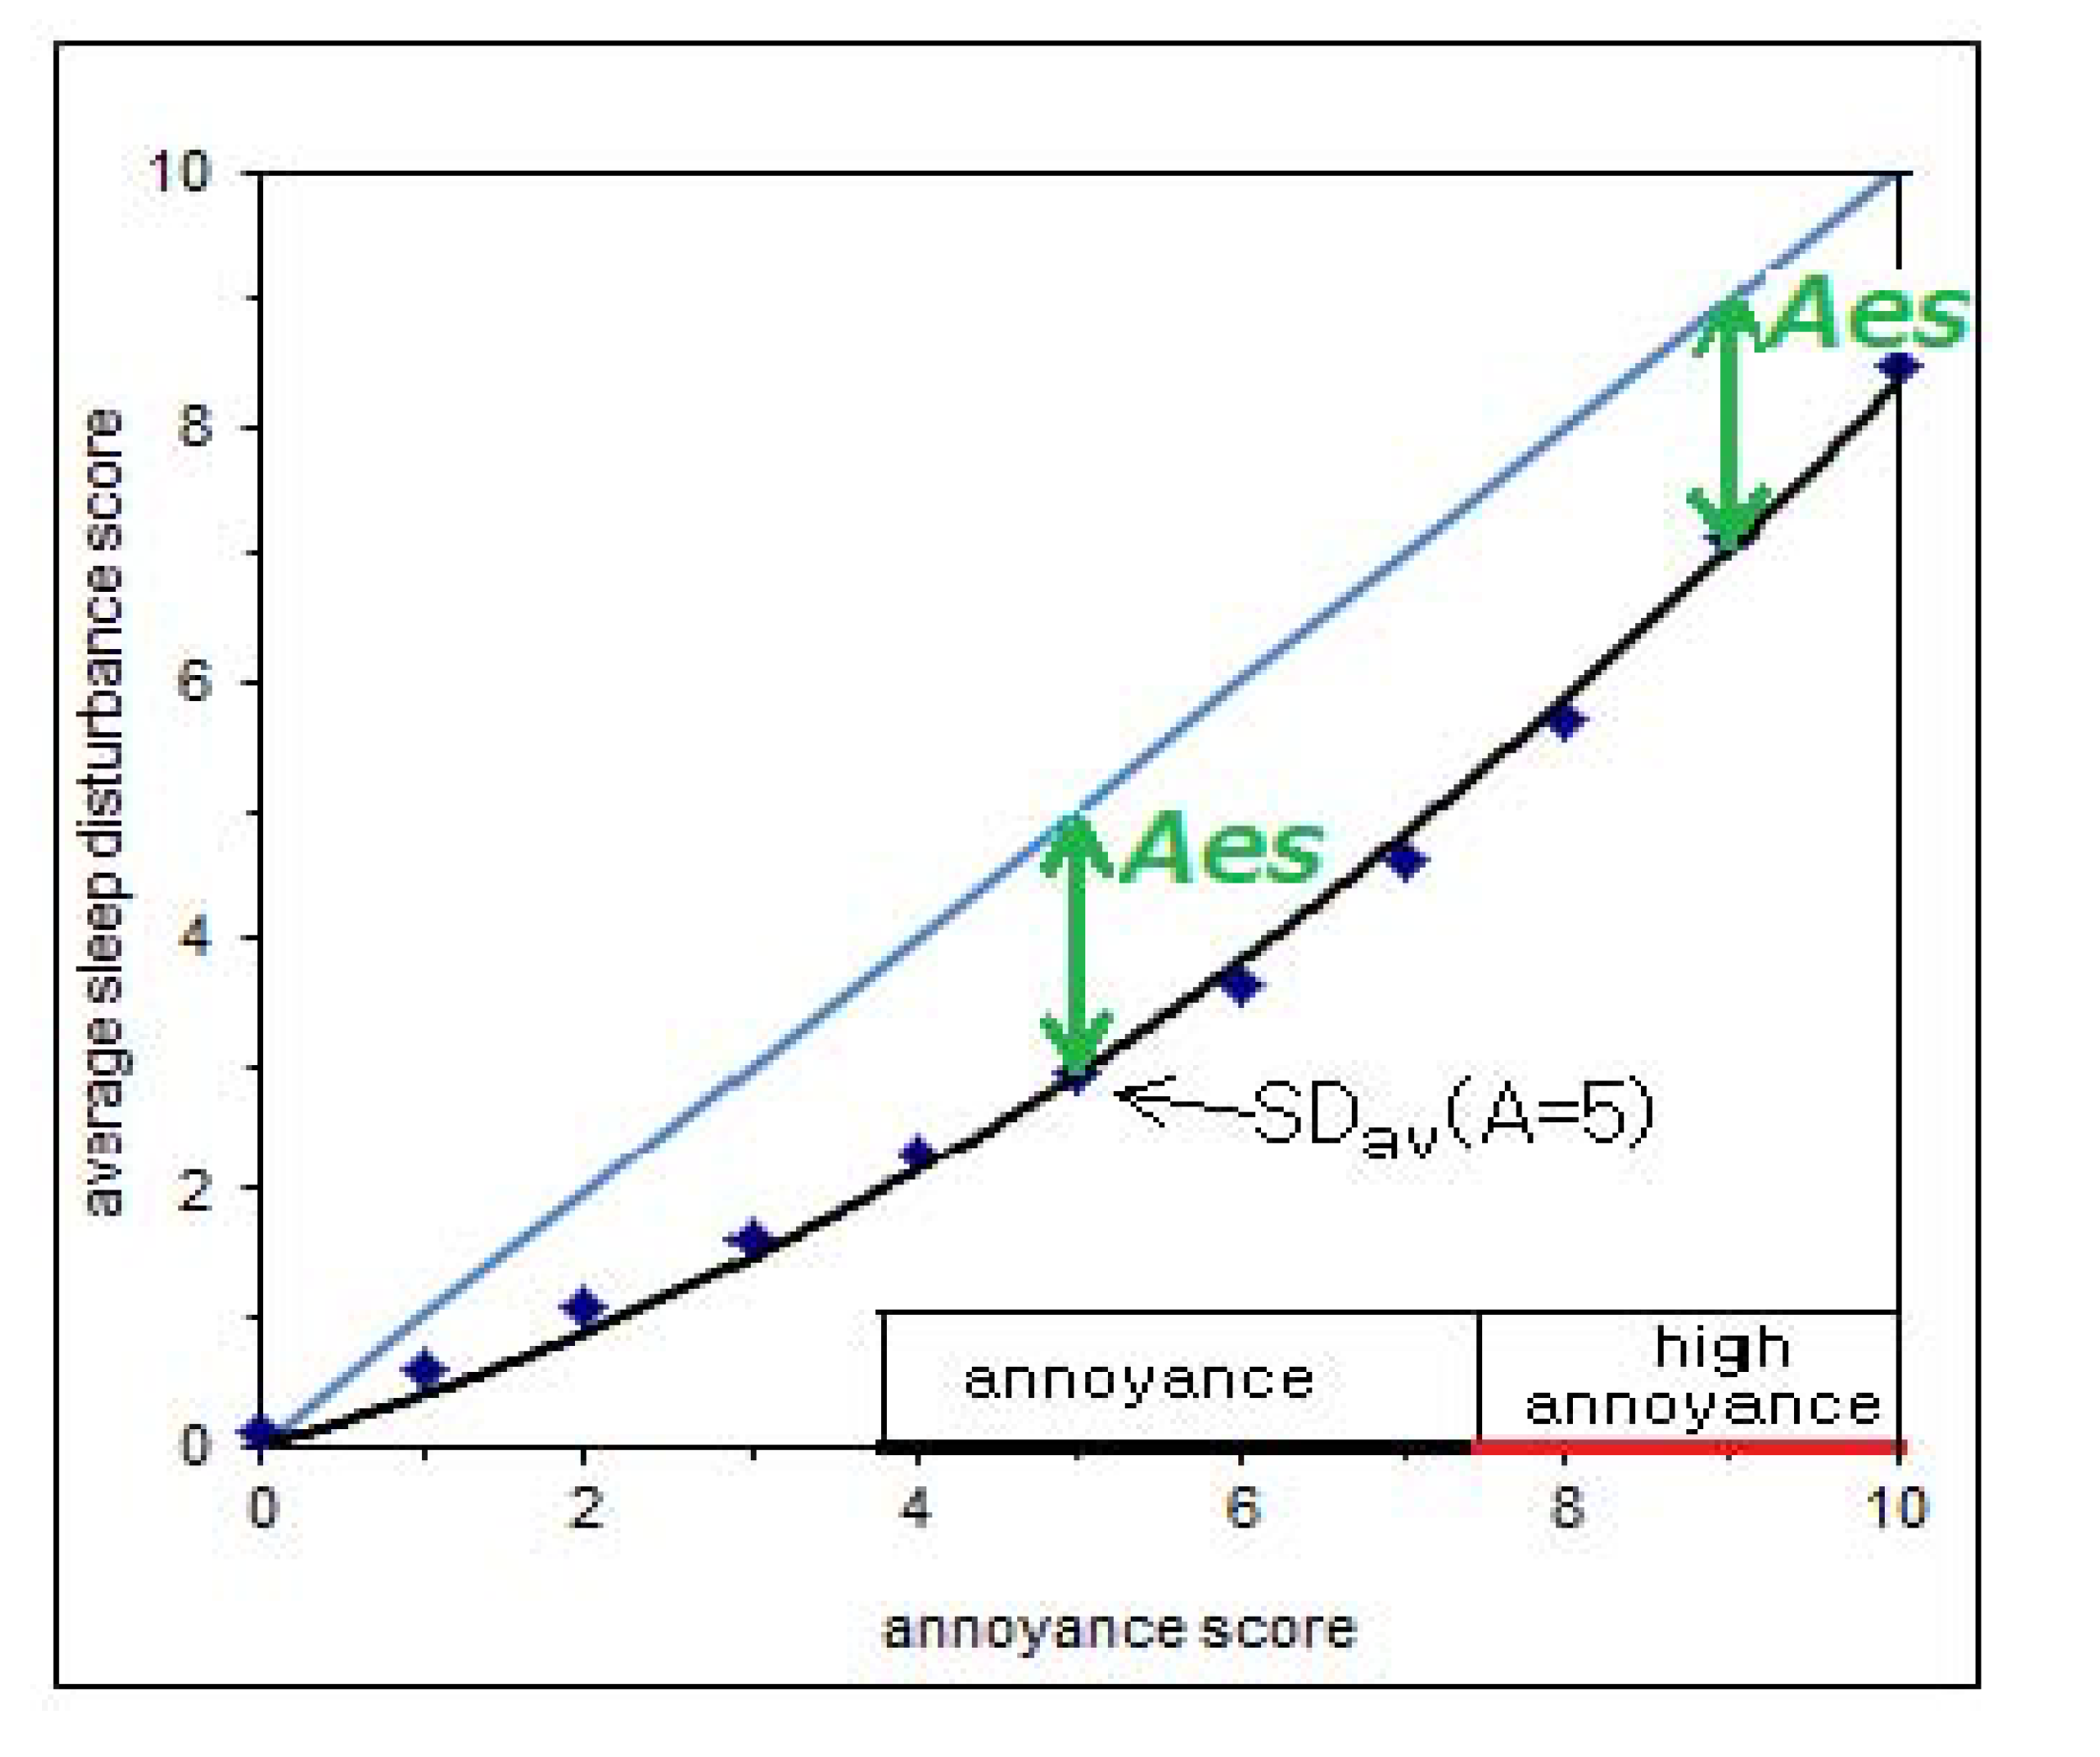
| Aes (= A − SDav) | |||
| Gender (male-female) | 0.2 | ||
| Age (19/64–65+) | 0.8 | 0.5 | 0.5 |
| Perceived health (good-bad) | 0.4 | ||
| Use of sleeping drugs (high-low) | −0.5 | −0.4 | −0.5 |
| Living alone (yes-no) | −0.3 | −0.4 | |
4. Discussion
5. Conclusion
Acknowledgements
Author Contributions
Conflicts of Interest
References
- WHO. Guidelines for Community Noise; World Health Organization (Geneva) and Institute of Environmental Epidemiology: Singapore, Singapore, 1999. [Google Scholar]
- WHO Regional Office for Europe. Night Noise Guidelines for Europe; WHO Regional Office for Europe: Copenhagen, Denmark, 2009. [Google Scholar]
- Miedema, H.M.E.; Vos, H. Exposure-response relationships for transportation noise. J. Acoust. Soc. Am. 1998, 104, 3432–3445. [Google Scholar] [CrossRef]
- Miedema, H.M.E.; Vos, H. Associations between self-reported sleep disturbance and environmental noise based on reanalyses of pooled data from 24 studies. Behav. Sleep Med. 2007, 5, 1–20. [Google Scholar] [CrossRef]
- Langdon, F.J.; Buller, I.B. Road traffic noise and disturbance to sleep. J. Sound Vib. 1978, 50, 13–28. [Google Scholar] [CrossRef]
- Muzet, A. Environmental noise, sleep and health. Sleep Med. Rev. 2007, 11, 135–142. [Google Scholar] [CrossRef]
- Basner, M.; Muller, U.; Elmenhorst, E.M. Single and combined effects of air, road, and rail traffic noise on sleep and recuperation. Sleep 2011, 34, 11–23. [Google Scholar]
- Eberhardt, J.L. The influence of road traffic noise on sleep. J. Sound Vib. 1988, 127, 449–455. [Google Scholar] [CrossRef]
- Pennig, S.; Quehl, J.; Mueller, U.; Rolny, V.; Maass, H.; Basner, M.; Elmenhorst, E. Annoyance and self-reported sleep disturbance due to night-time railway noise examined in the field. J. Acoust. Soc. Am. 2012, 132, 3109–3117. [Google Scholar] [CrossRef]
- Fyhri, A.; Aasvang, G.M. Noise, sleep and poor health: Modeling the relationship between road traffic noise and cardiovascular problems. Sci. Total Environ. 2010, 408, 4935–4942. [Google Scholar] [CrossRef]
- Eberhardt, J.L.; Akselsson, K.R. The disturbance by road traffic noise of the sleep of young male adults as recorded in the home. J. Sound Vib. 1987, 114, 417–434. [Google Scholar]
- Pennig, S.; Quehl, J.; Mueller, U.; Rolny, V.; Maass, H.; Basner, M.; Elmenhorst, E. Annoyance and self-reported sleep disturbance due to night-time railway noise examined in the field. J. Acoust. Soc. Am. 2012, 132, 3109–3117. [Google Scholar] [CrossRef]
- Björkman, M.; Åhrlin, U.; Rylander, R. Aircraft noise annoyance and average versus maximum noise levels. Arch. Environm. Health 1992, 47, 326–329. [Google Scholar] [CrossRef]
- Kuwano, S.; Mizunami, T.; Namba, S.; Morinaga, M. The effect of different kinds of noise on the Quality of sleep under the controlled conditions. J. Sound Vib. 2002, 250, 83–90. [Google Scholar] [CrossRef]
- Cacioppa, J.T.; Hawkley, L.C.; Berntson, C.G.; Ernst, J.M.; Gibbs, A.C.; Stickgold, R.; Hobson, J.A. Do lonely days invade the night? Potential social modulation of sleep efficiency. Psychol. Sci. 2002, 13, 384–387. [Google Scholar]
- Nivison, M.E.; Endresen, I.M. An analysis of relationships among environmental noise, annoyance and sensitivity to noise, and the consequences for health and sleep. J. Behav. Med. 1993, 16, 257–276. [Google Scholar] [CrossRef]
- Technical Specification, Acoustics-Assessment of Noise Annoyance by Means of Social and Socio-acoustic Surveys; ISO/TS 15666; International Organization for Standardization: Geneva, Switzerland, 2003.
- Schultz, T.J. Synthesis of social surveys on noise annoyance. J. Acoust. Soc. Am. 1978, 64, 377–405. [Google Scholar] [CrossRef]
- Miedema, H.M.E.; Oudshoorn, C.G.M. Annoyance from transportation noise: Relationships with exposure metrics DNL and DENL and their confidence intervals. Environ. Health Perspect. 2001, 109, 409–416. [Google Scholar] [CrossRef]
- Uitenbroek, D.G. Binomial SISA, 1997. Available online: www.quantitativeskills.com/sisa/statistics/Rno.htm (accessed on 17 February 2014).
- Bland, J.M.; Altman, D.G. Statistical methods for assessing agreement between two methods of clinical measurement. Lancet 1986, 327, 307–310. [Google Scholar] [CrossRef]
- Van den Berg, F.; Janssen, A. Are Survey Questions on Annoyance and Sleep Disturbance Really Different? In Proceedings of Euronoise, Prague, Czech Republic, 10–13 June 2012.
- Pedersen, E.; van den Berg, F.; Bakker, R.; Bouma, J. Response to noise from modern wind farms in The Netherlands. J. Acoust. Soc. Am. 2009, 126, 634–643. [Google Scholar] [CrossRef]
- Brink, M.; Omlin, S.; Müller, C.; Pieren, R.; Basner, M. An event-related analysis of awakening reactions due to nocturnal church bell noise. Sci. Total Environ. 2011, 409, 5210–5220. [Google Scholar] [CrossRef]
- Miedema, H.M.E.; Vos, H. Demographic and attitudinal factors that modify annoyance from transportation noise. J. Acoust. Soc. Am. 1999, 105, 3336–3346. [Google Scholar] [CrossRef]
- Yu, L.; Buysse, D.J.; Germain, A.; Moul, D.E.; Stover, A.; Dodds, N.E.; Johnston, K.L.; Pilkonis, P.A. Development of short forms from the PROMIS sleep disturbance and sleep-related impairment item banks. Behav. Sleep Med. 2011, 10, 6–24. [Google Scholar]
© 2014 by the authors; licensee MDPI, Basel, Switzerland. This article is an open access article distributed under the terms and conditions of the Creative Commons Attribution license (http://creativecommons.org/licenses/by/3.0/).
Share and Cite
Van den Berg, F.; Verhagen, C.; Uitenbroek, D. The Relation between Scores on Noise Annoyance and Noise Disturbed Sleep in a Public Health Survey. Int. J. Environ. Res. Public Health 2014, 11, 2314-2327. https://doi.org/10.3390/ijerph110202314
Van den Berg F, Verhagen C, Uitenbroek D. The Relation between Scores on Noise Annoyance and Noise Disturbed Sleep in a Public Health Survey. International Journal of Environmental Research and Public Health. 2014; 11(2):2314-2327. https://doi.org/10.3390/ijerph110202314
Chicago/Turabian StyleVan den Berg, Frits, Claudia Verhagen, and Daan Uitenbroek. 2014. "The Relation between Scores on Noise Annoyance and Noise Disturbed Sleep in a Public Health Survey" International Journal of Environmental Research and Public Health 11, no. 2: 2314-2327. https://doi.org/10.3390/ijerph110202314
APA StyleVan den Berg, F., Verhagen, C., & Uitenbroek, D. (2014). The Relation between Scores on Noise Annoyance and Noise Disturbed Sleep in a Public Health Survey. International Journal of Environmental Research and Public Health, 11(2), 2314-2327. https://doi.org/10.3390/ijerph110202314