Risk Factors of CVD Mortality among the Elderly in Beijing, 1992 – 2009: An 18-year Cohort Study


Abstract
:1. Introduction
2. Methods
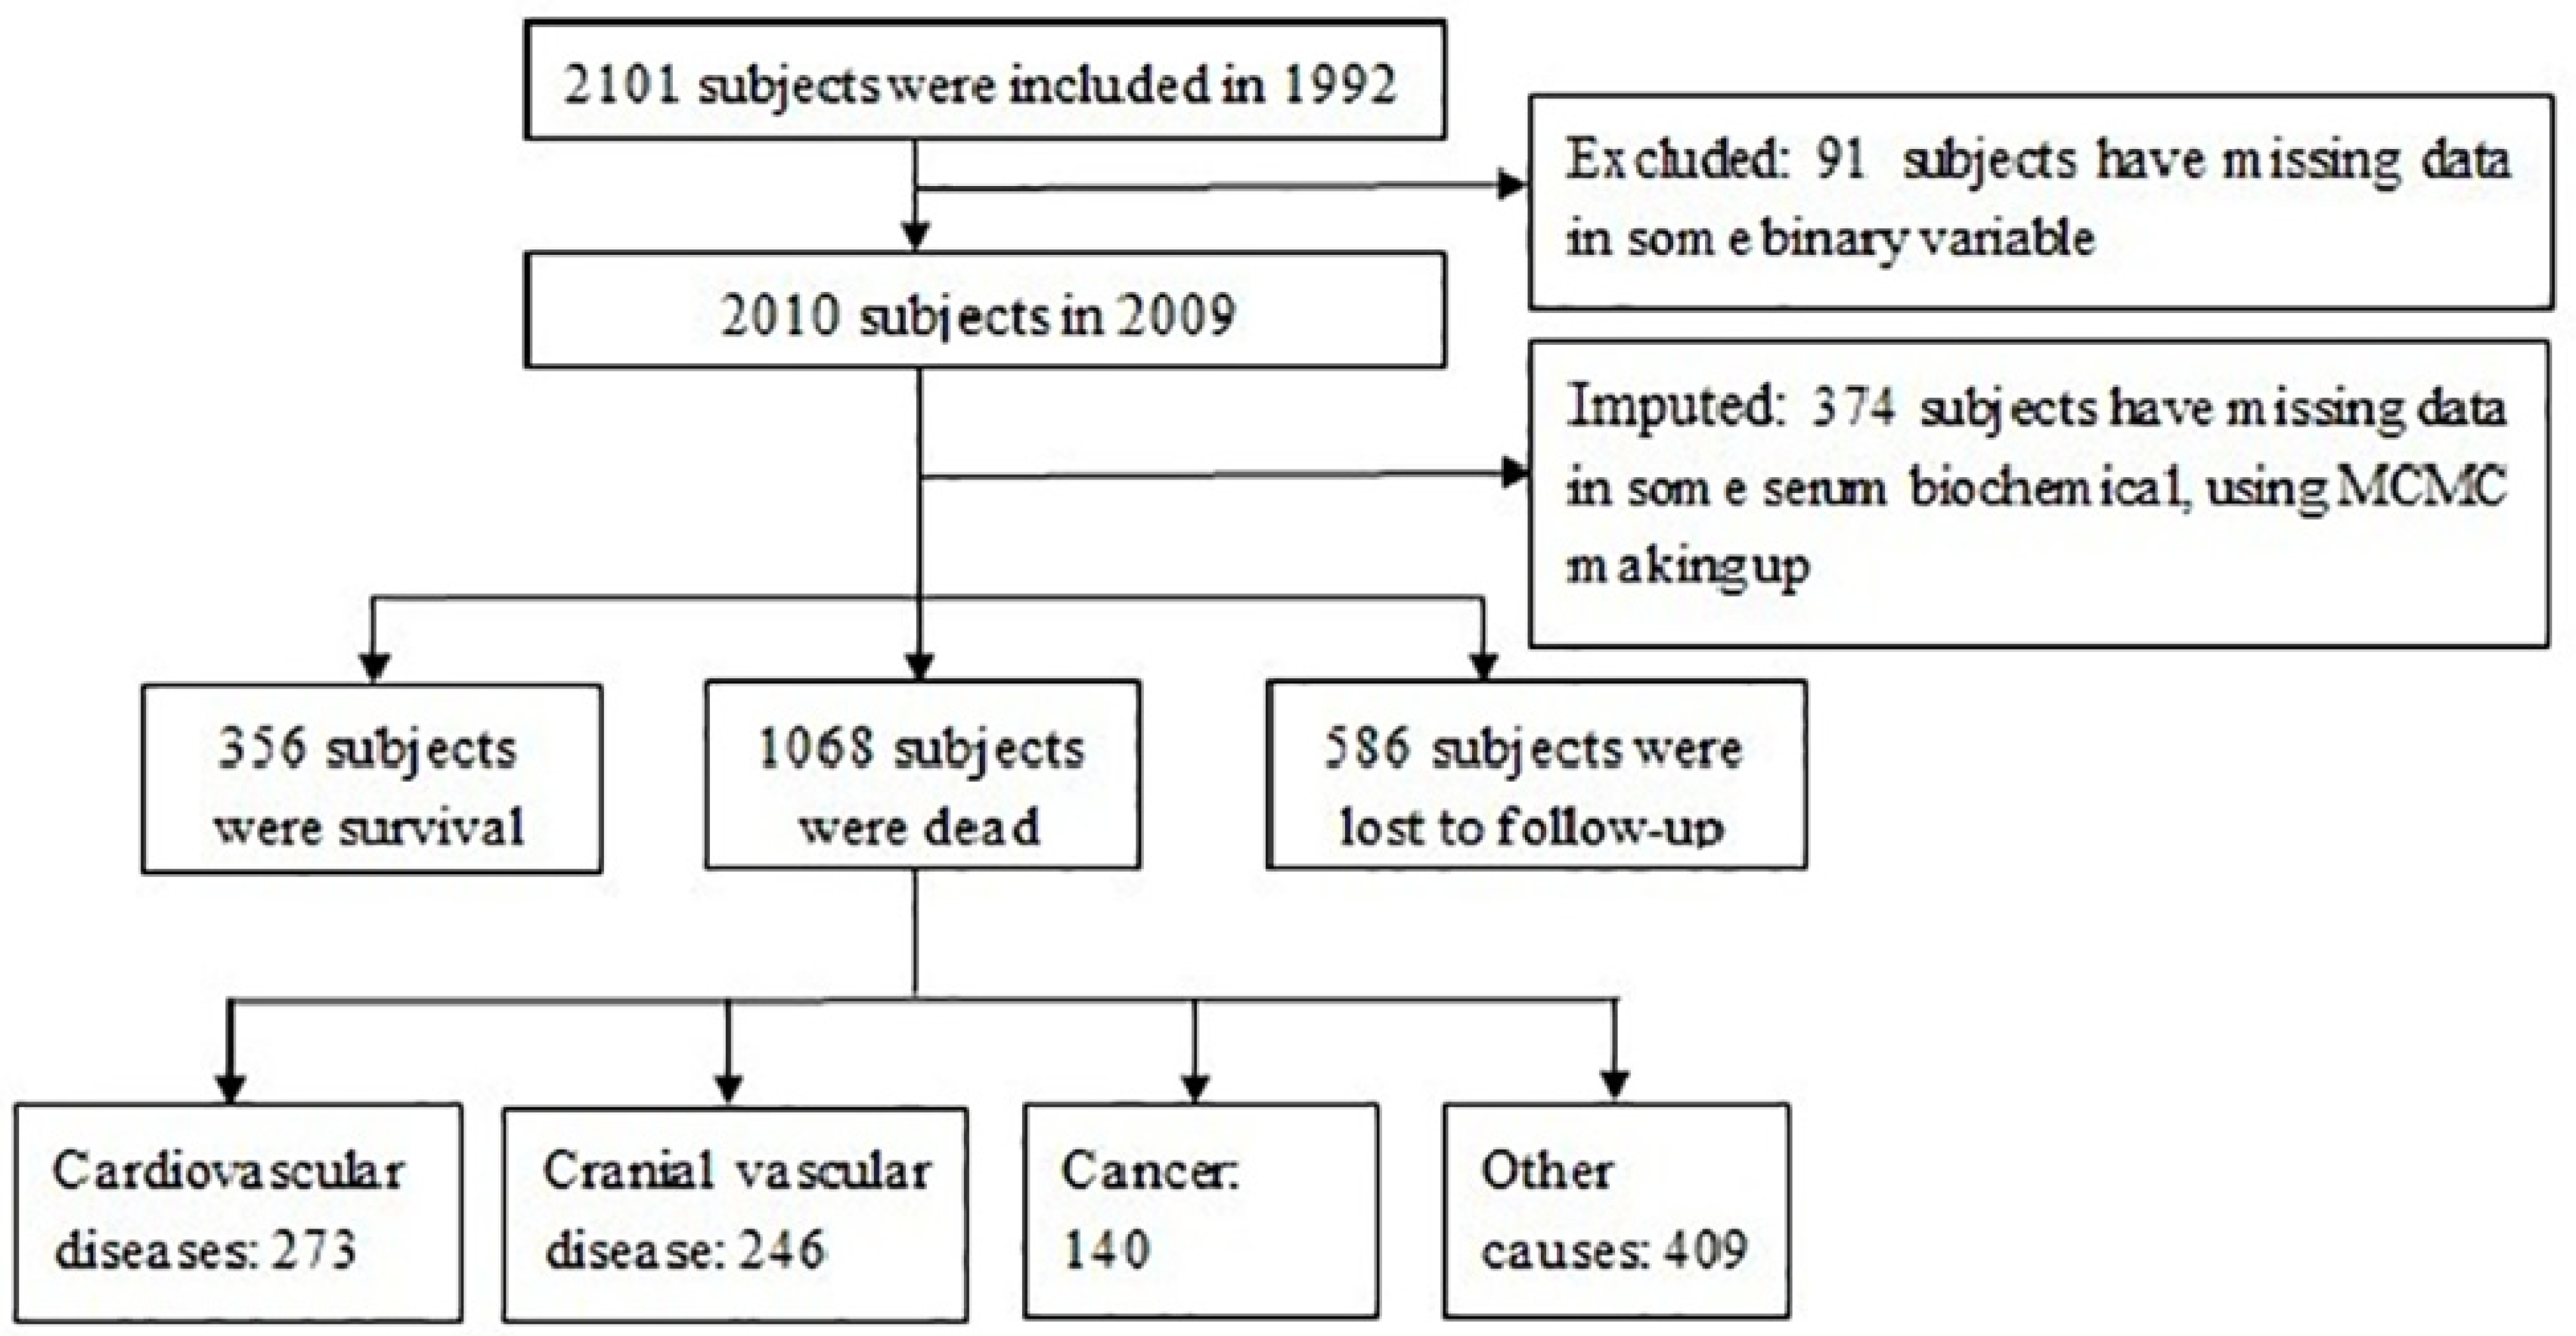
2.1. Study Design and Population
2.2. Assessment of Risk Factors
2.3. Ascertainment of Mortality
2.4. Statistical Analysis
3. Results
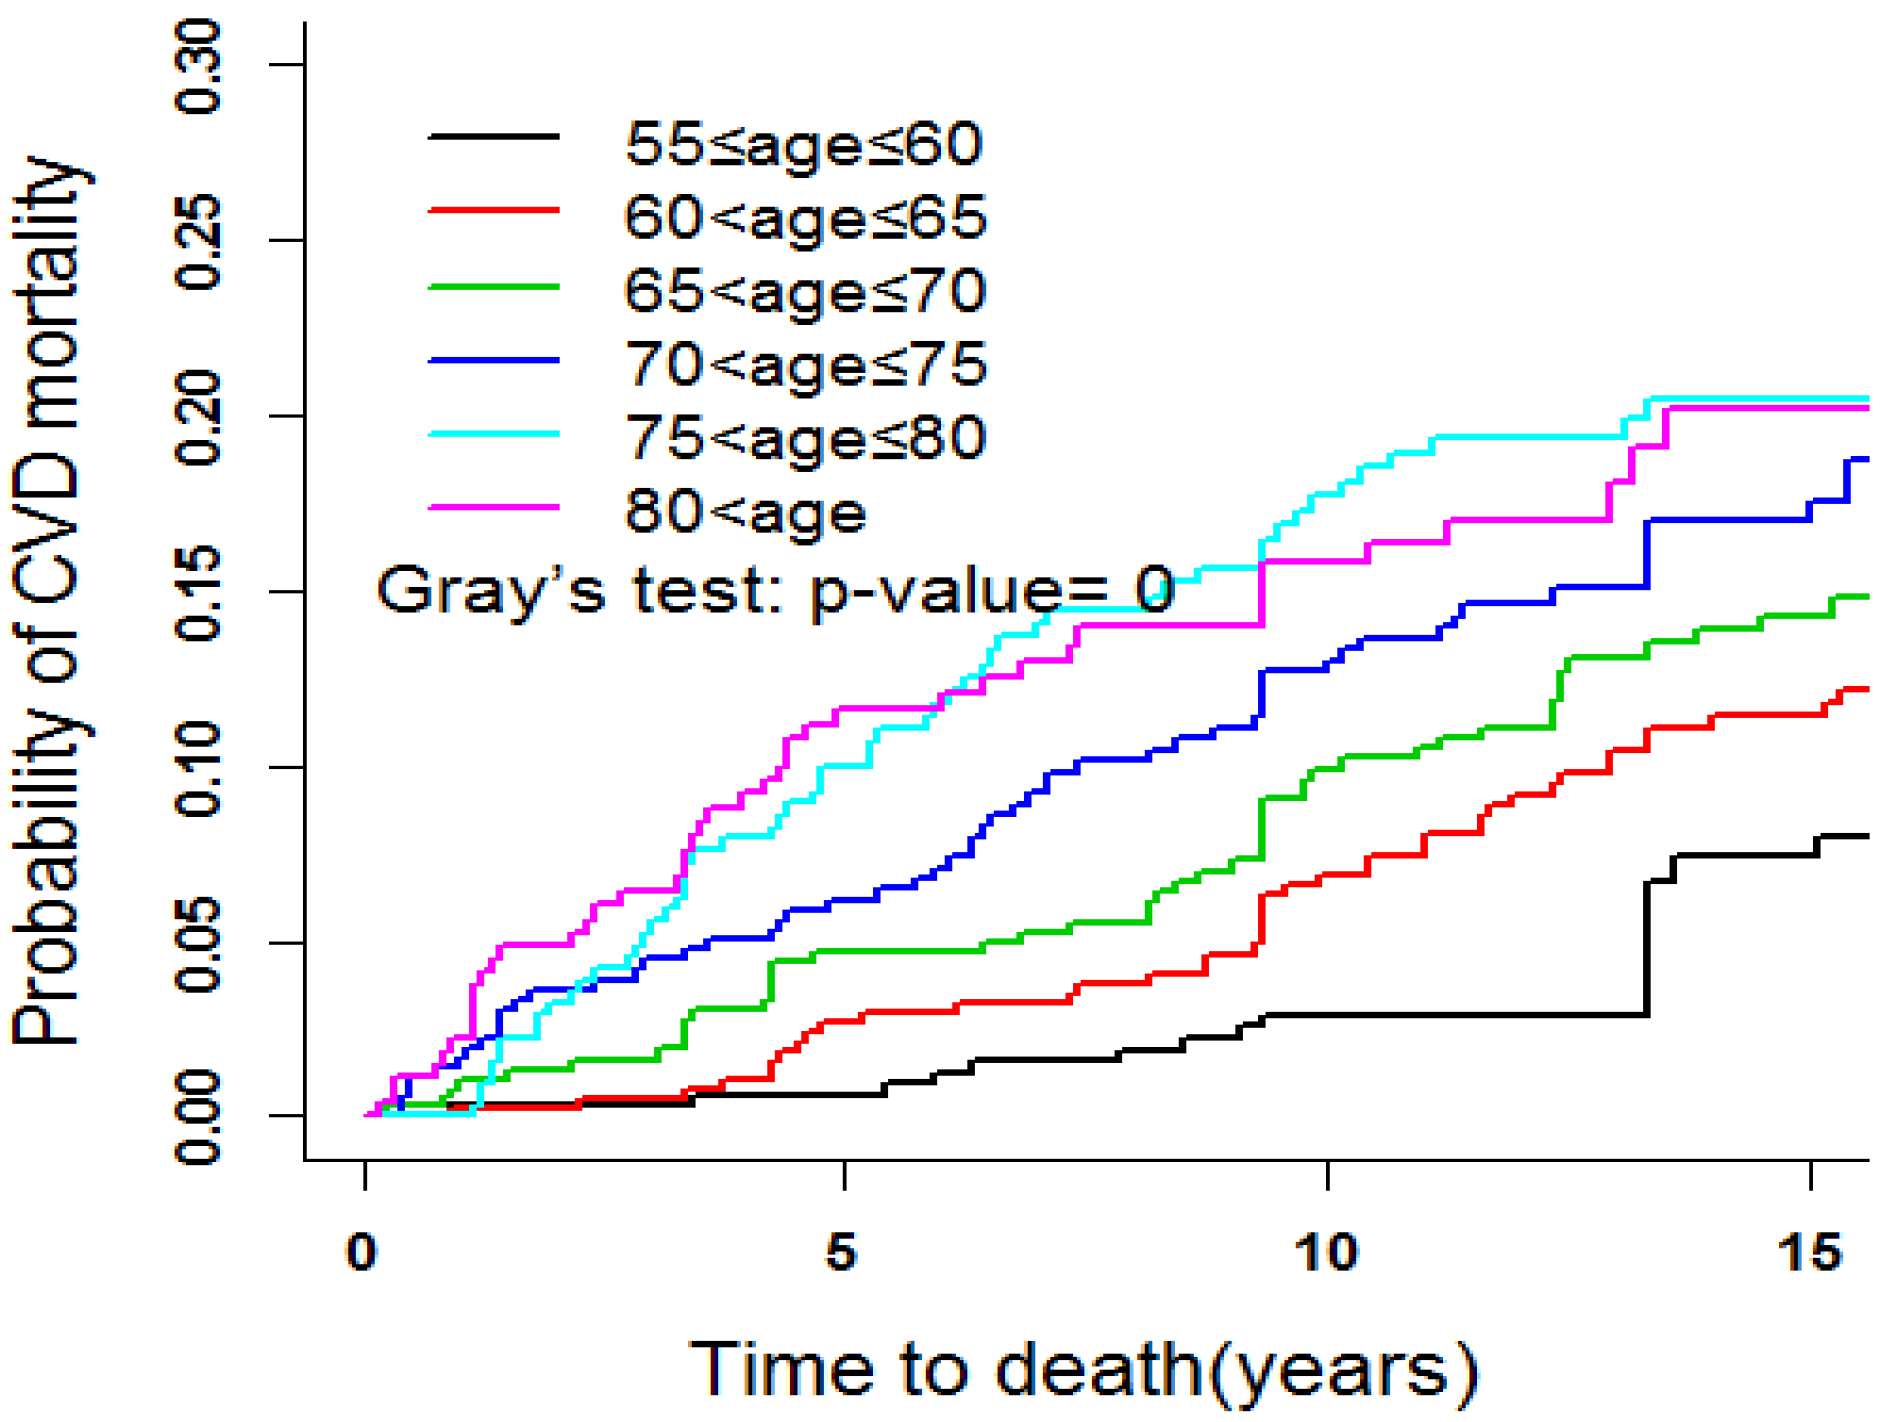
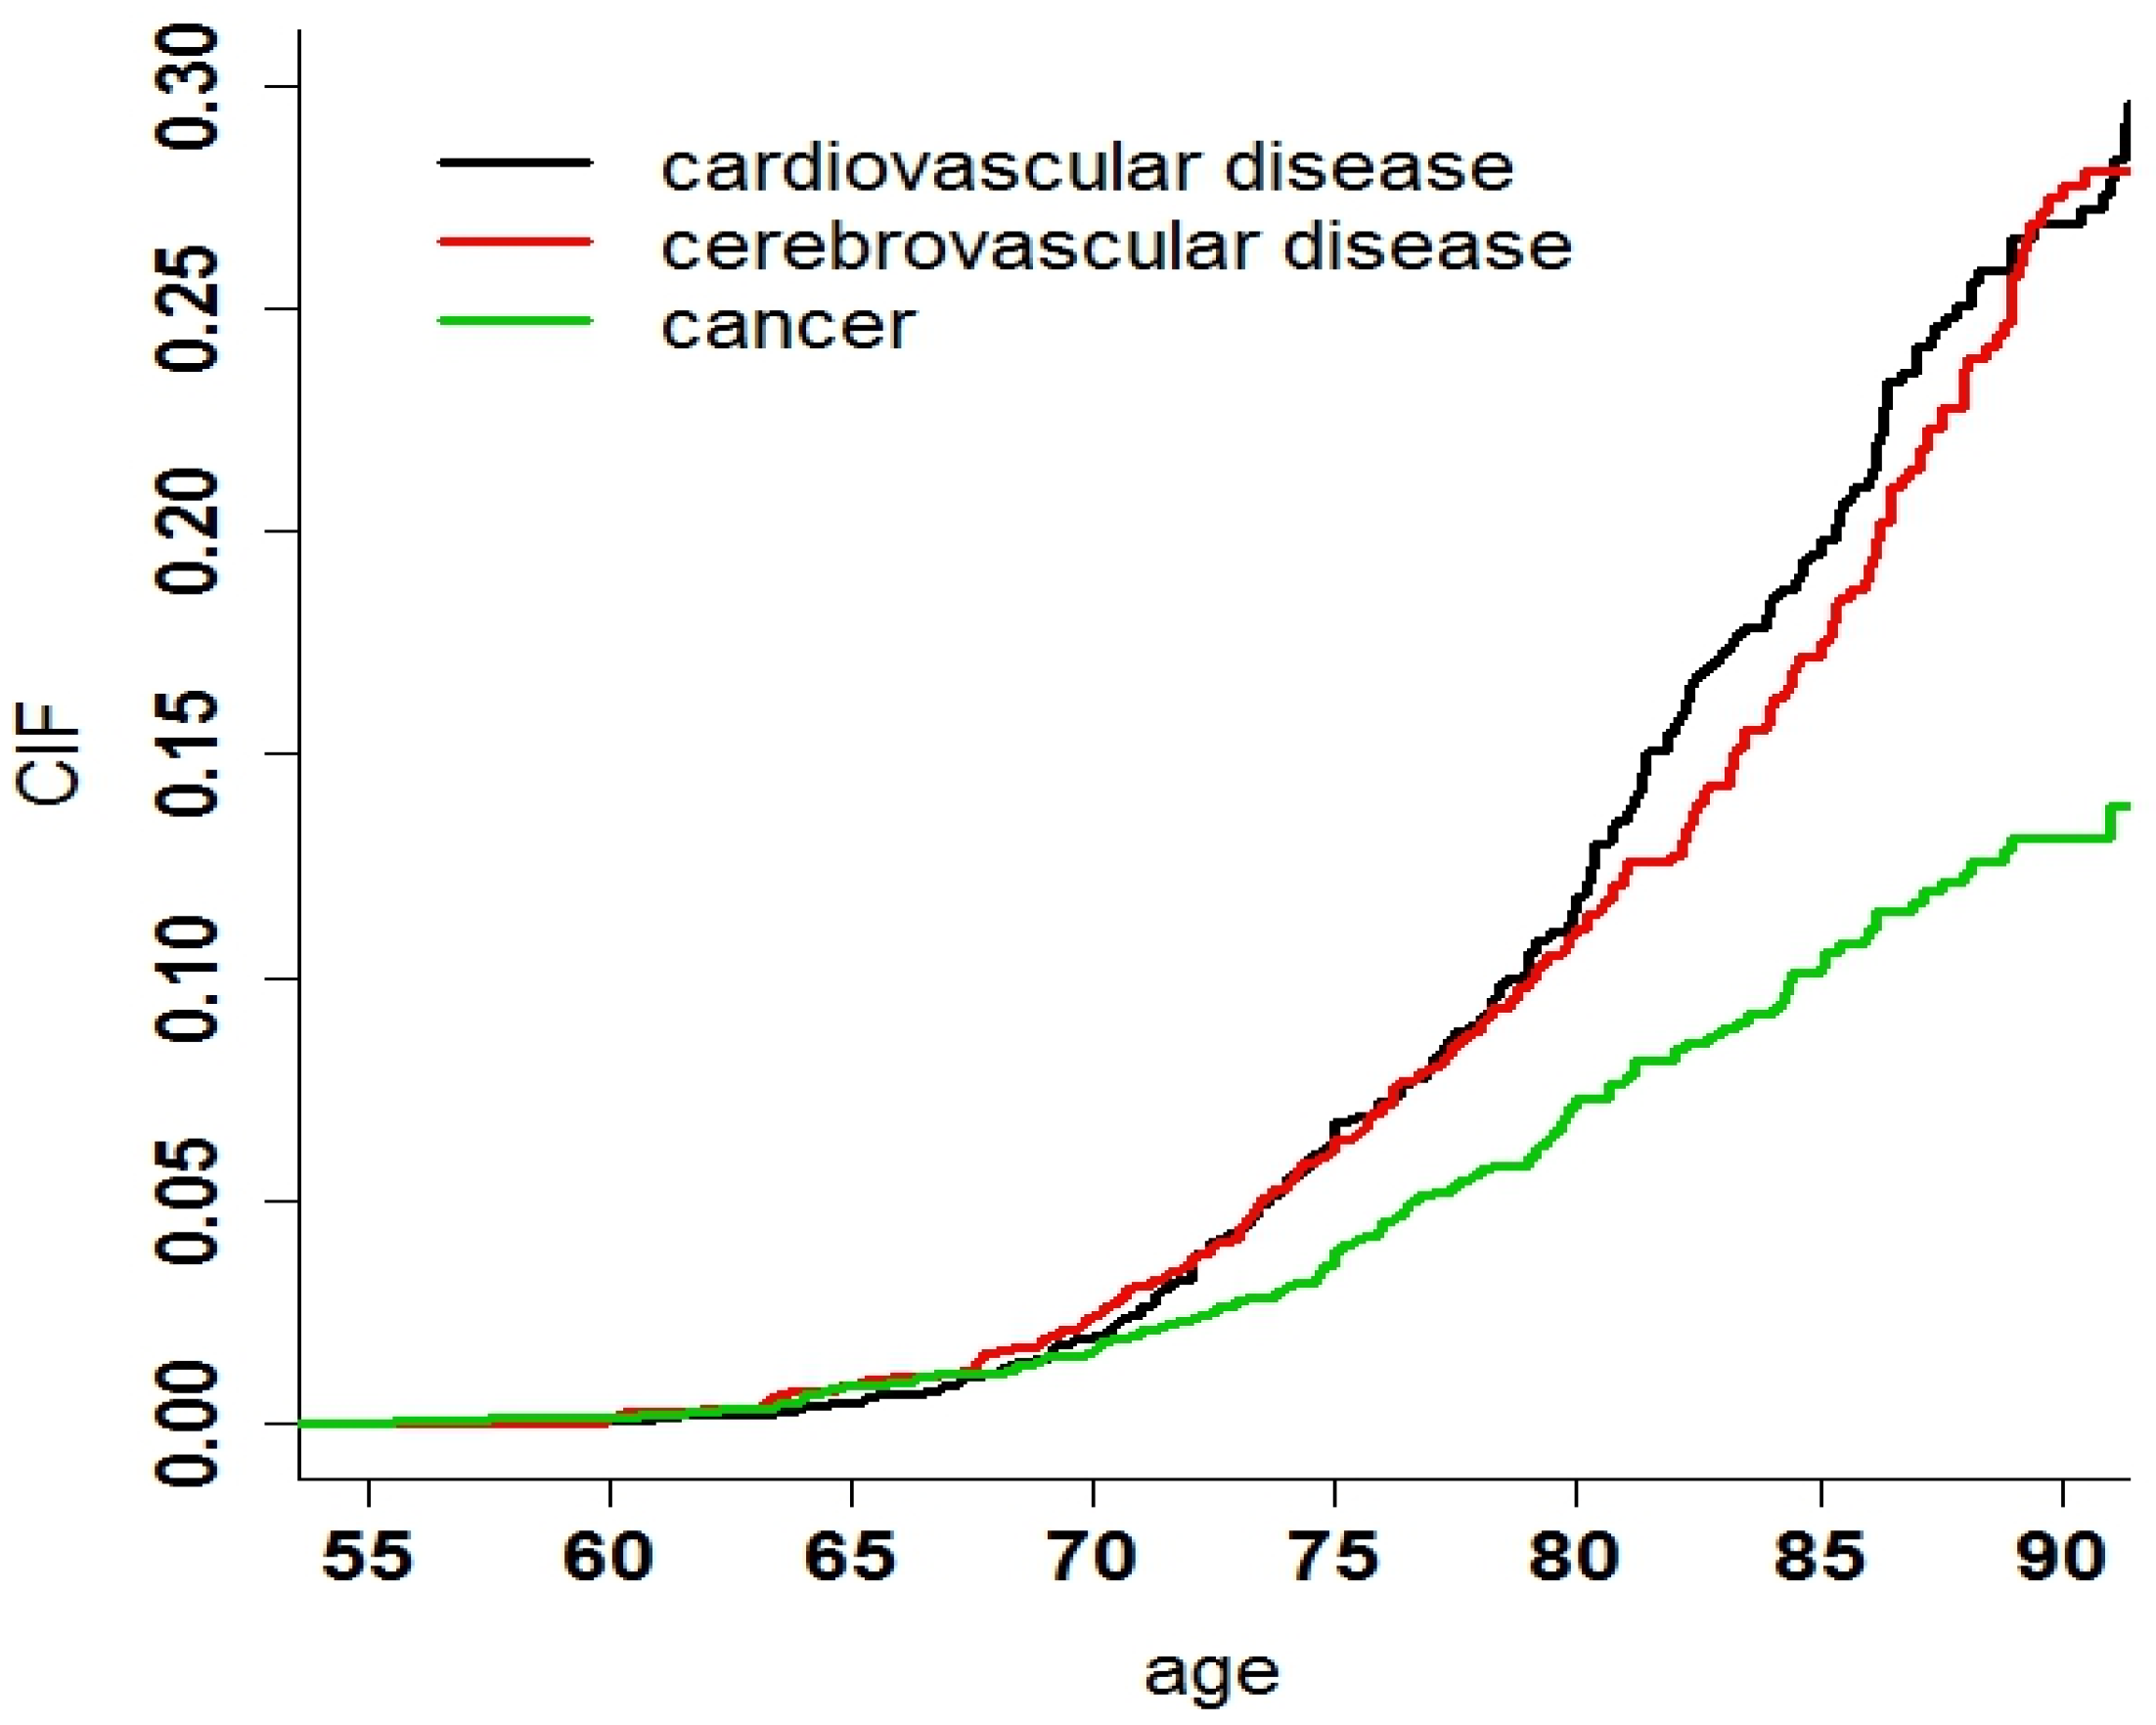
3.1. Basic Characteristics and the CIF of Death

| Characteristic | Total Subjects (%) | Total Deaths (%) | CVD Deaths (%) | |
|---|---|---|---|---|
| Total | 2,010 (100) | 1,068 (100) | 273 (100) | |
| Gender | male | 987 (49.104) | 545 (51.030) | 133 (48.718) |
| female | 1,023 (50.509) | 523 (48.970) | 140 (51.282) | |
| Age group | 55–65 | 705 (35.075) | 246(23.034) | 67 (24.542) |
| 66–75 | 728 (36.219) | 408(38.202) | 106 (38.828) | |
| ≥76 | 577 (28.706) | 414 (38.764) | 100 (36.630) | |
| Smoke | no | 593 (29.502) | 738 (69.101) | 83 (30.403) |
| yes | 1,417 (70.498) | 330 ( 30.899) | 190 (69.597) | |
| Drink | no | 1,569 (78.060) | 832 (42.24) | 222 (81.319) |
| yes | 441 (21.940) | 236 (22.097) | 51 (18.681) | |
| Depression | no | 1,649 (82.040) | 849 (79.494) | 215 (78.755) |
| yes | 361 (17.960) | 219 (20.506) | 58 (21.245) | |
| Sad event | no | 1,364 (67.861) | 724 (67.790) | 177 (64.835) |
| yes | 646 (32.139) | 344 (32.210) | 96 (35.165) | |
| Exercise | no | 806 (40.100) | 419 (39.232) | 111 (40.659) |
| yes | 1,204 (59.900) | 649 (60.768) | 162 (59.341) | |
| BADL | normal | 1,936 (74.378) | 1,010 (94.570) | 264 (96.703) |
| disability | 74 (25.622) | 58 (5.431) | 9 (3.297) | |
| IADL | normal | 1,495 (74.378) | 696 (65.169) | 183 (67.033) |
| disability | 515 (25.622) | 372 (34.831) | 90 (32.967) | |
| Marital | have a spouse | 1,354 (67.363) | 645 (60.393) | 135 (49.451) |
| mateless | 656 (32.637) | 423 (39.607) | 90 (32.967) | |
| Self-report | health | 1,639 (81.542) | 826 (77.341) | 211 (77.289) |
| not health | 371 (18.458) | 242 (22.659) | 62 (22.711) | |
| Diabetes | abnormal | 1,698 (84.478) | 876 (82.022) | 222 (80.889) |
| normal | 312 (15.522) | 192 (17.978) | 51 (19.111) | |
| Blood lipid | abnormal | 500 (24.876) | 251 (23.502) | 65 (24.4) |
| normal | 1,510 (75.124) | 817 (76.498) | 208 (75.6) | |
| BP | Sbp ≤ 120 or dbp ≤ 80 | 551 (27.413) | 245 (22.940) | 60 (21.978) |
| Sbp > 120 or dbp > 80 | 255 (12.687) | 106 (9.925) | 22 (8.059) | |
| Sbp ≥ 140 or dbp ≥ 90 | 1,240 (61.692) | 717 (67.135) | 191 (69.963) | |
| Education | college or above | 137 (6.816) | 48 (4.494) | 13 (4.762) |
| high school | 96 (4.776) | 34 (3.184) | 14 (5.128) | |
| junior diploma | 165 (8.209) | 73 (6.835) | 18 (6.593) | |
| primary school | 579 (28.806) | 283 (26.498) | 64 (23.443) | |
| illiterate | 1,033 (51.393) | 630 (58.989) | 164 (64.073) | |
| BMI | normal | 1,102 (54.826) | 579 (54.213) | 155 (56.777) |
| thin | 376 (18.706) | 239 (22.378) | 58 (21.245) | |
| overweight | 276 (13.731) | 118 (11.049) | 26 (9.524) | |
| obesity | 256 (12.736) | 132 (12.360) | 34 (12.454) | |
| Residence | rural | 283 (14.080) | 168 (15.730) | 50 (18.315) |
| suburban | 508 (25.274) | 338 (31.648) | 58 (21.245) | |
| urban | 1,219 (60.647) | 562 (52.622) | 165 (60.440) | |
| Diet | intermediate-type diet | 1,016 (50.547) | 569 (53.277) | 131 (47.985) |
| sufficient nutrients | 693 (34.478) | 300 (28.090) | 85 (31.136) | |
| meat based diet | 301 (14.975) | 199 (18.633) | 57 (20.879) |

3.2. Competing Risk Model
| Variables | Univariate Analysis | Multivariate Analysis | ||||
| HR | 95%CI | p value | HR | 95%CI | p value | |
| Gender (male) | 0.530 | 0.732–1.171 | 0.530 | - | - | - |
| Height | 0.989 | 0.976–1.011 | 0.120 | 1.006 | 0.989–1.023 | 0.491 |
| Depression (normal) | 0.977 | 0.756–1.262 | 0.150 | 1.102 | 0.800–1.518 | 0.546 |
| Smoking (no-smoke) | 0.908 | 0.966–1.887 | 0.861 | - | - | - |
| Drink (no-drink) | 1.270 | 0.942–1.723 | 0.122 | 1.215 | 0.876–1.686 | 0.238 |
| Sad-event (experienced) | 0.887 | 0.693–1.141 | 0.341 | - | - | - |
| Exercise (always) | 0.996 | 0.783–1.274 | 0.983 | - | - | - |
| BADL (can take care) | 0.915 | 0.465–1.798 | 0.824 | - | - | - |
| IADL (can take care) | 1.540 | 1.231–1.990 | <0.001 | 1.172 | 0.860–1.596 | 0.320 |
| Marital status ( have a spouse) | 1.370 | 1.073–1.754 | 0.011 | 0.998 | 0.730–1.336 | 0.939 |
| Assessment of health (normal) | 1.340 | 1.011–1.790 | 0.043 | 1.141 | 0.831–1.568 | 0.410 |
| Blood lipid (normal) | 0.932 | 0.707–1.232 | 0.621 | - | - | - |
| Diabetes (normal) | 1.290 | 0.954–1.741 | 0.100 | 1.332 | 0.972–1.823 | 0.074 |
| Age-group (55–65) | ||||||
| 66–75 | 1.122 | 0.883–1.431 | 0.341 | 1.511 | 1.111–2.055 | 0.008 |
| ≥76 | 1.692 | 1.321–2.164 | <0.001 | 1.847 | 1.256–2.717 | 0.002 |
| Blood-pressure (normal) | ||||||
| Sbp > 120 or dbp > 80 | 0.577 | 0.374–0.889 | 0.013 | 0.799 | 0.488–1.308 | 0.370 |
| Sbp ≥ 140 or dbp ≥ 90 | 1.620 | 1.260–2.133 | <0.001 | 1.407 | 1.031–1.920 | 0.032 |
| Education level (graduate) | ||||||
| high school diploma | 1.150 | 0.675–1.960 | 0.610 | 1.519 | 0.715–3.228 | 0.280 |
| Junior diploma | 0.748 | 0.468–1.191 | 0.220 | 1.102 | 0.535–2.267 | 0.769 |
| primary school | 0.745 | 0.564–0.984 | 0.038 | 1.129 | 0.603–2.113 | 0.701 |
| Illiterate | 1.450 | 1.141–1.840 | <0.001 | 1.525 | 0.815–2.853 | 0.189 |
| Body-mass-index (normal) | ||||||
| thin | 1.180 | 0.888–1.580 | 0.250 | 1.074 | 0.783–1.471 | 0.660 |
| overweight | 0.630 | 0.421–0.942 | 0.025 | 0.673 | 0.439–1.031 | 0.069 |
| obesity | 0.969 | 0.678–1.390 | 0.870 | 0.965 | 0.652–1.428 | 0.861 |
| Area (rural) | ||||||
| suburban | 0.728 | 0.544–0.974 | 0.033 | 0.614 | 0.410–0.921 | 0.018 |
| urban | 1.080 | 0.851–1.379 | 0.520 | 1.080 | 0.707–1.651 | 0.720 |
| Diet (intermediate-type diets) | ||||||
| sufficient nutrients | 0.852 | 0.662–1.104 | 0.210 | 0.954 | 0.694–1.312 | 0.768 |
| meat based diets | 1.460 | 1.093–1.949 | 0.012 | 1.559 | 1.079–2.254 | 0.018 |
| Variables | Univariate analysis | Multivariate analysis | |||||
| HR | 95%CI | p value | HR | 95%CI | p value | ||
| Height | 0.968 | 0.945–0.991 | 0.008 | 0.984 | 0.954–1.012 | 0.281 | |
| Depression (normal) | 1.129 | 0.715–1.812 | 0.590 | – | – | – | |
| Smoking (no smoke) | 1.110 | 0.795–1.560 | 0.544 | – | – | – | |
| Drink (no drink) | 1.431 | 1.100–2.041 | 0.0480 | 1.375 | 0.955–1.980 | 0.087 | |
| Sad event (experienced) | 1.051 | 0.734–1.532 | 0.794 | – | – | – | |
| Exercise (always) | 1.157 | 0.824–1.689 | 0.413 | – | – | – | |
| BADL (can take care) | 0.773 | 0.243–2.445 | 0.662 | – | – | – | |
| IADL (can take care) | 1.909 | 1.320–2.769 | <0.001 | 1.462 | 0.955–2.238 | 0.081 | |
| Marital status (have a spouse) | 1.469 | 1.020–2.131 | 0.044 | 1.125 | 0.729–1.741 | 0.586 | |
| Assessment of health (normal) | 1.550 | 1.020–2.351 | 0.041 | 1.076 | 0.679–1.714 | 0.746 | |
| Blood lipid (normal) | 1.211 | 0.795–1.801 | 0.386 | – | – | – | |
| Diabetes (normal) | 1.220 | 0.789–1.889 | 0.371 | – | – | – | |
| Age-group (55–65) | |||||||
| 66–75 | 1.120 | 0.794–1.567 | 0.535 | 1.622 | 1.021–2.582 | 0.041 | |
| ≥76 | 1.671 | 1.189–2.345 | 0.003 | 1.681 | 0.965–2.930 | 0.046 | |
| Blood pressure(normal) | |||||||
| Sbp > 120 or dbp > 80 | 0.536 | 0.289–0.992 | 0.047 | 0.817 | 0.406–1.64 | 0.570 | |
| Sbp ≥ 140 or dbp ≥ 90 | 1.751 | 1.220–2.510 | 0.002 | 1.362 | 0.880–2.101 | 0.168 | |
| Body mass index (normal) | |||||||
| thin | 1.110 | 0.721–1.697 | 0.641 | 1.237 | 0.763–2.013 | 0.389 | |
| overweight | 0.604 | 0.336–1.089 | 0.092 | 0.769 | 0.404–1.459 | 0.418 | |
| obesity | 1.712 | 1.121–2.620 | 0.013 | 1.889 | 1.159–3.078 | 0.011 | |
| Area (rural) | |||||||
| suburban | 0.696 | 0.457–1.058 | 0.092 | 0.631 | 0.342–1.164 | 0.140 | |
| urban | 1.093 | 0.774–1.529 | 0.630 | 1.154 | 0.599–2.220 | 0.671 | |
| Diet (intermediate-type diets) | |||||||
| sufficient nutrients | 0.768 | 0.536–1.089 | 0.150 | 0.806 | 0.513–1.272 | 0.350 | |
| meat based diets | 1.881– | 1.280–2.778 | 0.001 | 2.158 | 1.245–3.741 | 0.006 | |
| Variables | Univariate analysis | Multivariate analysis | |||||
| HR | 95%CI | p value | HR | 95%CI | p value | ||
| Height | 0.981 | 0.951–1.011 | 0.202 | 0.995 | 0.959–1.031 | 0.810 | |
| Depression (normal) | 1.340 | 0.922–1.945 | 0.131 | 1.256 | 0.827–1.910 | 0.289 | |
| Smoking (no smoke) | 0.827 | 0.534–1.278 | 0.390 | – | – | – | |
| Drink (no drink) | 1.133 | 0.561–2.256 | 0.739 | – | – | – | |
| Sad event (experienced) | 0.744 | 0.528–1.050 | 0.092 | 0.732 | 0.510–1.052 | 0.091 | |
| Exercise (always) | 0.876 | 0.624–1.230 | 0.441 | – | – | – | |
| BADL (can take care) | 1.020 | 0.442–2.371 | 0.962 | – | – | – | |
| IADL (can take care) | 1.343 | 0.948–1.900 | 0.097 | 0.995 | 0.643–1.544 | 0.981 | |
| Marital status (have a spouse ) | 1.376 | 0.981–1.910 | 0.066 | 0.935 | 0.613–1.436 | 0.745 | |
| Assessment of health (normal) | 1.211 | 0.821–1.823 | 0.331 | – | – | – | |
| Blood lipid (normal) | 0.785 | 0.544–1.144 | 0.212 | 0.734 | 0.499–1.081 | 0.123 | |
| Diabetes (normal) | 0.771 | 0.501–1.191 | 0.243 | 1.608 | 1.028–2.509 | 0.037 | |
| Age group (55–65) | |||||||
| 66–75 | 1.128 | 0.811–1.589 | 0.491 | 1.583 | 1.012–2.473 | 0.044 | |
| ≥76 | 1.712 | 1.210–2.430 | 0.003 | 2.109 | 1.116–3.982 | 0.021 | |
| Blood-pressure(normal) | |||||||
| Sbp > 120 or dbp > 80 | 0.616 | 0.335–1.133 | 0.120 | 0.962 | 0.477–1.941 | 0.911 | |
| Sbp ≥ 140 or dbp ≥ 90 | 1.520 | 1.051–2.190 | 0.027 | 1.739 | 1.102–2.740 | 0.018 | |
| Body mass index(normal) | |||||||
| thin | 1.273 | 0.859–1.871 | 0.230 | 1.072 | 0.697–1.652 | 0.750 | |
| overweight | 0.651 | 0.373–1.132 | 0.130 | 0.704 | 0.392–1.263 | 0.241 | |
| obesity | 0.668 | 0.379–1.181 | 0.161 | 0.674 | 0.371–1.219 | 0.189 | |
| Area(rural) | |||||||
| suburban | 0.761 | 0.509–1.140 | 0.193 | 0.636 | 0.366–1.115 | 0.112 | |
| urban | 1.070 | 0.761–1.521 | 0.681 | 0.930 | 0.517–1.674 | 0.810 | |
| Diet(intermediate-type diets) | |||||||
| sufficient nutrients | 0.938 | 0.659–1.330 | 0.718 | 1.155 | 0.751–1.786 | 0.510 | |
| meat based diets | 1.003 | 0.854–1.971 | 0.219 | 1.786 | 1.041–3.062 | 0.035 | |
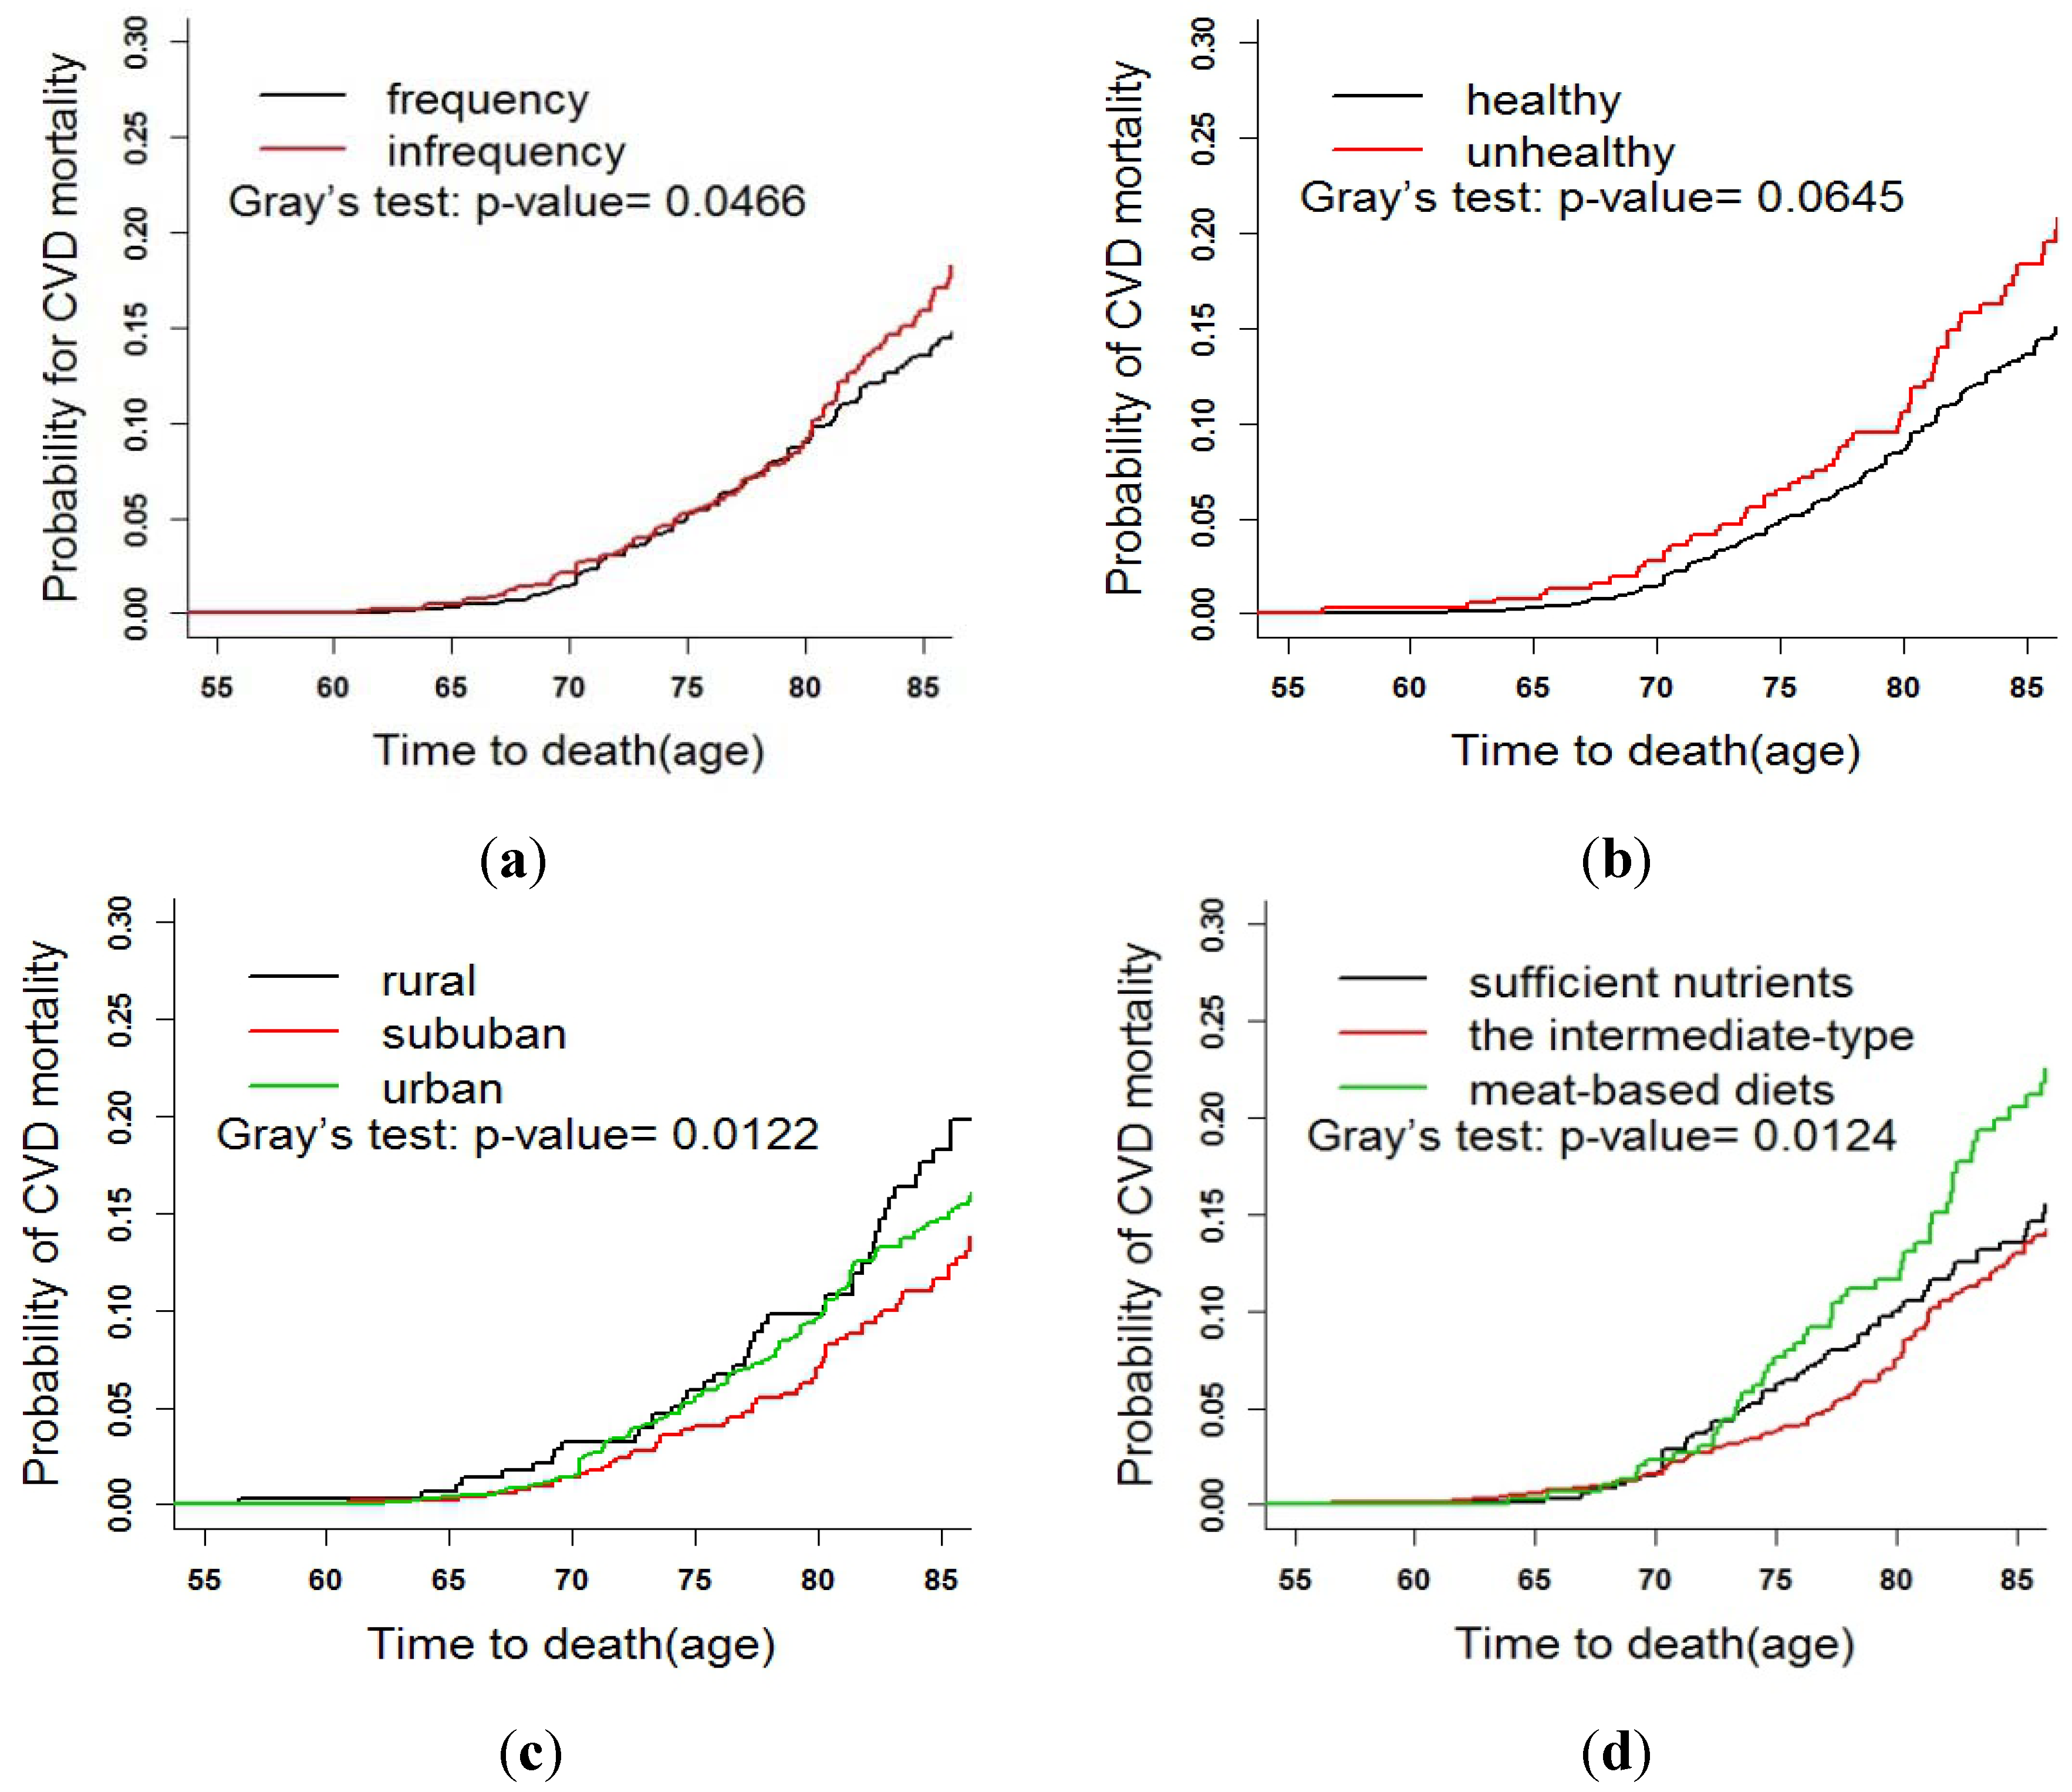
3.3. Fine and Gray Test


4. Discussion
5. Conclusions
Acknowledgments
Author Contributions
Conflicts of Interest
References
- Lopez, A.D.; Mathers, C.D.; Ezzati, M.; Jamison, D.T.; Murray, C.J. Global and regional burden of disease and risk factors, 2001: Systematic analysis of population health data. Lancet. 2006, 367, 1747–1757. [Google Scholar] [CrossRef]
- Ngian, G.S.; Sahhar, J.; Proudman, S.M.; Stevens, W.; Wicks, I.P.; van Doornum, S. Prevalence of coronary heart disease and cardiovascular risk factors in a national cross-sectional cohort study of systemic sclerosis. Clin. Epidemiol. Res. 2012, 71, 1980–1983. [Google Scholar]
- Hu, F.B.; Willett, W.C.; Li, T.; Stampfer, M.J.; Colditz, G.A.; Manson, J.E. Adiposity as compared with physical activity in predicting mortality among women. N. Engl. J. Med. 2004, 351, 2694–2703. [Google Scholar] [CrossRef]
- The Top 10 Causes of Death. Available online: http://who.int/mediacentre/factsheets/fs310/en/ (accessed on 11 November 2013).
- Heart Disease and Stroke Statistics––2009 Update: A Report from the American Heart Association Statistics Committee and Stroke Statistics Subcommittee. Available online: http://circ.ahajournals.org/content/119/3/e21# (accessed on 11 November 2013).
- Yang, Z.; Xing, X.; Xiao, J.; Lu, J.; Weng, J.; Jia, W.; Ji, L.; Shan, Z.; Liu, J.; Tian, H.; et al. Prevalence of cardiovascular disease and risk factors in the Chinese population with impaired glucose regulation: The 2007–2008 China national diabetes and metabolic disorders study. Exp. Clin. Endocrinol. Diabet. 2013, 121, 372–374. [Google Scholar] [CrossRef]
- Smith, S.C., Jr.; Chen, D.; Collins, A.; Harold, J.G.; Jessup, M.; Josephson, S.; Logstrup, S.; Jur, C.; Sacco, R.L; Vardas, P.E.; et al. Moving from political declaration to action on reducing the global burden of cardiovascular diseases: A statement from the global cardiovascular disease taskforce. Circulation 2013, 62, 2151–2153. [Google Scholar]
- Chen, Z.; Yu, J.; Song, Y.; Chui, D. Aging Beijing: Challenges and strategies of health care for the elderly. Ageing Res. Rev. 2010, 9, s2–s5. [Google Scholar] [CrossRef]
- Cheng, Y.; Rosenberg, M.W.; Wang, W.; Yang, L.; Li, H. Aging, health and place in residential care facilities in Beijing, China. Soc. Sci. Med. 2011, 72, 365–372. [Google Scholar] [CrossRef]
- Rockhill, B.; Willett, W.C.; Manson, J.E.; Leitzmann, M.F.; Stampfer, M.J.; Hunter, D.J.; Colditz, G.A. Physical activity and mortality: A prospective study among women. Am. J. Public Health 2001, 91, 578–583. [Google Scholar] [CrossRef]
- Kenfield, S.A.; Stampfer, M.J.; Rosner, B.A.; Colditz, G.A. Smoking and smoking cessation in relation to mortality in women. JAMA 2008, 299, 2037–2047. [Google Scholar] [CrossRef]
- Beuscart, J.B.; Pagniez, D.; Boulanger, E.; Celia Sainte Foy, C.L.; Salleron, J.; Frimat, L.; Duhamel, A. Overestimation of the probability of death on peritoneal dialysis by the Kaplan-Meier method: Advantages of a competing risks approach. BMC Nephrol. 2012, 13. [Google Scholar] [CrossRef]
- Syrjanen, K.; Shabalova, I.; Sarian, L.; Naud, P.; Longatto-Filho, A.; Derchain, S.; Kozachenko, V.; Zakharchenko, S.; Roteli, C.M.; Nerovjna, R. Longitudinal outcomes of high-risk human papillomavirus (HPV) infections as competing-risks events following cervical HPV test at baseline visit in the NIS-LAMS cohort. Eur. J. Gynaecol. Oncol. 2012, 33, 341–352. [Google Scholar]
- Varadhan, R.; Weiss, C.O.; Segal, J.B.; Wu, A.W.; Scharfstein, D.; Boyd, C. Evaluating health outcomes in the presence of competing risks. Med. Care 2010, 48, 96–105. [Google Scholar] [CrossRef]
- Bryan, L.; Stephen, R.C.; Stephen, J.G. Competing risk regression models for epidemiologic data. Am. J. Epidemiol. 2009, 170, 244–256. [Google Scholar] [CrossRef]
- Bachmann, J.M.; Willis, B.L.; Ayers, C.R.; Khera, A.; Berry, J.D. Association between family history and coronary heart disease death across long-term follow-up in men: The Cooper Center Longitudinal Study. Circulation 2012, 125, 3092–3098. [Google Scholar] [CrossRef]
- Austin, P.C.; Anderson, G.M.; Cigsar, C.; Gruneir, A. Compared the cohort design and the nested case–control design in the presence of both time-invariant and time-dependent treatment and competing risks: Bias and precision. Pharmacoepidem. Dr. S. 2012, 21, 714–724. [Google Scholar] [CrossRef]
- Scheike, T.H.; Maiers, M.J.; Rocha, V.; Zhang, M.J. Competing risks with missing covariates: Effect of haplotypematch on hematopoietic cell transplant patients. Lifetime Data Anal. 2013, 19, 19–32. [Google Scholar] [CrossRef]
- Chen, C.; Lu, F.C.; Department of Disease Control Ministry of Health, PR China. The guidelines for prevention and control of overweight and obesity in Chinese adults. Biomed. Environ. Sci. 2004, 17, 1–36. [Google Scholar]
- World Health Organization (WHO). Definition, Diagnose and Classification of Diabetes Mellitus and Its Complications: Report of A WHO Consultation. Part 1: Diagnoses and Classification of Diabetes Mellitus; World Health Organization: Geneva, Switzerland, 1999. [Google Scholar]
- Catapano, A.L.; Chapman, J.; Wiklund, O.; Taskinen, M.R. The new joint EAS/ESC guidelines for the management of dyslipidemias. Atherosclerosis 2011, 1. [Google Scholar] [CrossRef]
- Wang, W.; Tang, Z.; Li, X.; Gao, Q.; Sun, F.; Diao, L.J.; Guo, X. Eight-year change in dietary pattern and metabolic status among the elderly people in Beijing. J. Cap. Med. Univ. 2012, 33, 218–222. [Google Scholar]
- Jefferson, A.L.; Byerly, L.K.; Vanderhill, S.; Lambe, S.; Wong, S.; Ozonoff, A.; Karlawish, J.H. Characterization of activities of daily living in individuals with mild cognitive impairment. Am. J. Geriat. Psychiat. 2008, 16, 375–383. [Google Scholar] [CrossRef]
- Radloff, L.S. The CES-D scale: A self-report depression scale for research in the general population. Appl. Psychol. Meas. 1977, 1, 385–401. [Google Scholar] [CrossRef]
- Schafer, J.L. Multiple imputation: A primer. Stat. Methods Med. Res. 1999, 8, 3–15. [Google Scholar] [CrossRef]
- Nicolaie, M.A.; van Houwelingen, J.C.; de Witte, T.M.; Putter, H. Dynamic prediction by landmarking in competing risks. Stat. Med. 2012, 32, 2031–2047. [Google Scholar]
- Pintilie, M. Competing Risks: A Practical Perspective; Wiley: Chichester, UK, 2006. [Google Scholar]
- Baer, H.J.; Glynn, R.J.; Hu, F.B.; Hankinson, S.E.; Willett, W.C.; Colditz, G.A.; Stampfer, M.; Rosner, B. Risk factors for mortality in the nurses’ health study: A competing risks analysis. Am. J. Epidemiol. 2010, 173, 319–329. [Google Scholar]
- Beyersmann, J.; Schumacher, M. Time-dependent covariates in the proportional sub-distribution hazards model for competing risks. Biostatistics 2008, 9, 765–776. [Google Scholar] [CrossRef]
- Latouche, A.; Porcher, R.; Chevret, S. A note on including time-dependent covariate in regression model for competing risks data. Biom. J. 2005, 47, 807–814. [Google Scholar] [CrossRef]
- Thomas, H.S.; Me, J.Z. Analyzing competing risk data using the R timereg package. J. Stat. Softw. 2011, 38, 1–9. [Google Scholar]
- Masic, I.; Alajbegovic, J. The significance of the psychosocial factors influence in pathogenesis of cardiovascular disease. Int. J. Prev. Med. 2013, 4, 1323–1330. [Google Scholar]
- Ahmed, H.M.; Blaha, M.J.; Blumenthal, R.S. Modifiable lifestyle risks, cardiovascular disease, and all-cause mortality. Int. J. Cardiol. 2013, 13. [Google Scholar] [CrossRef]
- Dhaliwal, S.S.; Welborn, T.A.; Howat, P.A. Recreational physical activity as an independent predictor of multivariable cardiovascular disease risk. PLoS One 2013, 8. [Google Scholar] [CrossRef]
- Wald, N.J.; Simmonds, M.; Morris, J.K. Screening for future cardiovascular disease using age alone compared with multiple risk factors and age. PLoS One 2011, 6, 1–7. [Google Scholar]
- Rhoades, D.A.; Welty, T.K.; Wang, W.; Yeh, F.; Devereux, R.B.; Fabsitz, R.R.; Lee, E.T.; Howard, B.V. Aging and the prevalence of cardiovascular disease risk factors in older American Indians: The strong heart study. J. Am. Geriatr. Soc. 2007, 55, 87–94. [Google Scholar] [CrossRef]
- Lakatta, E.G. Age-associated cardiovascular changes in health: Impact on cardiovascular disease in older persons. Heart Fail. Rev. 2002, 7, 29–49. [Google Scholar] [CrossRef]
- Gu, Q.; Burt, V.L.; Paulose-Ram, R.; Yoon, S.; Gillum, R.F. High blood pressure and cardiovascular disease mortality risk among U.S. adults: The third National Health and Nutrition Examination Survey mortality follow-up study. Ann. Epidemiol. 2008, 18, 302–309. [Google Scholar] [CrossRef]
- Estruch, R.; Ros, E.; Salas-Salvado, J.; Covas, M.I.; Corella, D.; Aros, F. Primary prevention of cardiovascular disease with a Mediterranean diet. N. Engl. J. Med. 2013, 368, 1279–1290. [Google Scholar] [CrossRef]
- Dehghan, M.; Mente, A.; Teo, K.K.; Gao, P.; Sleight, P.; Dagenais, G.; Avezum, A.; Probstfield, J.L.; Dans, T.; Yusuf, S. Relationship between healthy diet and risk of cardiovascular disease among patients on drug therapies for secondary prevention—A prospective cohort study of 31,546 high-risk individuals from 40 countries. Circulation 2012, 126, 2705–2712. [Google Scholar] [CrossRef]
- Verschuren, W.M. Diet and cardiovascular disease. Curr. Cardiol. Rep. 2012, 14, 701–708. [Google Scholar] [CrossRef]
- Tresserra-Rimbau, A.; Medina-Remon, A.; Perez-Jimenez, J.; Martinez-Gonzalez, M.A.; Covas, M.I.; Corella, D.; Salas-Salvado, J.; Gomez-Gracia, E.; Lapetra, J.; Aros, F. Dietary intake and major food sources of polyphenols in a Spanish population at high cardiovascular risk: The PREDIMED study. Nutr. Metab. Cardiovas. 2013, 23, 953–959. [Google Scholar] [CrossRef]
- Tognon, G.; Lissner, L.; Sabye, D.; Walker, K.Z.; Heitmann, B.L. The Mediterranean diet in relation to mortality and CVD: A Danish cohort study. Br. J. Nutr. 2013, 3, 1–9. [Google Scholar]
- Shortreed, S.M.; Peeters, A.; Forbes, A.B. Estimating the effect of long-term physical activity on cardiovascular disease and mortality: Evidence from the Framingham Heart Study. Heart 2013, 99, 649–654. [Google Scholar] [CrossRef]
- Gaesser, G.A. Exercise for prevention and treatment of cardiovascular disease, type 2 diabetes, and metabolic syndrome. Curr. Diab. Rep. 2007, 7, 14–19. [Google Scholar] [CrossRef]
- Wang, N.; Zhang, X.; Xiang, Y.B.; Yang, G.; Li, H.L.; Gao, J.; Cai, H.; Gao, Y.T.; Zheng, W.; Shu, X.O. Associations of adult height and its components with mortality: A report from cohort studies of 135,000 Chinese women and men. Int. J. Epidemiol. 2011, 40, 1715–1726. [Google Scholar] [CrossRef]
- Wolbers, M.; Koller, M.T.; Witteman, J.C.; Steyerberg, E.W. Prognostic models with competing risks: Methods and application to coronary risk prediction. Epidemiology 2009, 20, 551–561. [Google Scholar]
- Glynn, R.J.; Rosner, B. Comparison of risk factors for the competing risks of coronary heart disease, stroke, and venous thromboembolism. Am. J. Epidemiol. 2005, 162, 975–982. [Google Scholar] [CrossRef]
© 2014 by the authors; licensee MDPI, Basel, Switzerland. This article is an open access article distributed under the terms and conditions of the Creative Commons Attribution license (http://creativecommons.org/licenses/by/3.0/).
Share and Cite
Zhou, T.; Li, X.; Tang, Z.; Xie, C.; Tao, L.; Pan, L.; Huo, D.; Sun, F.; Luo, Y.; Wang, W.; et al. Risk Factors of CVD Mortality among the Elderly in Beijing, 1992 – 2009: An 18-year Cohort Study. Int. J. Environ. Res. Public Health 2014, 11, 2193-2208. https://doi.org/10.3390/ijerph110202193
Zhou T, Li X, Tang Z, Xie C, Tao L, Pan L, Huo D, Sun F, Luo Y, Wang W, et al. Risk Factors of CVD Mortality among the Elderly in Beijing, 1992 – 2009: An 18-year Cohort Study. International Journal of Environmental Research and Public Health. 2014; 11(2):2193-2208. https://doi.org/10.3390/ijerph110202193
Chicago/Turabian StyleZhou, Tao, Xia Li, Zhe Tang, Changchun Xie, Lixin Tao, Lei Pan, Da Huo, Fei Sun, Yanxia Luo, Wei Wang, and et al. 2014. "Risk Factors of CVD Mortality among the Elderly in Beijing, 1992 – 2009: An 18-year Cohort Study" International Journal of Environmental Research and Public Health 11, no. 2: 2193-2208. https://doi.org/10.3390/ijerph110202193
APA StyleZhou, T., Li, X., Tang, Z., Xie, C., Tao, L., Pan, L., Huo, D., Sun, F., Luo, Y., Wang, W., Yan, A., & Guo, X. (2014). Risk Factors of CVD Mortality among the Elderly in Beijing, 1992 – 2009: An 18-year Cohort Study. International Journal of Environmental Research and Public Health, 11(2), 2193-2208. https://doi.org/10.3390/ijerph110202193