Reasoning the Causality of City Sprawl, Traffic Congestion, and Green Land Disappearance in Taiwan Using the CLD Model

Abstract
:1. Introduction
2. Development of Taiwan’s Cities from 2002 to 2013
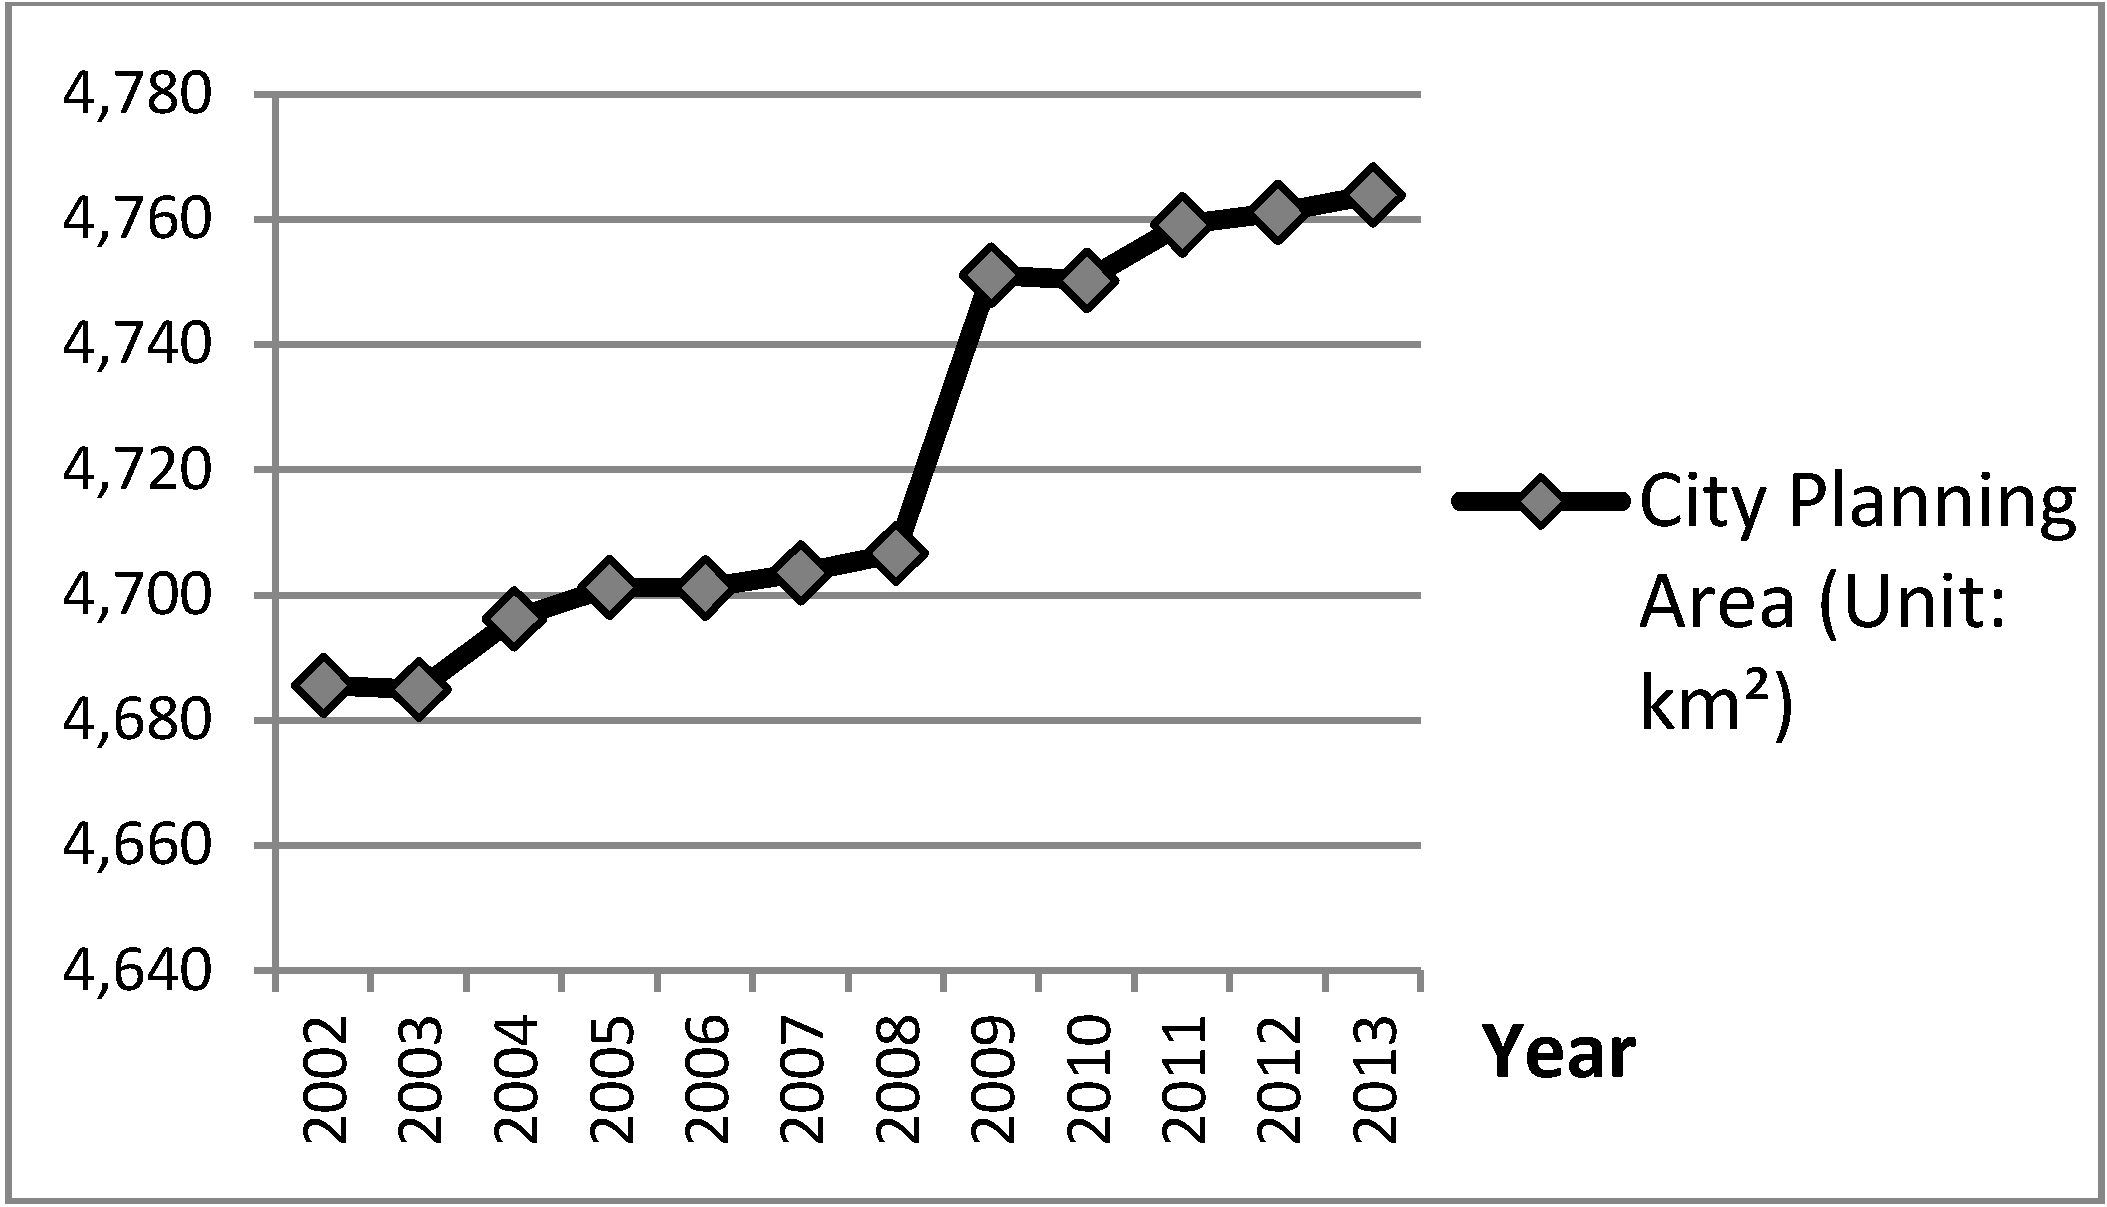
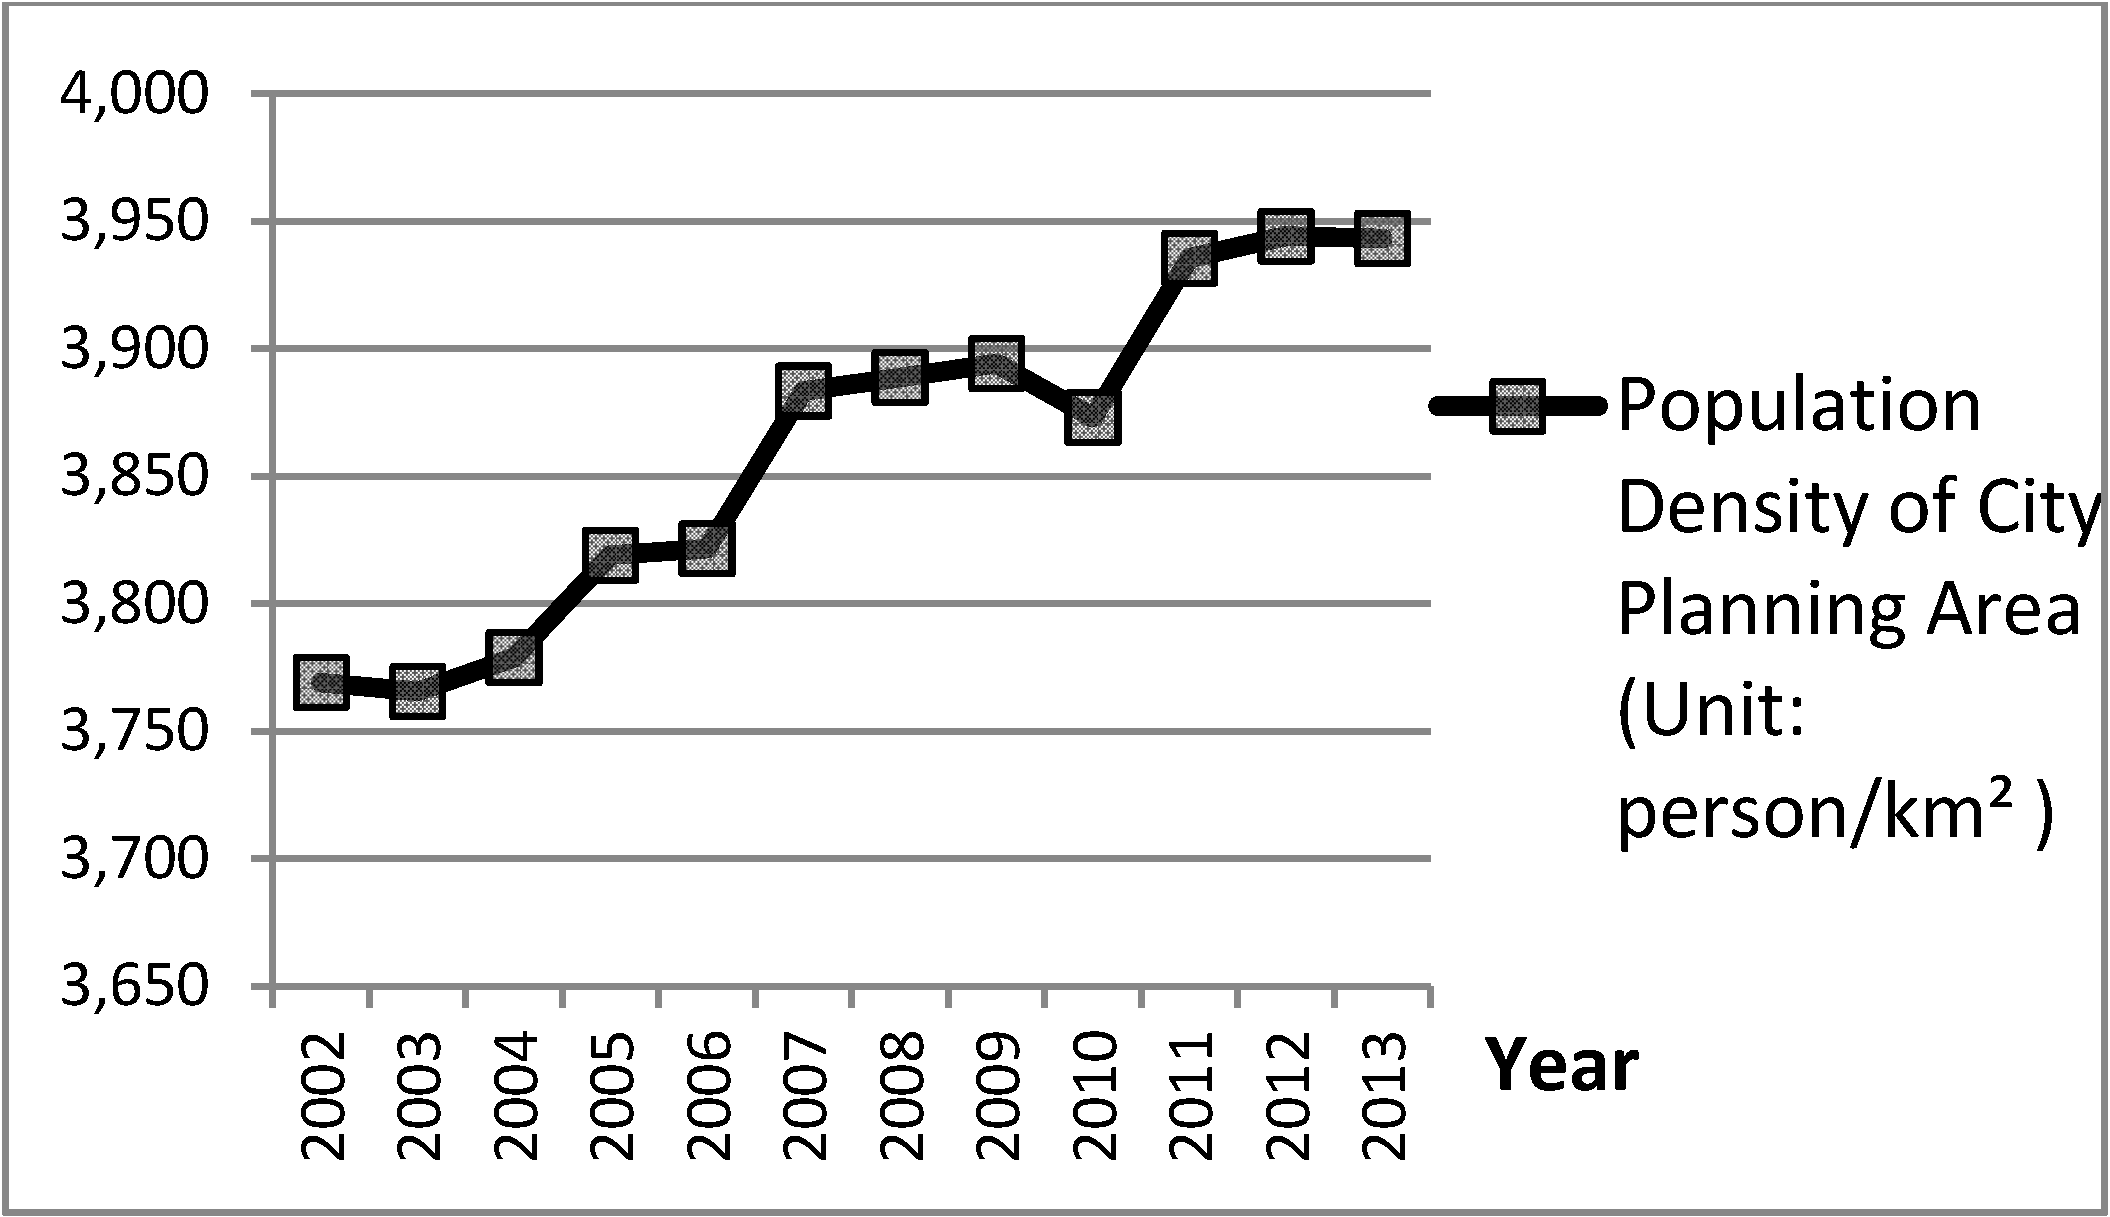
2.1. Land Development, Green Land, and Population

| Item | Year-End 2002 | Year-End 2013 | Increase | Percentage |
|---|---|---|---|---|
| Population of City Area | 17,661,000 | 18,785,000 | 1,124,000 | 6.4 |
| Ratio of City Population | 78 | 80 | 2 | 2.6 |
| Population Density of City Area | 3760 | 3940 | 180 | 4.8 |
| City Planning Area | 4680 | 4760 | 80 | 1.7 |
| Rural Area | 22,600 | 29,100 | 6,500 | 28.8 |
| Ratio of Rural Population | 21 | 19 | −2 | −9.5 |
| Non-Classified Area 1 | 8880 | 2230 | −6650 | −74.9 |
| Total Land in Taiwan | - | 36,192 | - | - |
| Planning Area in New Taipei City | 1,200 | 1240 | 40 | 3.3 |
| Planning Area in Taipei City | 271 | 271 | 0 | 0 |
| Population in New Taipei City | 3,371,000 | 3,744,000 | 373,000 | 11.1 |
| Population in Taipei City | 2,641,000 | 2,686,000 | 45,000 | 1.7 |
| Population Density in New Taipei City | 2780 | 3000 | 220 | 7.9 |
| Population Density in Taipei City | 9720 | 9880 | 160 | 1.6 |
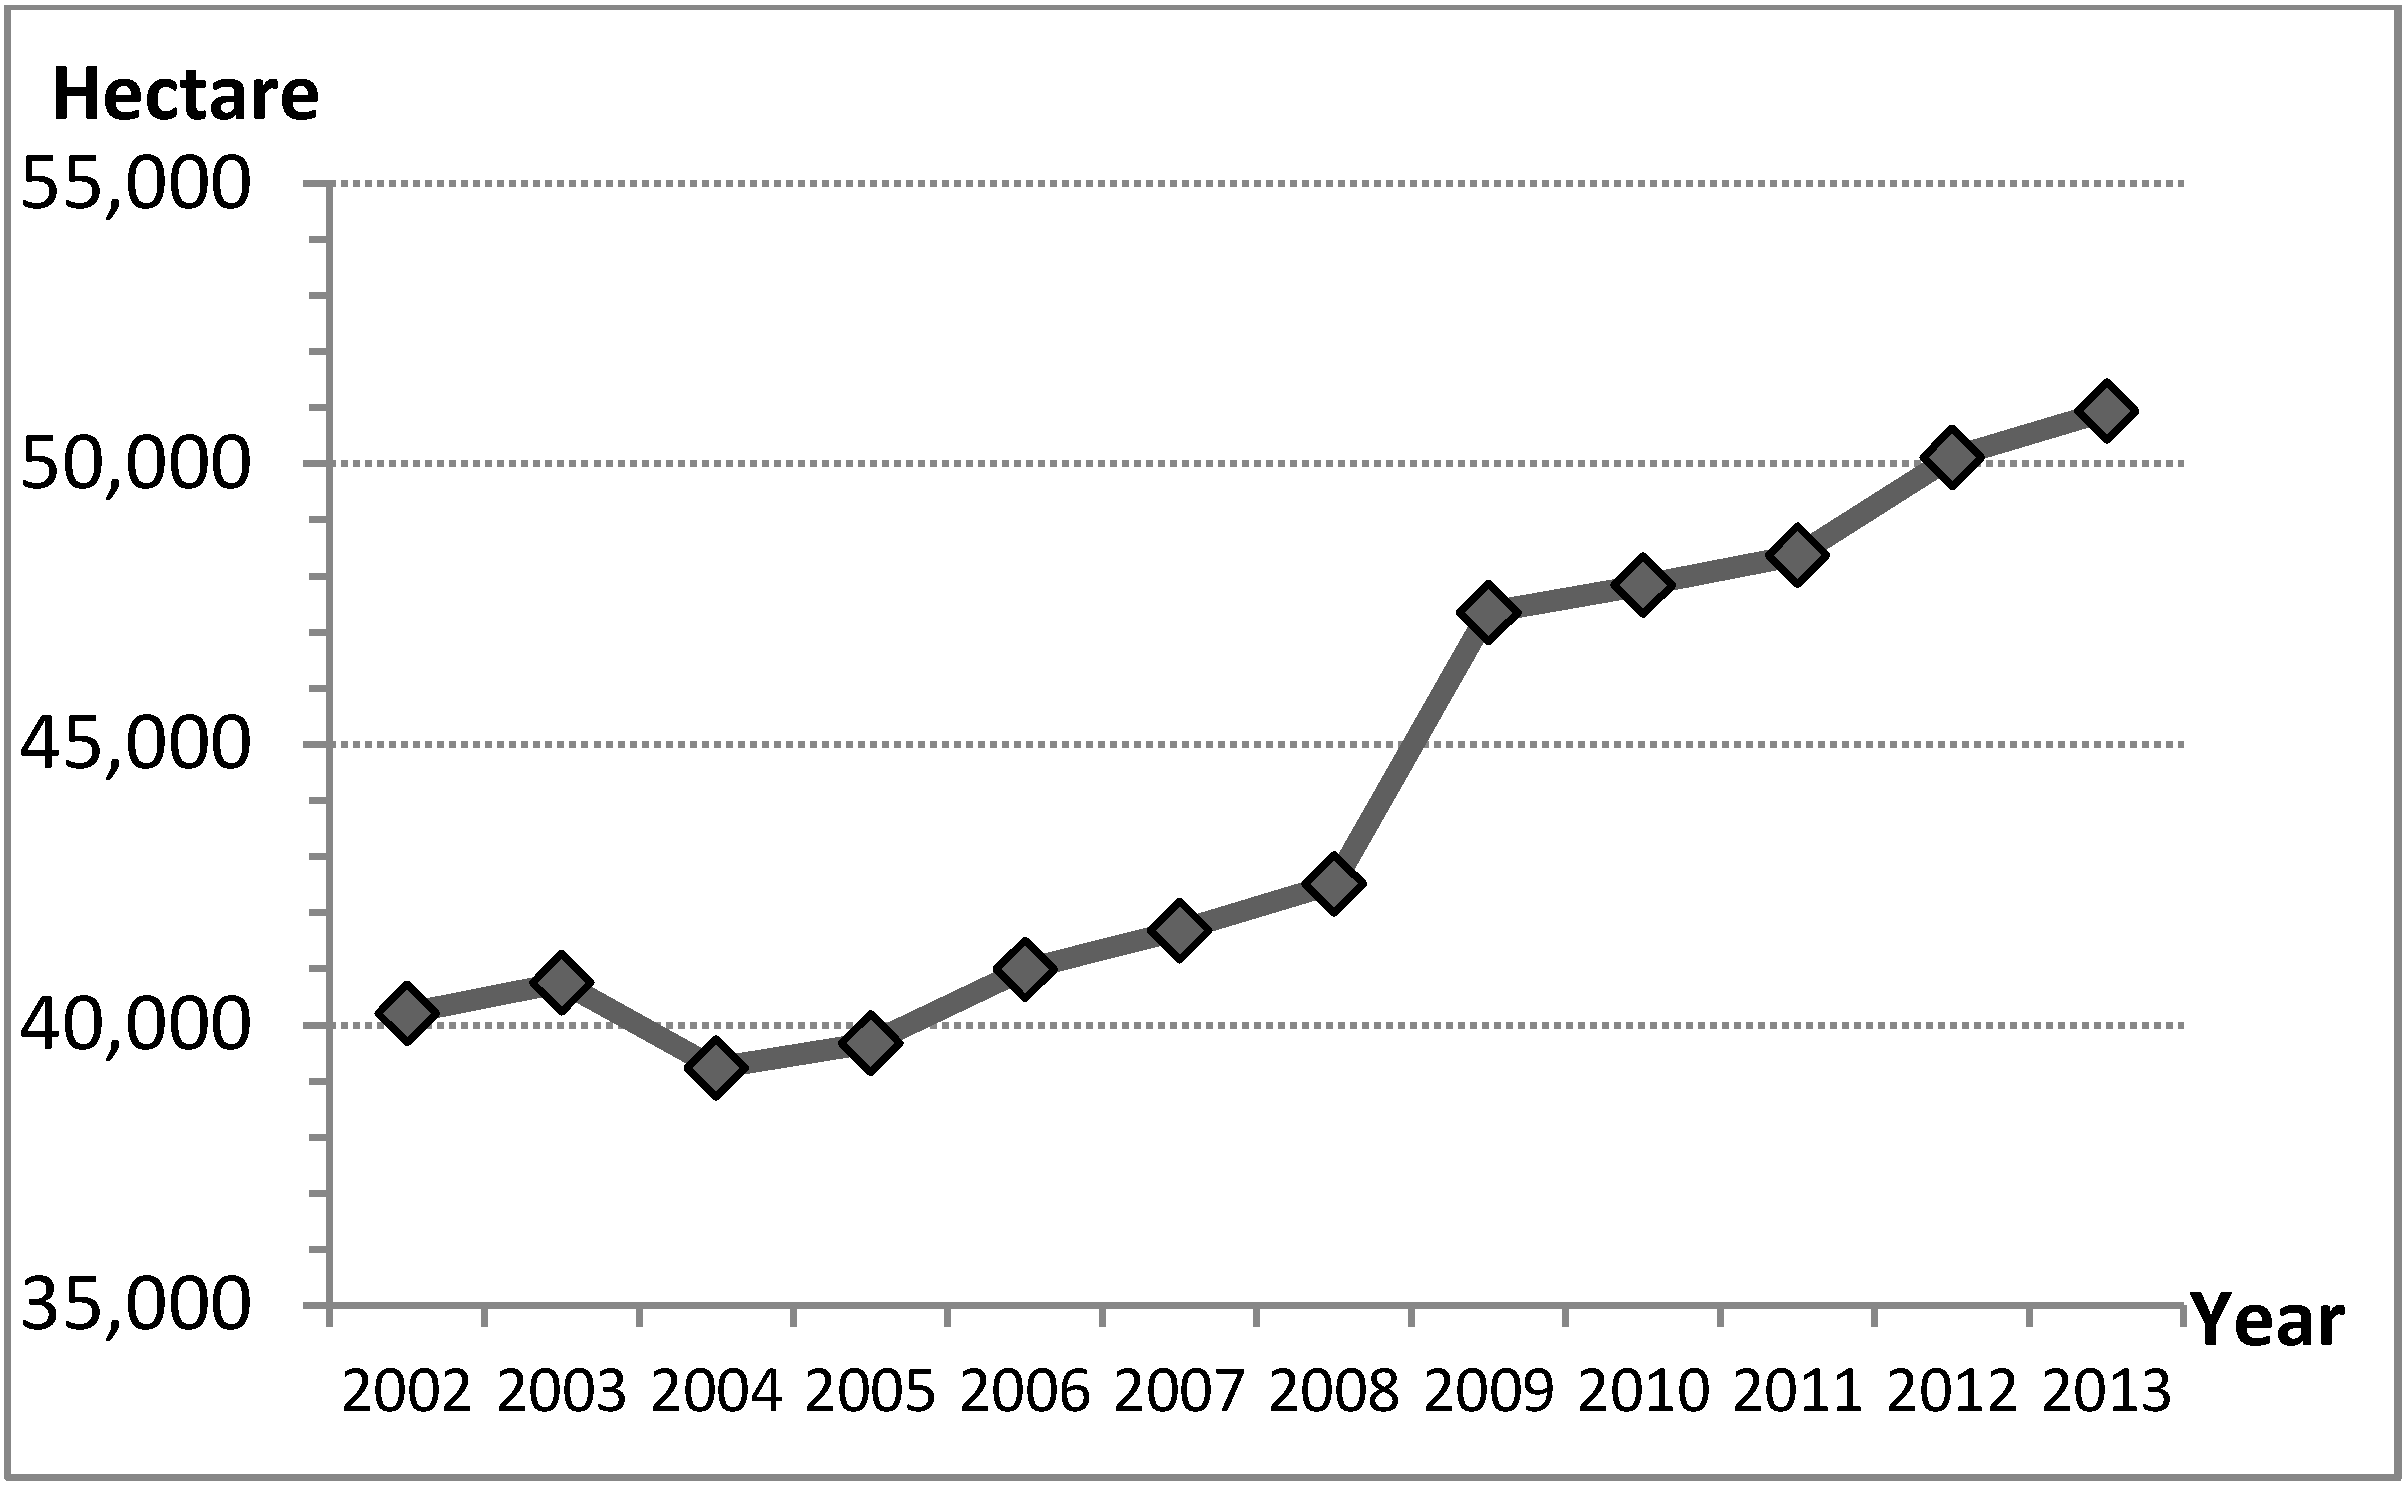
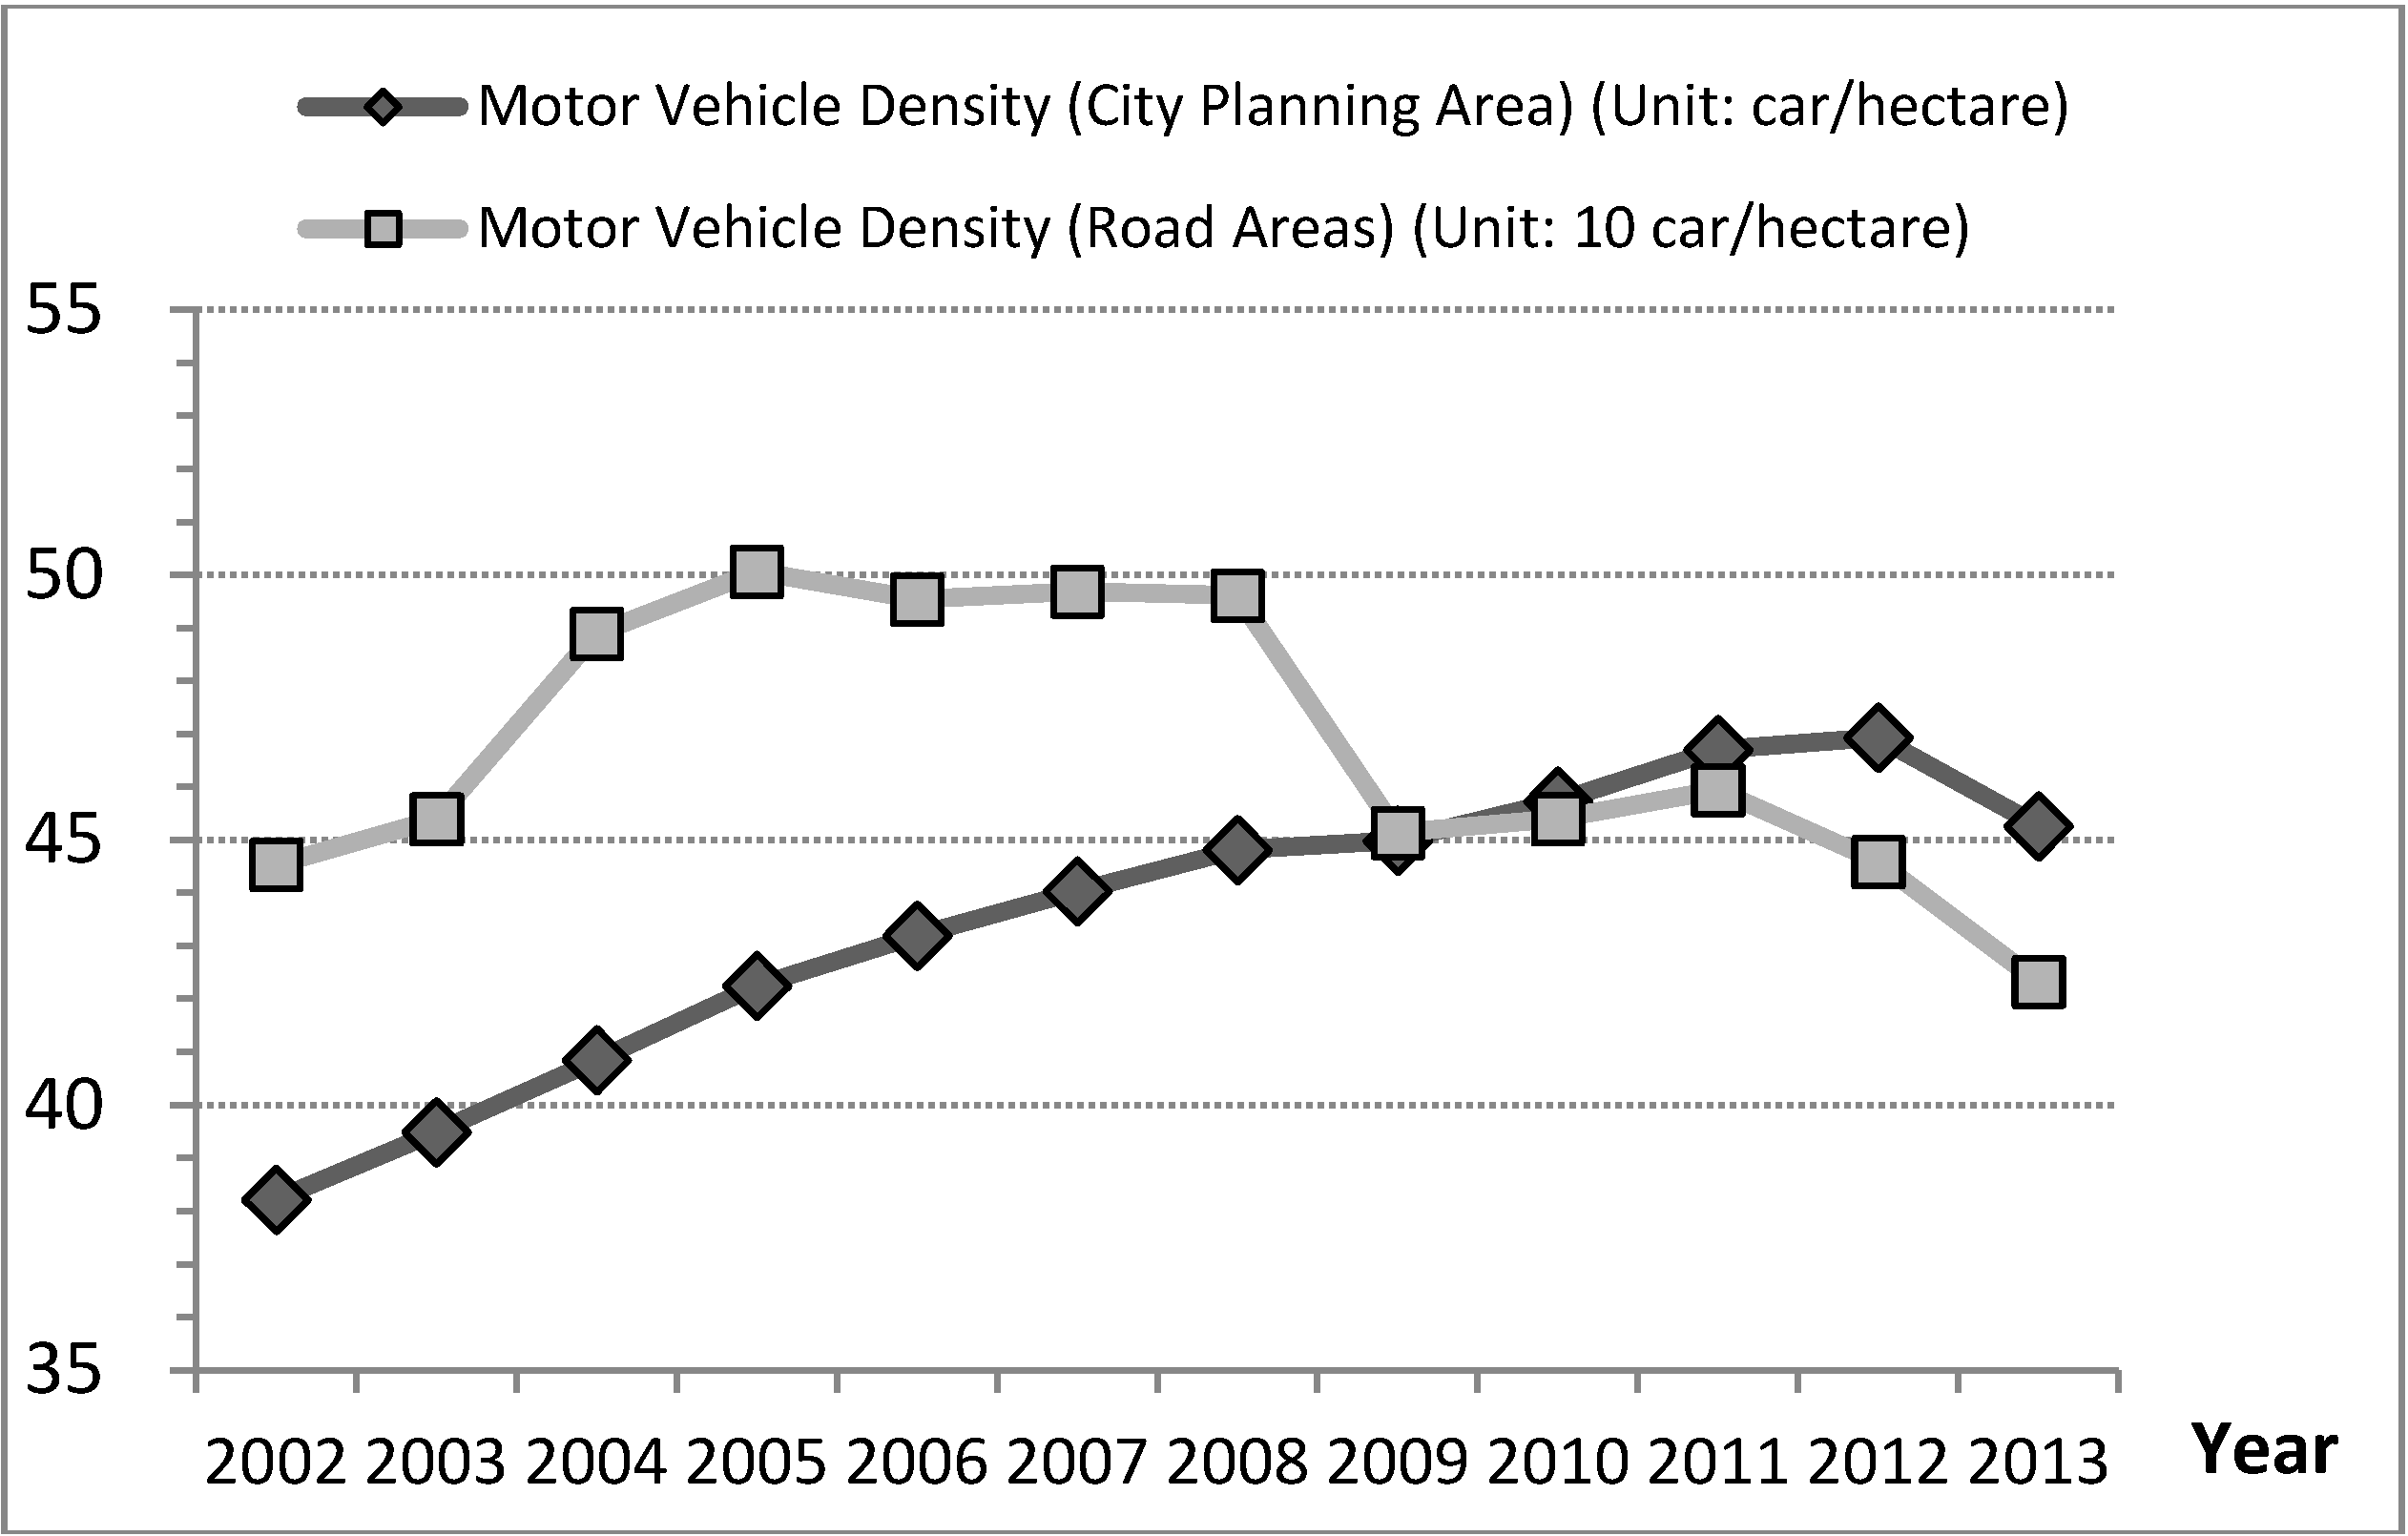
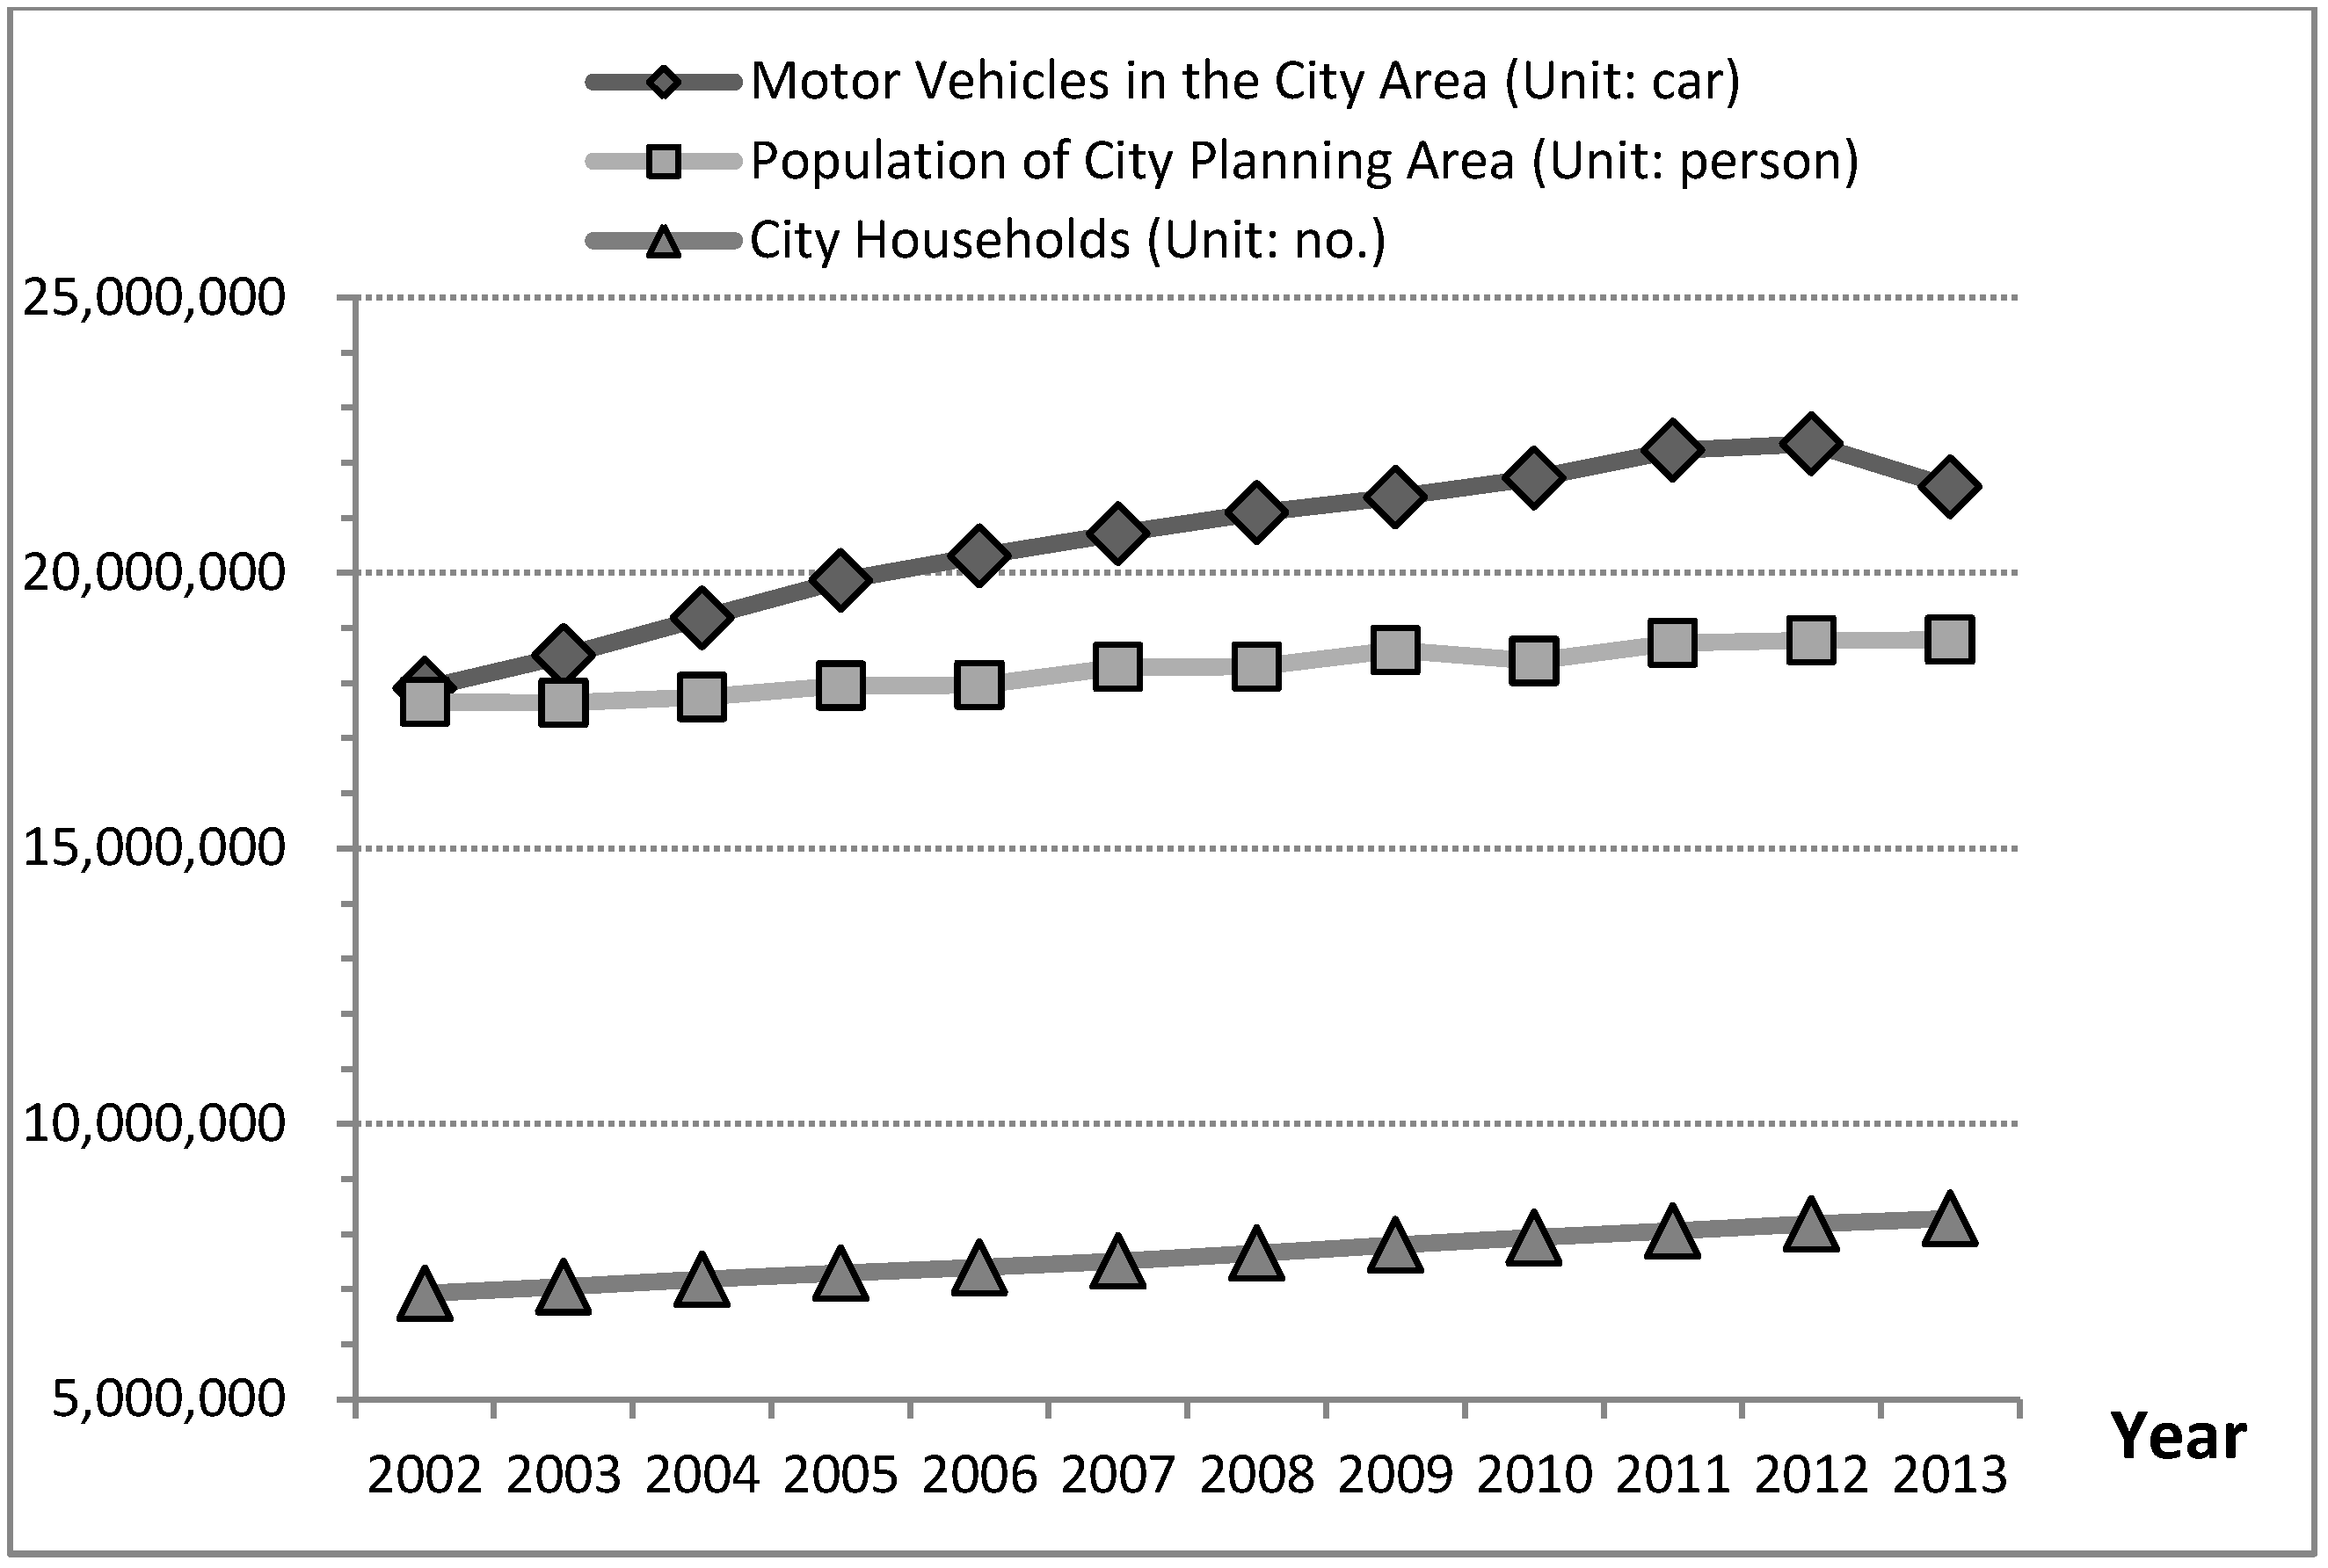
2.2. Traffic Congestion, Road Construction, and Motor Vehicle Users
| Item | Year-End 2002 | Year-End 2013 | Increase | Percentage |
|---|---|---|---|---|
| Motor Vehicles | 17,906,000 | 21,562,000 | 3,655,000 | 20.4 |
| City Households | 6,925,000 | 8,286,000 | 1,361,000 | 19.7 |
| Motor Vehicles per Household | 2.58 | 2.60 | 0.01 | 0.8 |
| Motor Vehicle Density 1 | 38 | 45 | 7 | 18.4 |
| Road Areas | 40,200 | 50,900 | 10,700 | 26.7 |
| Road Length | 37,000 | 42,500 | 5500 | 14.9 |
3. Traffic Congestion Development Reasoning, CLD Models
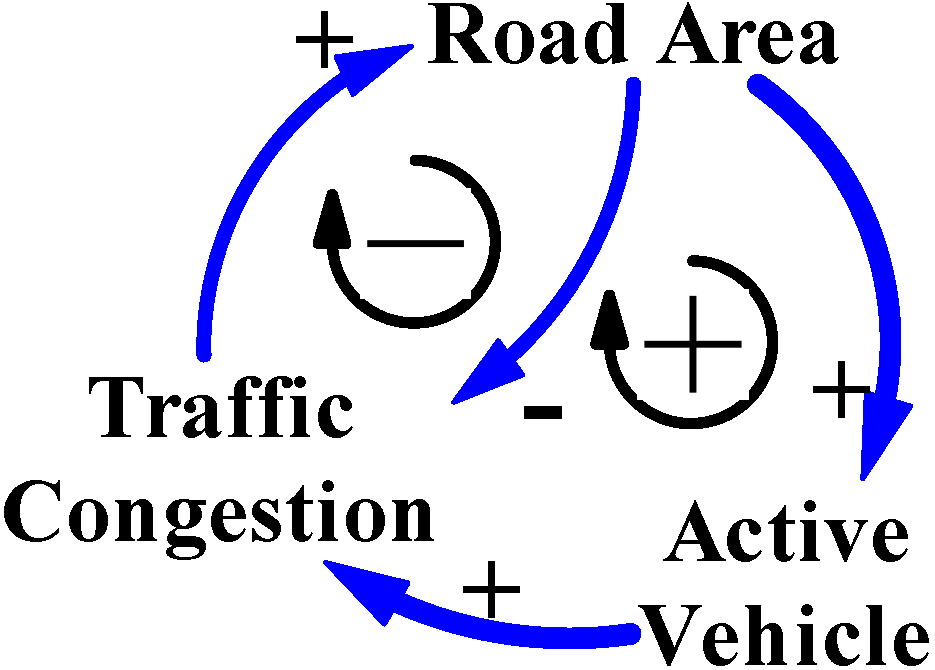
3.1. The General Logical CLD Model for Cause and Effect of Traffic Congestion


| Item | Year-End 2002 | Year-End 2013 | Increase | Percentage |
|---|---|---|---|---|
| Motor Vehicles | 17,906,000 | 21,562,000 | 3,655,000 | 20.4 |
| Motor Vehicles in New Taipei City | 2,643,000 | 3,233,000 | 590,000 | 22.3 |
| Motor Vehicles in Taipei City | 1,649,000 | 1,802,000 | 153,000 | 9.3 |
| City Households | 6,925,000 | 8,286,000 | 1,361,000 | 19.7 |
| Households in New Taipei City | 1,190,000 | 1,477,000 | 287,000 | 24.1 |
| Households in Taipei City | 906,900 | 1,026,700 | 119,800 | 13.2 |
| Motor Vehicle Density 1 1 | 38 | 45 | 7 | 18.4 |
| Motor Vehicle Density 2 1 | 445.3 | 423.2 | −2.2 | −0.5 |
| City Planning Area | 4680 | 4760 | 80 | 1.7 |
| Road Areas 1 | 40,200 | 50,900 | 10,700 | 26.7 |
| Road Length | 37,000 | 42,500 | 5500 | 14.9 |
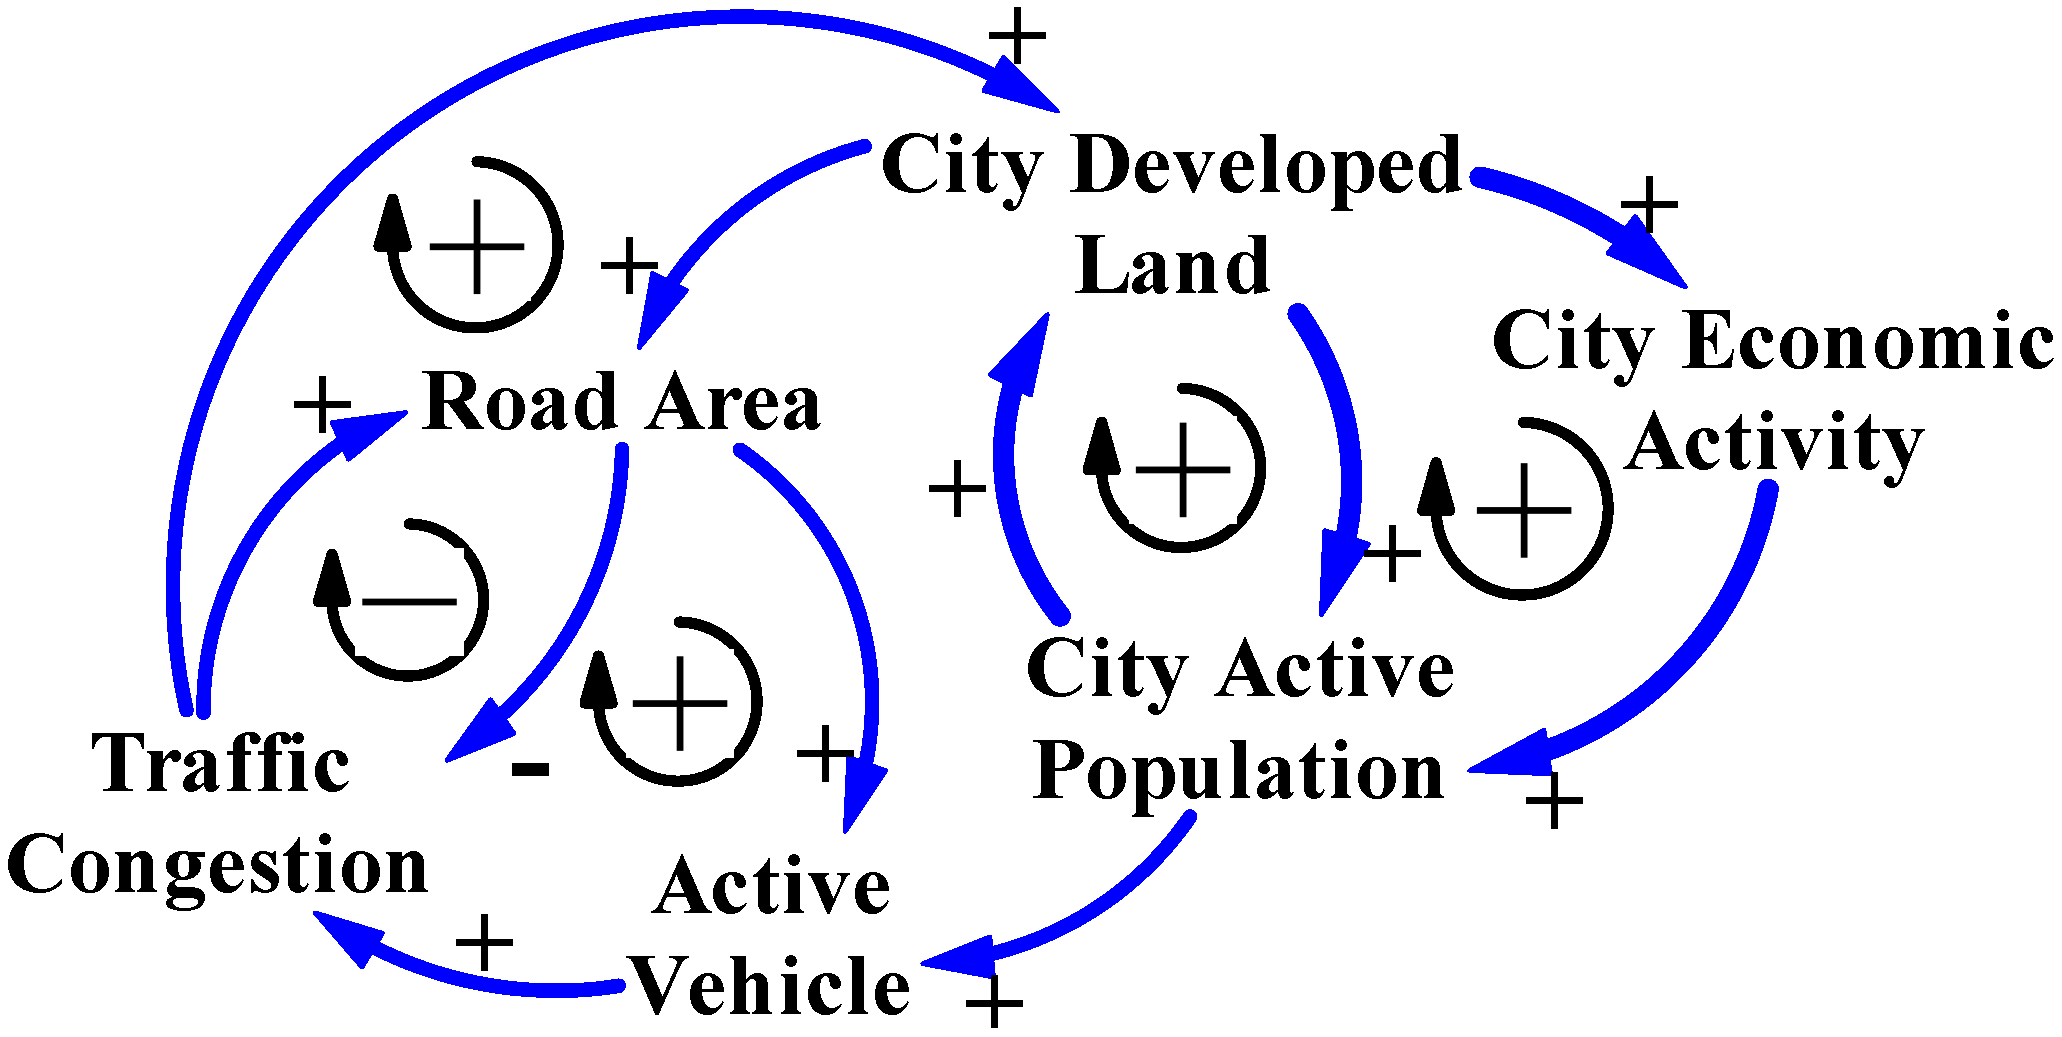
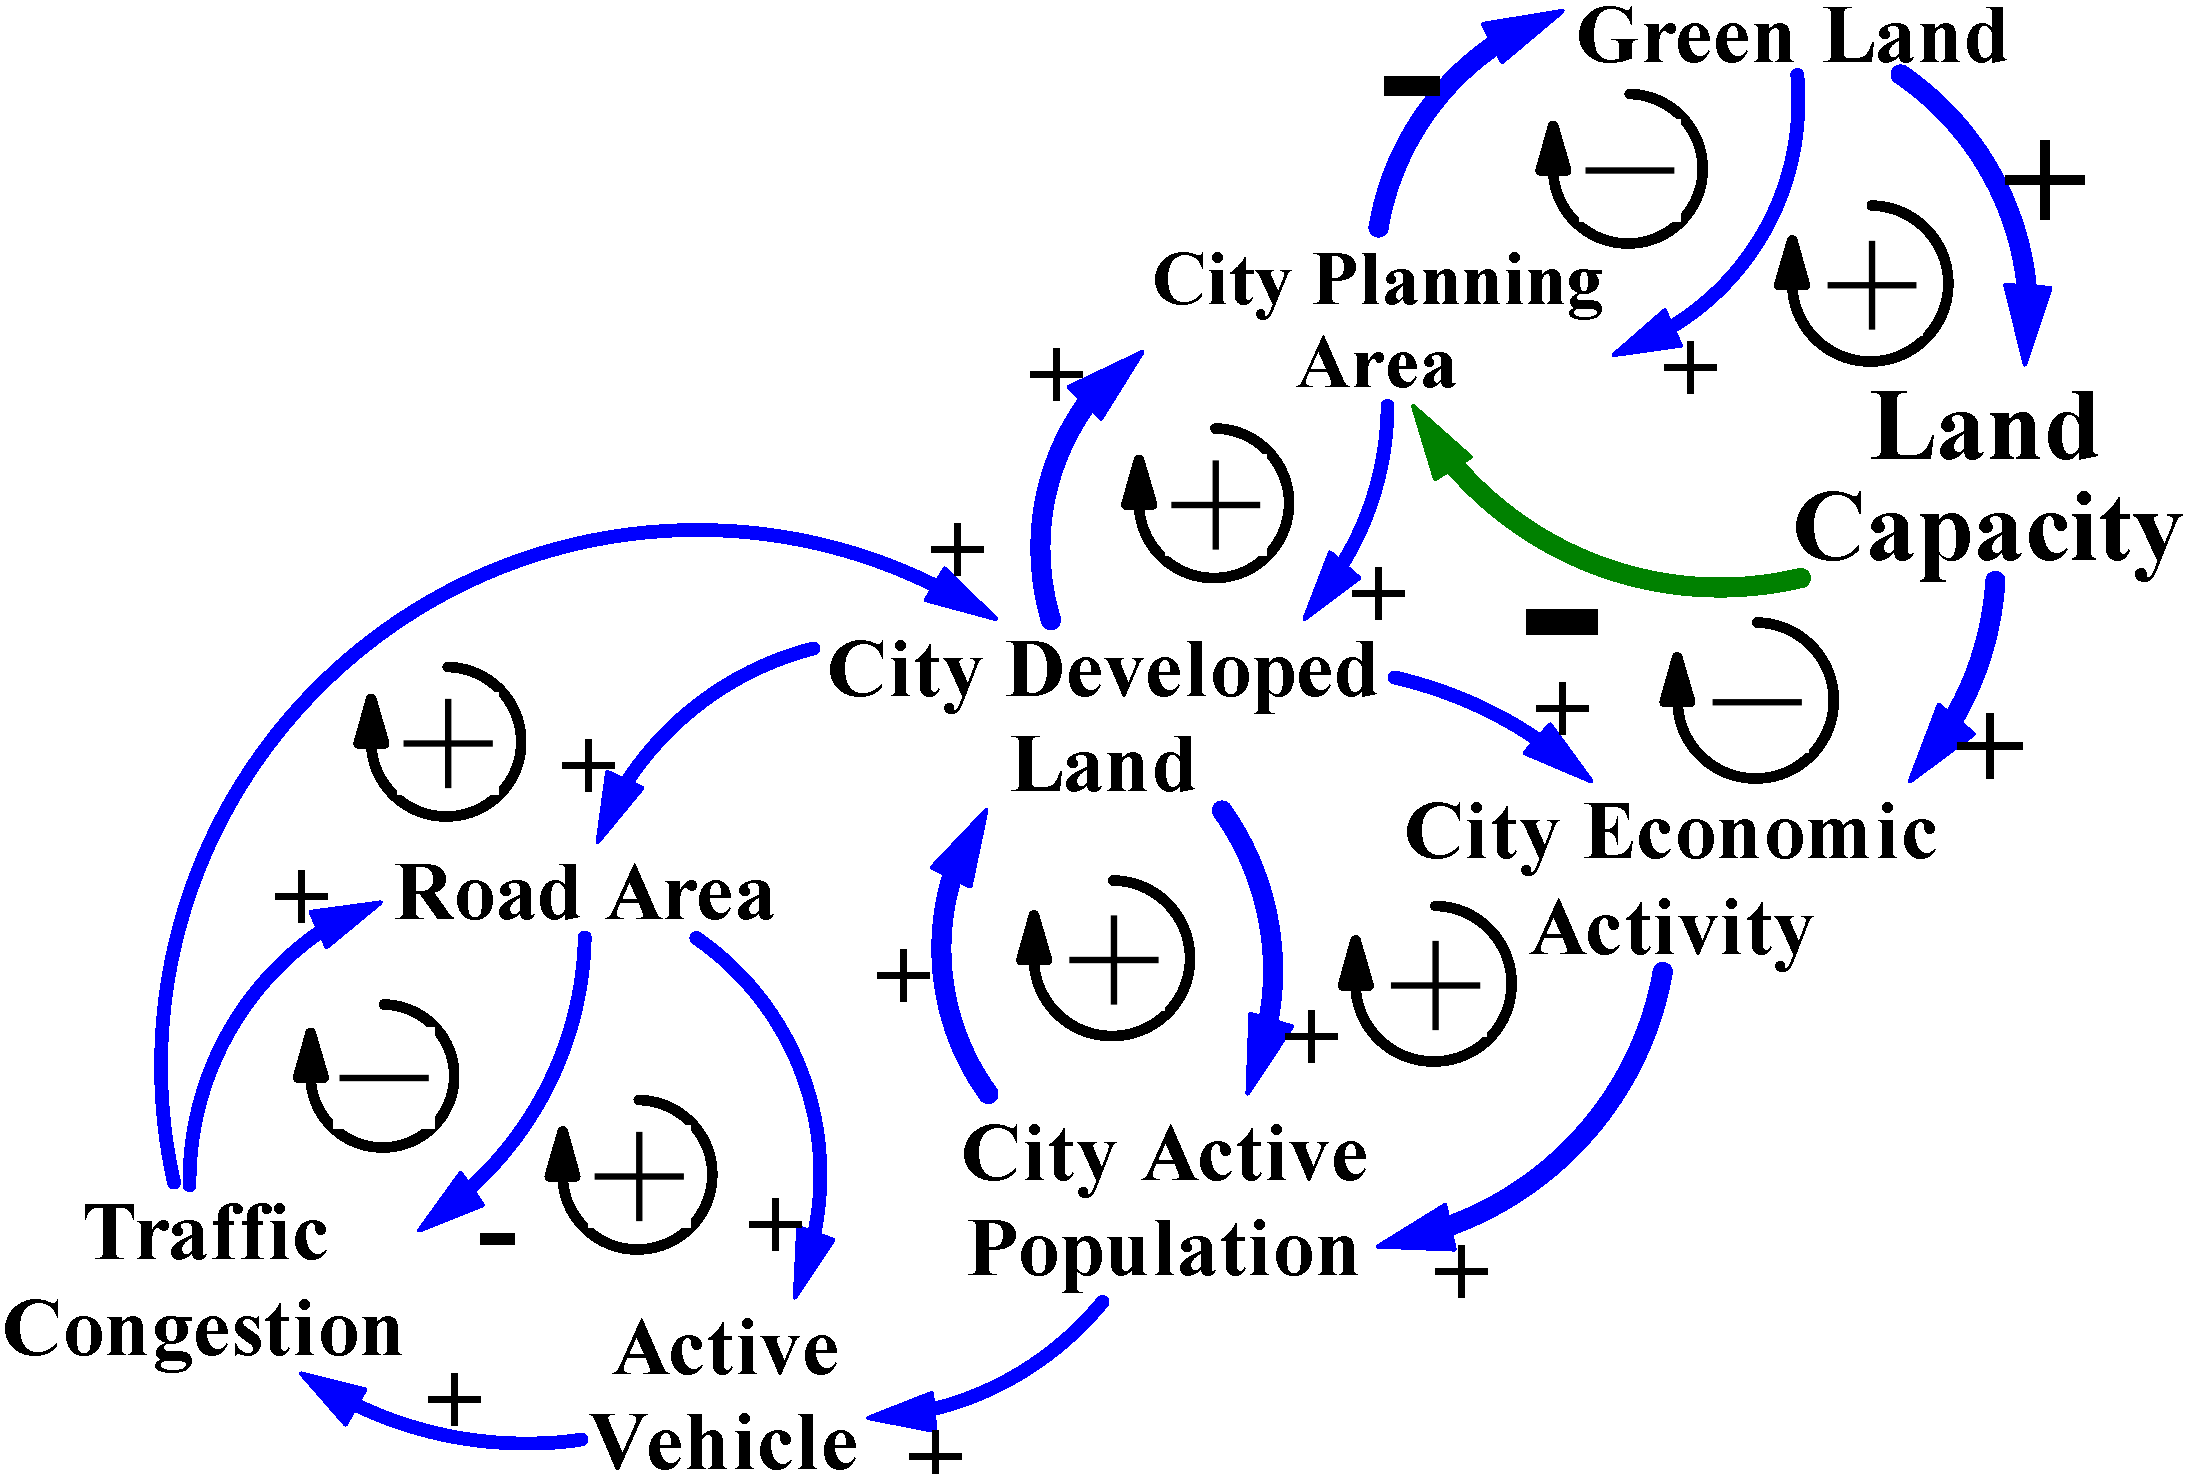
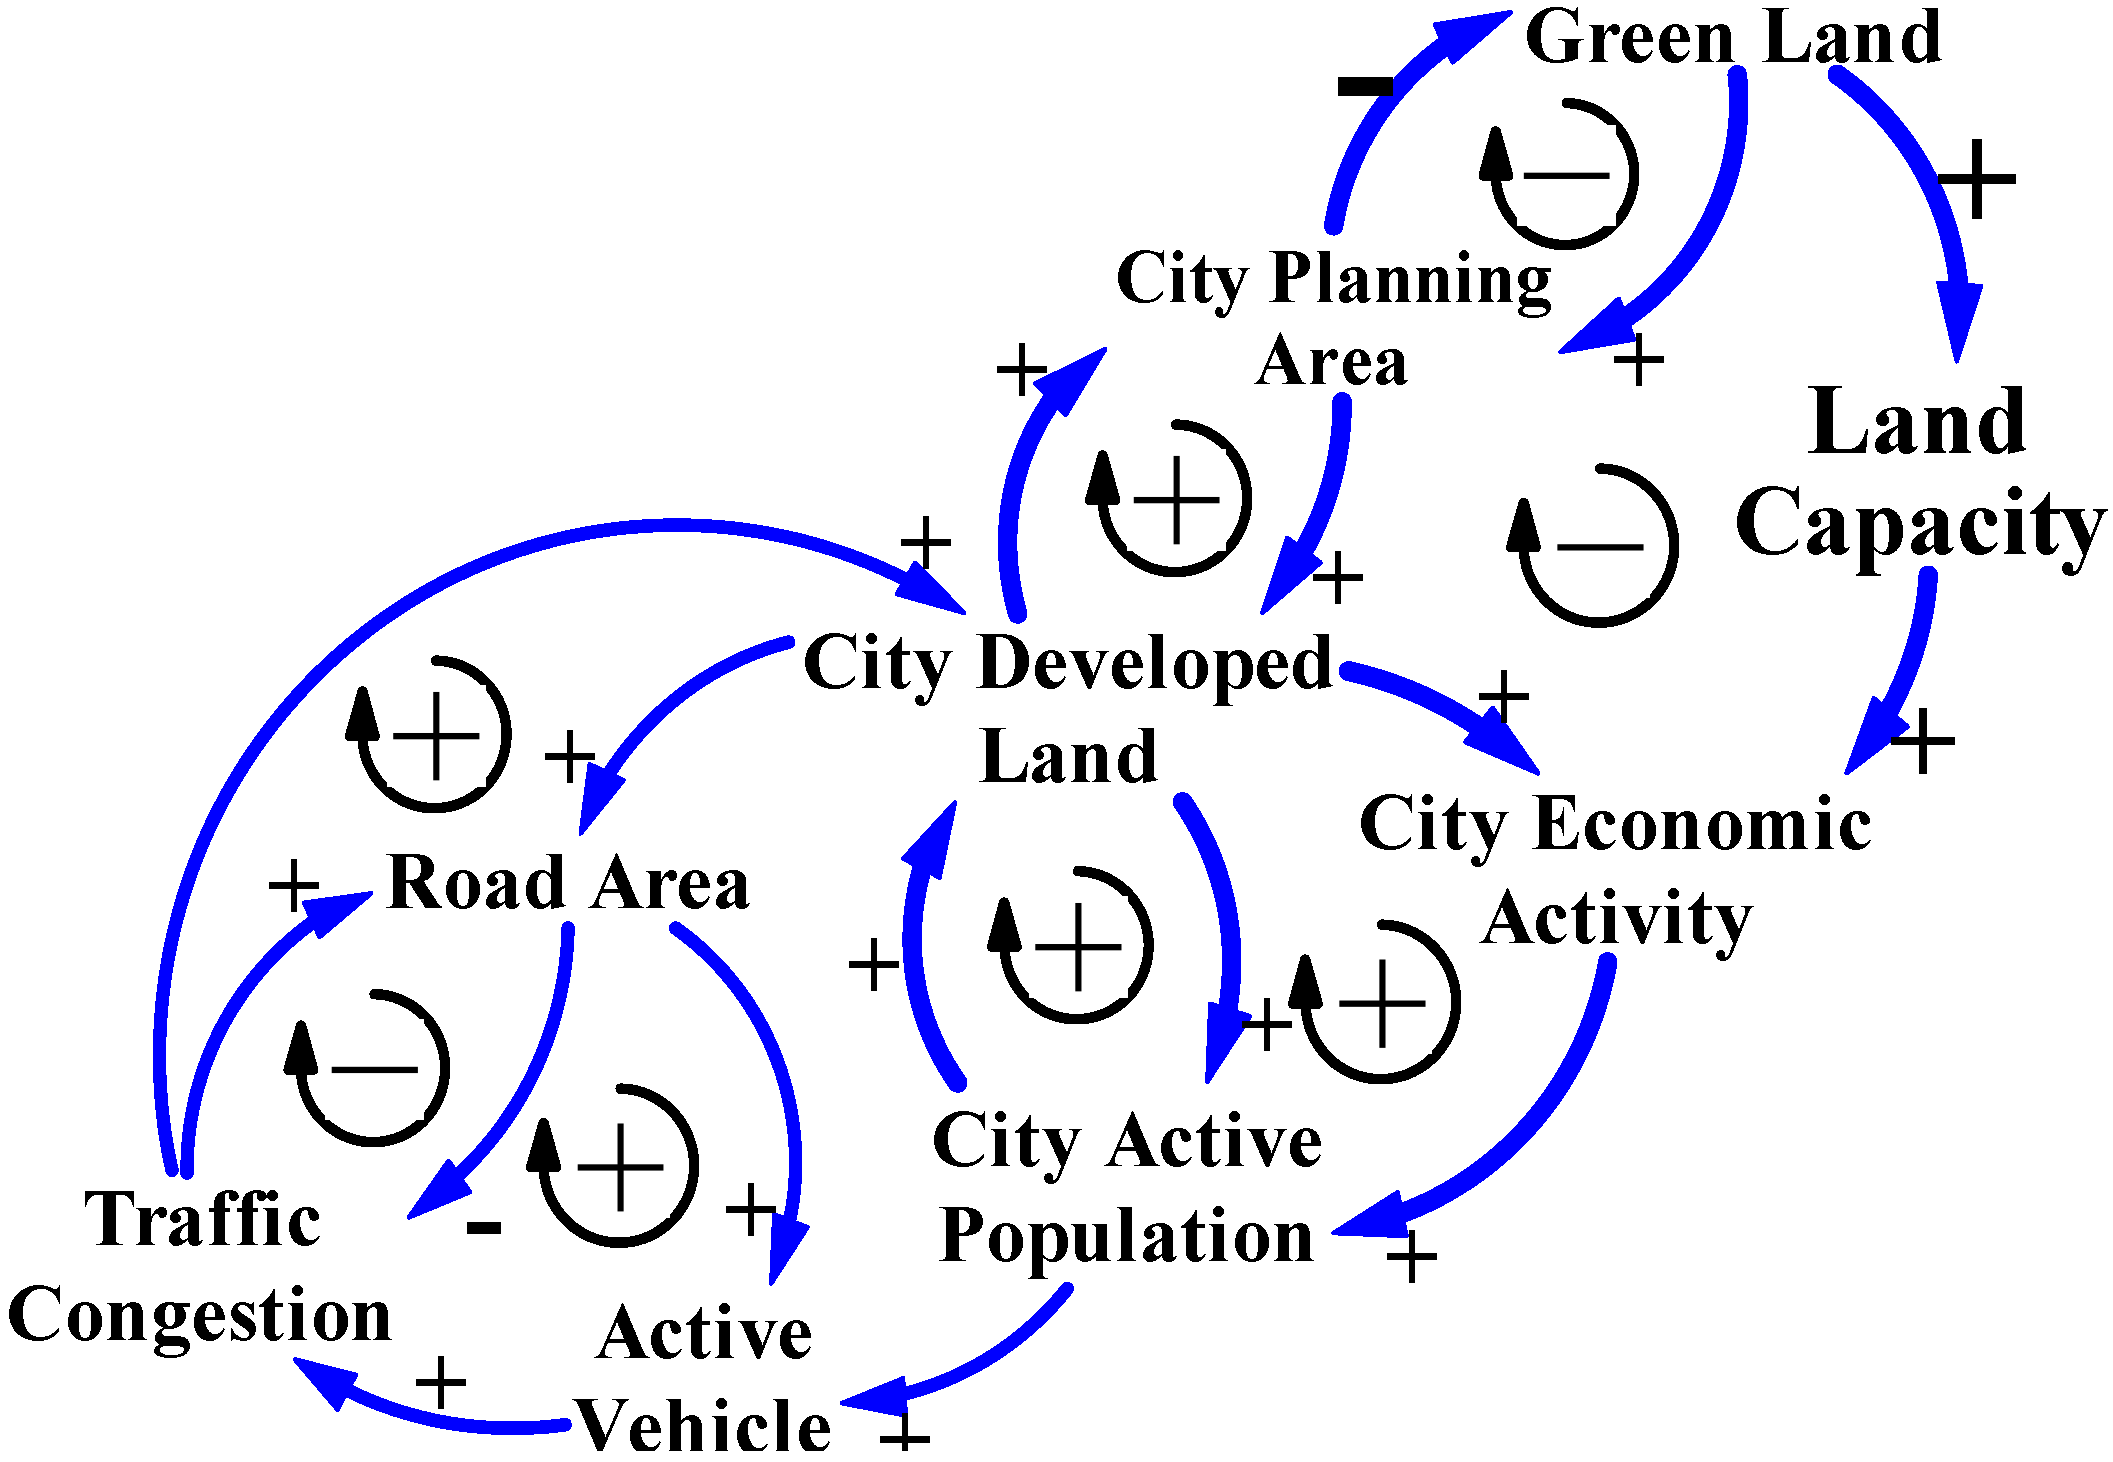
3.2. The Main CLD Model for Cause and Effect of Traffic Congestion

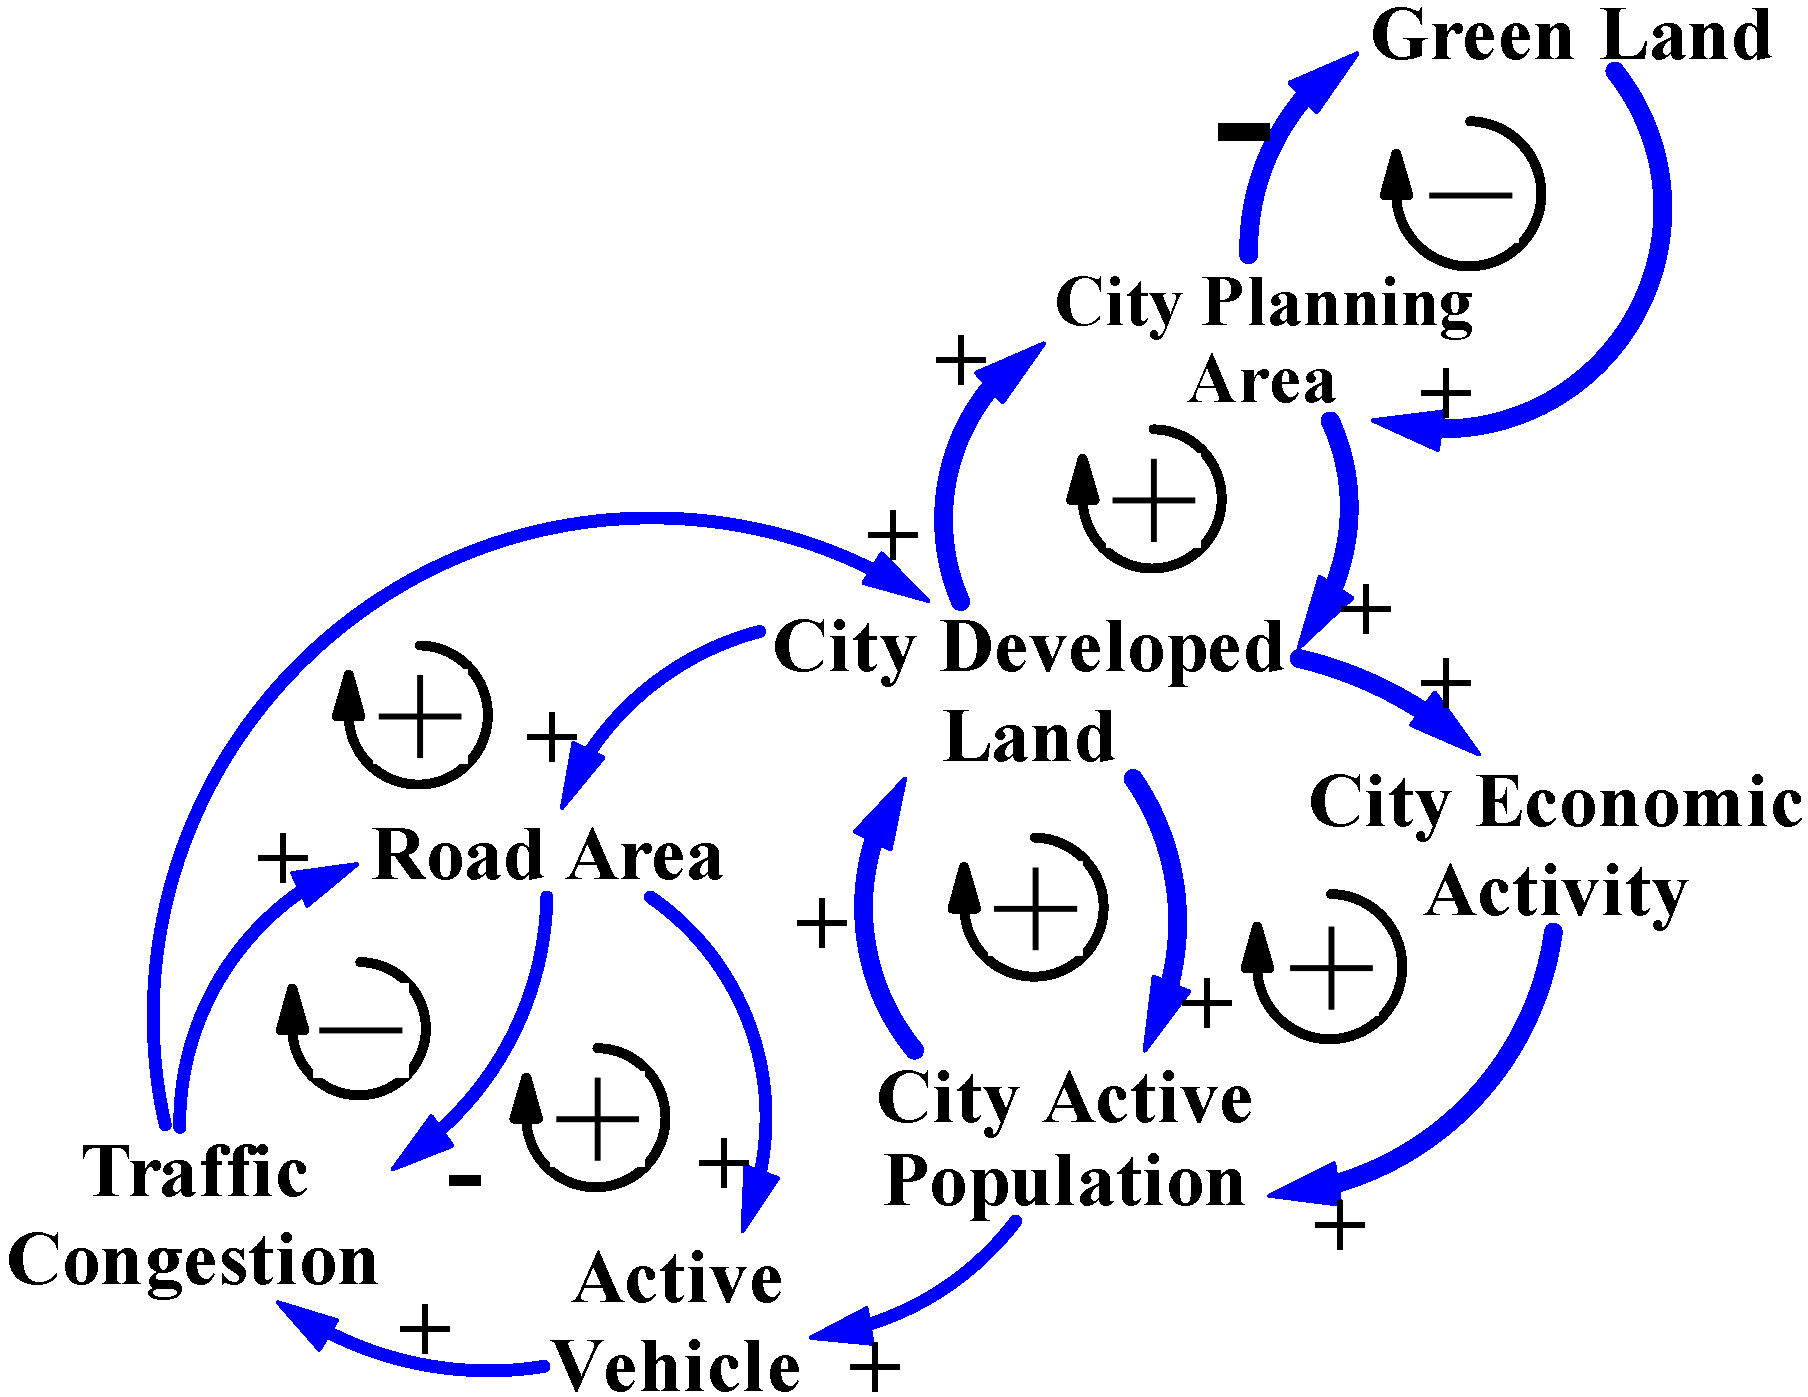
4. Two Treatments of Traffic Congestion Reasoning, CLD Models
4.1. Economic Growth


4.2. Carrying Capacity
| Item | New Taipei City | Taipei City | Taichung City | Tainan City | Kaohsiung City | Sum of Five Metropolises | Total Number of Cities in Taiwan |
|---|---|---|---|---|---|---|---|
| Green Land 1 in 2002 | 440 | 640 | 360 | 280 | 850 | 2590 | 4130 |
| (10.7) 2 | (15.5) | (8.7) | (6.8) | (20.6) | (62.7) | (100.0) | |
| Green Land 1 in 2013 | 800 | 710 | 980 | 800 | 2290 | 5600 | 8000 |
| (10.0) 2 | (8.9) | (12.3) | (10.0) | (28.6) | (70.0) | (100.0) | |
| Increased Area | 360 | 70 | 620 | 520 | 1440 | 3010 | 3870 |
| (81.8) 3 | (10.9) | (172.2) | (185.7) | (169.4) | (116.2) | (93.7) |
| Item | City | County 1 | Total 1 |
|---|---|---|---|
| City Planning Area Decreased | 1 | 5 | 6 |
| City Planning Area Increased | 6 | 9 | 15 |
| City Planning Area Unchanged | 1 | 0 | 1 |
| Population Leaving from Anticipated City Plans | 8 | 12 | 20 |
| Population Approaching to Anticipated City Plans | 0 | 2 | 2 |
| Population Density Leaving from Anticipated City Plans | 6 | 12 | 18 |
| Population Density Approaching to Anticipated City Plans | 2 | 2 | 4 |
| Negative Annual Surplus Revenue and Expenditures | 5 | 11 | 16 |
| Positive Annual Surplus Revenue and Expenditures | 3 | 3 | 6 |

5. Conclusions
5.1. City Sprawl is Not Synonymous with S&D Economic Growth
5.2. City Sprawl and More Roads Will Not Necessarily Alleviate Traffic Congestion
5.3. Causality Reasoning and Logical System Thinking of the CLD Models of the SD Approach in Light of Carrying Capacity Helps Alleviate City Sprawl and Traffic Congestion
5.4. Scope and Further Work
Acknowledgments
Author Contributions
Conflicts of Interest
References
- Executive Yuan, R.O.C. (Taiwan). 2014 National Statistic on County and City. Directorate General of Budget, Accounting and Statistics. (In Chinese). Available online: http://ebas1.ebas.gov.tw/pxweb/Dialog/statfile9.asp (accessed on 5 November 2014).
- Tan, Y.; Bryan, B.; Hugo, G. Development, land-use change and rural resettlement capacity: A case study of the three gorges project, China. Aust. Geogr. 2005, 36, 201–220. [Google Scholar]
- Jim, C.Y.; Yang, F.Y.; Wang, L. Social-ecological impacts of concurrent reservoir inundation and reforestation in the three gorges region of China. Ann. Assoc. Am. Geogr. 2010, 100, 243–268. [Google Scholar] [CrossRef]
- American Planning Association. Policy Guide on Planning for Sustainability. Available online: http://www.planning.org/policy/guides/adopted/sustainability.htm (accessed on 15 June 2013).
- Chen, J.P.; Zeng, M.; Duan, Y.J. Regional carrying capacity evaluation and prediction based on GIS in the Yangtze River Delta, China. Int. J. Geogr. Inf. Sci. 2011, 25, 171–190. [Google Scholar] [CrossRef]
- Khanna, P.; Babu, P.M.; George, M.S. Carrying-capacity as a basis for sustainable development: A case study of National Capital Region in India. Prog. Plan. 1999, 52, 101–166. [Google Scholar] [CrossRef]
- Lane, M. The carrying capacity imperative: Assessing regional carrying capacity methodologies for sustainable land-use planning. Land Use Policy 2010, 27, 1038–1045. [Google Scholar] [CrossRef] [Green Version]
- Li, H.F.; Xing, C.Z.; Gao, Y.L. Application of system dynamics in analyzing the carrying capacity of water resources in Yiwu City, China. Math. Comput. Simul. 2008, 79, 269–278. [Google Scholar] [CrossRef]
- Sterman, J.D. Business Dynamics: Systems Thinking and Modeling for a Complex World; Irwin McGraw-Hill: Boston, MA, USA, 2000. [Google Scholar]
- UNSD (United Nations Statistics Division). Statistical Databases. Available online: http://unstats.un.org/unsd/demographic/products/socind/ (accessed on 30 June 2014).
- Forrester, J.W. World Dynamics, 2nd ed.; Wright-Allen Press: Cambridge, MA, USA, 1973. [Google Scholar]
- Ghaffarzadegan, N.; Lyneis, J.; Richardson, G.P. How small system dynamics models can help the public policy process. Syst. Dyn. Rev. 2011, 27, 22–44. [Google Scholar]
- Meadows, D.H.; Meadown, D.L.; Randers, J. Beyond the Limits: Global Collapse or a Sustainable Future; Earthscan: London, UK, 1992. [Google Scholar]
- Montgomery, E.; Bennett, J.W.; Scudder, T. The impact of human activities on the physical and social environments: New directions in anthropological ecology. Ann. Rev. Anthropol. 1973, 2, 27–61. [Google Scholar] [CrossRef]
- Research Center of Transport Planning and Traffic Engineering. Institute of Transportation Vienna University of Technology, MARS (Metropolitan Activity Relocation Simulator). Available online: http://www.ivv.tuwien.ac.at/forschung/mars-metropolitan-activity-relocation-simulator.html (accessed on 3 October 2014).
- Pfaffenbichler, P.; Emberger, G.; Shepherd, S. A system dynamics approach to land use transport interaction modelling: The strategic model MARS and its application. Syst. Dyn. Rev. 2010, 26, 262–282. [Google Scholar] [CrossRef]
- Department of Statistics, the Ministry of the Interior (MOI), R.O.C. (Taiwan). 2014 Statistical Yearbook of Interior. (In Chinese). Available online: http://sowf.moi.gov.tw/stat/year/list.htm (accessed on 5 November 2014).
- Chiang, S.H. The source of metropolitan growth: The role of commuting. Growth Chang. 2012, 43, 143–166. [Google Scholar] [CrossRef]
- Roberts, N.; Andersen, D.F.; Deal, R.M.; Garet, M.S.; Shaffer, W.A. Introduction to Computer Simulation: The System Dynamics Approach; Addison-Wesley Publishing Company, The Scholars Book Co., Ltd.: Taipei, Taiwan, 1983; p. 48. [Google Scholar]
- Munroe, D.; York, A.M. Jobs, houses, and trees: Changing regional structure, local land-use patterns, and forest cover in Southern Indiana. Growth Chang. 2003, 34, 299–320. [Google Scholar] [CrossRef]
- Schmidt, E.T. Key issues of land use planning in West Germany. Growth Chang. 1981, 12, 44–52. [Google Scholar] [CrossRef]
- Benjaminsen, T.A.; Rohde, R.; Sjaastad, E.; Wisborg, P.; Lebert, T. Land Reform, Range ecology, and carrying capacities in Namaqualand, South Africa. Ann. Assoc. Am. Geogr. 2006, 96, 524–540. [Google Scholar] [CrossRef]
- Jim, C.Y. A planning strategy to augment the diversity and biomass of roadside trees in urban Hong Kong. Landsc. Urban Plan. 1999, 44, 13–32. [Google Scholar] [CrossRef]
- Postel, S. Carrying capacity: Earth’s bottom line. In State of the World; Brown, L.R., Durning, A.T., Flavin, C., French, H.F., Lenssen, N., Lowe, M.D., Misch, A., Postel, S., Renner, M., Weber, P., et al., Eds.; W.W. Norton: New York, NY, USA, 1994; pp. 3–21. [Google Scholar]
© 2014 by the authors; licensee MDPI, Basel, Switzerland. This article is an open access article distributed under the terms and conditions of the Creative Commons Attribution license (http://creativecommons.org/licenses/by/4.0/).
Share and Cite
Chen, M.-C.; Chang, K. Reasoning the Causality of City Sprawl, Traffic Congestion, and Green Land Disappearance in Taiwan Using the CLD Model. Int. J. Environ. Res. Public Health 2014, 11, 11464-11480. https://doi.org/10.3390/ijerph111111464
Chen M-C, Chang K. Reasoning the Causality of City Sprawl, Traffic Congestion, and Green Land Disappearance in Taiwan Using the CLD Model. International Journal of Environmental Research and Public Health. 2014; 11(11):11464-11480. https://doi.org/10.3390/ijerph111111464
Chicago/Turabian StyleChen, Mei-Chih, and Kaowen Chang. 2014. "Reasoning the Causality of City Sprawl, Traffic Congestion, and Green Land Disappearance in Taiwan Using the CLD Model" International Journal of Environmental Research and Public Health 11, no. 11: 11464-11480. https://doi.org/10.3390/ijerph111111464
APA StyleChen, M.-C., & Chang, K. (2014). Reasoning the Causality of City Sprawl, Traffic Congestion, and Green Land Disappearance in Taiwan Using the CLD Model. International Journal of Environmental Research and Public Health, 11(11), 11464-11480. https://doi.org/10.3390/ijerph111111464