Multivariate Optimization for Extraction of Pyrethroids in Milk and Validation for GC-ECD and CG-MS/MS Analysis


Abstract
:1. Introduction


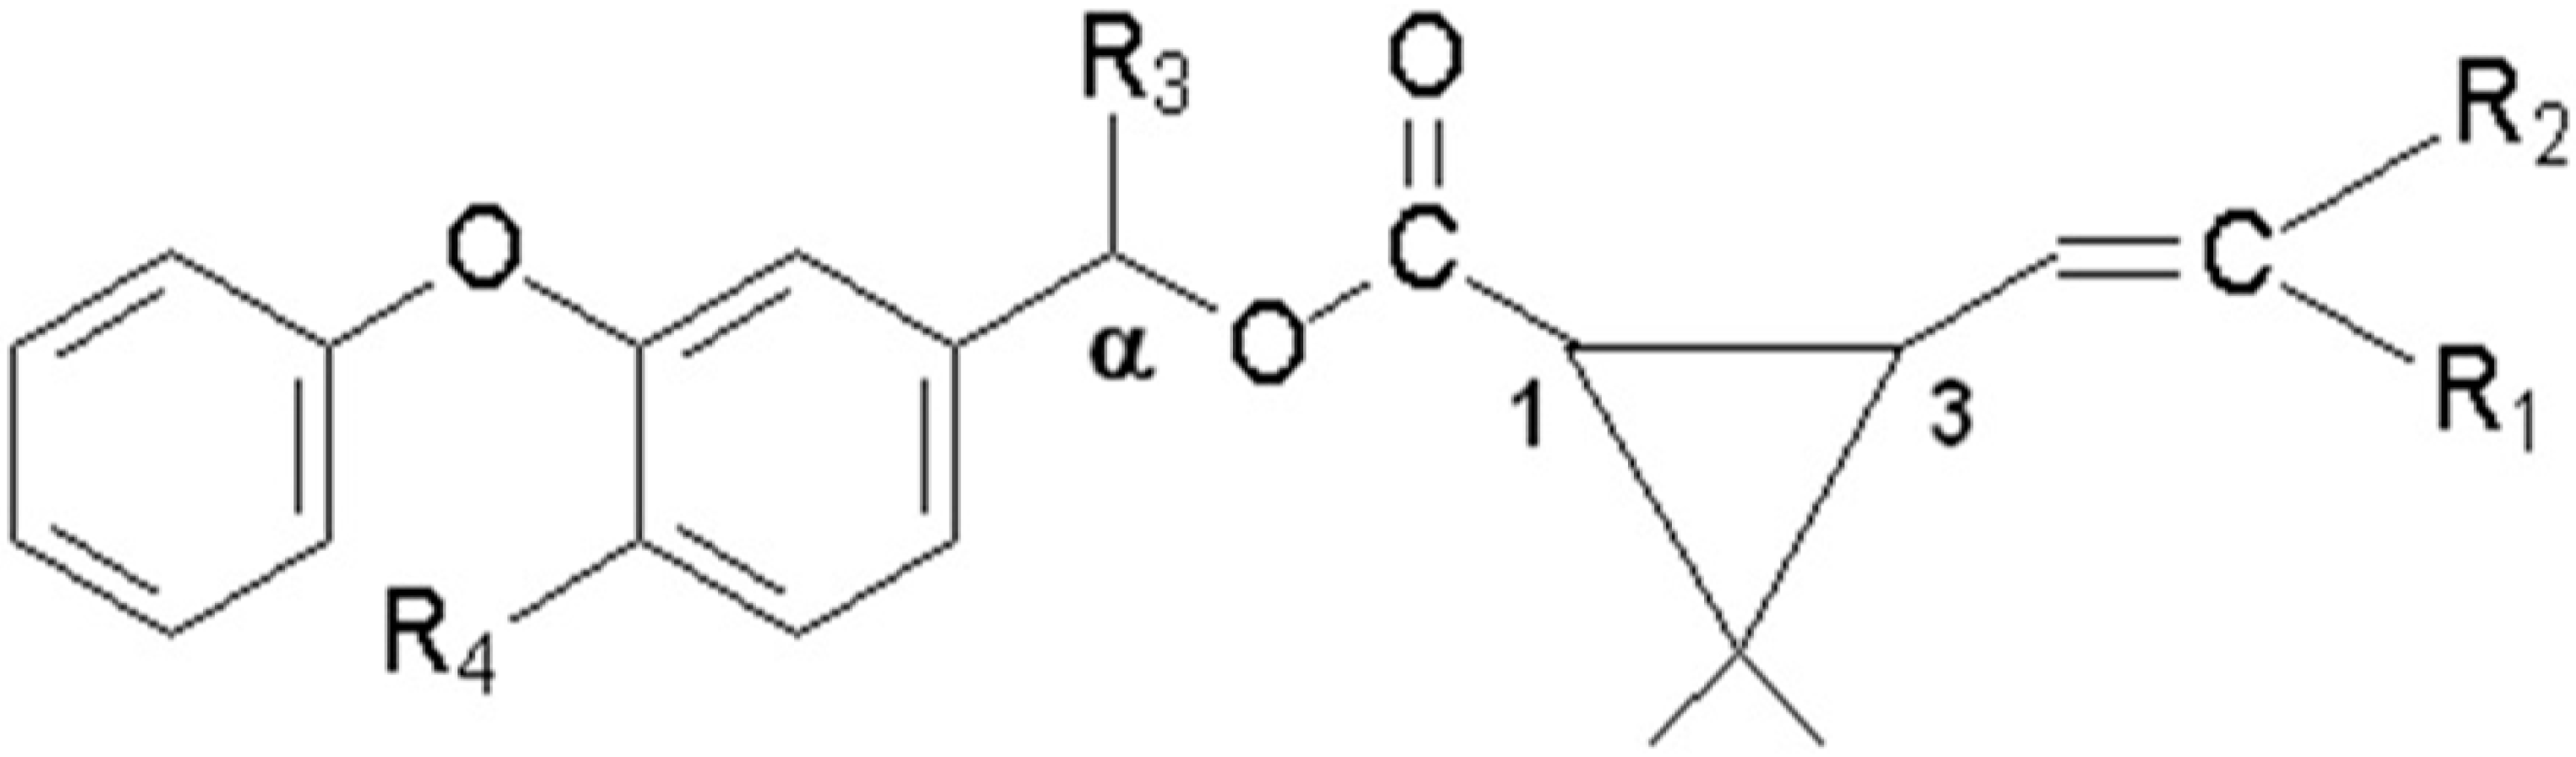
| Pyrethroid | MW a | R1 b | R2 b | R3 b | R4 b |
|---|---|---|---|---|---|
| Gamma-cyhalothrin | 449.9 | Cl | CF3 | CN | H |
| Lambda-cyhalothrin | 449.9 | Cl | CF3 | CN | H |
| cyfluthrin | 391.3 | Cl | Cl | H | H |
| cypermethrin | 434.4 | Cl | Cl | CN | F |
| permethrin | 391.3 | Cl | Cl | CN | H |
| deltamethrin | 434.4 | Br | Br | CN | H |
| fenvalerate | 416.3 | H | Cl | CN | H |
2. Experimental Section
2.1. Chemicals and Apparatus
2.2. Chromatographic Analysis
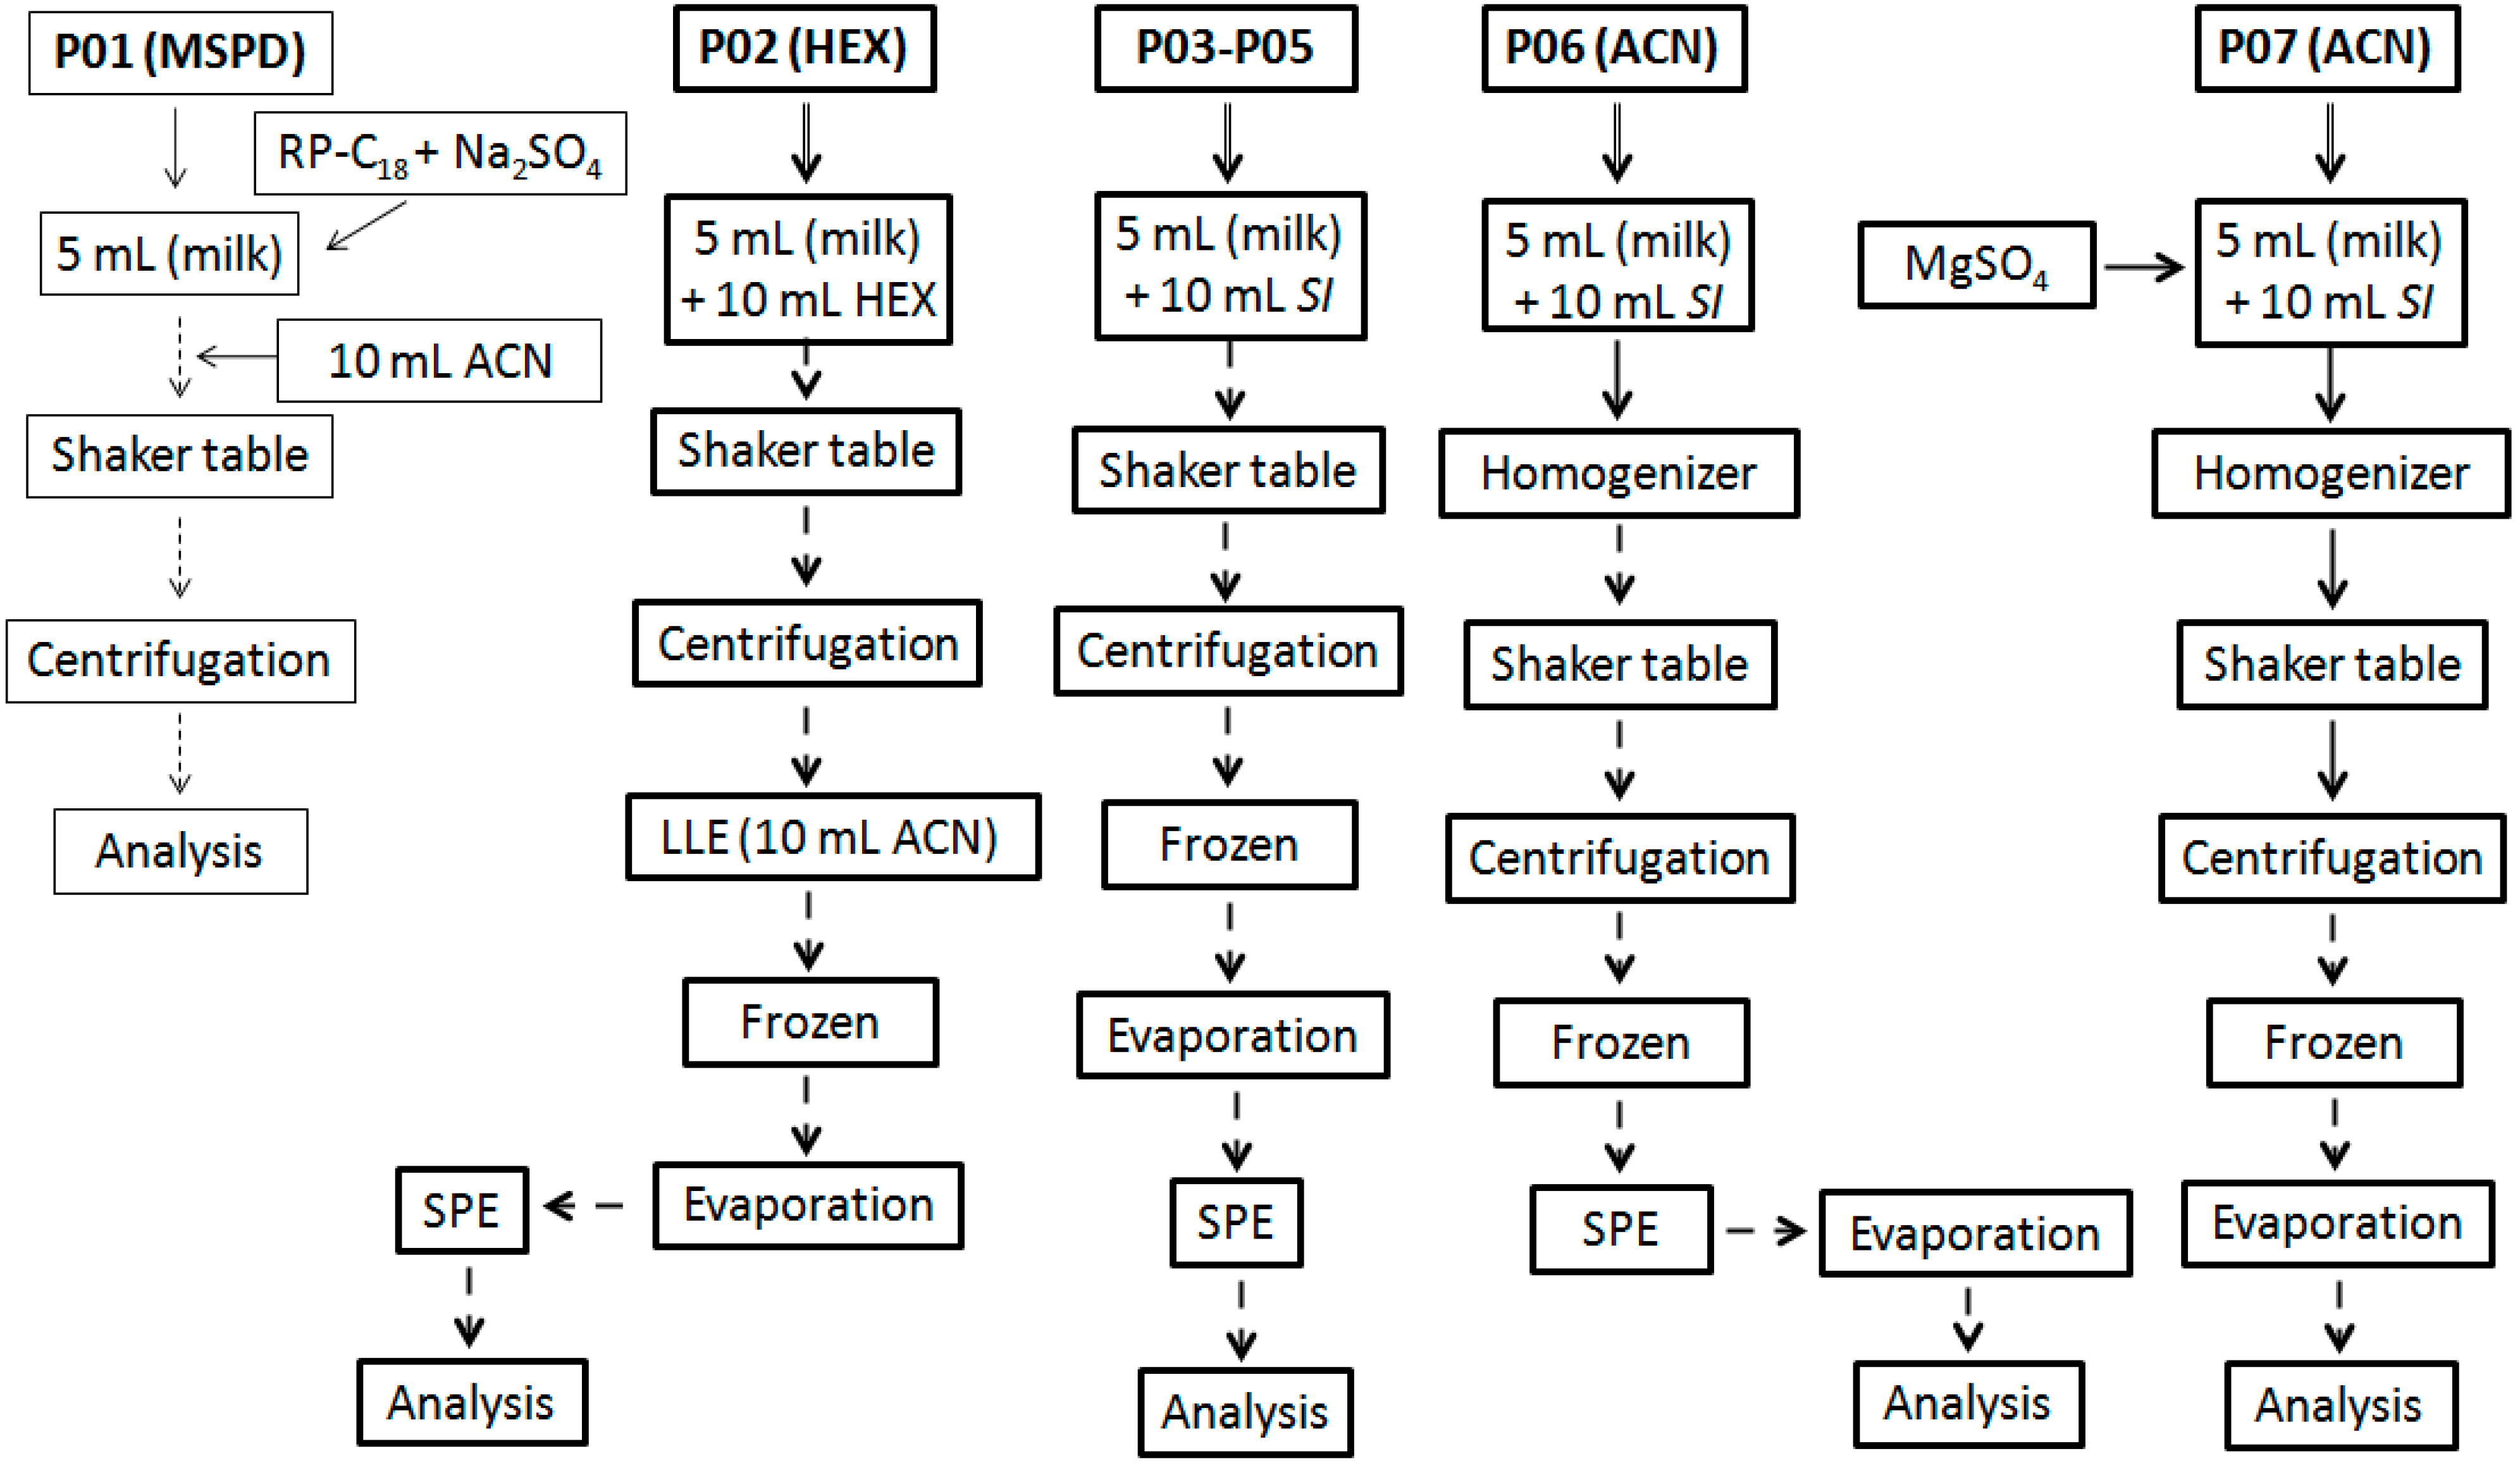
2.3. Extraction Methodologies

2.4. Experimental Optimization
| Experiment a | Coded Values b | Planned Values c | ||||
|---|---|---|---|---|---|---|
| t | V | H | Agitation Time (min) | ACN (mL) | Homogenization Time (s) | |
| 1 | 1 | 0 | 0 | 30 | 10.5 | 10.0 |
| 2 | 0.5 | 0.866 | 0 | 25 | 13.5 | 10.0 |
| 3 | 0.5 | 0.289 | 0.817 | 25 | 11.5 | 14.4 |
| 4 | −1 | 0 | 0 | 10 | 10.5 | 10.0 |
| 5 | −0.5 | −0.866 | 0 | 15 | 7.5 | 10.0 |
| 6 | −0.5 | −0.289 | −0.817 | 15 | 9.5 | 5.6 |
| 7 | 0.5 | −0.866 | 0 | 25 | 7.5 | 10.0 |
| 8 | 0.5 | −0.289 | −0.817 | 25 | 9.5 | 5.6 |
| 9 | −0,5 | 0.866 | 0 | 15 | 13.5 | 10.0 |
| 10 | 0 | 0.577 | −0.817 | 20 | 12.5 | 5.6 |
| 11 | −0.5 | 0.289 | 0.817 | 15 | 11.5 | 14.4 |
| 12 | 0 | −0.577 | 0.817 | 20 | 8.5 | 14.4 |
| 13 | 0 | 0 | 0 | 20 | 10.5 | 10.0 |
| 14 | 0 | 0 | 0 | 20 | 10.5 | 10.0 |
| 15 | 0 | 0 | 0 | 20 | 10.5 | 10.0 |
2.5. Validation Procedure
3. Results and Discussion
3.1. Extraction Methodologies
| Sample Preparation Initial Screening | ||||
|---|---|---|---|---|
| Procedure a | RE (%) b | CV (%) c | CoE (mg) d | CE (abs) e |
| P01 (MSPD) | 50–60 | 35 | 8.0 | 0.455 |
| P02 (HEX) | 30–50 | 30 | 17.5 | 0.460 |
| P03 (ACO) | 50–60 | 25 | 15.4 | 0.508 |
| P04 (EAC) | 50–60 | 23 | 22.5 | 0.780 |
| P05 (ACN) | 50–60 | 22 | 5.1 | 0.320 |
| P06 (ACN) | 80–90 | 20 | 7.2 | 0.340 |
| P07 (ACN) | 80–90 | 20 | 7.4 | 0.335 |
| Doehlert Design | ||||
| Best Conditions f | ||||
| Variable | (t/min) | (V/mL) | (H/s) | |
| Value | 20.0 | 10.5 | 10.0 | |
| Equations g | ||||
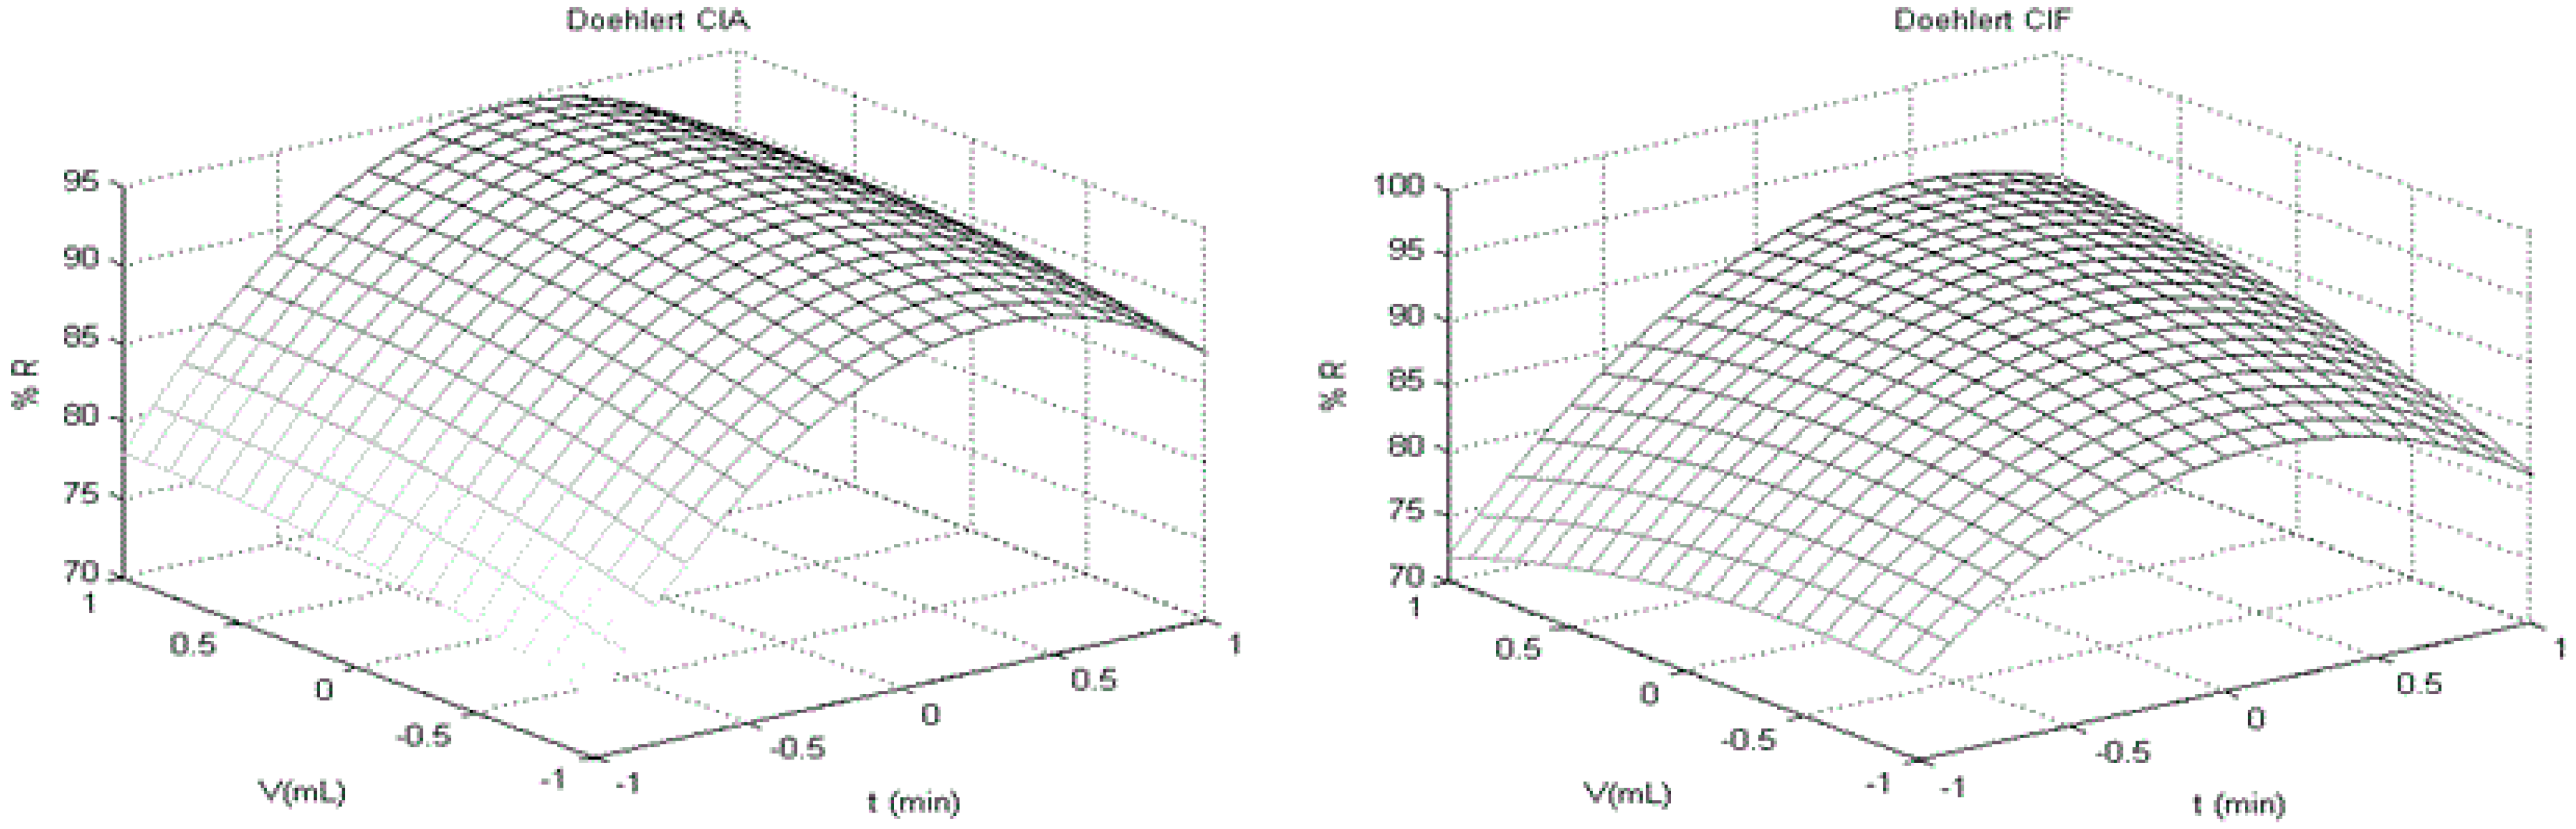
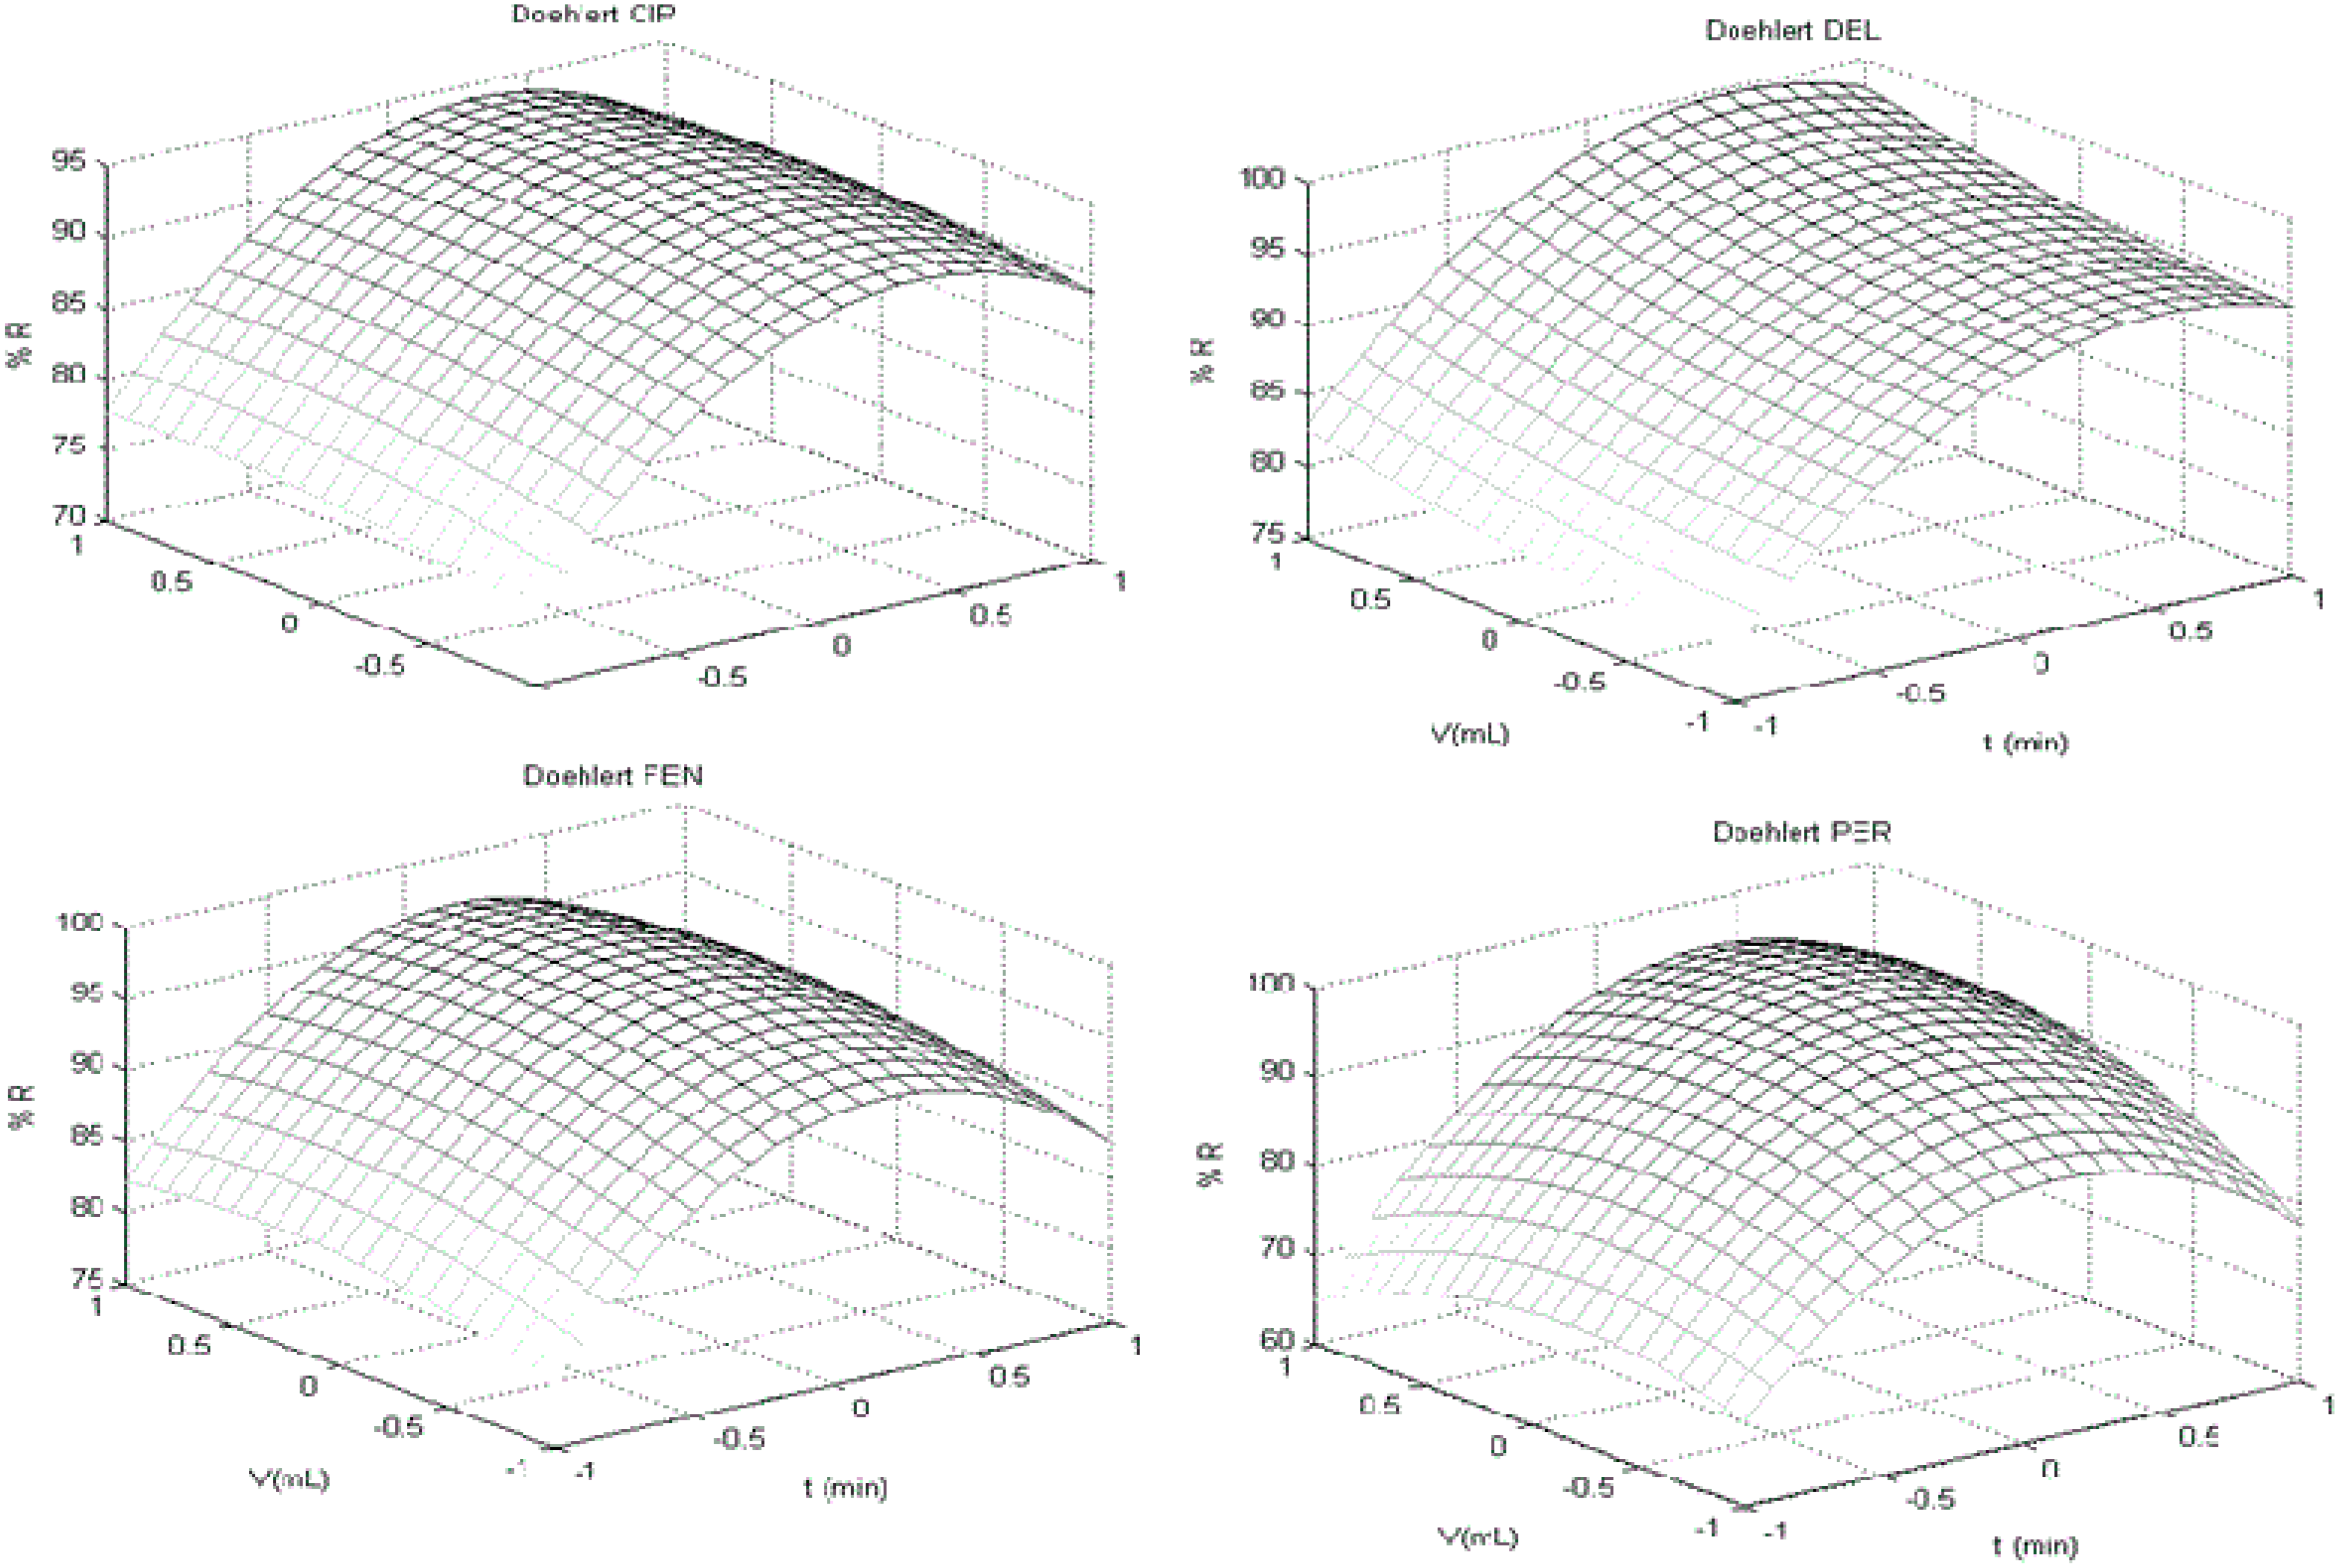
| (l-CYH) R% = (1.55 t) + (6.07 V) − (1.20 t2) − (10.49 V2) − (0.58 t V) | ||||
| (PER) R% = (1.77 t) + (8.11 V ) + (−5.58 t2) − (14.97 V 2) + (4.12 t V) | ||||
| (g-CYH) R% = (1.40 t) + (6.07 V) − (1.2 t2) − (10.49 V 2) − (0.57 t V) | ||||
| (CYF) R% = (0.82 t) + (5.98 V) − (1.1 t2) − (9.49 V 2) − (0.5 t V) | ||||
| (CYP) R% = ( 0.88 t) + ( 6.38 V) − (−1.07 t2) − (9.33 V 2) − (−0.48 t V) | ||||
| (DEL) R% = (2.06 t) + (7.61 V ) + (0.87 t2) − (7.29 V 2) + (−0.09 t V ) + 2.00 | ||||
| (FEV) R% = (1.09 t) + (−2.01 t2) + (−10.46 V 2) + (−0.23 t V) | ||||
3.2. Doehlert Design

3.3. Validation Procedure
| Analyte | RT a | RE (%) b | |||
|---|---|---|---|---|---|
| MS/MS | ECD | MS/MS | ECD | t-value c | |
| CYH-g | 20.74 | 17.43 | 97.5 | 86.8 | −1.05 |
| CYH-l | 21.10 | 17.77 | 96.9 | 85.2 | 1.20 |
| PER | 22.63 | 18.91 | 97.7 | 88.9 | 0.89 |
| CYF | 23.96 | 20.22 | 93.28 | 91.49 | 0.56 |
| CYP | 24.53 | 20.56 | 96.67 | 85.15 | 1.60 |
| DEL | 25.83 | 22.14 | 99.95 | 92.85 | 0.80 |
| FEV | 27.23 | 23.14 | 95.50 | 88.50 | 0.76 |
| GC-ECD | ||||||||||||
|---|---|---|---|---|---|---|---|---|---|---|---|---|
| 0.5 VL e | 1.0 VL | 1.5 VL | ||||||||||
| RE (%) f | CV (%) g | CV (%) h | RE (%) | CV (%) | CV (%) | RE (%) | CV (%) | CV (%) | ||||
| CYH-g(25)(2) | 0.99 | 0.3 | 0.9 | 95.4 | 12.3 | 10.4 | 92.1 | 8.5 | 13.7 | 96.5 | 8.3 | 12.5 |
| CYH-l (25) | 0.99 | 0.3 | 0.9 | 93.1 | 10.6 | 11.6 | 96.5 | 9.6 | 12.6 | 94.3 | 9.6 | 13.6 |
| PER (50) | 0.99 | 0.4 | 1.1 | 95.7 | 14.5 | 15.1 | 93.4 | 16.5 | 17.8 | 90.9 | 10.8 | 15.2 |
| CYF (40) | 0.99 | 0.7 | 2.1 | 90.8 | 8.6 | 14.9 | 87.6 | 9.6 | 12.3 | 92.0 | 9.2 | 9.4 |
| CYP (100) | 0.99 | 0.6 | 1.8 | 88.7 | 10.8 | 13.7 | 90.6 | 8.1 | 10.3 | 95.3 | 12.1 | 14.5 |
| DEL (30) | 0.99 | 0.7 | 2.1 | 95.5 | 8.9 | 15.2 | 92.2 | 9.5 | 12.7 | 90.4 | 8.1 | 11.7 |
| FEV (40) | 0.99 | 0.7 | 2.1 | 99.6 | 12.1 | 10.5 | 101.4 | 11.9 | 14.7 | 97.4 | 12.5 | 14.2 |
| GC-MS/MS | ||||||||||||
| 0.5 VL | 1.0 VL | 1.5 VL | ||||||||||
| RE(%) | CV (%) | CV (%) | RE (%) | CV(%) | CV (%) | RE (%) | CV (%) | CV (%) | ||||
| CYH-g | 0.99 | 0.3 | 0.9 | 86.5 | 8.5 | 9.6 | 88.0 | 14.5 | 15.1 | 90.2 | 9.0 | 13.7 |
| CYH-l | 0.99 | 0.3 | 0.9 | 84.2 | 9.0 | 10.2 | 90.2 | 11.3 | 12.0 | 85.6 | 10.6 | 14.6 |
| PER | 0.99 | 0.4 | 1.2 | 88.9 | 9.7 | 12.4 | 93.6 | 12.8 | 12.7 | 92.3 | 11.2 | 12.5 |
| CYF | 0.99 | 0.7 | 2.2 | 90.3 | 13.5 | 13.2 | 90.9 | 9.6 | 11.8 | 94.5 | 8.1 | 9.0 |
| CYP | 0.99 | 0.7 | 2.2 | 88.4 | 12.9 | 14.0 | 87.3 | 8.2 | 10.9 | 89.1 | 10.5 | 11.0 |
| DEL | 0.99 | 0.9 | 2.7 | 85.4 | 11.5 | 11.9 | 93.7 | 13.5 | 15.4 | 90.2 | 15.5 | 15.6 |
| FEV | 0.99 | 1.0 | 3.0 | 88.9 | 13.6 | 15.8 | 91.6 | 14.7 | 16.6 | 92.0 | 12.0 | 13.9 |
| Analytes | Quantifier a | Qualifier a | ||||
|---|---|---|---|---|---|---|
| Precursorion (m/z) | Production (m/z) | CE (eV) b | Precursorion (m/z) | Production (m/z) | CE (eV) | |
| CYH-g | 181.1 | 127.1 | 30 | 181.1 | 152.1 | 35 |
| CYH-l | 180.0 | 127.1 | 30 | 181.1 | 152.1 | 35 |
| PER | 183.3 | 165.1 | 10 | 183.3 | 168.1 | 15 |
| CYF | 181.1 | 152.1 | 5 | 181.1 | 127.1 | 5 |
| CYP | 163.0 | 127.1 | 5 | 163.0 | 91.1 | 5 |
| DEL | 166.9 | 125.0 | 5 | 124.9 | 89.0 | 5 |
| FEV | 252.8 | 173.9 | 5 | 252.8 | 172.0 | 5 |
3.4. Method Applicability
4. Conclusions
Acknowledgments
Author Contributions
Conflicts of Interest
References
- Feijo, L.D.; Fleury, M.S.; Portz, A.J. Identification and assessment of emerging issues associated with chemical contaminants in dairy products. Bull. Int. Dairy Fed. 2013, 465, 20–30. [Google Scholar]
- Graf, J.F.; Gogolewski, R.; Leach-Bing, N.; Sabatini, G.A.; Molento, M.B.; Bordin, E.L.; Arantes, G.J. Tick control: An industry point of view. Parasitology 2004, 129, S427–S442. [Google Scholar] [CrossRef]
- Sassine, A.; Moura, S.; Bustillos, O. Cypermethrin residues determination in the milk of a lactating dairy cow by gas chromatography-ion trap mass spectrometry. J. Anal. Toxicol. 2004, 28, 238–241. [Google Scholar] [CrossRef] [PubMed]
- Matisová, E.; Hrouzková, S. Analysis of endocrine disrupting pesticides by capillary GC with mass spectrometric detection. Int. J. Environ. Res. Public Health 2012, 9, 3166–3196. [Google Scholar] [CrossRef] [PubMed]
- Bissacot, D.Z.; Vassilieff, I. HPLC determination of flumethrin, deltamethrin, cypermethrin, and cyhalothrin residues in the milk and blood of lactating dairy cows. J. Anal. Toxicol. 1997, 21, 397–402. [Google Scholar] [CrossRef] [PubMed]
- Bissacot, D.Z.; Vassilieff, I. Pyrethroids residues in milk and blood of dairy cows following single topical applications. Vet. Hum. Toxicol. 1997, 39, 6–8. [Google Scholar] [PubMed]
- Lesmes-Fabian, C.; Binder, C.R. Pesticide flow analysis to assess human exposure in greenhouse flower production in Colombia. Int. J. Environ. Res. Public Health 2013, 10, 1168–1185. [Google Scholar] [CrossRef] [PubMed]
- Gassner, B.; Wüthrich, A.; Lis, J.; Scholtysik, G.; Solioz, M. Topical application of synthetic pyrethoids to cattle as a source of persistent environmental contamination. J. Environ. Sci. Health Pt. B 1997, 32, 729–739. [Google Scholar] [CrossRef]
- Feo, M.L.; Eljarrat, E.; Barceló, D. Determination of pyrethroid insecticides in environmental samples. Trends Anal. Chem. 2010, 29, 692–705. [Google Scholar] [CrossRef]
- Chung, S.W.; Lam, C.H. Development and validation of a method for determination of residues of 15 pyrethroids and two metabolites of dithiocarbamates in foods by ultra-performance liquid chromatography-tandem mass spectrometry. Anal. Bioanal. Chem. 2012, 403, 885–896. [Google Scholar] [CrossRef] [PubMed]
- Di Muccio, A.; Pelosi, P.; Barbini, D.A. Selective extraction of pyrethroid pesticide residues from milk by solid-matrix dispersion. J. Chromatogr. A 1997, 765, 51–60. [Google Scholar] [CrossRef] [PubMed]
- Khay, S.; Abd El-Aty, A.M.; Choi, J.-H.; Shin, E.H.; Shin, H.C.; Kim, J.S.; Chang, B.J.; Lee, C.H.; Shin, S.C.; Jeong, J.Y.; et al. Simultaneous determination of pyrethroids from pesticide residues in porcine muscle and pasteurized milk using GC. J. Sep. Sci. 2009, 32, 244–251. [Google Scholar] [CrossRef]
- Fernandez-Alvarez, M.; Llompart, M.; Lamas, J.P.; Lores, M.; Garcia-Jares, C.; Cela, R.; Dagnac, T. Development of a solid-phase microextraction gas chromatography with microelectron-capture detection method for a multiresidue analysis of pesticides in bovine milk. Analy. Chim. Acta 2008, 617, 37–50. [Google Scholar] [CrossRef]
- Goulart, S.M.; de Queiroz, M.E.; Neves, A.A.; Queiroz, J.H.D. Low-temperature clean-up method for the determination of pyrethroids in milk using gas chromatography with electron capture detection. Talanta 2008, 75, 1320–1330. [Google Scholar] [CrossRef] [PubMed]
- Amelung, W.; Alexander, N.; Laabs, V. Multiresidue Determination of Pesticides in Acid-Clay Soils from Thailand. J. AOAC Int. 2007, 90, 1659–1669. [Google Scholar] [PubMed]
- Vázquez, P.P.; Mughari, A.R.; Galera, M.M. Application of solid-phase microextraction for determination of pyrethroids in groundwater using liquid chromatography with post-column photochemically induced fluorimetry derivatization and fluorescence detection. J. Chromatogr. A 2008, 1188, 61–68. [Google Scholar] [CrossRef] [PubMed]
- Navickiene, S.; Aquino, A.; Bezerra, D.S. A matrix solid-phase dispersion method for the extraction of seven pesticides from mango and papaya. J. Chromatogr. Sci. 2010, 48, 750–754. [Google Scholar] [CrossRef] [PubMed]
- Rissato, S.R.; Galhiane, M.S.; Apon, B.M.; Jan Arruda, M.S.P. Multiresidue analysis of pesticides in soil by supercritical fluid extraction/gas chromatography with electron-capture detection and confirmation by gas chromatography-mass spectrometry. J. Agric. Food Chem. 2005, 53, 62–69. [Google Scholar] [CrossRef] [PubMed]
- Albaseer, S.S.; Rao, R.N.; Swamy, Y.V.; Mukkanti, K. An overview of sample preparation and extraction of synthetic pyrethroids from water, sediment and soil. J. Chromatogr. A 2010, 35, 5537–5427. [Google Scholar] [CrossRef]
- Rübensam, G.; Barreto, F.; Hoff, R.B.; Pizzolato, T.M. Determination of avermectin and milbemycin residues in bovine muscle by liquid chromatography-tandem mass spectrometry and fluorescence detection using solvent extraction and low temperature cleanup. Food Control. 2013, 29, 55–60. [Google Scholar] [CrossRef]
- Poole, C.F. Matrix-induced response enhancement in pesticide residue analysis by gas chromatography. J. Chromatogr. A 2007, 1158, 241–250. [Google Scholar] [CrossRef] [PubMed]
- Holadova, K.; Kempny, M. Matrix-induced effects: A critical point in the gas chromatographic analysis of pesticide residues. J. Chromatogr. A 1998, 800, 283–295. [Google Scholar] [CrossRef]
- Depoi, F.S.; Bentlin, F.R.S.; Ferrão, M.F.; Pozebon, D. Multivariate optimization for cloud point extraction and determination of lanthanides. Anal. Methods 2012, 4, 2809–2814. [Google Scholar] [CrossRef]
- Bezerra, M.A.; Santelli, R.E.; Oliveira, E.P.; Villar, L.S.; Escaleira, L.A. Response surface methodology (RSM) as a tool for optimization in analytical chemistry. Talanta 2008, 76, 965–977. [Google Scholar] [PubMed]
- De Sousa, F.A.; Costa, A.I.G.; de Queiroz, M.E.L.R.; Teófilo, R.F.; Neves, A.A.; de Pinho, G.P. Evaluation of matrix effect on the GC response of eleven pesticides by PCA. Food Chem. 2012, 135, 179–185. [Google Scholar] [CrossRef]
- European Commission. Guidance Document on Analytical Quality Control and Validation Procedures for Pesticide Residues Analysis in Food and Feed. 1 January 2014. Available online: http://ec.europa.eu/food/plant/pesticides/guidance_documents/docs/qualcontrol_en.pdf (accessed on 28 October 2014).
- Rübensam, G.; Barreto, F.; Hoff, R.B.; Kist, T.L.; Pizzolato, T.M. A liquid-liquid extraction procedure followed by a low temperature purification step for the analysis of macrocyclic lactones in milk by liquid chromatography-tandem mass spectrometry and fluorescence detection. Anal. Chim. Acta 2011, 705, 24–29. [Google Scholar] [CrossRef] [PubMed]
- BRASIL. Ministério da Agricultura, Pecuária e Abastecimento, Secretaria de Defesa Agropecuária, Instrução Normativa No. 16/2013. Available online: http://www.agricultura.gov.br/arq_editor/file/Aniamal/Laborat%C3%B3rios/Legisla%C3%A7%C3%B5es%20e%20orienta%C3%A7%C3%B5es/Instru%C3%A7%C3%A3o%20Normativa%20n%C2%BA%2057%20de%2011_12_2013%20-%20vers%C3%A3o%20do%20D_O_U.pdf (accessed on 28 October 2014).
© 2014 by the authors; licensee MDPI, Basel, Switzerland. This article is an open access article distributed under the terms and conditions of the Creative Commons Attribution license (http://creativecommons.org/licenses/by/4.0/).
Share and Cite
Meneghini, L.Z.; Rübensam, G.; Bica, V.C.; Ceccon, A.; Barreto, F.; Ferrão, M.F.; Bergold, A.M. Multivariate Optimization for Extraction of Pyrethroids in Milk and Validation for GC-ECD and CG-MS/MS Analysis. Int. J. Environ. Res. Public Health 2014, 11, 11421-11437. https://doi.org/10.3390/ijerph111111421
Meneghini LZ, Rübensam G, Bica VC, Ceccon A, Barreto F, Ferrão MF, Bergold AM. Multivariate Optimization for Extraction of Pyrethroids in Milk and Validation for GC-ECD and CG-MS/MS Analysis. International Journal of Environmental Research and Public Health. 2014; 11(11):11421-11437. https://doi.org/10.3390/ijerph111111421
Chicago/Turabian StyleMeneghini, Leonardo Zanchetti, Gabriel Rübensam, Vinicius Claudino Bica, Amanda Ceccon, Fabiano Barreto, Marco Flores Ferrão, and Ana Maria Bergold. 2014. "Multivariate Optimization for Extraction of Pyrethroids in Milk and Validation for GC-ECD and CG-MS/MS Analysis" International Journal of Environmental Research and Public Health 11, no. 11: 11421-11437. https://doi.org/10.3390/ijerph111111421
APA StyleMeneghini, L. Z., Rübensam, G., Bica, V. C., Ceccon, A., Barreto, F., Ferrão, M. F., & Bergold, A. M. (2014). Multivariate Optimization for Extraction of Pyrethroids in Milk and Validation for GC-ECD and CG-MS/MS Analysis. International Journal of Environmental Research and Public Health, 11(11), 11421-11437. https://doi.org/10.3390/ijerph111111421