Spatial and Temporal Variations of Satellite-Derived Multi-Year Particulate Data of Saudi Arabia: An Exploratory Analysis


Abstract
:1. Introduction
1.1. Background
1.2. Particulate Matter, Health Risks and Remote Sensing
2. Materials and Methods
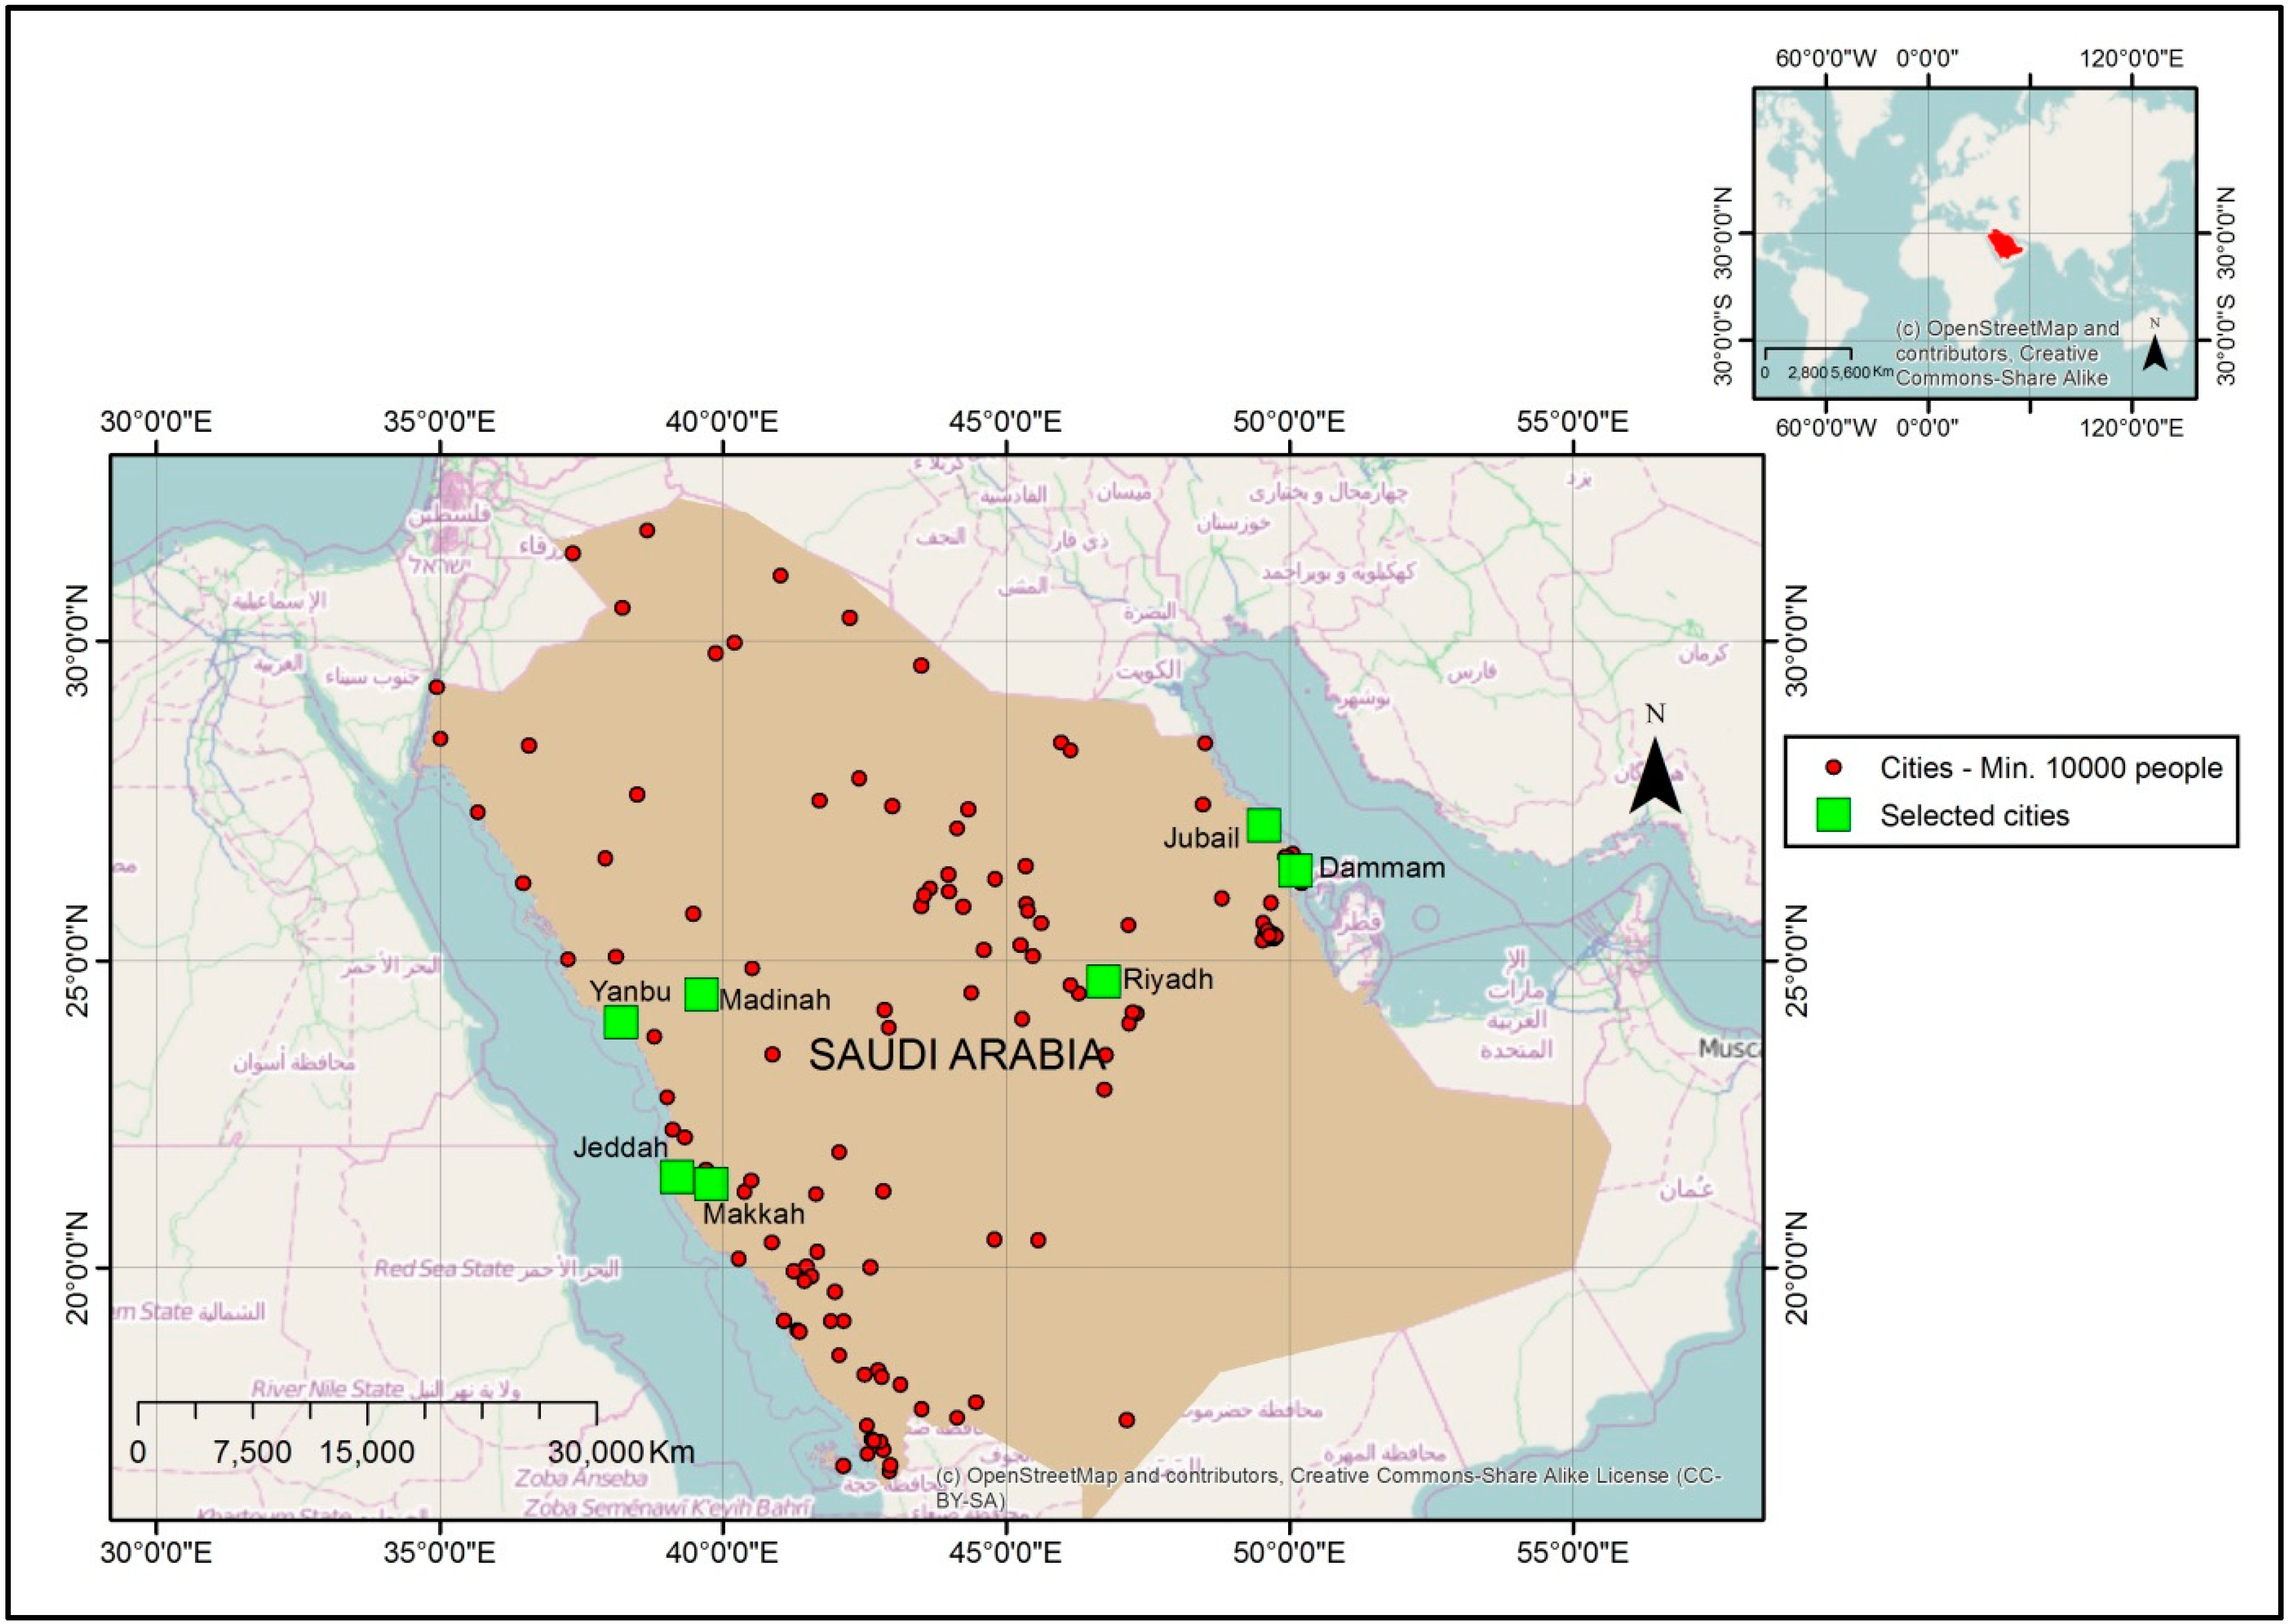
2.1. Study Area
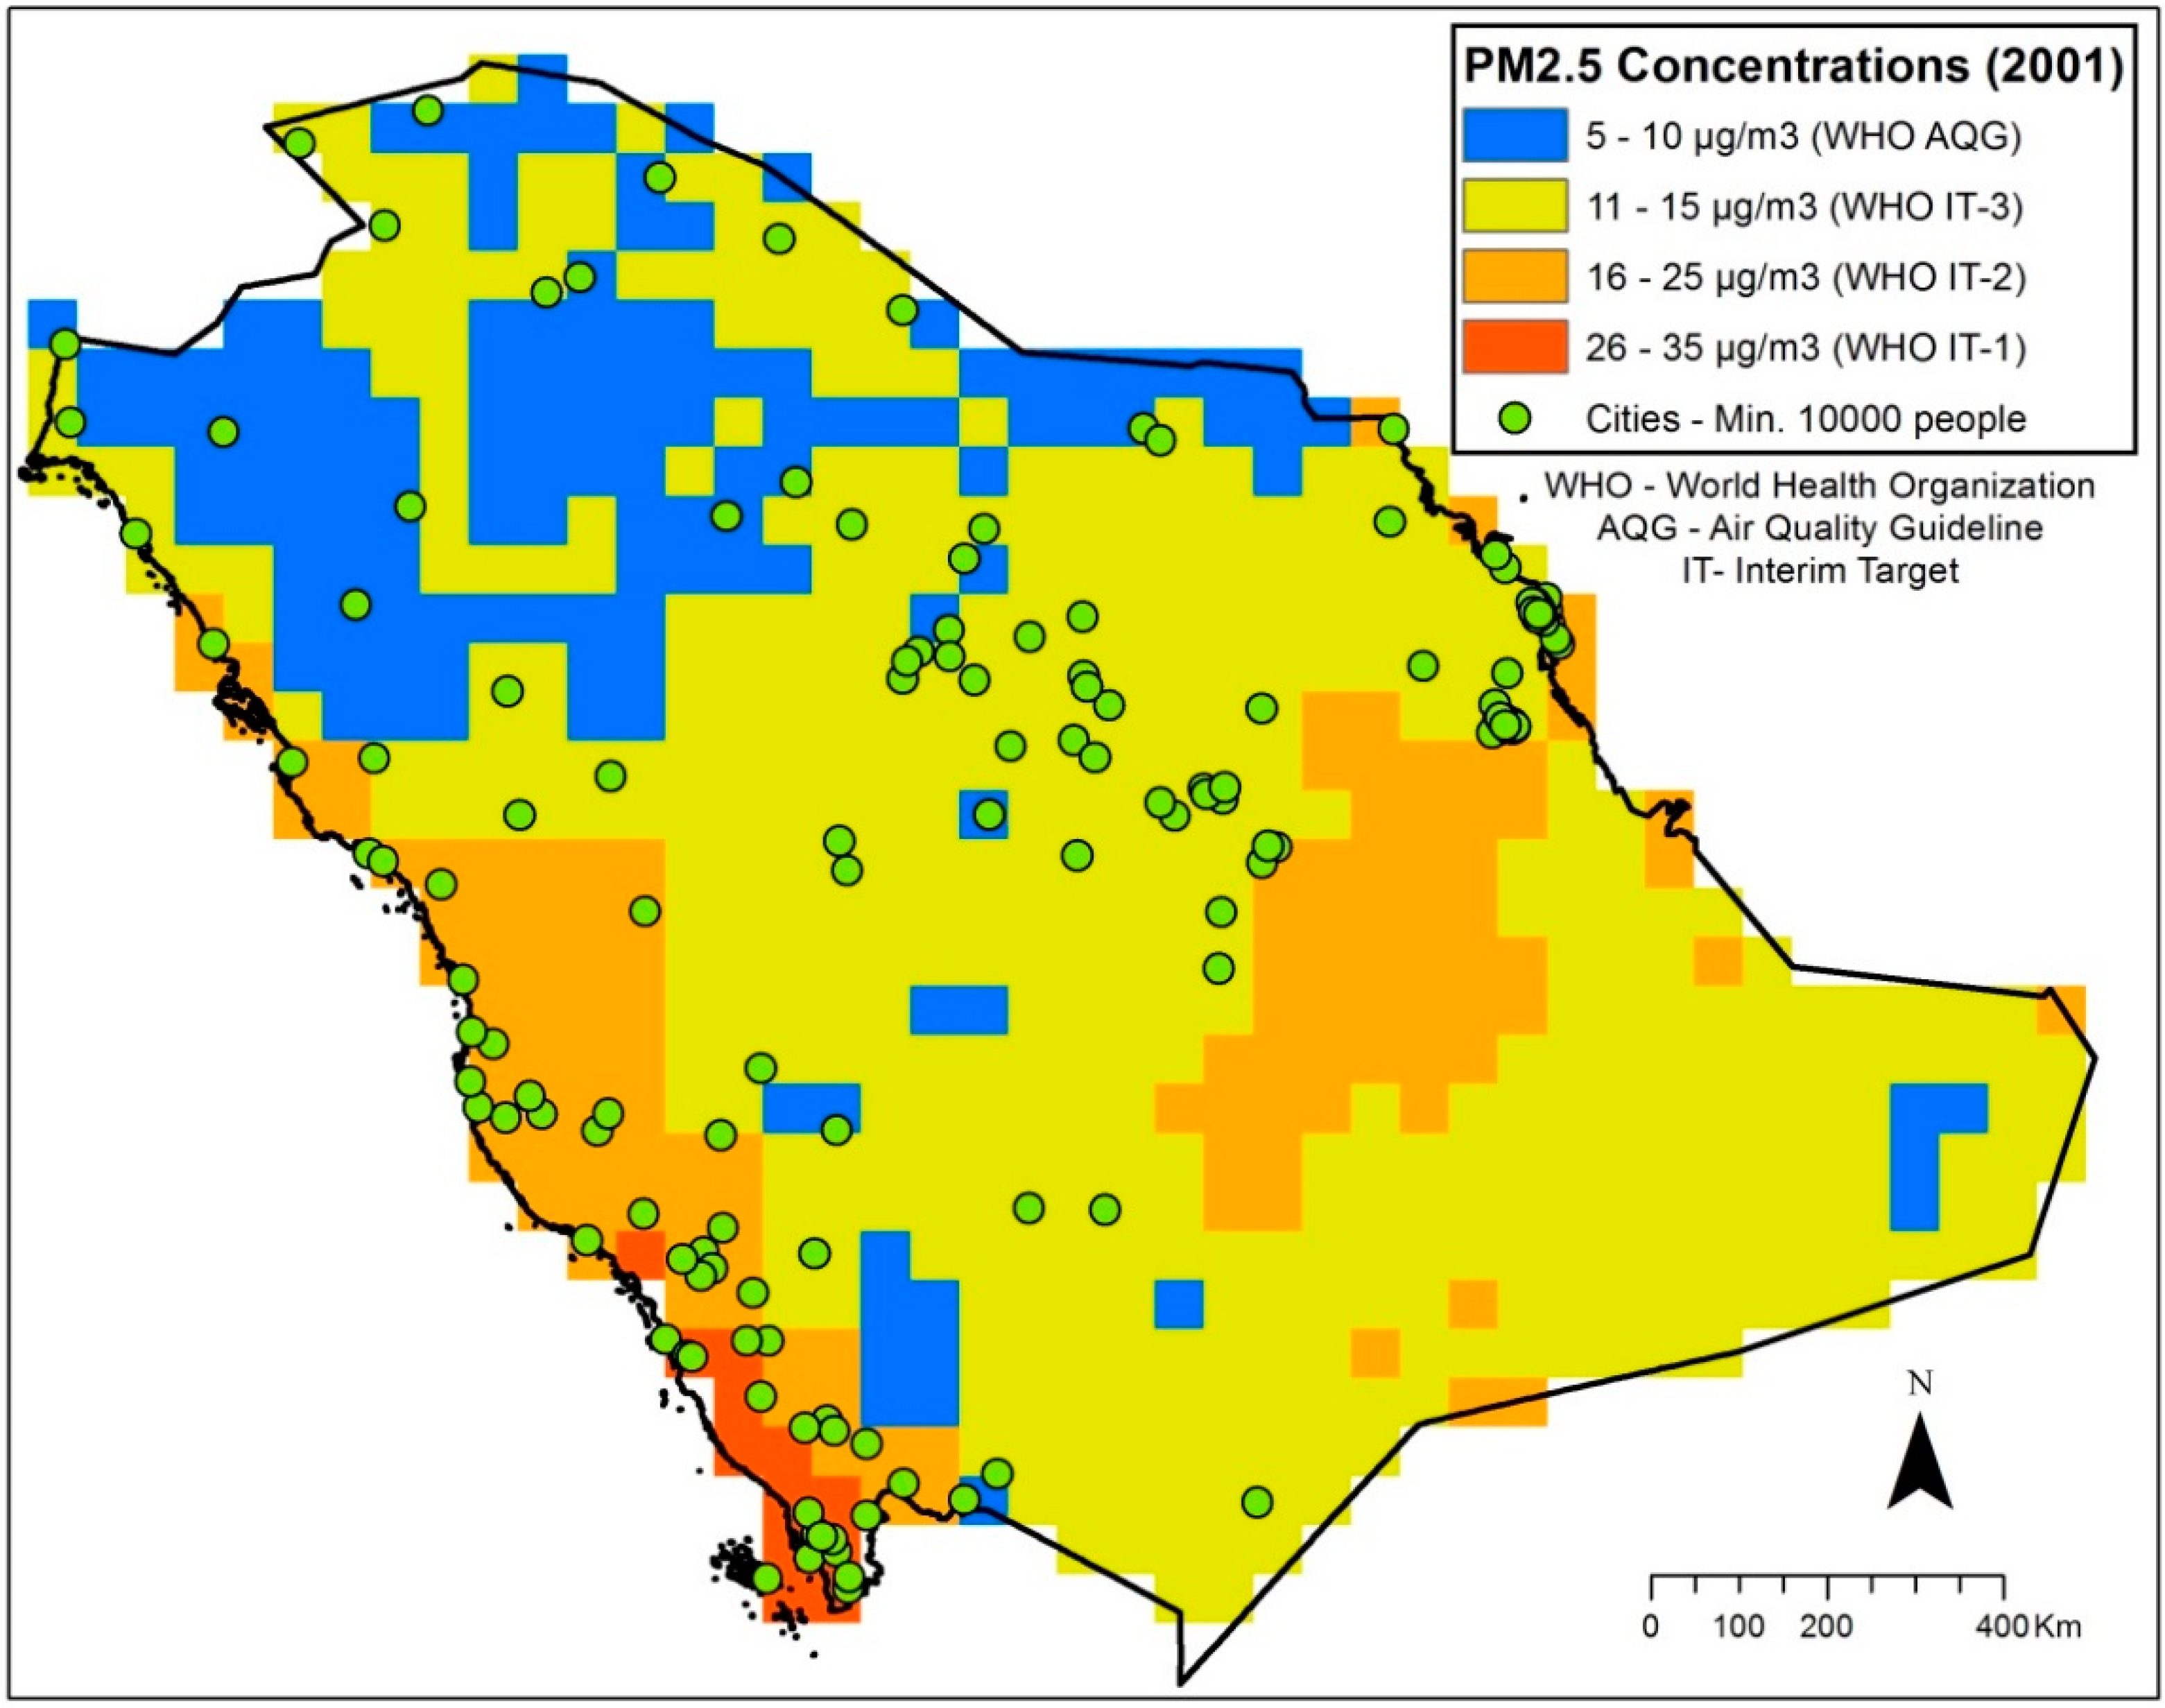
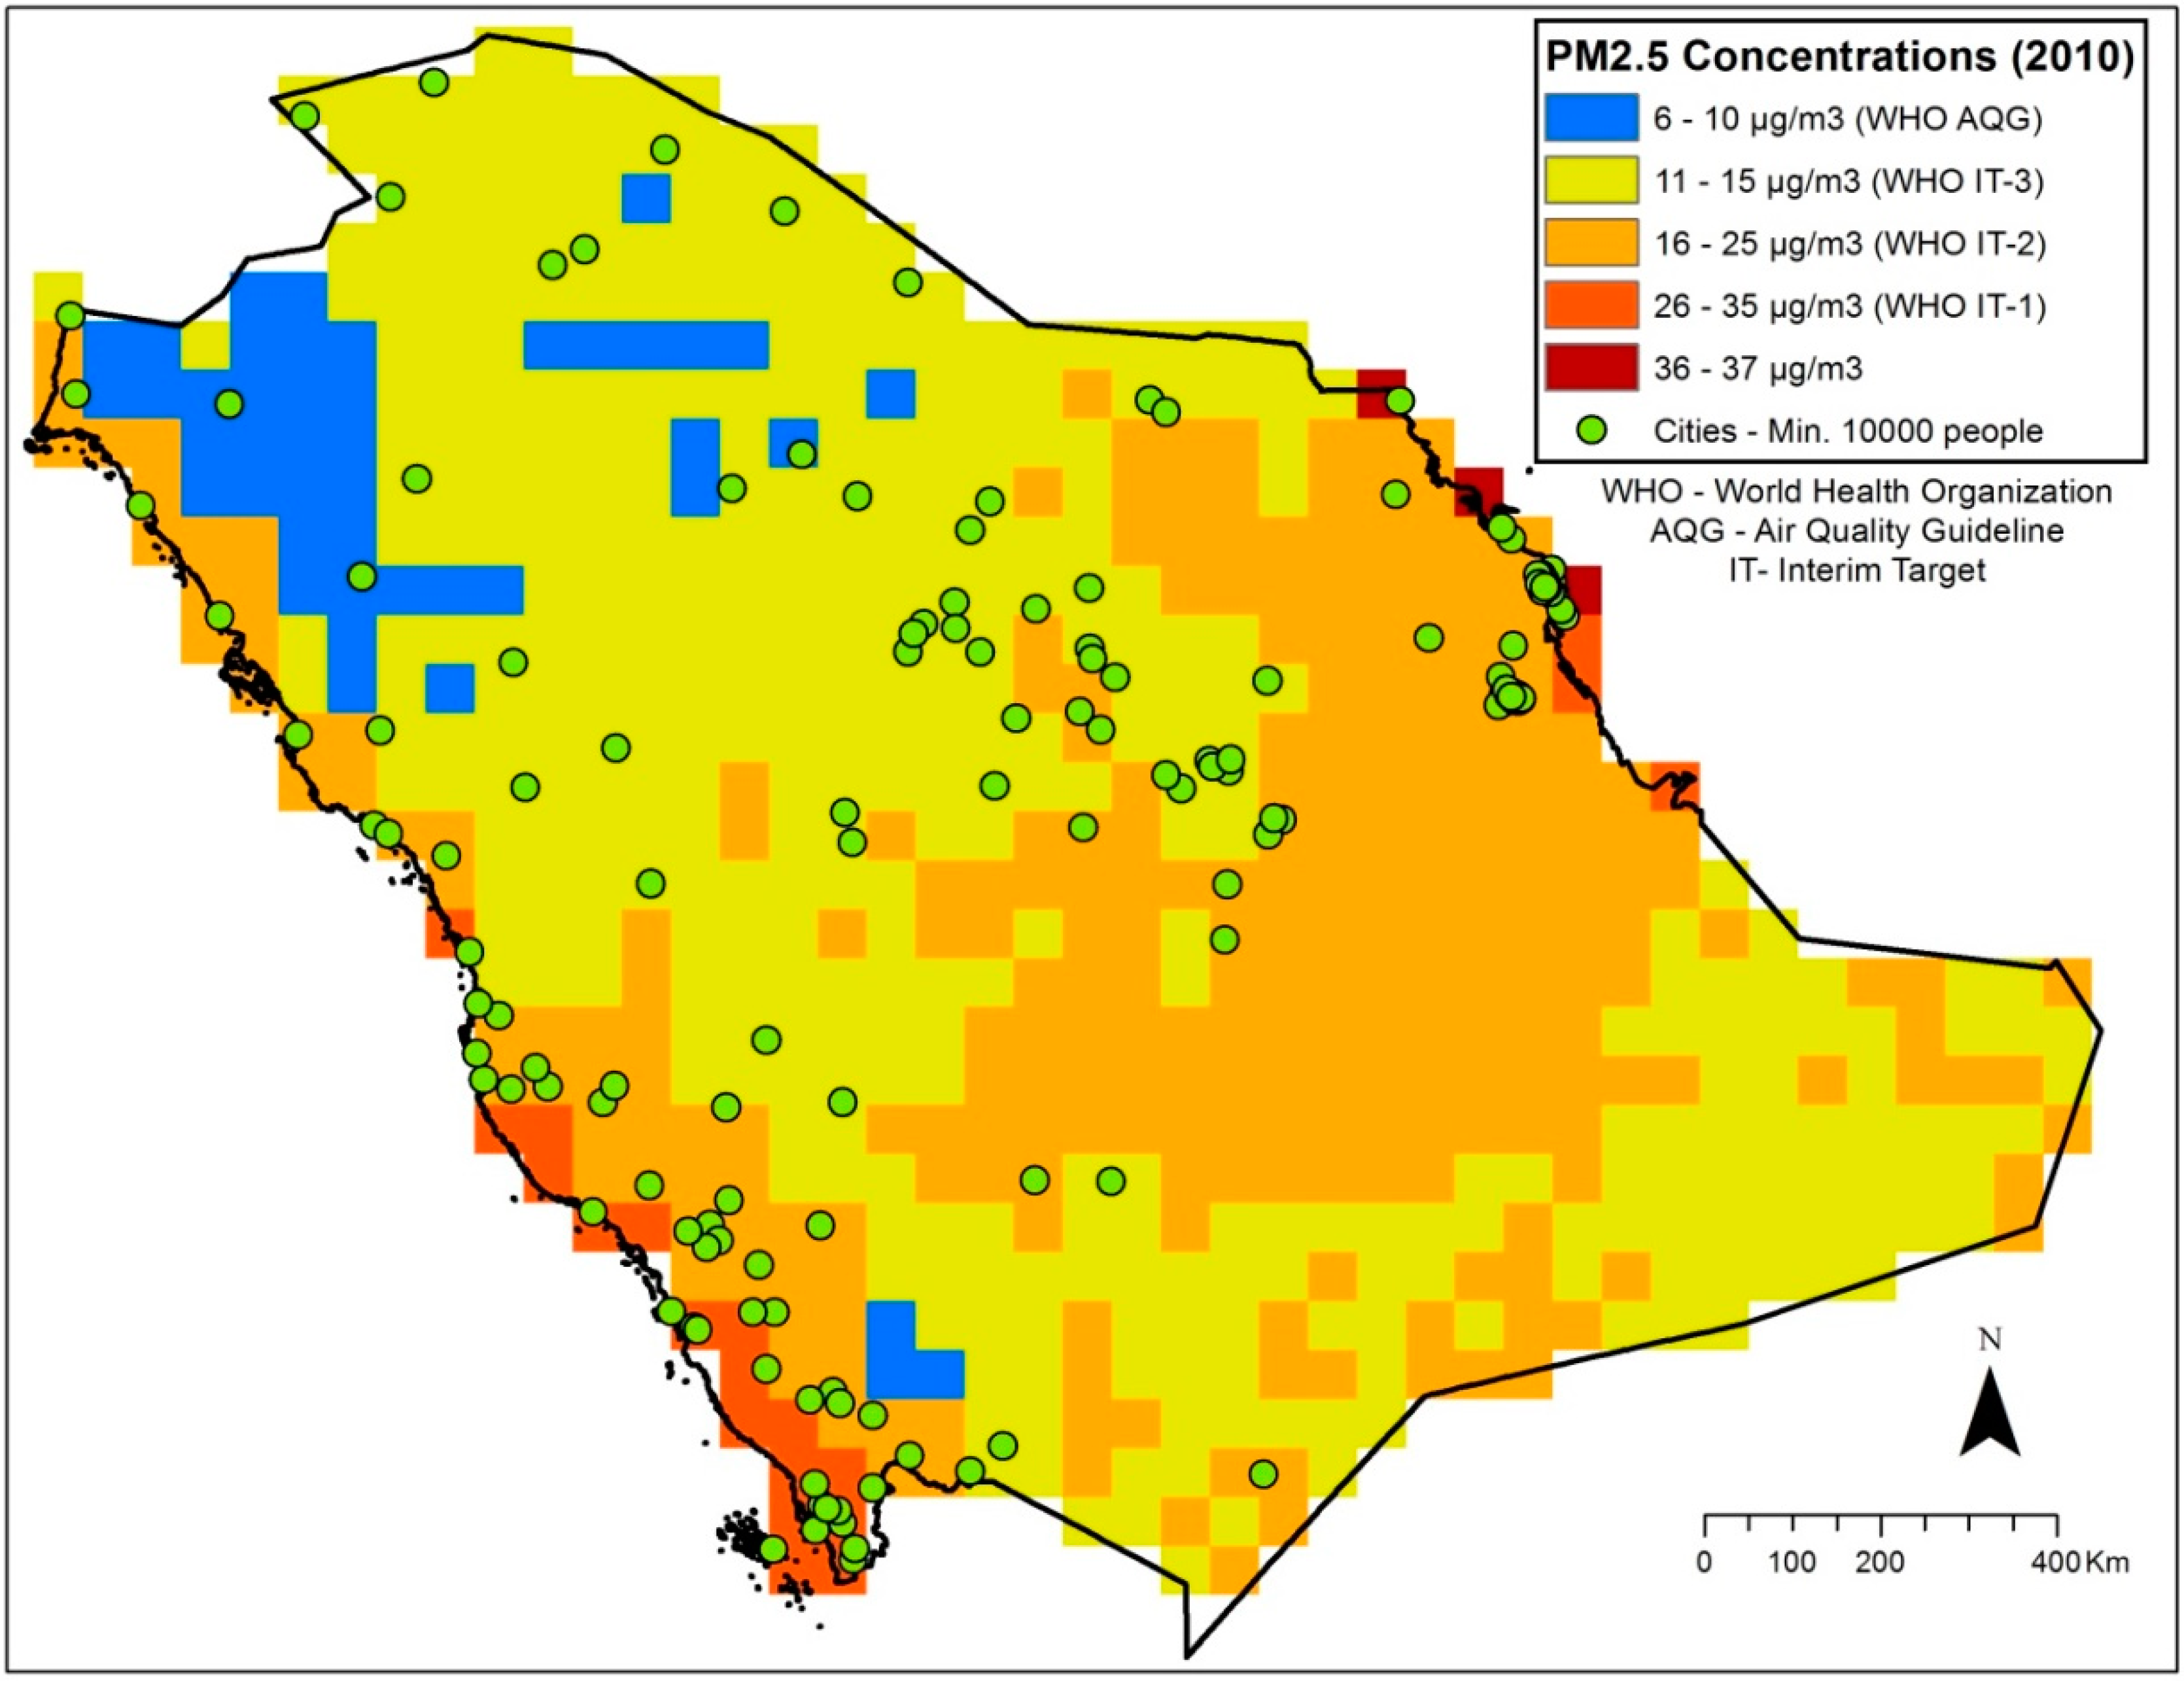
2.2. Population and PM2.5 Data
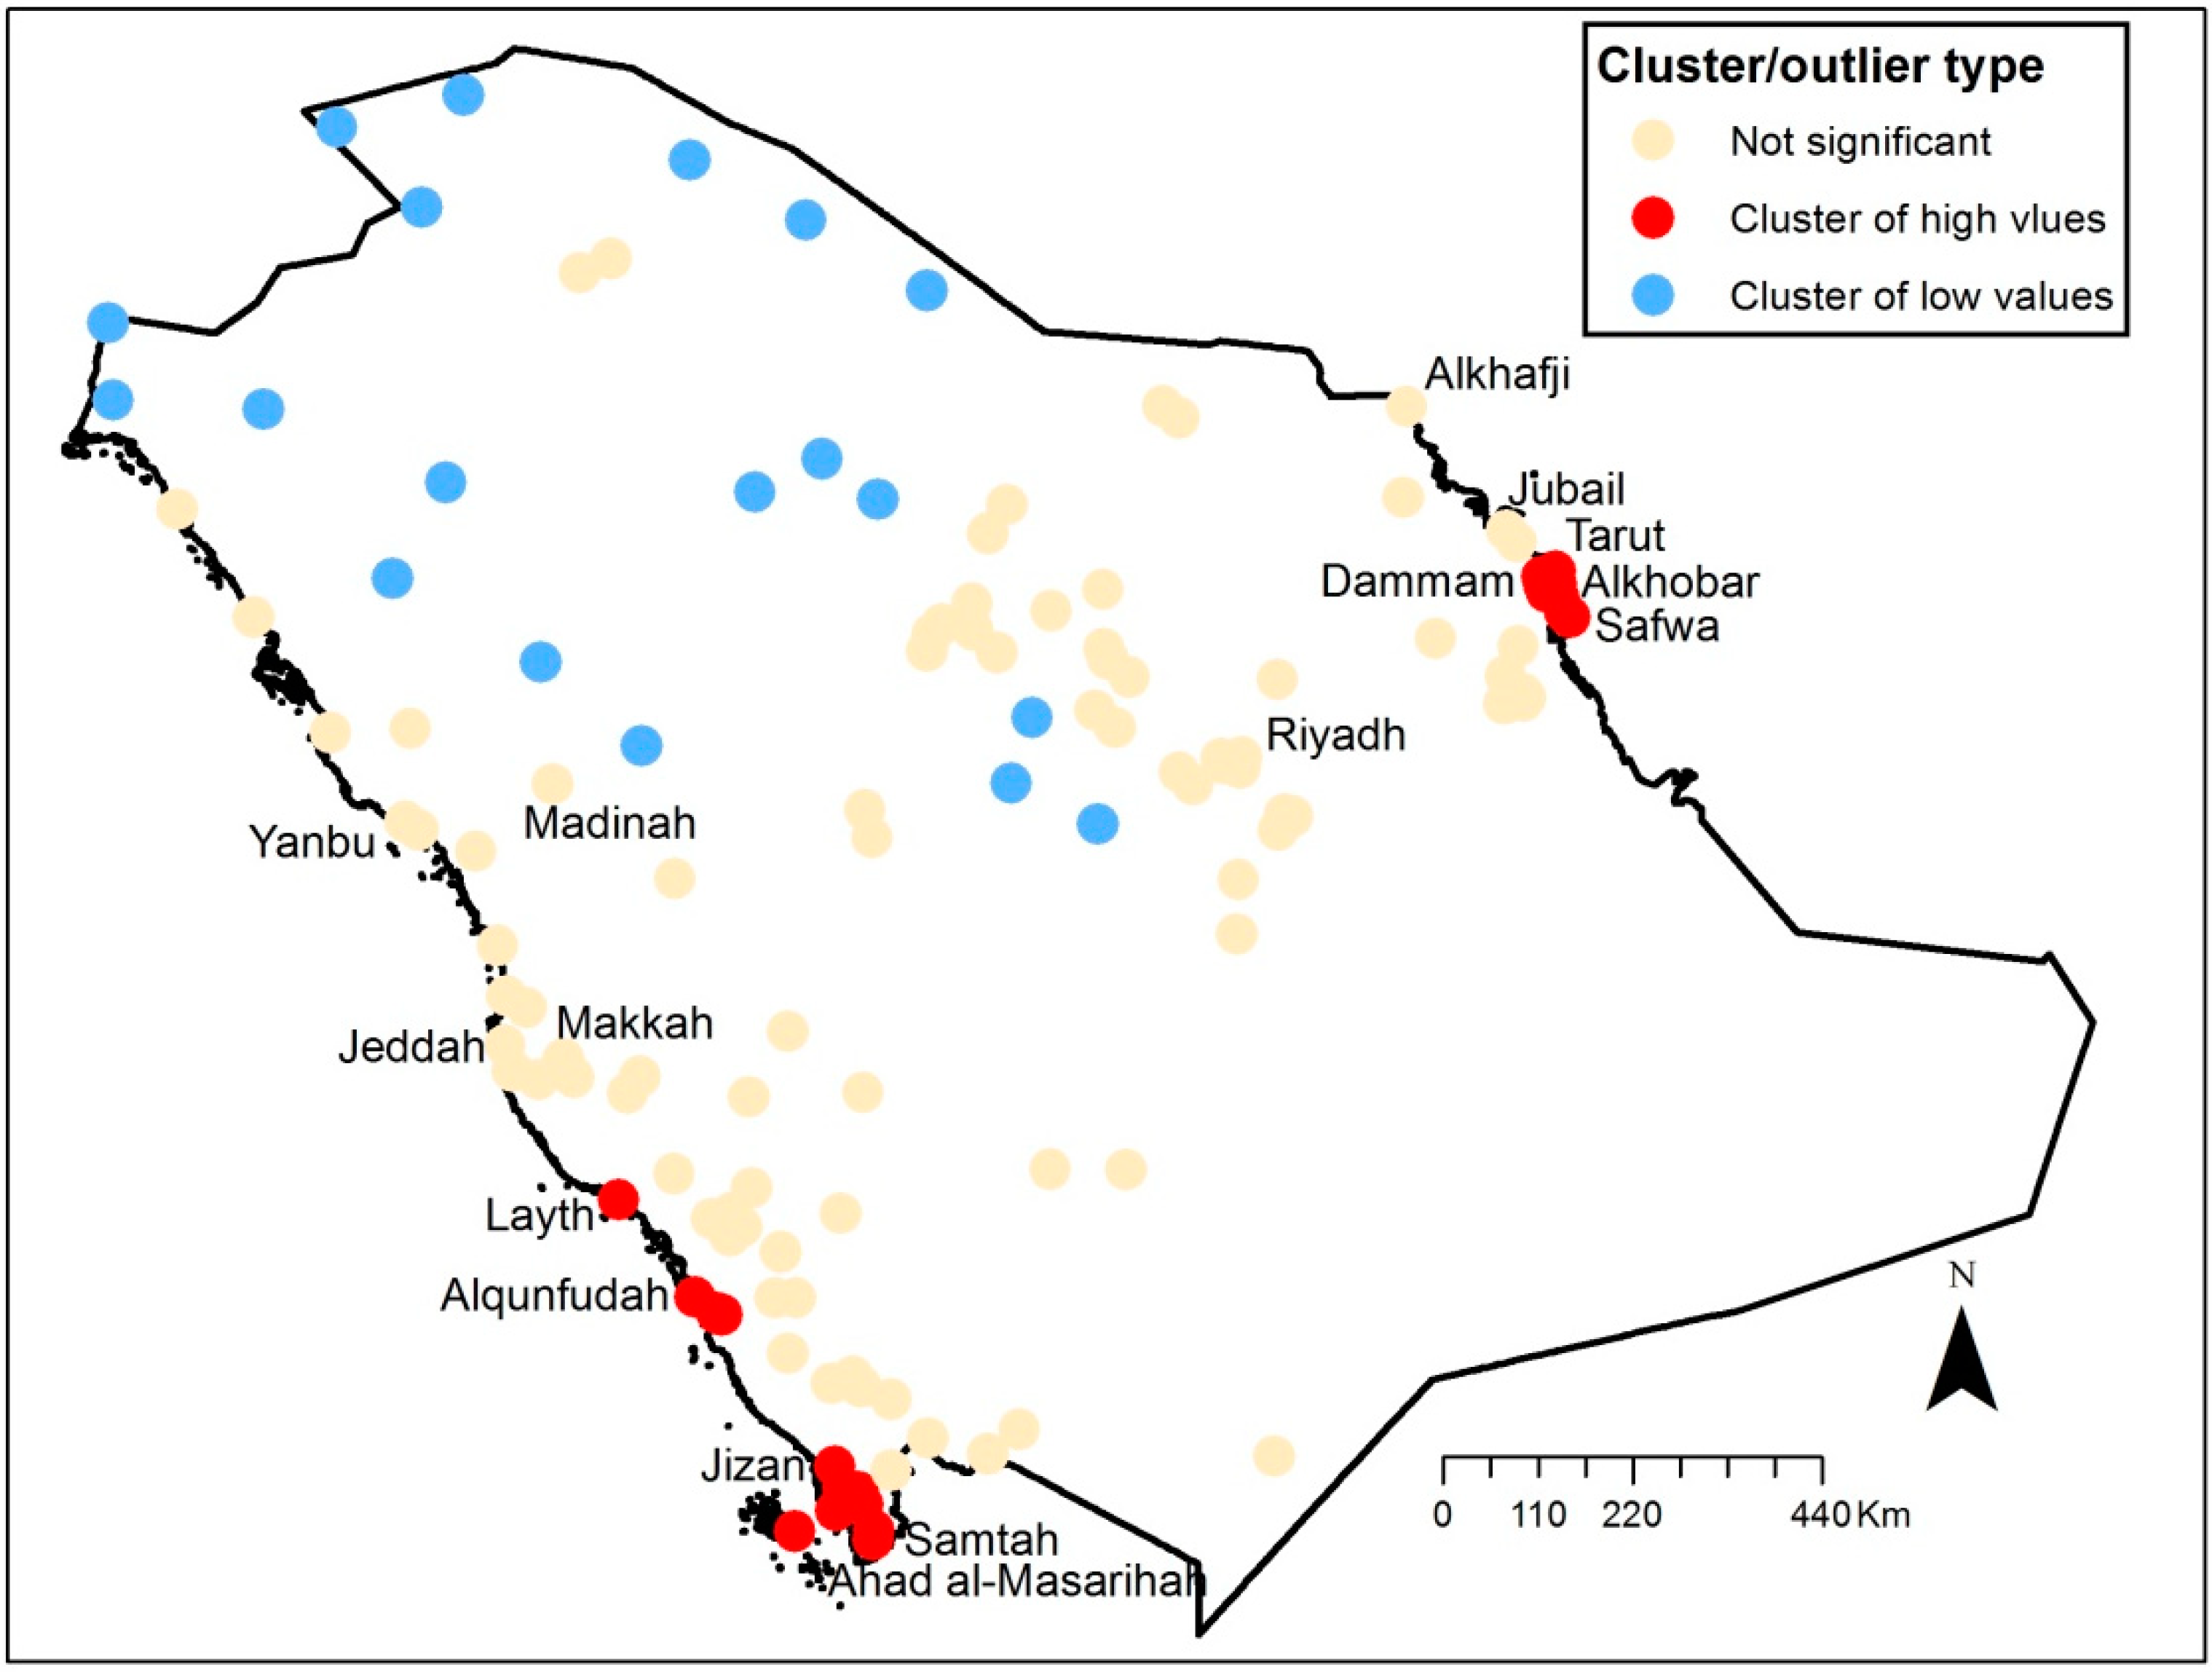
2.3. Methodology
3. Results


| Year: 2004 Total Population: 17,853,490 (79% of National Population) | Year: 2010 Total Population: 21,679,808 (80% of National Population) | ||||||
|---|---|---|---|---|---|---|---|
| WHO Guideline and Targets (in µg/m3) | Number of Cities (Min. 10,000 people) | Population | % | WHO Guideline and Targets (in µg/m3) | Number of Cities (Min. 10,000 people) | Population | % |
| 10 | 134 | 16,649,253 | 93 | 10 | 136 | 20,608,138 | 95 |
| 15 | 83 | 9,425,558 | 53 | 15 | 96 | 11,887,128 | 58 |
| 25 | 28 | 1,855,206 | 10 | 25 | 32 | 2,591,454 | 12 |
| 35 | 0 | 0 | 0 | 35 | 16 | 1,814,180 | 8 |
| Cities | Population 2010 | 2002 | 2003 | 2004 | 2005 | 2006 | 2007 | 2008 | 2009 (Increase) |
|---|---|---|---|---|---|---|---|---|---|
| Riyadh | 5,188,286 | 12.4 | 13 | 13.3 | 13.8 | 14.8 | 13.9 | 15.2 | 15 (2.6) |
| Jeddah | 3,430,697 | 17.6 | 17.2 | 21.1 | 20.3 | 20.6 | 17.4 | 18.8 | 19.4 (1.8) |
| Makkah | 1,534,731 | 16.5 | 16.2 | 20.2 | 19.1 | 19.6 | 16.1 | 17.6 | 18.2 (1.7) |
| Madinah | 1,100,093 | 12.8 | 12.4 | 11.6 | 11.7 | 11.4 | 11.1 | 10.1 | 10.8 (−2) |
| Dammam | 903,312 | 27.8 | 29.6 | 33.4 | 30.3 | 32.5 | 36 | 40.4 | 40 (12.6) |
| Jubail * | 142,825 | 12.8 | 13.6 | 14.6 | 15.1 | 15 | 15.2 | 15.9 | 16.4 (3.6) |
| Yanbu * | 73,000 | 18.9 | 18.7 | 19.3 | 19.1 | 19.7 | 21.1 | 21.3 | 22.3 (2.4) |
| Average concentrations (142 cities) | 152,675 | 17.5 | 17.3 | 17.9 | 17.5 | 18.2 | 19.1 | 19.9 | 20 (2.5) |


4. Discussion
5. Conclusions
Acknowledgments
Author Contributions
Conflicts of Interest
References
- Battelle Memorial Institute & Center for International Earth Science Information Network-CIESIN-Columbia University. Global Annual Average PM2.5 Grids from MODIS and MISR Aerosol Optical Depth (AOD); NASA Socioeconomic Data and Applications Center (SEDAC): Palisades, NY, USA, 2013. Available online: http://sedac.ciesin.columbia.edu/data/set/sdei-global-annual-avg-pm2-5-2001-2010 (accessed on 15 October 2013).
- Zell, E.; Weber, S. Country Estimates of PM2.5 Exposure; Battelle Memorial Institute: Arlington, VA, USA, 2012. [Google Scholar]
- Emerson, J.W.; Hsu, A.; Levy, M.A.; de Sherbinin, A.; Mara, V.; Esty, D.C.; Jaiteh, M. 2012 Environmental Performance Index and Pilot Trend Environmental Performance Index; Yale Center for Environmental Law and Policy: New Haven, CT, USA, 2012. [Google Scholar]
- Wong, T.W.; Lau, T.S.; Yu, T.S.; Neller, A.; Wong, S.L.; Tam, W.; Pang, S.W. Air pollution and hospital admissions for respiratory and cardiovascular diseases in Hong Kong. Occup. Environ. Med. 1999, 56, 679–683. [Google Scholar] [CrossRef]
- Hu, Z. Spatial analysis of MODIS aerosol optical depth, PM2.5, and chronic coronary heart disease. Int. J. Health Geogr. 2009, 8. [Google Scholar] [CrossRef]
- Son, J.Y.; Bell, M.L. The relationships between short-term exposure to particulate matter and mortality in Korea: Impact of particulate matter exposure metrics for sub-daily exposures. Environ. Res. Lett. 2013, 8. [Google Scholar] [CrossRef]
- Chiu, H.H.; Whittaker, P. Venous thromboembolism in an industrial North American city: Temporal distribution and association with particulate matter air pollution. PLoS One 2013, 8. [Google Scholar] [CrossRef] [PubMed]
- Franck, U.; Odeh, S.; Wiedensohler, A.; Wehner, B.; Herbarth, O. The effect of particle size on cardiovascular disorders—The smaller the worse. Sci. Total Environ. 2011, 409, 4217–4221. [Google Scholar] [CrossRef] [PubMed]
- Franck, U.; Leitte, A.M.; Suppan, P. Multiple exposures to airborne pollutants and hospital admissions due to diseases of the circulatory system in Santiago de Chile. Sci. Total Environ. 2014, 468, 746–756. [Google Scholar] [CrossRef] [PubMed]
- Zhou, S.; Yuan, Q.; Li, W.; Lu, Y.; Zhang, Y.; Wang, W. Trace metals in atmospheric fine particles in one industrial urban city: Spatial variations, sources, and health implications. J. Environ. Sci. 2014, 26, 205–213. [Google Scholar] [CrossRef]
- Vinikoor-Imler, L.C.; Davis, J.A.; Luben, T.J. An ecologic analysis of county-level PM2.5 concentrations and lung cancer incidence and mortality. Int. J. Environ. Res. Public Health 2011, 8, 1865–1871. [Google Scholar] [CrossRef] [PubMed]
- Hoek, G.; Raaschou-Nielsen, O. Impact of fine particles in ambient air on lung cancer. Chin. J. Cancer 2014, 33, 197–203. [Google Scholar] [PubMed]
- Loomis, D.; Grosse, Y.; Lauby-Secretan, B.; El Ghissassi, F.; Bouvard, V.; Benbrahim-Tallaa, L.; Guha, N.; Baan, R.; Mattock, H.; Straif, K. The carcinogenicity of outdoor air pollution. Lancet Oncol. 2013, 14, 1262–1263. [Google Scholar] [CrossRef] [PubMed]
- Hoff, R.M.; Christopher, S.A. Remote sensing of particulate pollution from space: Have we reached the promised land? J. Air Waste Manag. Assoc. 2009, 59, 645–675. [Google Scholar] [CrossRef]
- Li, C.; Mao, J.; Lau, K.H.A.; Chen, J.C.; Yuan, Z.; Liu, X.; Zhu, A.; Liu, G. Characteristics of distribution and seasonal variation of aerosol optical depth in eastern China with MODIS products. Chin. Sci. Bull. 2003, 48, 2488–2495. [Google Scholar]
- Gupta, P.; Christopher, S.A. Seven year particulate matter air quality assessment from surface and satellite measurements. Atmos. Chem. Phys. 2008, 8, 3311–3324. [Google Scholar] [CrossRef]
- Kumar, N.; Chu, A.; Foster, A. Remote sensing of ambient particles in Delhi and its environs: Estimation and validation. Int. J. Remote Sens. 2008, 29, 3383–3405. [Google Scholar] [CrossRef]
- Schaap, M.; Apituley, A.; Timmermans, R.M.A.; Koelemeijer, R.B.A.; Leeuw, G.D. Exploring the relation between aerosol optical depth and PM2.5 at Cabauw, the Netherlands. Atmos. Chem. Phys. 2009, 9, 909–925. [Google Scholar] [CrossRef]
- Natunen, A.; Arola, A.; Mielonen, T.; Huttunen, J.; Komppula, M.; Lehtinen, K.E. A multi-year comparison of PM2.5 and AOD for the Helsinki region. Boreal Environ. Res. 2010, 15, 544–552. [Google Scholar]
- Tian, J.; Chen, D. A semi-empirical model for predicting hourly ground-level fine particulate matter (PM2.5) concentration in southern Ontario from satellite remote sensing and ground-based meteorological measurements. Remote Sens. Environ. 2010, 114, 221–229. [Google Scholar] [CrossRef]
- Lee, H.J.; Liu, Y.; Coull, B.A.; Schwartz, J.; Koutrakis, P. A novel calibration approach of MODIS AOD data to predict PM2.5 concentrations. Atmos. Chem. Phys. 2011, 11, 7991–8002. [Google Scholar] [CrossRef]
- Chen, D.; Tian, J. Monitoring spatial and temporal variability of air quality using satellite observation data: A case study of MODIS-observed aerosols in Southern Ontario, Canada. In Air Quality; Kumar, A., Ed.; InTech: Rijeka, Croatia, 2010; pp. 65–80. [Google Scholar]
- Gupta, P.; Christopher, S.A.; Wang, J.; Gehrig, R.; Lee, Y.C.; Kumar, N. Satellite remote sensing of particulate matter and air quality assessment over global cities. Atmos. Environ. 2006, 40, 5880–5892. [Google Scholar] [CrossRef]
- Van Donkelaar, A.; Martin, R.V.; Brauer, M.; Kahn, R.; Levy, R.; Verduzco, C.; Villeneuve, P.J. Global estimates of ambient fine particulate matter concentrations from satellite-based aerosol optical depth: Development and application. Environ. Health Perspect. 2010, 118, 847–855. [Google Scholar] [CrossRef] [PubMed]
- Rushdi, A.I.; Al-Mutlaq, K.F.; Al-Otaibi, M.; El-Mubarak, A.H.; Simoneit, B.R. Air quality and elemental enrichment factors of aerosol particulate matter in Riyadh city, Saudi Arabia. Arabian J. Geosci. 2013, 6, 585–599. [Google Scholar] [CrossRef]
- Aburas, H.M.; Zytoon, M.A.; Abdulsalam, M.I. Atmospheric lead in PM2.5 after leaded gasoline phase-out in Jeddah city, Saudi Arabia. Clean-Soil Air Water 2011, 39, 711–719. [Google Scholar] [CrossRef]
- Khodeir, M.; Shamy, M.; Alghamdi, M.; Zhong, M.; Sun, H.; Costa, M.; Chen, L.; Maciejczyk, P. Source apportionment and elemental composition of PM2.5 and PM10 in Jeddah City, Saudi Arabia. Atmos. Poll. Res. 2012, 3, 331–340. [Google Scholar]
- Shaltout, A.A.; Boman, J.; Dhaif-allah, R.; Shehadeh, Z.F. Elemental composition of PM2.5 particles sampled in industrial and residential areas of Taif, Saudi Arabia. Aerosol Air Qual. Res. 2013, 13, 1356–1364. [Google Scholar]
- Munir, S.; Habeebullah, T.M.; Seroji, A.R.; Gabr, S.S.; Mohammed, A.M.; Morsy, E.A. Quantifying temporal trends of atmospheric pollutants in Makkah (1997–2012). Atmos. Environ. 2013, 77, 647–655. [Google Scholar] [CrossRef]
- Al-Jeelani, H.A. Evaluation of air quality in the Holy Makkah during Hajj season 1425 H. J. Appl. Sci. Res. 2009, 5, 115–121. [Google Scholar]
- Othman, N.; Jafri, M.Z.M.; San, L.H. Estimating particulate matter concentration over arid region using satellite remote sensing: A case study in Makkah, Saudi Arabia. Mod. Appl. Sci. 2010, 4, 131–142. [Google Scholar] [CrossRef]
- Habeebullah, T.M. An analysis of air pollution in Makkah—A view point of source identification. Environ. Asia 2013, 6, 11–17. [Google Scholar]
- Alam, K.; Trautmann, T.; Blaschke, T.; Subhan, F. Changes in aerosol optical properties due to dust storms in the Middle East and Southwest Asia. Remote Sens. Environ. 2014, 143, 216–227. [Google Scholar] [CrossRef]
- Aina, Y.A. Urban sustainability perspectives on changes in adaptation to Saudi Arabian desert environment: The role of geospatial technologies. In Environment, People and Development: Experiences from Desert Ecosystems; Gaur, M.K., Moharana, P.C., Eds.; NIPA: New Delhi, India, 2014; pp. 110–121. [Google Scholar]
- De Sherbinin, A.; Levy, M.A.; Zell, E.; Weber, S.; Jaiteh, M. Using satellite data to develop environmental indicators. Environ. Res. Lett. 2014, 9. [Google Scholar] [CrossRef]
- Central Department of Statistics and Information. Available online: http://www.cdsi.gov.sa/english/ (accessed on 15 October 2013).
- Saudi Geological Survey (SGS). An Amateur Guide to the Land Trips in Saudi Arabia (in Arabic), 1st ed.; Saudi Geological Survey: Riyadh, Saudi Arabia, 2003. [Google Scholar]
- Anselin, L. Local indicators of spatial association—LISA. Geogr. Anal. 1995, 27, 93–115. [Google Scholar] [CrossRef]
- ESRI. ArcGIS Help 10.1, 2013. Available online: http://resources.arcgis.com/en/help/main/10.1/ (accessed on 5 July 2014).
- World Health Organization (WHO). Air Quality Guidelines—Global Update 2005; WHO-Europe: Copenhagen, Denmark, 2006. [Google Scholar]
- Al-Ahmadi, K.; Al-Zahrani, A. NO2 and cancer incidence in Saudi Arabia. Int. J. Environ. Res. Public Health 2013, 10, 5844–5862. [Google Scholar] [CrossRef] [PubMed]
- Alshuwaikhat, H.M.; Aina, Y.A. GIS-based urban sustainability assessment: The case of Dammam city, Saudi Arabia. Local Environ. 2006, 11, 141–161. [Google Scholar] [CrossRef]
- Shi, Y.; Zhang, J.; Reid, J.S.; Hyer, E.J.; Eck, T.F.; Holben, B.N.; Kahn, R.A. A critical examination of spatial biases between MODIS and MISR aerosol products—Application for potential AERONET deployment. Atmos. Measur. Tech. 2011, 4, 2823–2836. [Google Scholar] [CrossRef]
- Al-Ahmadi, K.; Al-Zahrani, A. Spatial autocorrelation of cancer incidence in Saudi Arabia. Int. J. Environ. Res. Public Health 2013, 10, 7207–7228. [Google Scholar] [CrossRef] [PubMed]
- Weng, W.; Xu, B.; Hu, X.; Liu, H. Use of earth observation data for applications in public health. Geocarto Int. 2014, 29, 3–16. [Google Scholar] [CrossRef]
- Wong, M.S.; Nichol, J.E.; Lee, K.H.; Li, Z. Retrieval of aerosol optical thickness using MODIS 500 × 500 m2, a study in Hong Kong and Pearl River Delta region. IEEE Trans. Geosci. Remote Sens. 2010, 46, 3318–3327. [Google Scholar] [CrossRef]
© 2014 by the authors; licensee MDPI, Basel, Switzerland. This article is an open access article distributed under the terms and conditions of the Creative Commons Attribution license (http://creativecommons.org/licenses/by/4.0/).
Share and Cite
Aina, Y.A.; Van der Merwe, J.H.; Alshuwaikhat, H.M. Spatial and Temporal Variations of Satellite-Derived Multi-Year Particulate Data of Saudi Arabia: An Exploratory Analysis. Int. J. Environ. Res. Public Health 2014, 11, 11152-11166. https://doi.org/10.3390/ijerph111111152
Aina YA, Van der Merwe JH, Alshuwaikhat HM. Spatial and Temporal Variations of Satellite-Derived Multi-Year Particulate Data of Saudi Arabia: An Exploratory Analysis. International Journal of Environmental Research and Public Health. 2014; 11(11):11152-11166. https://doi.org/10.3390/ijerph111111152
Chicago/Turabian StyleAina, Yusuf A., Johannes H. Van der Merwe, and Habib M. Alshuwaikhat. 2014. "Spatial and Temporal Variations of Satellite-Derived Multi-Year Particulate Data of Saudi Arabia: An Exploratory Analysis" International Journal of Environmental Research and Public Health 11, no. 11: 11152-11166. https://doi.org/10.3390/ijerph111111152
APA StyleAina, Y. A., Van der Merwe, J. H., & Alshuwaikhat, H. M. (2014). Spatial and Temporal Variations of Satellite-Derived Multi-Year Particulate Data of Saudi Arabia: An Exploratory Analysis. International Journal of Environmental Research and Public Health, 11(11), 11152-11166. https://doi.org/10.3390/ijerph111111152