Geographical Scale Effects on the Analysis of Leptospirosis Determinants

Abstract
:1. Introduction
2. Materials and Methods
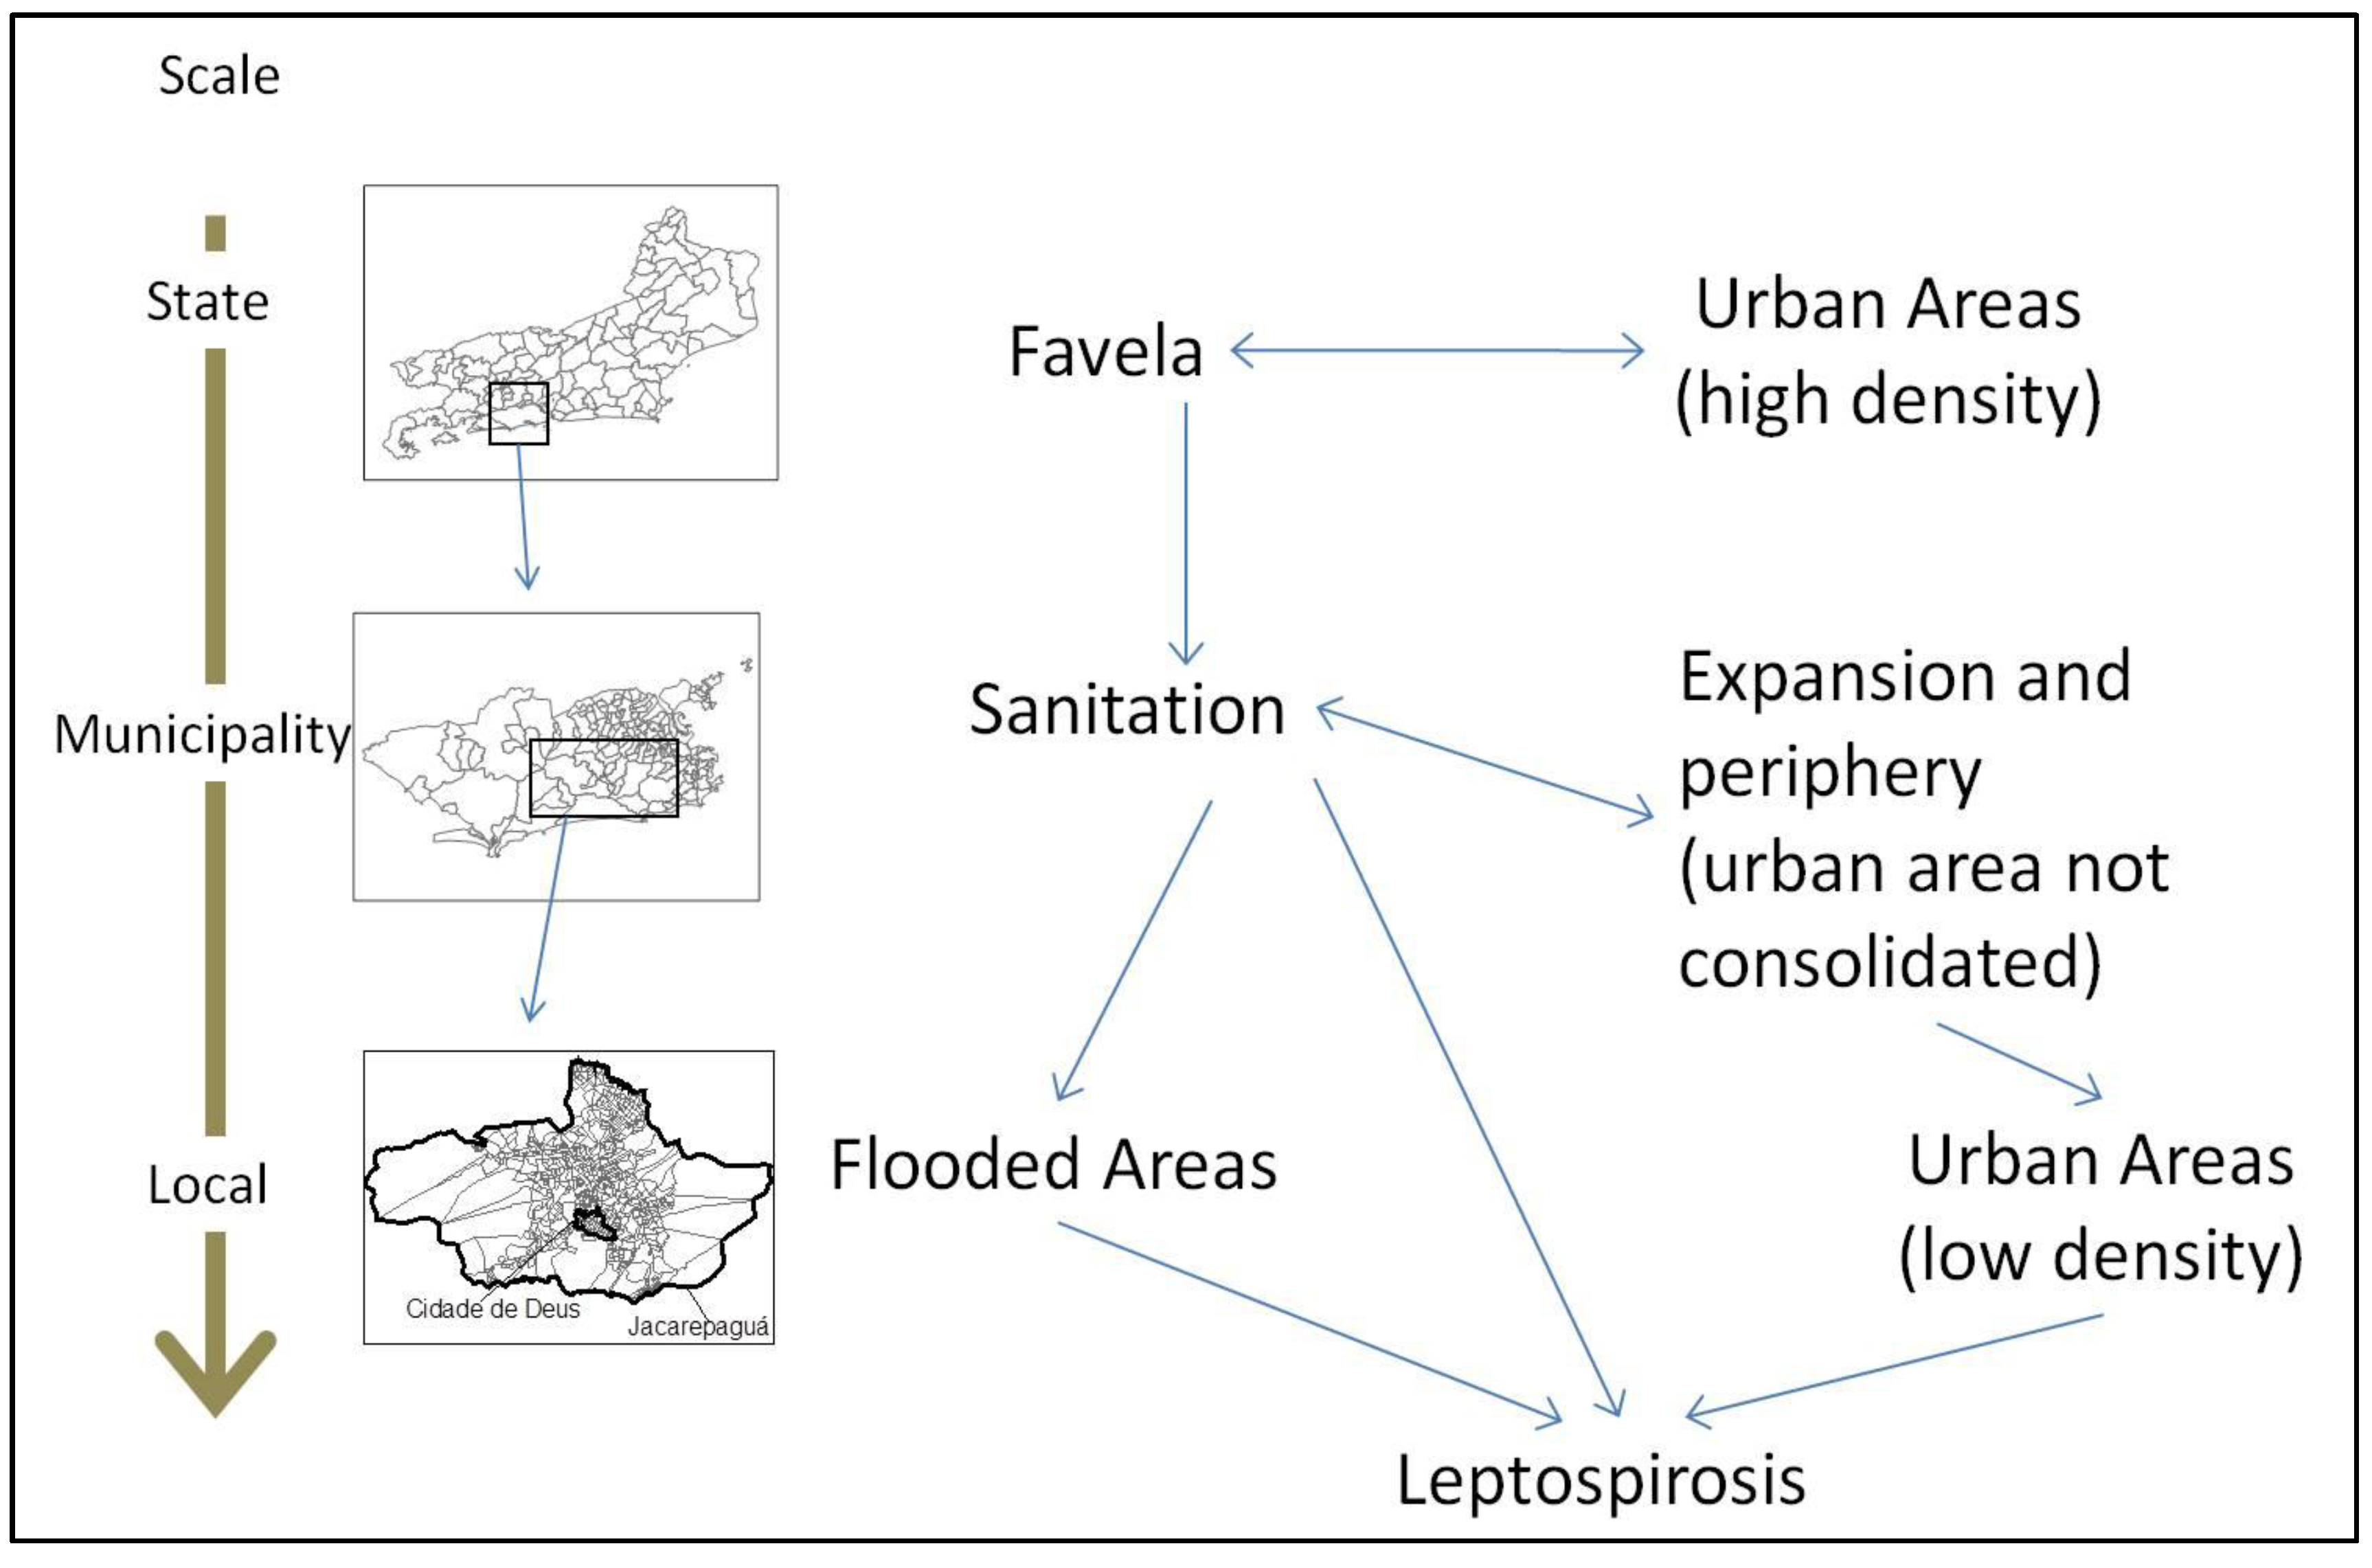
2.1. Geographical Scales and Units of Data Aggregation
2.2. Leptospirosis Incidence Data
2.3. Environmental and Socioeconomic Data
2.4. Geoprocessing Techniques
2.5. Statistical Analysis

| Indicators | Geographical Scale (Unit of Aggregation) | |||
|---|---|---|---|---|
| a. State (municipalities within the Rio de Janeiro state; n = 92) | b.b. Municipal (Neighborhoods in the Rio de Janeiro city; n = 158) | c. Local (Census Sectors of Jacarepaguá and Cidade de Deus; n = 652) | ||
| 1 | Incidence rate of leptospirosis (SINAN and Census IBGE) | Incidence rate of leptospirosis (SINAN and Census IBGE) | Incidence rate of leptospirosis (SINAN and Census IBGE) | |
| 2 | Altitude classification (FCIDE) | Proportion of areas prone to flooding (IPP) | Proportion of areas prone to flooding (IPP) | |
| 3 | Proportion of households connected to water systems (Census IBGE) | Proportion of households connected to water systems (Census IBGE) | Proportion of households connected to water systems (Census IBGE) | |
| 4 | Proportion of households connected to sewage systems (Census IBGE) | Proportion of households connected to sewage systems (Census IBGE) | Proportion of households connected to sewage systems (Census IBGE) | |
| 5 | Proportion of households with at least one bathroom (Census IBGE) | Proportion of households with at least one bathroom (Census IBGE) | Proportion of households with at least one bathroom (Census IBGE) | |
| 6 | Proportion of households with systematic garbage collection (Census IBGE) | Proportion of households with systematic garbage collection (Census IBGE) | Proportion of households with systematic garbage collection (Census IBGE) | |
| 7 | Proportion of population living in slum areas (Census IBGE) | Proportion of population living in slum areas (Census IBGE) | Proportion of population living in slum areas (Census IBGE) | |
| 8 | Proportion of residents with at least a high school degree (Census IBGE) | Proportion of residents with at least a high school degree (Census IBGE) | Proportion of residents with at least a high school degree (Census IBGE) | |
| 9 | Population density (Census IBGE and basemap) | Population density (Census IBGE and basemap) | Population density (Census IBGE and basemap) | |
| 10 | Proportion of land use (Iqm/CIDE): urban area, urban area not consolidated, cropland/pasture/grassland and forestland | Proportion of land use (IPP): urban area, urban area not consolidated, cropland/pasture/grassland and forestland | Proportion of land use (IPP): urban area, urban area not consolidated, cropland/pasture/grassland and forestland | |
| 11 | Interaction between indicators | Interaction between indicators | Interaction between indicators | |
| Indicative map |  | |||
2.6. Indicator Definitions:
- (1-a, b, c) (Number of Leptospirosis Cases (SINAN)/population (IBGE)) ×100,000 state level-unit of aggregation municipality; ×10,000 municipal level-unit of aggregation neighborhoods and ×1000 local level-unit of aggregation census sectors. Incidence rate calculations were different among three geographical scales due to large variation in the population at different units of aggregation.
- (2-a) Iqm Table with the altitude (m) of each municipality—2003 (FCIDE)
- (2-b) Intersection between neighborhood map and map of areas prone to flooding using SIG software ×100
- (2-c) Intersection between maps of census sectors of Jacarepaguá and Cidade de Deus RAs and map of areas prone to flooding using SIG software × 100
- (3-a, b, c) (Number of households connected to water systems/Total number of households) × 100
- (4-a, b, c) (Number of households connected to sewage systems/Total number of households) × 100
- (5-a, b, c) (Number of households with at least one bathroom/Total number of households) × 100
- (6-a, b, c) (Number of households with systematic garbage collection/Total number of households) × 100
- (7-a, b, c) (Total number of people living in slums/Total Population) × 100
- (8-a, b, c) (Number of residents with at least a high school degree/Total number of residents) × 100
- (9-) Population (IBGE Census of 2000)/Area (Km2) for municipalities, neighborhoods and census sectors.
- (10-a, b, c) From Landsat images of 2001, CIDE and IPP calculate Iqm for Rio de Janeiro state and Rio de Janeiro city respectively. An operation that intersects between aggregation units used in this work and the land use classifications was performed. Thus polygons with the classification of different land uses within each unit of aggregation was created. Subsequently the ratio of the area of different land uses was calculated: municipalities of the state of Rio de Janeiro; neighborhoods in the city of Rio de Janeiro and the census tracts of the administrative region of Jacarepaguá.
3. Results and Discussion
3.1. Leptospirosis Incidence Results

| State Level | Municipal Level | Local Level | ||||
|---|---|---|---|---|---|---|
| Indicators | Correlation Coefficient | p-value | Correlation Coefficient | p-value | Correlation Coefficient | p-value |
| Sanitation | ||||||
| Proportion of households supplied with water | 0.241 | 0.022 | −0.204 * | 0.010 | −0.001 | 0.975 |
| Proportion of households connected to sewage | 0.218 | 0.038 | −0.114 | 0.153 | −0.067 | 0.085 |
| Proportion of households with garbage collection | 0.287 * | 0.006 | −0.071 | 0.373 | −0.046 | 0.239 |
| Poverty | ||||||
| Proportion of population living in slums | 0.429 * | 0.000 | 0.082 | 0.303 | −0.180 * | 0.000 |
| Proportion of households with at least one bathroom | 0.146 | 0.169 | 0.017 | 0.833 | −0.029 | 0.467 |
| Proportion of householders with complete High School | 0.211 | 0.044 | −0.083 | 0.299 | −0.010 | 0.791 |
| Environment | ||||||
| Altitude/flooding area | −0.04 | 0.700 | 0.046 | 0.566 | 0.142 * | 0.000 |
| Population density | 0.350 * | 0.001 | −0.045 | 0.577 | −0.152 * | 0.000 |
| Proportion of urban use | 0.387 * | 0.000 | −0.254 * | 0.001 | 0.033 | 0.405 |
| Proportion of non-consolidated urban use | ----------- | --------- | 0.323 * | 0.000 | 0.002 | 0.966 |
| Proportion of field/pasture/anthropogenic use | −0.09 | 0.393 | 0.162 | 0.042 | --------- | -------- |
| Proportion of rural use | −0.16 | 0.133 | −0.002 | 0.978 | −0.044 | 0.264 |
| State level | Municipal level | Local level | ||||
|---|---|---|---|---|---|---|
| Indicators | Correlation Coefficient | p-value | Correlation Coefficient | p-value | Correlation Coefficient | p-value |
| Sanitation | ||||||
| Proportion of households supplied with water | 0.268 * | 0.01 | −0.156 | 0.050 | −0.017 | 0.671 |
| Proportion of households connected to sewage | 0.141 | 0.183 | −0.182 * | 0.022 | 0.008 | 0.832 |
| Proportion of households with garbage collection | 0.162 | 0.126 | −0.222 * | 0.005 | 0.003 | 0.932 |
| Proportion of population living in slums | 0.484 * | 0.000 | 0.234 * | 0.003 | −0.067 | 0.086 |
| Proportion of households with at least one bathroom | 0.256 * | 0.014 | 0.244 * | 0.002 | −0.028 | 0.476 |
| Proportion of householders with complete High School | 0.346 * | 0.001 | −0.278 * | 0.000 | −0.026 | 0.505 |
| Poverty | ||||||
| Environmental | ||||||
| Altitude/flooding area | −0.005 | 0.959 | 0.130 | 0.104 | 0.014 | 0.719 |
| Population density | 0.253 * | 0.015 | 0.111 | 0.164 | −0.095 * | 0.015 |
| Proportion of urban use | 0.309 * | 0.003 | −0.065 | 0.416 | 0.013 | 0.733 |
| Proportion of non-consolidated urban use | ----------- | --------- | 0.120 | 0.133 | 0.011 | 0.775 |
| Proportion of field/pasture/anthropogenic | −0.099 | 0.349 | 0.169 | 0.034 | ----------- | --------- |
| Proportion of rural use | −0.257 * | 0.014 | 0.115 | 0.150 | 0.01 | 0.802 |
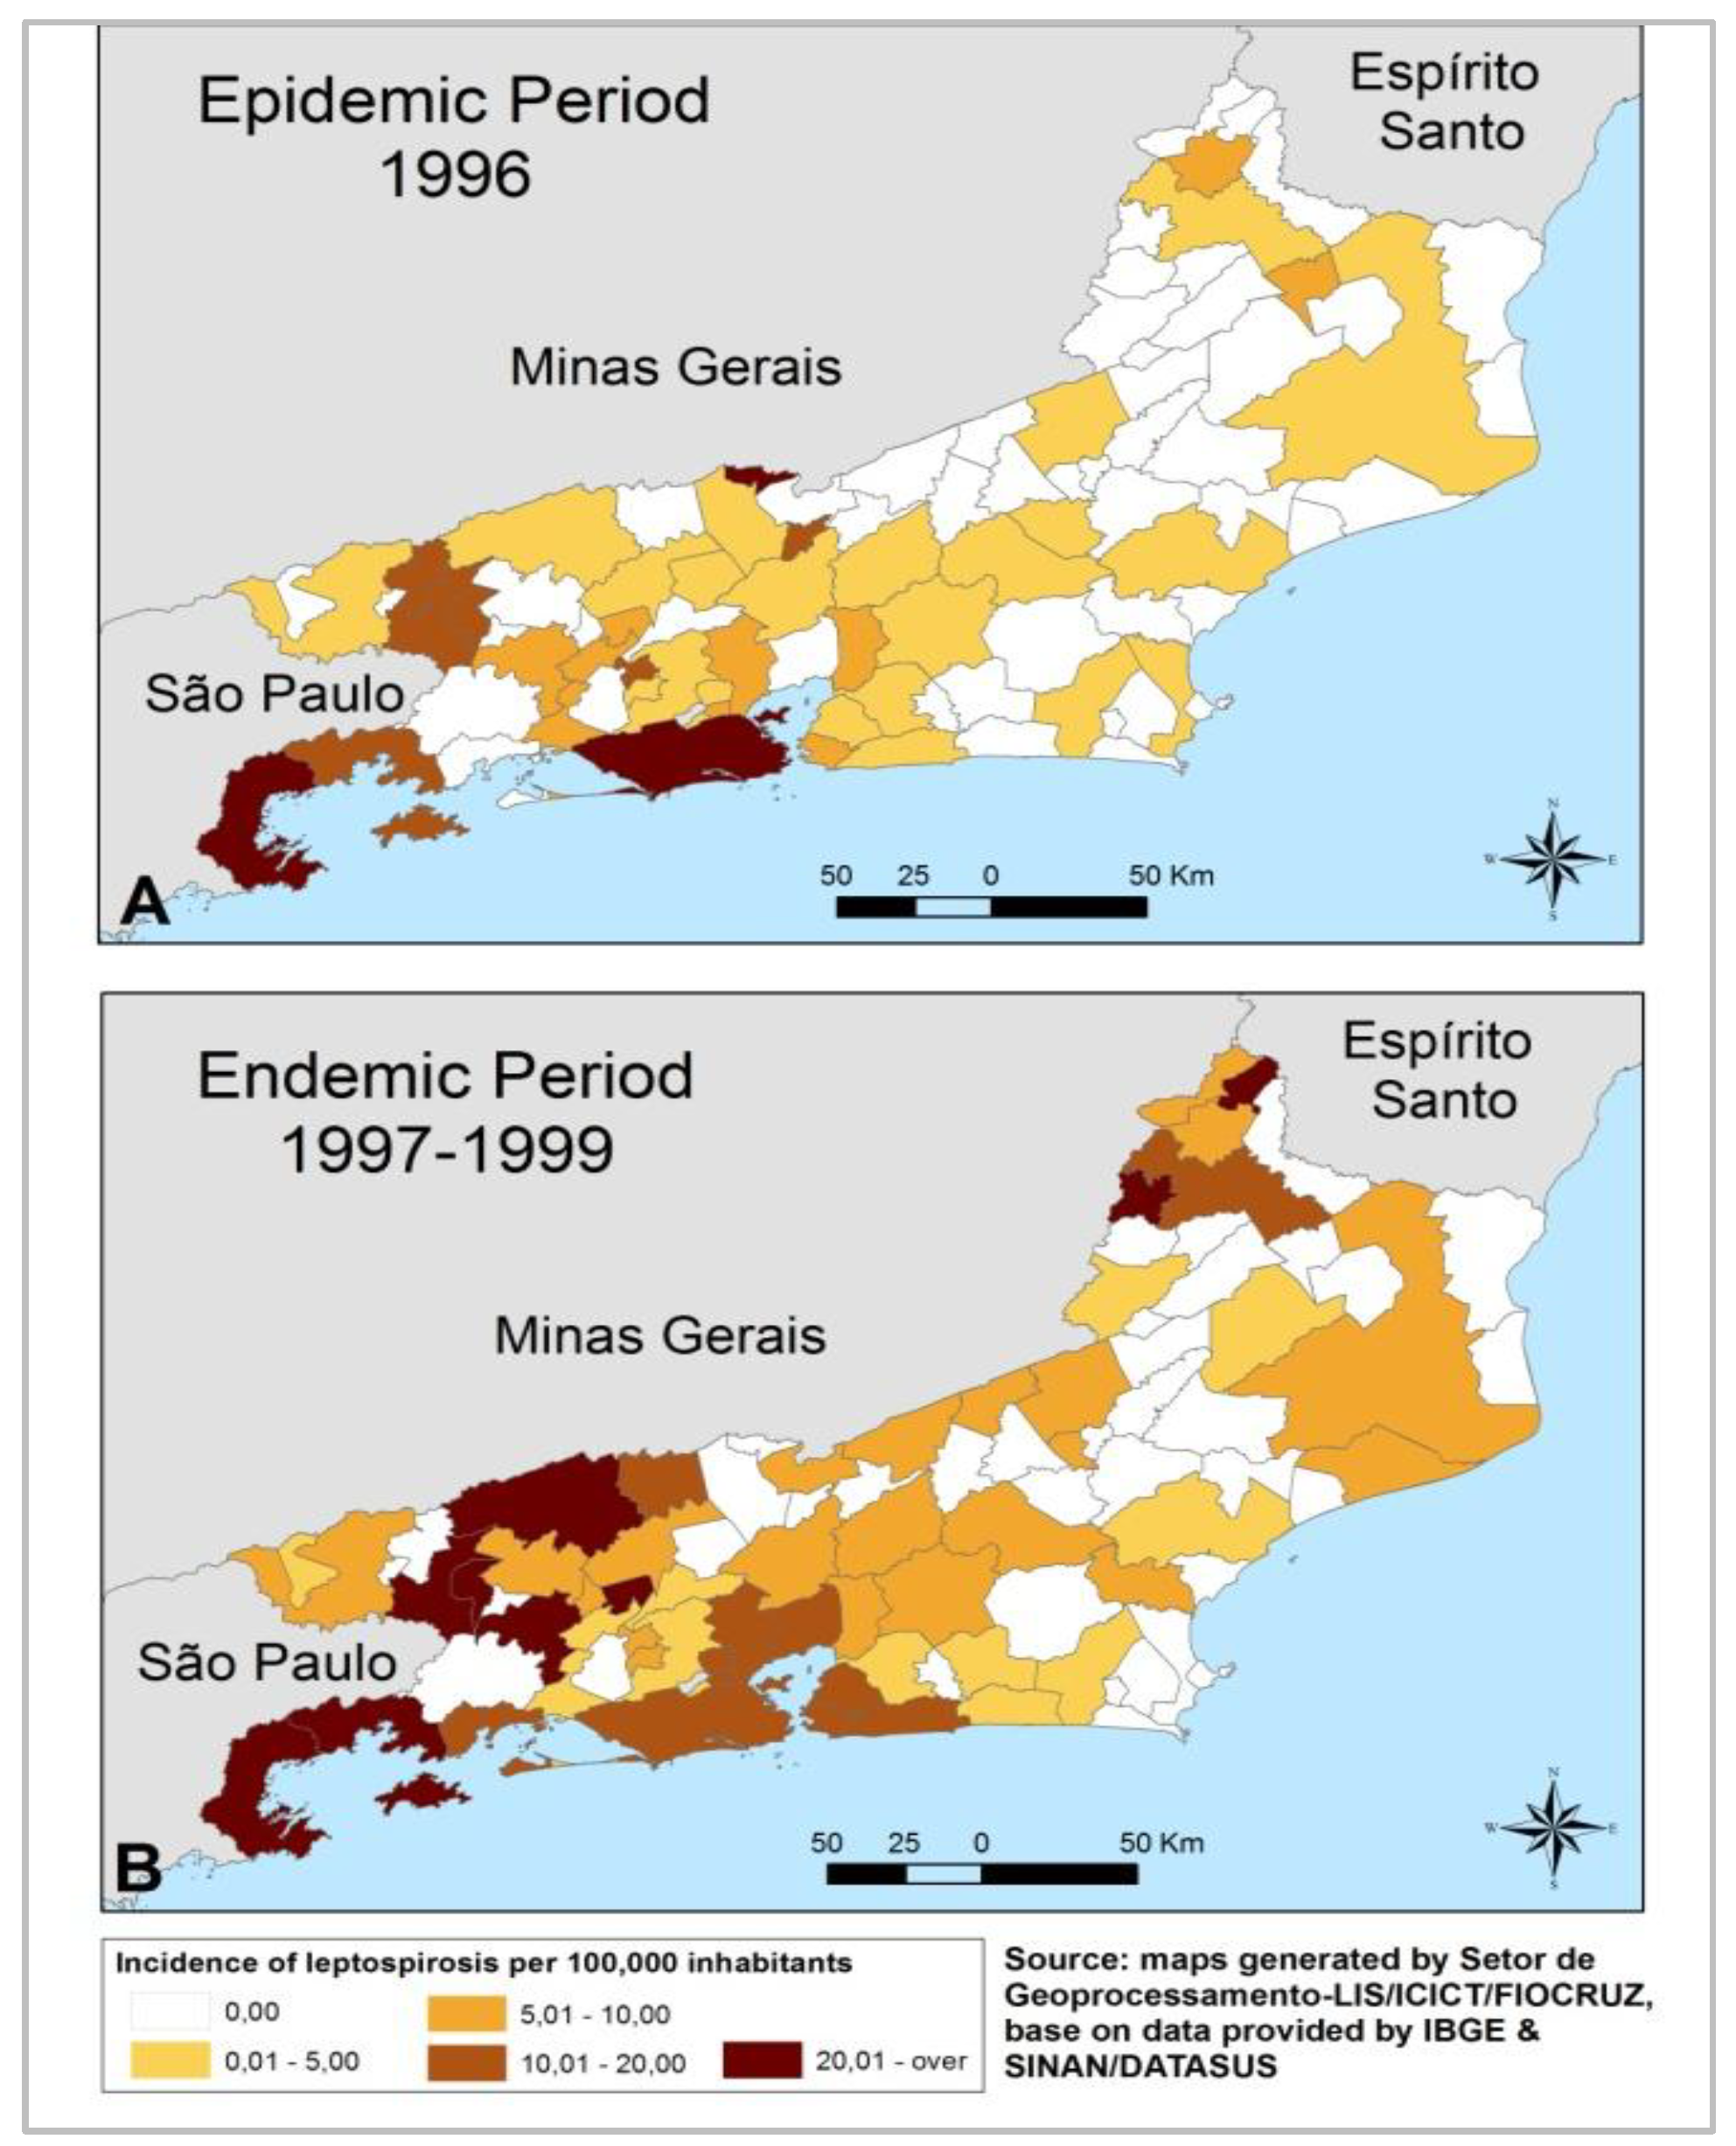
3.1.1. State Level
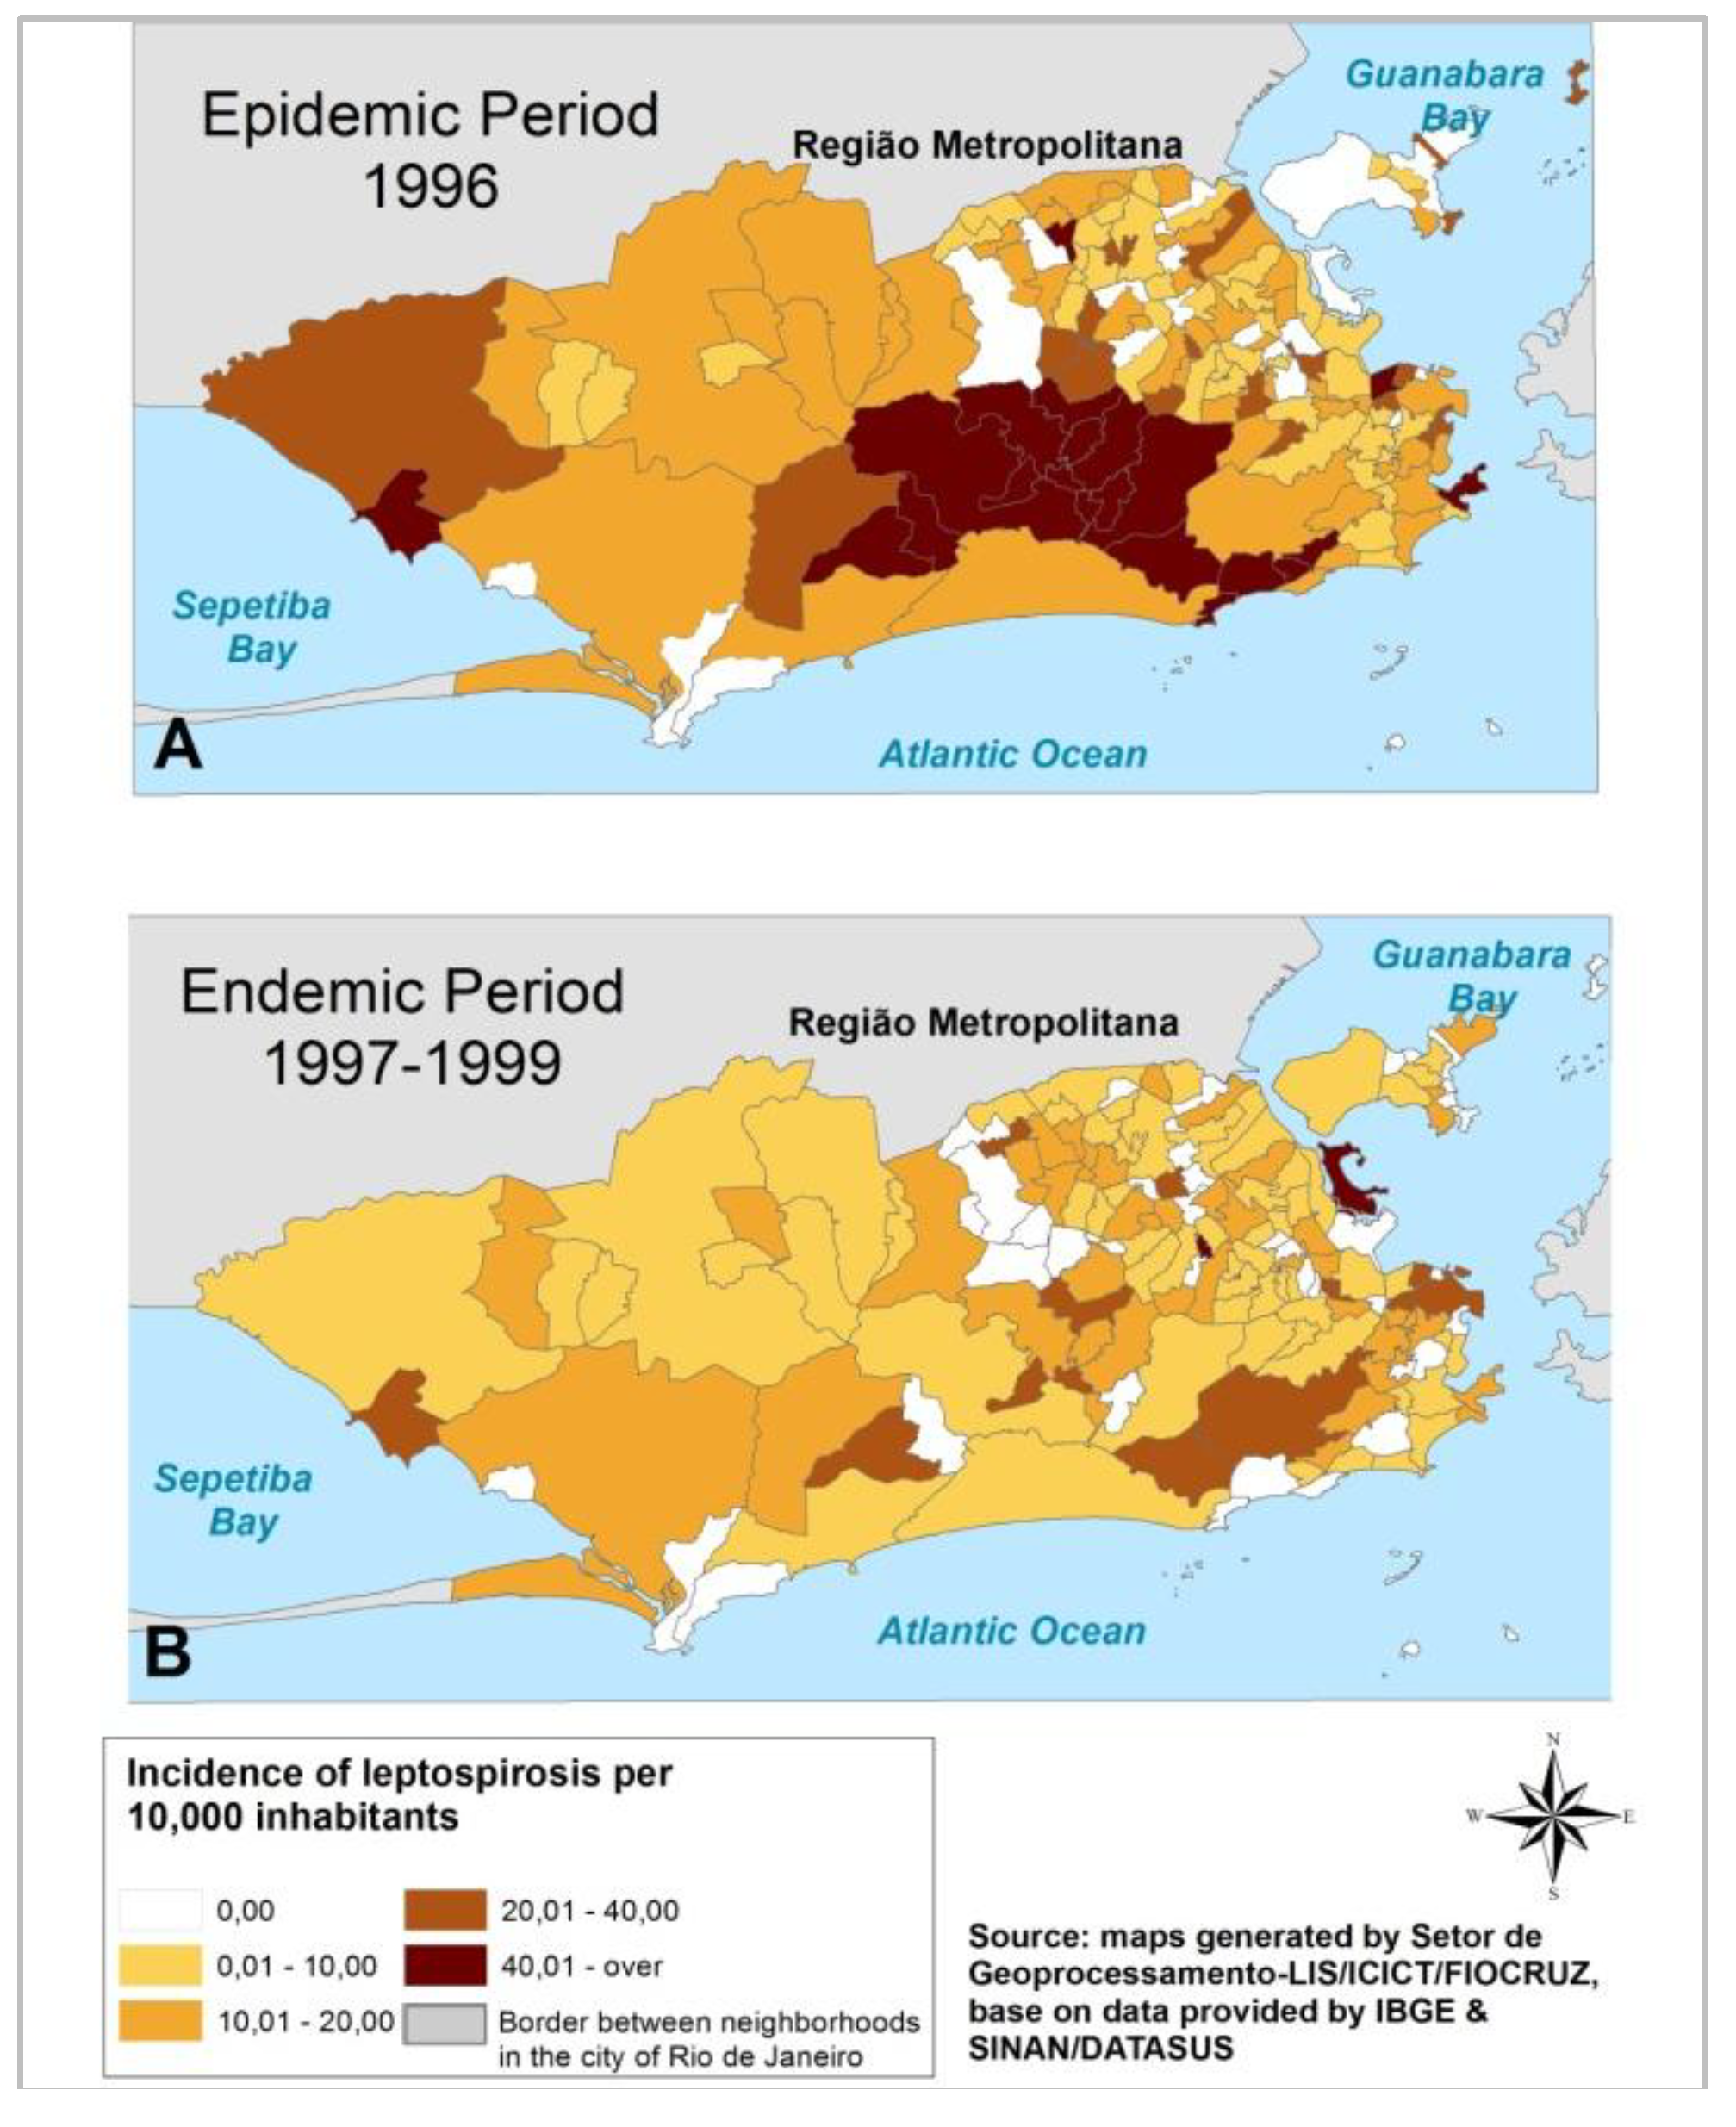
3.1.2. Municipal Level
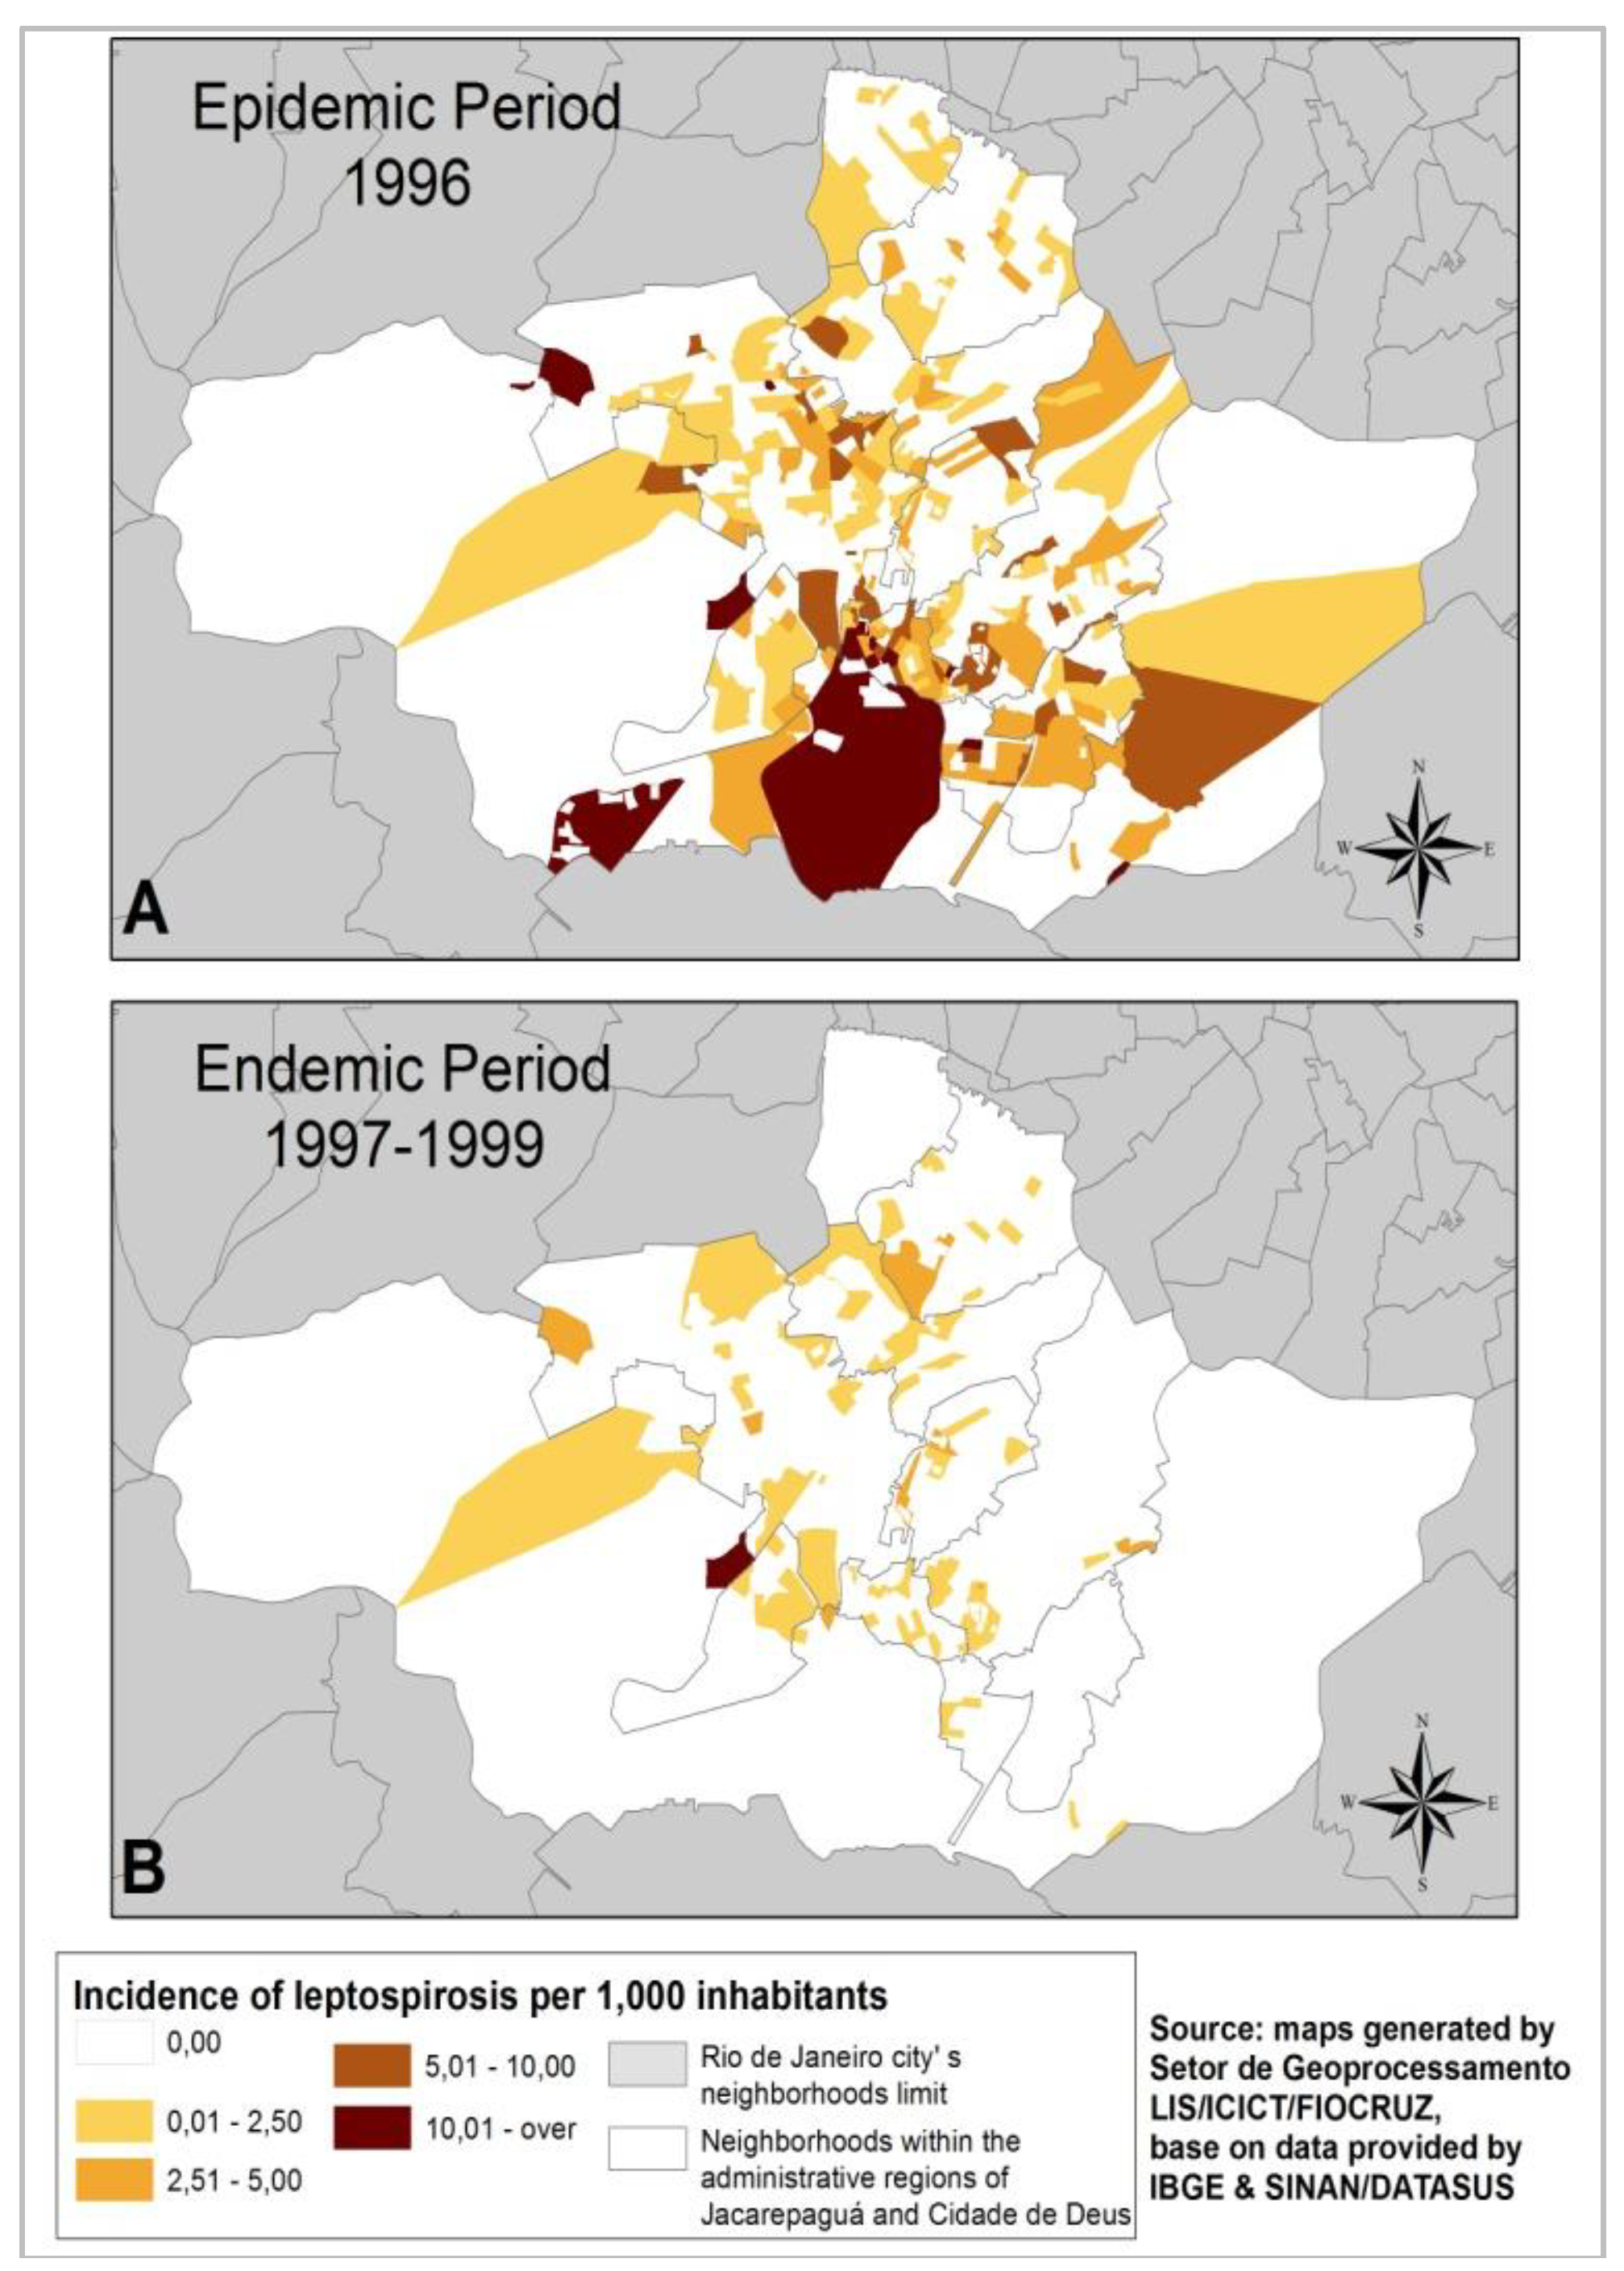
3.1.3. Local Level
3.2. Discussion
4. Conclusions
Acknowledgments
Author Contributions
Conflicts of Interest
References
- Vinetz, J.M. Leptospirosis: Current opinion in infectious disease. 2001, 14, 527–538. [Google Scholar]
- Ko, A.I.; Reis, M.G.; Dourado, C.M.R.; Johnson, W.D., Jr.; Riley, L.W. Urban epidemic of severe leptospirosis in Brasil. Lancet 1999, 354, 820–825. [Google Scholar] [CrossRef] [PubMed]
- Barcellos, C.; Sabroza, P. Socio-environmental determinants of the leptospirosis outbreak of 1996 in western Rio de Janeiro: A geographical appoach. Int. J. Health Res. 2000, 10, 301–313. [Google Scholar] [CrossRef]
- Reis, R.B.; Ribeiro, G.S.; Felzemburgh, R.D.M.; Santana, F.S.; Mohr, S.; Melendez, A.X.T.O.; Queiroz, A.; Santos, A.C.; Ravines, R.R.; Tassinari, W.S.; et al. Impact of environment and social gradient on leptospira infection in urban slums. PLoS Negl. Trop. Dis. 2008, 2. [Google Scholar] [CrossRef] [PubMed]
- Tassinari, W.S.; Pellegrini, D.C.P.; Sá, C.B.P.; Reis, R.B.; Ko, A.I.; Carvalho, M.S. Detection and modelling of case clusters for urban leptospirosis. Trop. Med. Int. Health 2008, 13, 503–512. [Google Scholar] [CrossRef] [PubMed]
- Ministério da Saúde/Secretaria de Vigilância em Saúde. Sinan acessado em janeiro de 2013. Available online: http://dtr2004.saude.gov.br/sinanweb/ (accessed on 30 May 2014).
- Figueiredo, C.M.; Mourão, A.C.; Oliveira, M.A.A.D.; Alves, W.R.; Ooteman, M.C.; Chamone, C.B.; Koury, M.C. Leptospirose humana no município de Belo Horizonte, Minas Gerais, Brasil: Uma abordagem geográfica. Rev. Soc. Bras. Med. Trop. 2001, 34, 331–338. [Google Scholar] [PubMed]
- Sarkar, U.; Nascimento, S.F.; Barbosa, R.; Martins, R.; Nuevo, H.; Kalofonos, I.; Grunstein, I.; Flannery, B.; Dias, J.; Riley, L.W.; et al. Population-based case-control investigation of risk factors for leptospirosis during an urban epidemic. Am. J. Trop. Hyg. 2002, 66, 605–610. [Google Scholar]
- Silva, H.R.; Tavares-Neto, J.; Bina, J.C.; Meyer, R. Leptospirose-infecção e forma subclínica em crianças de Salvador, Bahia. Rev. Soc. Bras. Med. Trop. 2003, 36, 227–233. [Google Scholar] [CrossRef] [PubMed]
- Delbem, A.C.B.; da Silva, F.C.A.; Dias, E.E.M.R.A.; Neto, J.S.F.; de Freitas, J.C. Fatores de risco associados à soro positividade para leptospirose em matrizes suínas. Ciênc. Rural 2004, 34, 847–852. [Google Scholar] [CrossRef]
- Perez, J.; Brescia, F.; Becam, J.; Mauron, C.; Goarant, C. Rodent abundance dynamics and leptospirosis carriage in an area of hyper-endemicity in New Caledonia. PLoS Negl. Trop. Dis. 2011, 5. [Google Scholar] [CrossRef] [PubMed]
- De Melo, C.B.; Reis, R.B.; Ko, A.I.; Barreto, C.M.N.; Lima, A.P.; da Silva, Â.M. Geographical distribution of leptospirosis in Aracaju, State of Sergipe from 2001 to 2007. Rev. Soc. Bras. Med. Trop. 2011, 44, 475–480. [Google Scholar] [CrossRef] [PubMed]
- Schneider, M.C.; Nájera, P.; Aldighieri, S.; Bacallao, J.; Soto, A.; Marquiño, W.; Altamirano, L.; Saenz, C.; Marin, J.; Jimenez, E.; et al. Leptospirosis outbreaks in Nicaragua: Identifying critical areas and exploring drivers for evidence-based planning. Int. J. Environ. Res. Public Health 2012, 9, 3883–3910. [Google Scholar] [CrossRef] [PubMed]
- Escala: Estudo de Conceitos e Aplicações. Available online: http://www.geocart.igeo.ufrj.br/pdf/trabalhos/Escala_Conceitos_Aplic.pdf (accessed on 30 May 2014).
- Barcellos, C. Unidades y escalas en los análises espaciales em salud. Rev. Cuba. Salud Pública 2003, 29, 307–313. [Google Scholar]
- SINAN. Available online: http://dtr2004.saude.gov.br/sinanweb/index.php (accessed on 30 May 2014).
- Brasil Ministério da Saúde. Secretaria de Vigilância em Saúde, Guia de Vigilância Epidemiológica: Leptospirose; Ministério da Saúde: Brasília, Brasil, 2005; pp. 502–520. [Google Scholar]
- IBGE. Available online: http://www.ibge.gov.br/home/ (accessed on 30 May 2014).
- CIDE. Índice de Qualidade dos Municípios-IQM; CIDE: Rio de Janeiro, Brasil, 2003. [Google Scholar]
- IPP. Available online: http://www.rio.rj.gov.br/web/ipp (accessed on 30 May 2014).
- Pina, M.F.; Gracie, R.; Magalhães, M.A.F.M.; Oliveira, G.J. Elaboração de um Sistema de Georreferenciamento de endereços para auxiliar um SIG na área da Saúde Pública. In Proceedings of the XXI Congresso Brasileiro de Cartografia, Belo Horizonte, Brazil, 29 September–3 October 2003.
- Durigutto, P.; Macor, P.; Ziller, F.; Maso, L.D.; Fischetti, F.; Marzari, R.; Sblattero, D.; Tedesco, F. Prevention of arthritis by locally synthesized recombinant antibody neutralizing complement component C5. PLoS One 2013, 8. [Google Scholar] [CrossRef] [PubMed]
- Santos, S.M.; Chor, D.; Werner, G.L. Demarcation of local neighbourhoods to study relations between contextual factors and health. Int. J. Health Geogr. 2010, 9. [Google Scholar] [CrossRef]
- Oliveira, D.S.C.; Guimarães, M.J.B.; Portugal, J.L.; Medeiros, Z. The socio-demographic, environmental and reservoir factors associated with leptospirosis in an urban area of north-eastern Brazil. Ann. Trop. Med. Parasitol. 2009, 103, 149–157. [Google Scholar] [CrossRef] [PubMed]
- Lau, C.L.; Skelly, C.; Smythe, L.D.; Craig, S.B.; Weinstein, P. Emergence of new leptospiral serovars in American Samoa—Ascertainment or ecological change? BMC Infect. Dis. 2012, 12. [Google Scholar] [CrossRef]
- Magalhães, M.A.F.M. A Contribuição da Geomática na Geografia da Saúde-um Estudo de Caso em Jacarepaguá. Master’s Thesis, Universidade Estadual do Rio de Janeiro-UERJ, Rio de Janeiro, Brasil, 2008. [Google Scholar]
- Barcellos, C.; Lammerhirt, C.B.; de Almeida, M.A.B.; dos Santos, E. Distribuição espacial da leptospirose no Rio Grande do Sul, Brasil: Recuperando a ecologia dos estudos ecológicos. Cad. Saúde Pública 2003, 19, 1283–1292. [Google Scholar] [CrossRef] [PubMed]
- Mcbride, A.J.A.; Athanazio, D.A.; Reis, M.G.; Ko, A.I. Leptospirosis. Curr. Opin. Infect. Dis. 2005, 18, 376–386. [Google Scholar] [CrossRef] [PubMed]
© 2014 by the authors; licensee MDPI, Basel, Switzerland. This article is an open access article distributed under the terms and conditions of the Creative Commons Attribution license (http://creativecommons.org/licenses/by/4.0/).
Share and Cite
Gracie, R.; Barcellos, C.; Magalhães, M.; Souza-Santos, R.; Barrocas, P.R.G. Geographical Scale Effects on the Analysis of Leptospirosis Determinants. Int. J. Environ. Res. Public Health 2014, 11, 10366-10383. https://doi.org/10.3390/ijerph111010366
Gracie R, Barcellos C, Magalhães M, Souza-Santos R, Barrocas PRG. Geographical Scale Effects on the Analysis of Leptospirosis Determinants. International Journal of Environmental Research and Public Health. 2014; 11(10):10366-10383. https://doi.org/10.3390/ijerph111010366
Chicago/Turabian StyleGracie, Renata, Christovam Barcellos, Mônica Magalhães, Reinaldo Souza-Santos, and Paulo Rubens Guimarães Barrocas. 2014. "Geographical Scale Effects on the Analysis of Leptospirosis Determinants" International Journal of Environmental Research and Public Health 11, no. 10: 10366-10383. https://doi.org/10.3390/ijerph111010366
APA StyleGracie, R., Barcellos, C., Magalhães, M., Souza-Santos, R., & Barrocas, P. R. G. (2014). Geographical Scale Effects on the Analysis of Leptospirosis Determinants. International Journal of Environmental Research and Public Health, 11(10), 10366-10383. https://doi.org/10.3390/ijerph111010366