Tobacco Retail Outlets and Vulnerable Populations in Ontario, Canada

Abstract
:1. Introduction
- Increased density of tobacco retail outlets per population at the public health unit level (a unit of health administration governance larger than a municipality and approximately equivalent to a county) is associated with increased prevalence of smoking in that unit.
- Tobacco retail outlets are more likely to be located in dissemination areas (neighbourhoods) that have lower socio-economic status, have a higher percentage of immigrants among the population and this effect will vary by urban and rural locations.
- Tobacco retail outlets in lower socio-economic status neighbourhoods are more likely to be located close to a school and to other retailers.
2. Experimental Section
2.1. Data Sources
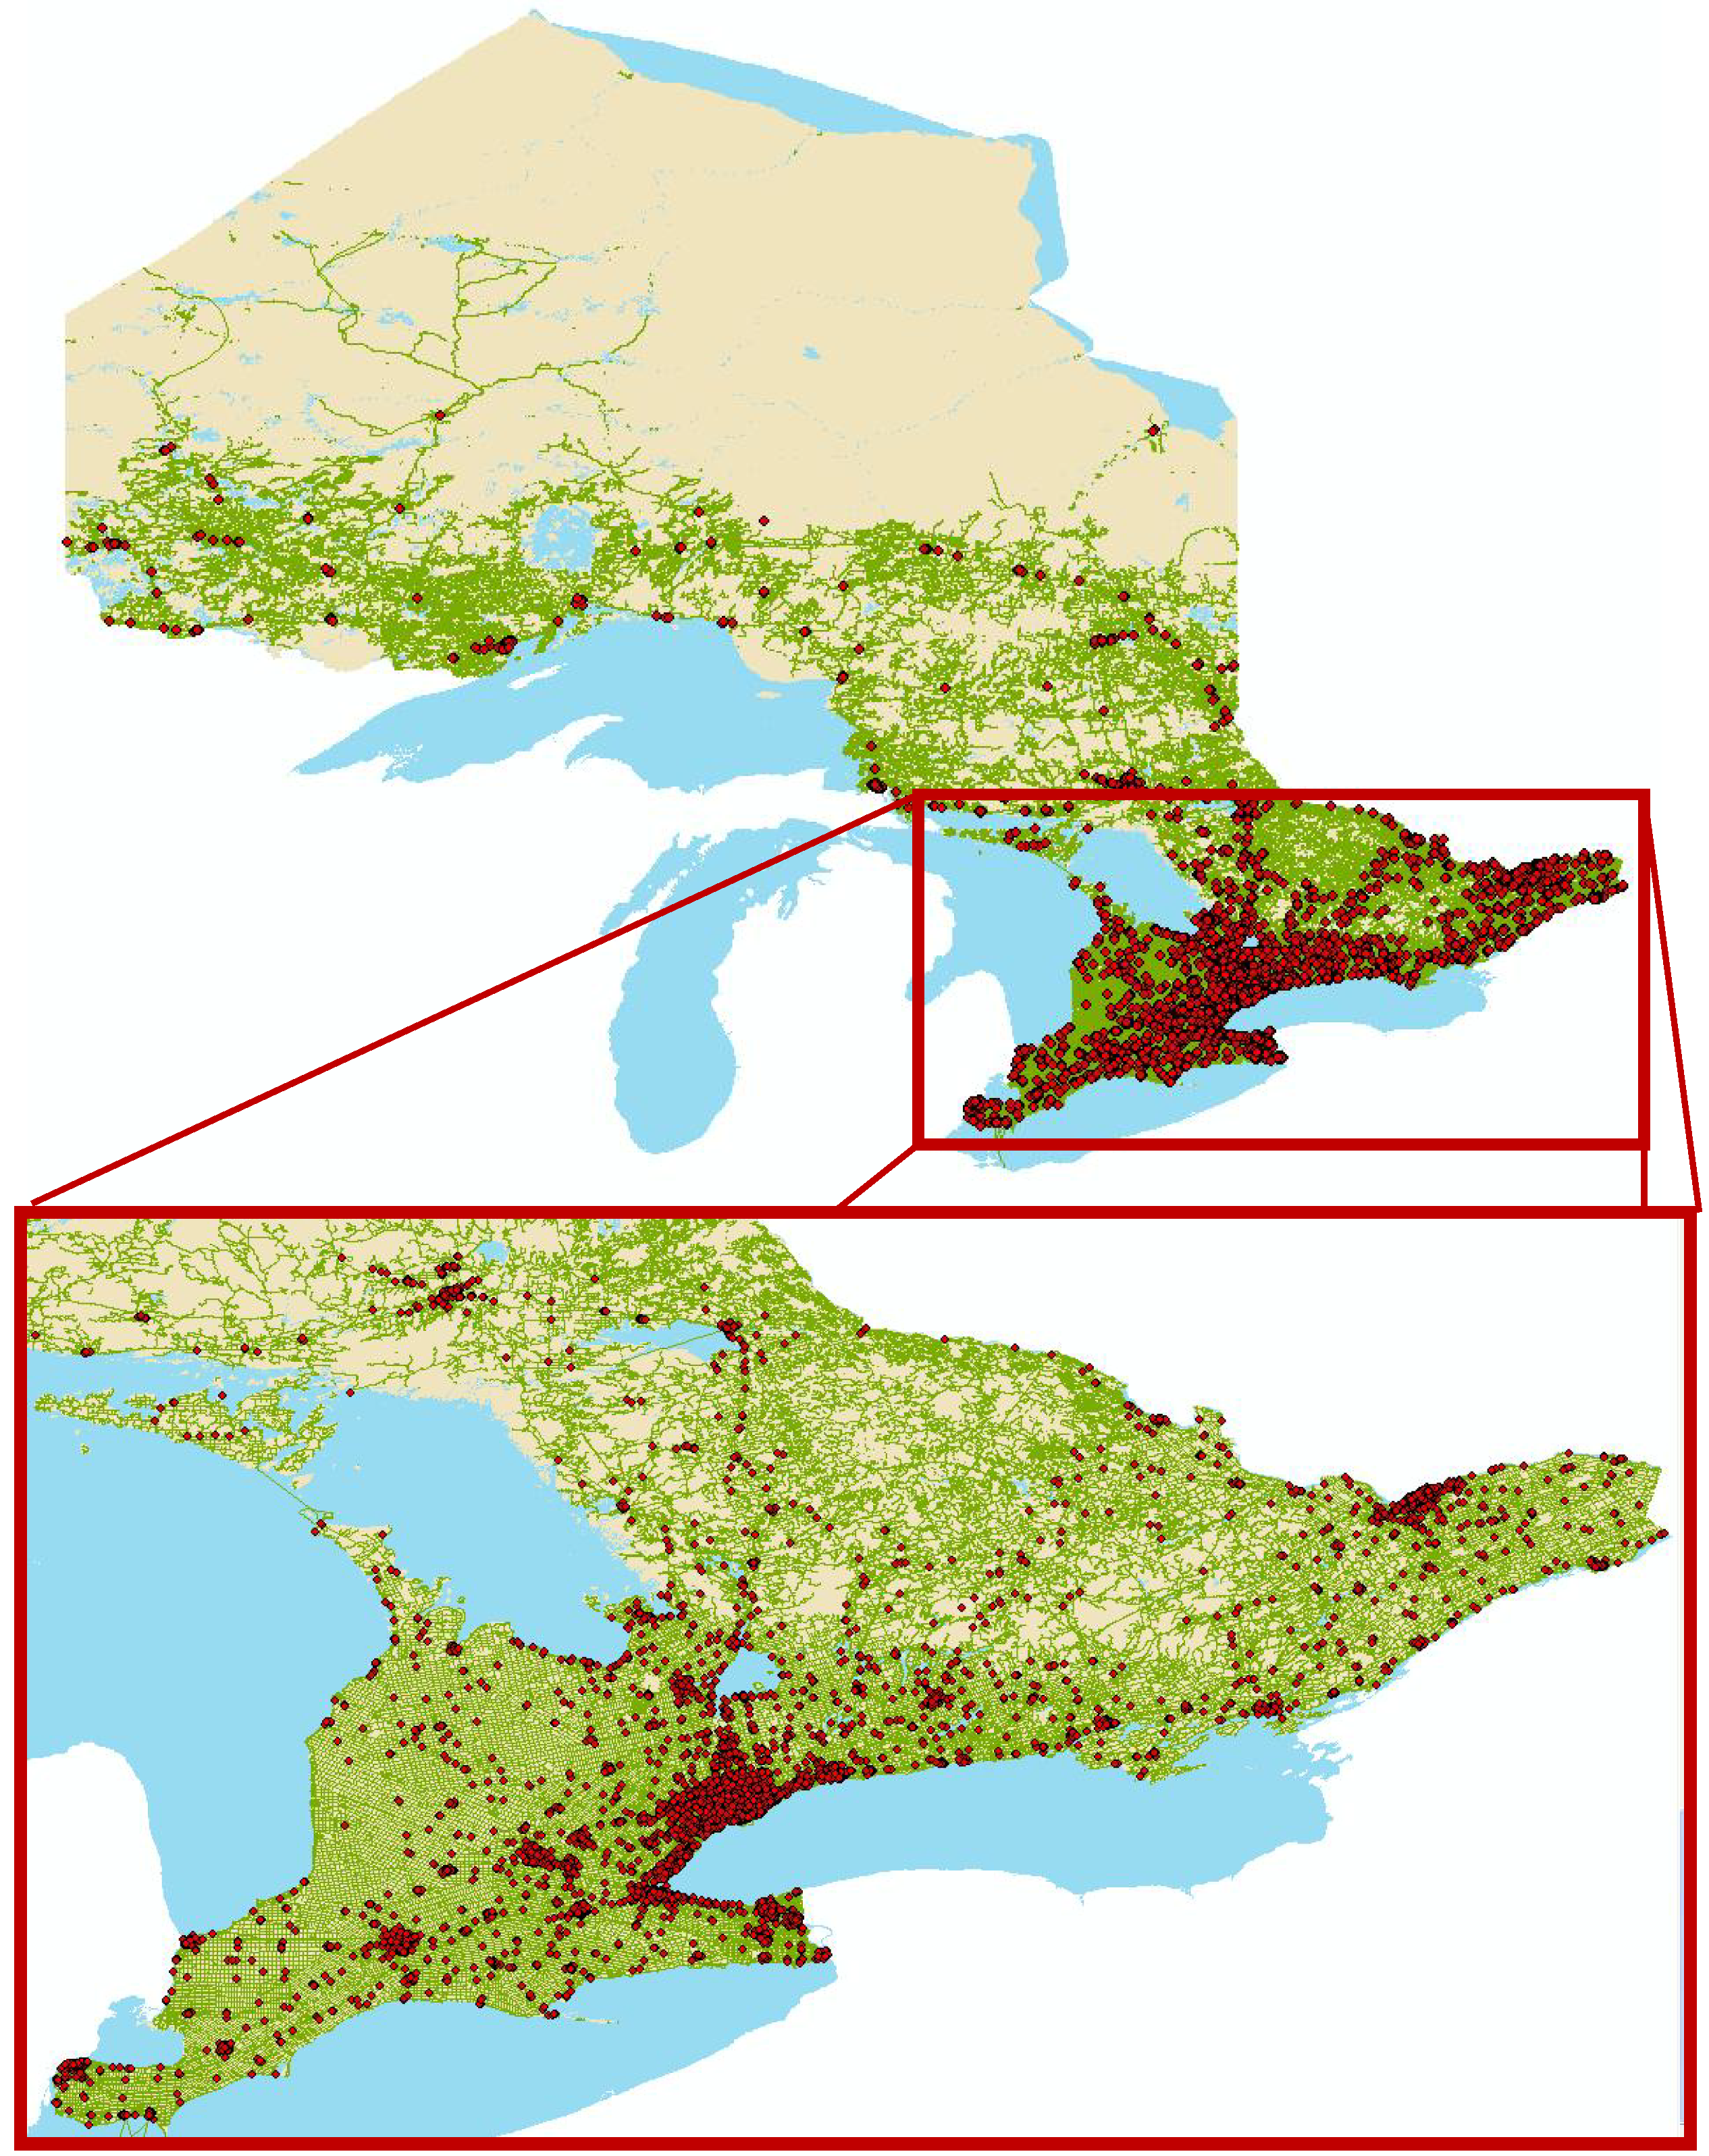
2.2. Mapping
2.3. Analysis
3. Results and Discussion
3.1. Results


| Ontario Tobacco Retailers | Ontario Population | |
|---|---|---|
| % | % | |
| Area classification type * | ||
| Census metropolitan area | 74 | 79 |
| Census agglomeration | 10 | 9 |
| Non-metropolitation/agglomeration | 16 | 12 |
| Rurality | ||
| Urban | 84 | 85 |
| Rural | 16 | 15 |
| Community size | ||
| 1,500,000 + | 42 | 42 |
| 500,000–1,499,999 | 10 | 12 |
| 100,000–499,999 | 23 | 25 |
| 10,000–99,999 | 9 | 9 |
| <10,000 | 16 | 12 |
| Urban | Rural | |||
|---|---|---|---|---|
| Odds Ratio | p-value | Odds Ratio | p-value | |
| Neighbourhood deprivation * | ||||
| Quartile 1—least deprivation | Referent | Referent | ||
| Quartile 2 | 1.58 | <0.0001 | 3.15 | <0.0001 |
| Quartile 3 | 2.04 | <0.0001 | 3.60 | <0.0001 |
| Quartile 4—most deprivation | 3.14 | <0.0001 | 2.70 | <0.0001 |
| Immigrant population | ||||
| Quartile 1—fewest immigrants | Referent | Referent | ||
| Quartile 2 | 0.99 | 0.77 | 1.61 | 0.0002 |
| Quartile 3 | 0.88 | 0.01 | 1.52 | 0.2556 |
| Quartile 4—most immigrants | 0.89 | 0.01 | ||
| Blue-collar workers † | ||||
| Quartile 1—fewest blue-collar | Referent | Referent | ||
| Quartile 2 | 1.23 | <0.0001 | 2.387 | <0.0001 |
| Quartile 3 | 1.41 | <0.0001 | 2.304 | <0.0001 |
| Quartile 4—most blue-collar | 1.42 | <0.0001 | 2.408 | <0.0001 |
| Rural Retailers
N (%) | Urban Retailers
N (%) | Total
N (%) | |
|---|---|---|---|
| #of schools within 500 m of retailer | |||
| 0 | 1,335 (61.7%) | 2,835 (31.7%) | 4,170 (37.5%) |
| 1+ | 828 (38.3%) | 6,115 (68.3%) | 6,943 (62.5%) |
| #of schools within 250 m of retailer | |||
| 0 | 1,791 (82.8%) | 6,244 (70%) | 8,035 (72.3%) |
| 1+ | 372 (17.2%) | 2,706 (30%) | 3,078 (27.7%) |
| Total N | 2,163 | 8,950 | 11,113 |
| Neighbourhood Income Quintiles | # of Retailers within Meters of a School N (%) | |
|---|---|---|
| Retailers within 250 m | Retailers within 500 m | |
| 1 (lowest) | 1,025 (33.3%) | 2,236 (72.7%) |
| 2 | 754 (29.2%) | 1,707 (66.2%) |
| 3 | 491 (23.6%) | 1,159 (55.7%) |
| 4 | 392 (22.3%) | 950 (54.0%) |
| 5 (highest) | 385 (25.4%) | 831 (54.9%) |
| p-trend | <0.0001 | <0.0001 |
3.2. Discussion
4. Limitations
5. Conclusions
Acknowledgments
Conflicts of Interest
References
- Lopez, A.D.; Mathers, C.D.; Ezzati, M.; Jamison, D.T.; Murray, C.J.L. Global Burden of Disease and Risk Factors; World Bank and Oxford University Press: Washington, DC, USA, 2006. [Google Scholar]
- Prohibition of Tobacco Sales in Specific Places: Monitoring Update. Available online: http://otru.org/wp-content/uploads/2012/10/sales2012.pdf (accessed on 26 January 2013).
- Borland, R. A strategy for controlling the marketing of tobacco products: A regulated market model. Tob. Control 2003, 12, 374–382. [Google Scholar] [CrossRef]
- Callard, C.; Thompson, D.; Collishaw, N. Curing the Addiction to Profits: A Supply Side Approach to Phasing out Tobacco; Canadian Centre Policy Alternatives: Ottawa, ON, Canada, 2005. [Google Scholar]
- Chapman, S.; Freeman, B. Regulating the tobacco retail environment: Beyond reducing sales to minors. Tob. Control 2009, 18, 496–501. [Google Scholar] [CrossRef]
- Cohen, J.E.; Anglin, L. Outlet density: A new frontier for tobacco control. Addiction 2009, 104, 2–3. [Google Scholar] [CrossRef]
- Collishaw, N. Tobacco lawsuits. Can. Med. Assoc. J. 2010, 182. [Google Scholar] [CrossRef]
- Ferrence, R. Learning from tobacco: Bans on commercial availability are not unthinkable. Addiction 2003, 98, 720–721. [Google Scholar] [CrossRef]
- A Smoke-Free Future: A Comprehensive Tobacco Control Strategy for England. Available online: http://webarchive.nationalarchives.gov.uk/20100509080731/www.dh.gov.uk/en/Publicationsandstatistics/Publications/PublicationsPolicyAndGuidance/DH_111749 (accessed on 26 January 2013).
- Bonnie, R.J. Ending the Tobacco Problem: A Blueprint for the Nation; National Academies Press: Washington, DC, USA, 2007. [Google Scholar]
- A Menu of Supply-Side Approaches to Reduce Tobacco Use. Available online: http://www.smokefree.ca/pdf_1/supplyside.pdf (accessed on 26 January 2013).
- Corner Stores Help Create Nicotine Addicts. Available online: http://www.canada.com/ottawacitizen/news/letters/story.html?id=60ef585e-14d4-4391-a9de-55297a9a13cc (accessed on 26 January 2013).
- Reducing the Availability of Tobacco Products at Retail: Policy Analysis. Available online: http://www.nsra-adnf.ca/cms/file/files/Reducing_Retail_Availabilty_policy_analysis_final_2011.pdf (accessed on 26 January 2013).
- Laws, M.B.; Whitman, J.; Bowser, D.M.; Krech, L. Tobacco availability and point of sale marketing in demographically contrasting districts of Massachusetts. Tob. Control 2002, 11, ii71–ii73. [Google Scholar]
- Hyland, A.; Travers, M.J.; Cummings, K.M.; Bauer, J.; Alford, T.; Wieczorek, W.F. Tobacco outlet density and demographics in Erie County, New York. Am. J. Public Health 2003, 93, 1075–1076. [Google Scholar] [CrossRef]
- Ogneva-Himmelberger, Y.; Ross, L.; Burdick, W; Simpson, S.A. Using geographic information systems to compare the density of stores selling tobacco and alcohol: Youth making an argument for increased regulation of the tobacco permitting process in Worcester, Massachusetts, USA. Tob. Control 2010, 19, 475–480. [Google Scholar] [CrossRef]
- Siahpush, M.; Jones, P.R.; Singh, G.K.; Timsina, L.R.; Martin, J. Association of availability of tobacco products with socio-economic and racial/ethnic characteristics of neighbourhoods. Public Health 2010, 124, 525–529. [Google Scholar] [CrossRef]
- Henriksen, L.; Feighery, E.C.; Schleicher, N.C.; Cowling, D.W.; Kline, R.S.; Fortmann, S.P. Is adolescent smoking related to the density and proximity of tobacco outlets and retail cigarette advertising near schools? Prev. Med. 2008, 47, 210–214. [Google Scholar] [CrossRef]
- Peterson, N.A.; Lowe, J.B.; Reid, R.J. Tobacco outlet density, cigarette smoking prevalence, and demographics at the county level of analysis. Subst. Use Misuse 2005, 40, 1627–1635. [Google Scholar] [CrossRef]
- Yellow Pages Canada. Available online: http://www.yellowpages.ca (accessed 30 September 2011).
- CMA and CA: Detailed Definition. Available online: http://www.statcan.gc.ca/pub/92-195-x/2011001/geo/cma-rmr/def-eng.htm (accessed on 26 January 2013).
- Dissemination Area (DA). Available online: http://www12.statcan.gc.ca/census-recensement/2011/ref/dict/geo021-eng.cfm (accessed on 26 January 2013).
- Matheson, F.I.; Moineddin, R.; Dunn, J.R.; Creatore, M.I.; Gozdyra, P.; Glazier, R.H. Urban neighbourhoods, chronic street, gender and depression. Soc. Sci. Med. 2006, 63, 2604–2616. [Google Scholar] [CrossRef]
- Wood, L.J.; Pereira, G.; Middleton, N.; Foster, S. Socioeconomic area disparities in tobacco retail outlet density: A Western Australian analysis. Med. J.Aust. 2013, 198, 489–491. [Google Scholar]
- Rodriguez, D.; Carlos, H.A.; Adachi-Mejia, A.M.; Berke, E.M.; Sargent, J. Retail tobacco exposure: Using geographic analysis to identify areas with excessively high retail density. Nicotine Tob. Res. 2013, 2013. [Google Scholar] [CrossRef]
- Bandura, A. Social Foundations of Thought and Action: A Social Cognitive Theory; Prentice-Hall: Upper Saddle River, NJ, USA, 1986. [Google Scholar]
- Piontek, D.; Buehler, A.; Rudolph, U.; Metz, K.; Kroeger, C.; Gradl, S.; Floeter, S.; Donath, C. Social contexts in adolescent smoking: Does school policy matter? Health Educ. Res. 2008, 23, 1029–1038. [Google Scholar]
- O’Loughlin, J.; Maximova, K.; Fraser, K.; Gray-Donald, K. Does the “healthy immigrant effect” extend to smoking in immigrant children? J. Adolesc. Health 2010, 46, 299–301. [Google Scholar] [CrossRef]
- Novak, S.P.; Reardon, S.F.; Raudenbush, S.W.; Buka, S.L. Retail tobacco outlet density and youth cigarette smoking: A propensity-modeling approach. Am. J. Public Health 2006, 96, 670–676. [Google Scholar] [CrossRef]
- Schwartz, R.; Dubray, J.; Philipneri, A.; Chaiton, M.; O’Connor, S. Evidence for Developing and Implementing Cessation Services. In Disease Interrupted: Tobacco Reduction and Cessation; Els, C., Kunyk, D., Selby, P., Eds.; CreateSpace Independent Publishing Platform: Charleston, SC, USA, 2012. [Google Scholar]
- LaVeist, T.A.; Wallace, J.M., Jr. Health risk and inequitable distribution of liquor stores in African American neighborhood. Soc. Sci. Med. 2000, 51, 613–617. [Google Scholar] [CrossRef]
- Romley, J.A.; Cohen, D.; Ringel, J.; Sturm, R. Alcohol and environmental justice: The density of liquor stores and bars in urban neighborhoods in the United States. J. Stud. Alcohol Drugs 2007, 68, 48–55. [Google Scholar]
- Leatherdale, S.T.; Strath, J.M. Tobacco retailer density surrounding schools and cigarette access behaviors among underage smoking students. Ann. Behav. Med. 2007, 33, 105–111. [Google Scholar] [CrossRef]
- Chan, W.C.; Leatherdale, S.T. Tobacco retailer density surrounding schools and youth smoking behaviour: a multi-level analysis. Tob. Induc. Dis. 2011, 9. [Google Scholar] [CrossRef]
- Lipton, R.; Banerjee, A.; Levy, D.; Manzanilla, N.; Cochrane, M. The spatial distribution of underage tobacco sales in Los Angeles. Subst. Use Misuse 2008, 43, 1594–1614. [Google Scholar] [CrossRef]
- Loomis, B.R.; Kim, A.E.; Busey, A.H.; Farrelly, M.C.; Willett, J.G.; Juster, H.R. The density of tobacco retailers and its association with attitudes toward smoking, exposure to point-of-sale tobacco advertising, cigarette purchasing, and smoking among New York youth. Prev. Med. 2012, 55, 468–474. [Google Scholar] [CrossRef]
- Johns, M.; Sacks, R.; Rane, M.; Kansagra, S.M. Exposure to tobacco retail outlets and smoking initiation among New York City adolescents. J. Urban Health 2013, 90, 1091–1101. [Google Scholar] [CrossRef]
© 2013 by the authors; licensee MDPI, Basel, Switzerland. This article is an open access article distributed under the terms and conditions of the Creative Commons Attribution license (http://creativecommons.org/licenses/by/3.0/).
Share and Cite
Chaiton, M.O.; Mecredy, G.C.; Cohen, J.E.; Tilson, M.L. Tobacco Retail Outlets and Vulnerable Populations in Ontario, Canada. Int. J. Environ. Res. Public Health 2013, 10, 7299-7309. https://doi.org/10.3390/ijerph10127299
Chaiton MO, Mecredy GC, Cohen JE, Tilson ML. Tobacco Retail Outlets and Vulnerable Populations in Ontario, Canada. International Journal of Environmental Research and Public Health. 2013; 10(12):7299-7309. https://doi.org/10.3390/ijerph10127299
Chicago/Turabian StyleChaiton, Michael O., Graham C. Mecredy, Joanna E. Cohen, and Melodie L. Tilson. 2013. "Tobacco Retail Outlets and Vulnerable Populations in Ontario, Canada" International Journal of Environmental Research and Public Health 10, no. 12: 7299-7309. https://doi.org/10.3390/ijerph10127299
APA StyleChaiton, M. O., Mecredy, G. C., Cohen, J. E., & Tilson, M. L. (2013). Tobacco Retail Outlets and Vulnerable Populations in Ontario, Canada. International Journal of Environmental Research and Public Health, 10(12), 7299-7309. https://doi.org/10.3390/ijerph10127299