1. Introduction
The effects of marine environment sediment contamination with ordnance compounds received a special attention [
1–
3]. A number of researches have been conducted near several naval facilities in Puget Sound, WA, revealing that the studied ordnance compounds were not a case for environmental concern in marine sediments [
4,
5]. The literature also reported that some marine macro algae species (e.g. green alga
acrosiphonia coalita, red alga
porphyra zezoensis, and red alga
portieria hornemannii) have an active role in removal of ordnance compounds [
6–
8].
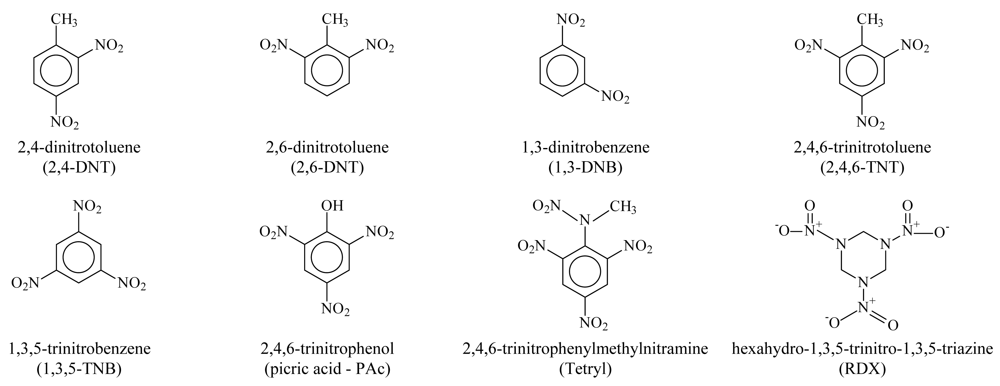
The marine sediment toxicity was previously studied by Carr and Nipper [
4] for eight ordnance compounds (see
Figure 1): 2,4-dinitrotoluene (2,4-DNT), 2,6-dinitrotoluene (2,6-DNT), 1,3-dinitrobenzene (1,3-DNB), 2,4,6-trinitrotoluene (2,4,6-TNT), 1,3,5-trinitrobenzene (1,3,5-TNB), 2,4,6-trinitrophenylmethylnitramine (tetryl), 2,4,6-trinitrophenol (picric acid), and hexahydro-1,3,5-trinitro-1,3,5-triazine (Royal Demolition Explosive - RDX). The reproduction of the
polychaete and the embryological development of
arbacia punctulata have been identified as most sensitive species and endpoints [
4] while tetryl and 1,3,5-trinitrobenzen are considered as the most toxic ordnance compounds [
4].
Figure 1.
2D structure of ordnance compounds.
Figure 1.
2D structure of ordnance compounds.
The main objective of the present research was to identify and to quantify the relationship between the structure of eight ordnance compounds and their marine toxicity by using the Molecular Descriptors Family on the Structure-Activity Relationships approach.
3. Results and Discussion
The MDF SAR monovariate models with estimated and predictive abilities on investigated endpoints for studied ordnance compounds were identified and are presented in
Table 4 for EC
50,
Table 5 for NOEC, and
Table 6 for LOEC.
The analysis of the
Tables 4 –
6 revealed that all monovariate regression models are statistically significant at a significance level of 5% (p < 0.0001). Note that significance of the descriptor’s name is explained on Material and Method section, “Step 3” and is explained in the results tables below descriptor names (see the followings: Dominant Atomic Property, Interaction via, Interaction Model, and Structure on Activity Scale).
The goodness-of-fit of all models were close to the highest value (one): greater than 0.93 for EC
50 (see
Table 4) and LOEC (see
Table 6), and 0.90 for NOEC (see
Table 5). The goodness-of-fit of the models is also sustained by the values of standard error of estimated which never took values greater than 0.42 (see the values of standard error of estimated (s),
Tables 4 –
6). The relationship between the investigated toxicity and molecular descriptor used as independent variable was very good (see
Figures 2 –
13).
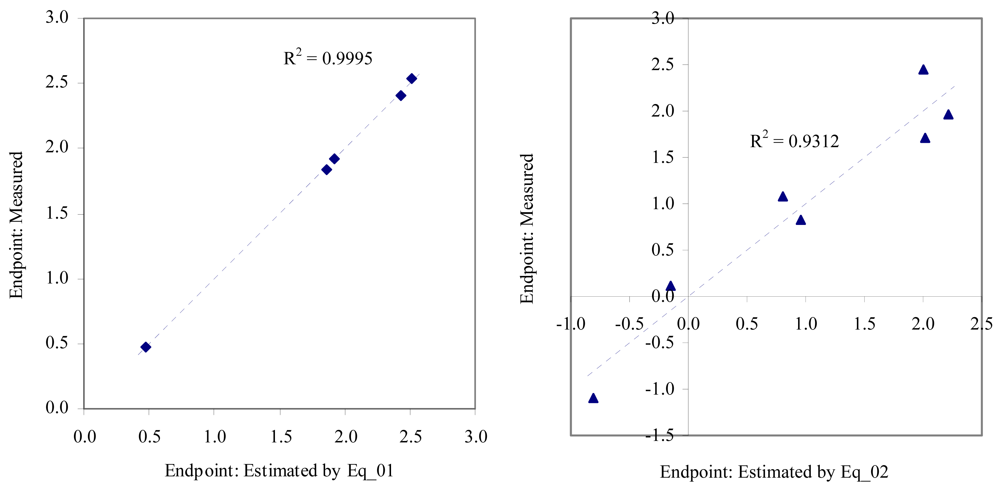
Figure 2.
Relationship between experimental and estimated EC50: fertilization (Eq_01, left hand graphic), and embryological development of sea urchin (Eq_02, right hand graphic).
Figure 2.
Relationship between experimental and estimated EC50: fertilization (Eq_01, left hand graphic), and embryological development of sea urchin (Eq_02, right hand graphic).
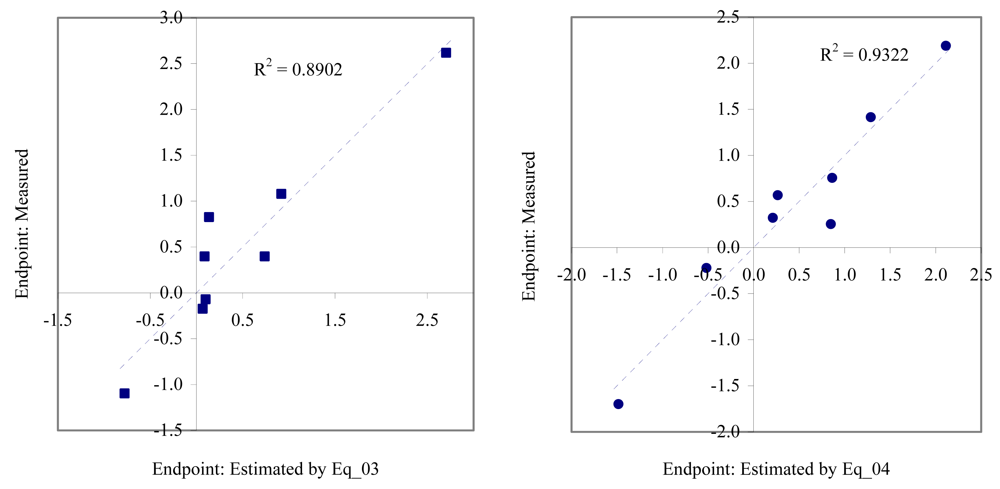
Figure 3.
Relationship between experimental and estimated EC50: germination of sea urchin (Eq_03, left hand graphic), and survival and reproductive success of polychaete (Eq_04, right hand graphic).
Figure 3.
Relationship between experimental and estimated EC50: germination of sea urchin (Eq_03, left hand graphic), and survival and reproductive success of polychaete (Eq_04, right hand graphic).
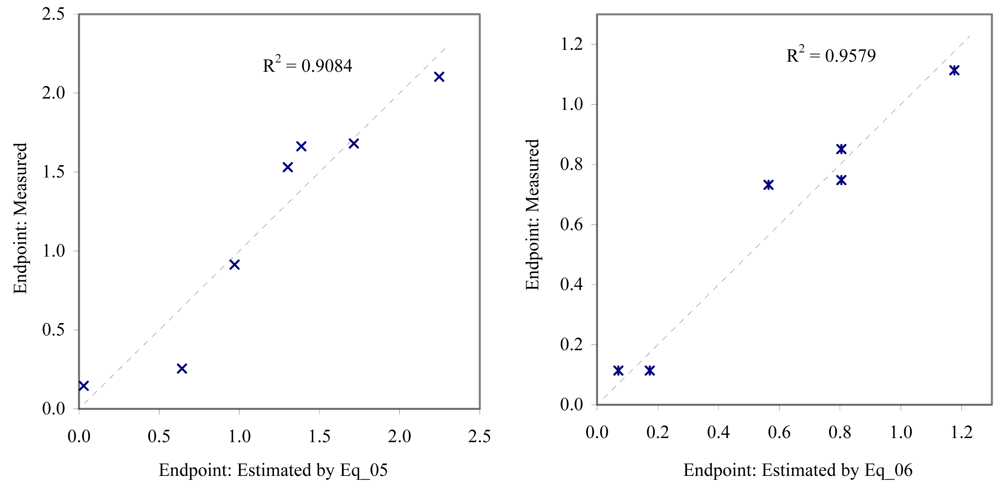
Figure 4.
Relationship between experimental and estimated EC50: larvae survival of redfish (Eq_05, left hand graphic), and juveniles survival of mysid (Eq_06, right hand graphic).
Figure 4.
Relationship between experimental and estimated EC50: larvae survival of redfish (Eq_05, left hand graphic), and juveniles survival of mysid (Eq_06, right hand graphic).
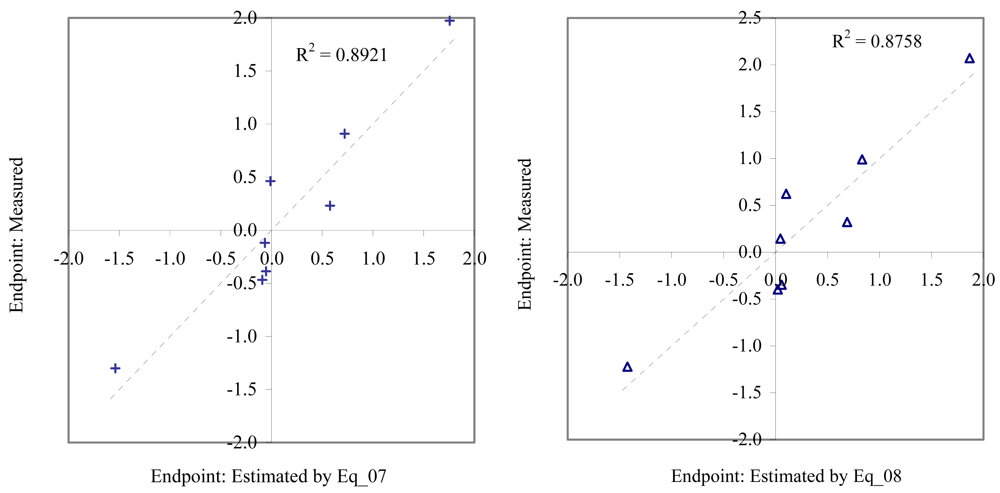
Figure 5.
Relationship between experimental and estimated EC50: germling length (Eq_07, left hand graphic), and germling cell number of macro-alga (Eq_08, right hand graphic).
Figure 5.
Relationship between experimental and estimated EC50: germling length (Eq_07, left hand graphic), and germling cell number of macro-alga (Eq_08, right hand graphic).
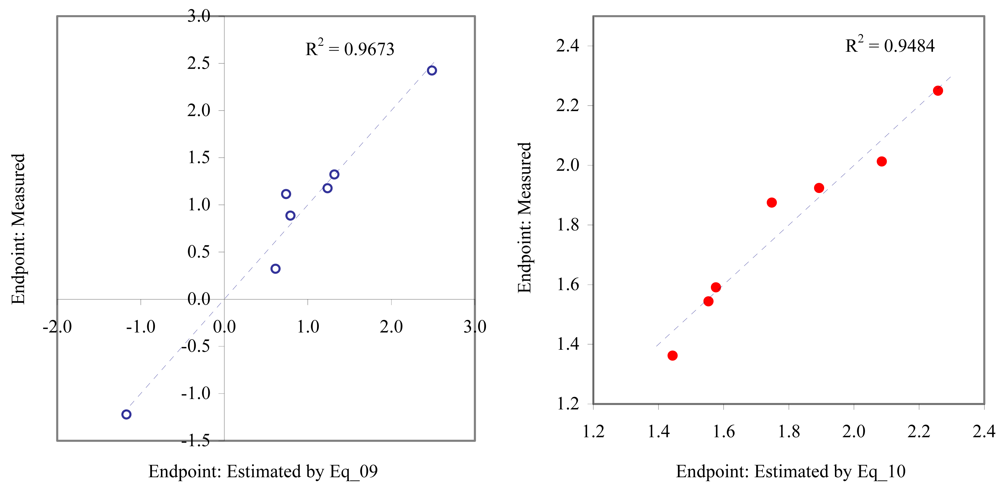
Figure 6.
Relationship between experimental and estimated EC50: survival of macro-alga (Eq_09, left hand graphic), and NOEC as fertilization of sea urchin (Eq_10, right hand graphic).
Figure 6.
Relationship between experimental and estimated EC50: survival of macro-alga (Eq_09, left hand graphic), and NOEC as fertilization of sea urchin (Eq_10, right hand graphic).
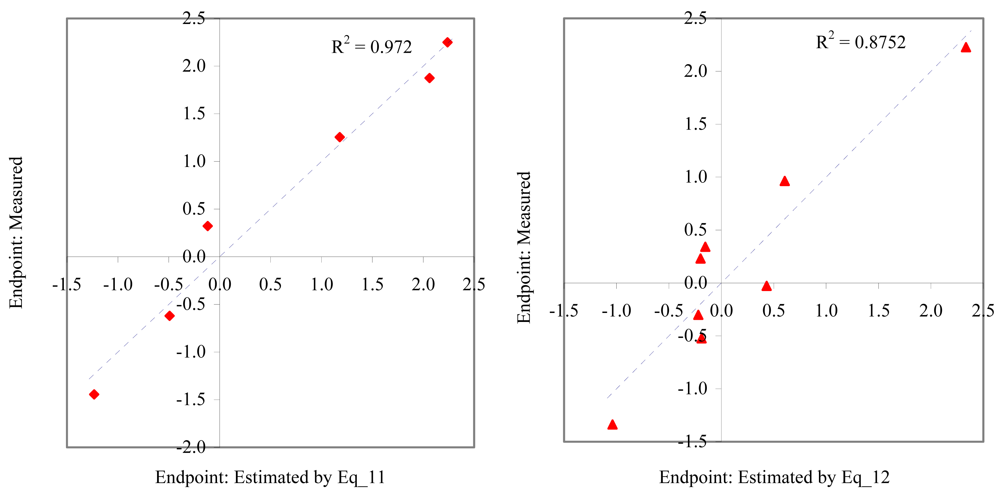
Figure 7.
Relationship between experimental and estimated NOEC: embryological development (Eq_11, left hand graphic), and germination of sea urchin (Eq_12, right hand graphic).
Figure 7.
Relationship between experimental and estimated NOEC: embryological development (Eq_11, left hand graphic), and germination of sea urchin (Eq_12, right hand graphic).
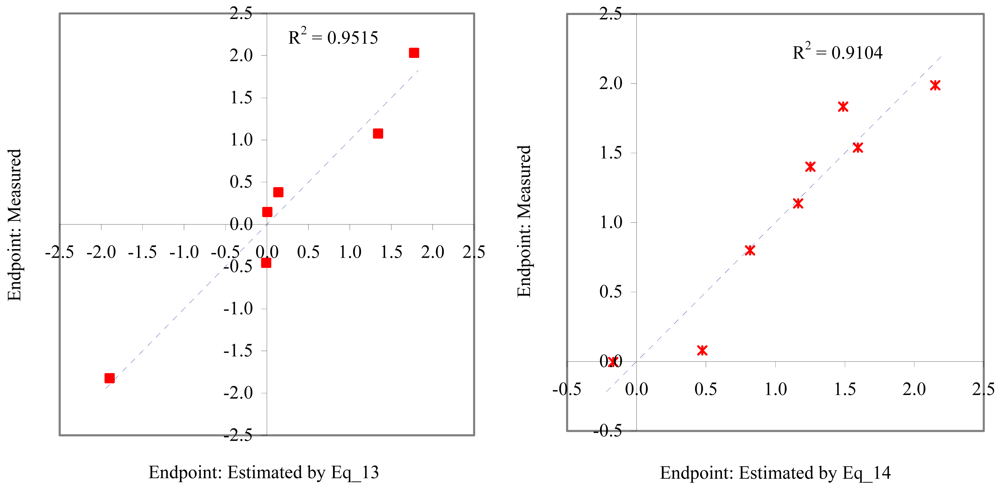
Figure 8.
Relationship between experimental and estimated NOEC: laid eggs/female of polychaete (Eq_13, left hand graphic), and larvae survival of redfish (Eq_14, right hand graphic).
Figure 8.
Relationship between experimental and estimated NOEC: laid eggs/female of polychaete (Eq_13, left hand graphic), and larvae survival of redfish (Eq_14, right hand graphic).
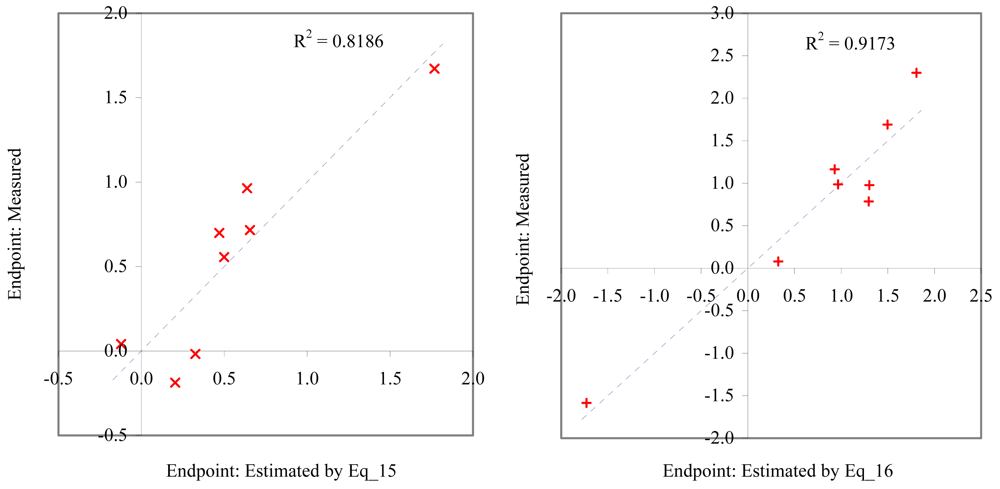
Figure 9.
Relationship between experimental and estimated NOEC: survival of mysid (Eq_15, left hand graphic), and survival of macro-alga (Eq_16, right hand graphic).
Figure 9.
Relationship between experimental and estimated NOEC: survival of mysid (Eq_15, left hand graphic), and survival of macro-alga (Eq_16, right hand graphic).
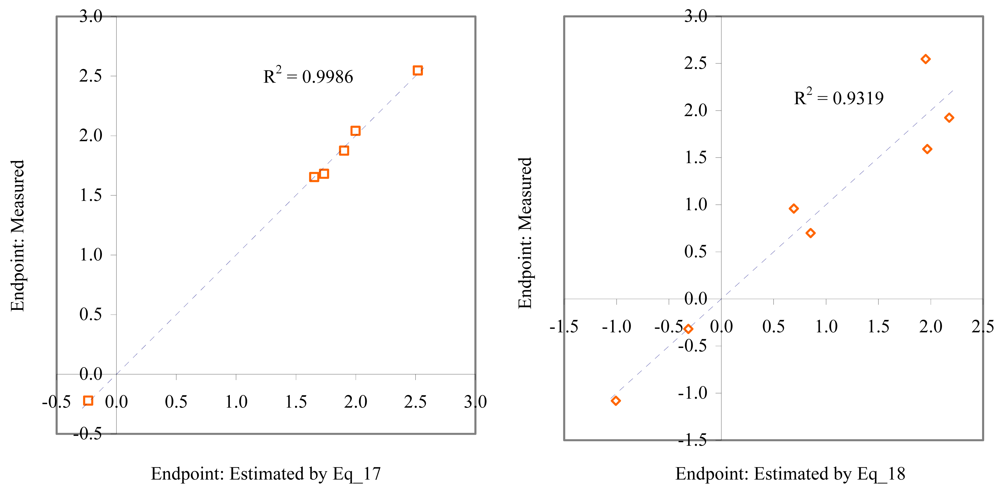
Figure 10.
Relationship between experimental and estimated LOEC: fertilization (Eq_17, left hand graphic), and embryological development of sea urchin (Eq_18, right hand graphic).
Figure 10.
Relationship between experimental and estimated LOEC: fertilization (Eq_17, left hand graphic), and embryological development of sea urchin (Eq_18, right hand graphic).
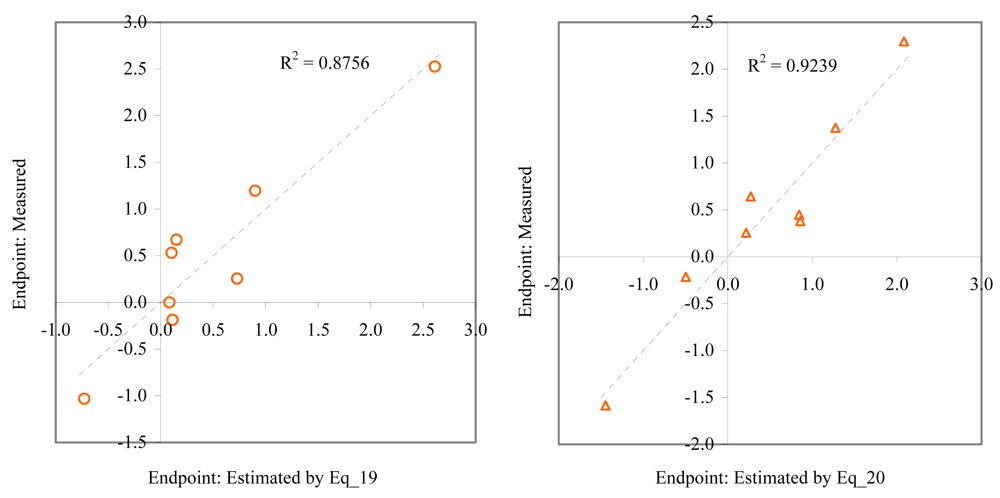
Figure 11.
Relationship between experimental and estimated LOEC: germination of sea urchin (Eq_19, left hand graphic), and laid eggs/female of polychaete (Eq_20, right hand graphic).
Figure 11.
Relationship between experimental and estimated LOEC: germination of sea urchin (Eq_19, left hand graphic), and laid eggs/female of polychaete (Eq_20, right hand graphic).
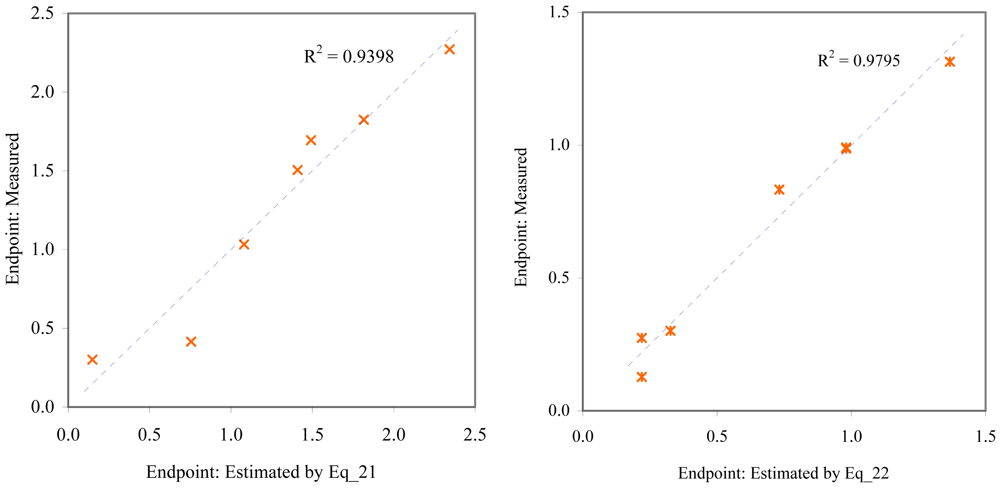
Figure 12.
Relationship between experimental and estimated LOEC: larvae survival of redfish (Eq_21, left hand graphic), and survival of mysid (Eq_22, right hand graphic).
Figure 12.
Relationship between experimental and estimated LOEC: larvae survival of redfish (Eq_21, left hand graphic), and survival of mysid (Eq_22, right hand graphic).
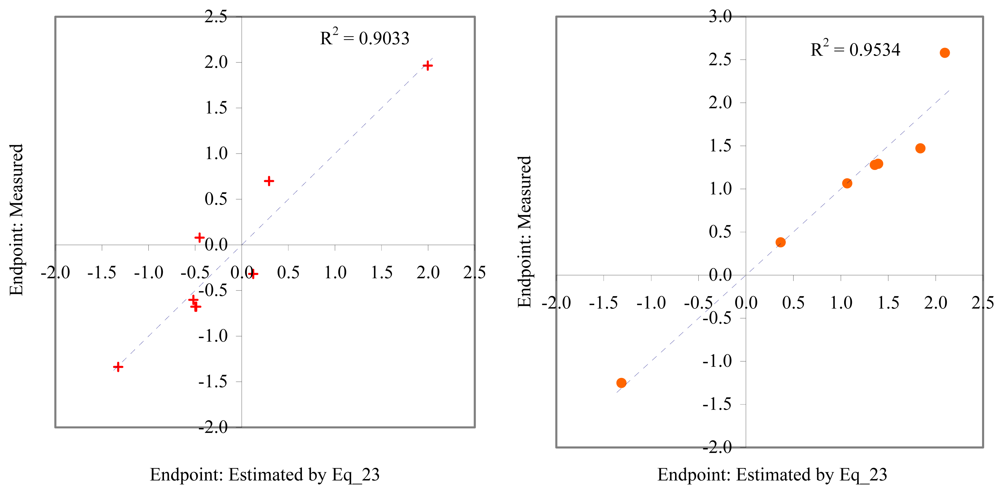
Figure 13.
Relationship between experimental and estimated LOEC: germling length and cell number (Eq_22, left hand graphic), and survival of macro-alga (Eq_24, right hand graphic).
Figure 13.
Relationship between experimental and estimated LOEC: germling length and cell number (Eq_22, left hand graphic), and survival of macro-alga (Eq_24, right hand graphic).
Therefore, more than eighty-one percent of the activity of interest on studied ordnance compounds can be explained by the linear relationship with the variation of molecular descriptors generated strictly based on the information extracted from the ordnance compounds structure (see values of coefficient of determination – R
2 from
Figures 2 –
13). The lowest determination ability was obtained for the juveniles’ survival of mysid (with R
2 = 0.8186). The highest determination was obtained for fertilization of sea urchin (R
2 = 0.9995). In seventy-five percent of cases the determination ability was higher than 0.9000.
The stability of each model was investigated in a cross-validation leave-one-out analysis. The values of the cross-validation leave-one-out score sustained the validity of the models. The lowest cross-validation leave-one-out score was of 0.7263. The values where higher than:
0.7500 in twenty-three out of twenty-four cases;
0.8000 in twenty-two out of twenty-four cases;
0.8500 in fifteen out of twenty-four cases;
0.9000 in nine out of twenty-four cases.
The lowest value of the cross-validation leave-one-out score was obtained by Eq_15 (see
Table 5) being in accordance with the value of the correlation coefficient. The highest cross-validation leave-one-out score was obtained by Eq_01 (see
Table 4).
The stability of the obtained models could be expressed by the difference between the determination coefficient and the cross-validation leave-one-out score. The model from Eq_01 obtained the lowest value of 0.0011 while the model from Eq_11 obtained the highest value of 0.0923. The differences between coefficient of determination and leave-one-out cross-validation score did not exceed 0.1, sustaining the absence of over fitted model and/or the absence of outliers. Therefore, it can be concluded that the lowest ability in identification and quantification the relationships between structures of the ordnance compounds and toxicity was obtained for juveniles’ survival of mysid when the NOEC was the investigated toxicity.
The obtained MDF SAR models are valid according with the criteria of Erikson
et al. [
22] (see the statistical parameters of all models presented in Eq_01 – Eq_24,
Tables 4 –
6, and
Figures 2 –
13).
In the regard of the type of relationships between ordnance compounds structures and associated toxicities on investigated species it can say that:
The EC
50 on the investigated endpoints (different species, see
Table 4) revealed to be of geometrical nature and directly related with the atomic partial charge (almost 44% of investigated endpoints showed to be of topological nature, see
Table 4).
The NOEC on the investigated endpoints (different species, see
Table 5) revealed also to be of geometrical nature and directly related with the partial charge (the topological nature was observed in 3 cases out of seven, while the relationship with compounds electronegativity was observed in 1 case out of 7 cases, see
Table 5).
The LOEC on the investigated endpoints (different species, see
Table 6) revealed also to be of geometrical nature (the topological nature was identified in 3 cases out of 8 investigated) and directly related with the partial charge (the relationship with compounds cardinality was observed in 1 case out of 8 investigated, see
Table 5).
The activities of ordnance compounds without reliable experimental data (expressed as values greater than a number, see
Tables 1 –
3) were predicted by using the obtained models (
Tables 4 –
6). The results expressed as the values of the molecular descriptors and predicted activities are presented in
Table 7.
The predicted toxicities on different species calculated for studied ordnance compounds need to be validated. This can be done easily once the experimental toxicities are measure. The MDF SAR approach proved to be a useful method in characterization of ordnance compounds toxicities on investigated marine species, offering valid and reliable models. The limited number of the compounds investigated represents the main limitation of the study. The impossibility of validation the predicted toxicities (see
Table 7) is another limitation of the study. The obtained MDF SARs models were obtained on small samples, thus further investigations must be done for the validation of the approach.


