
Identification of Novel LCN2 Inhibitors Based on Construction of Pharmacophore Models and Screening of Marine Compound Libraries by Fragment Design


Abstract
1. Introduction
2. Results
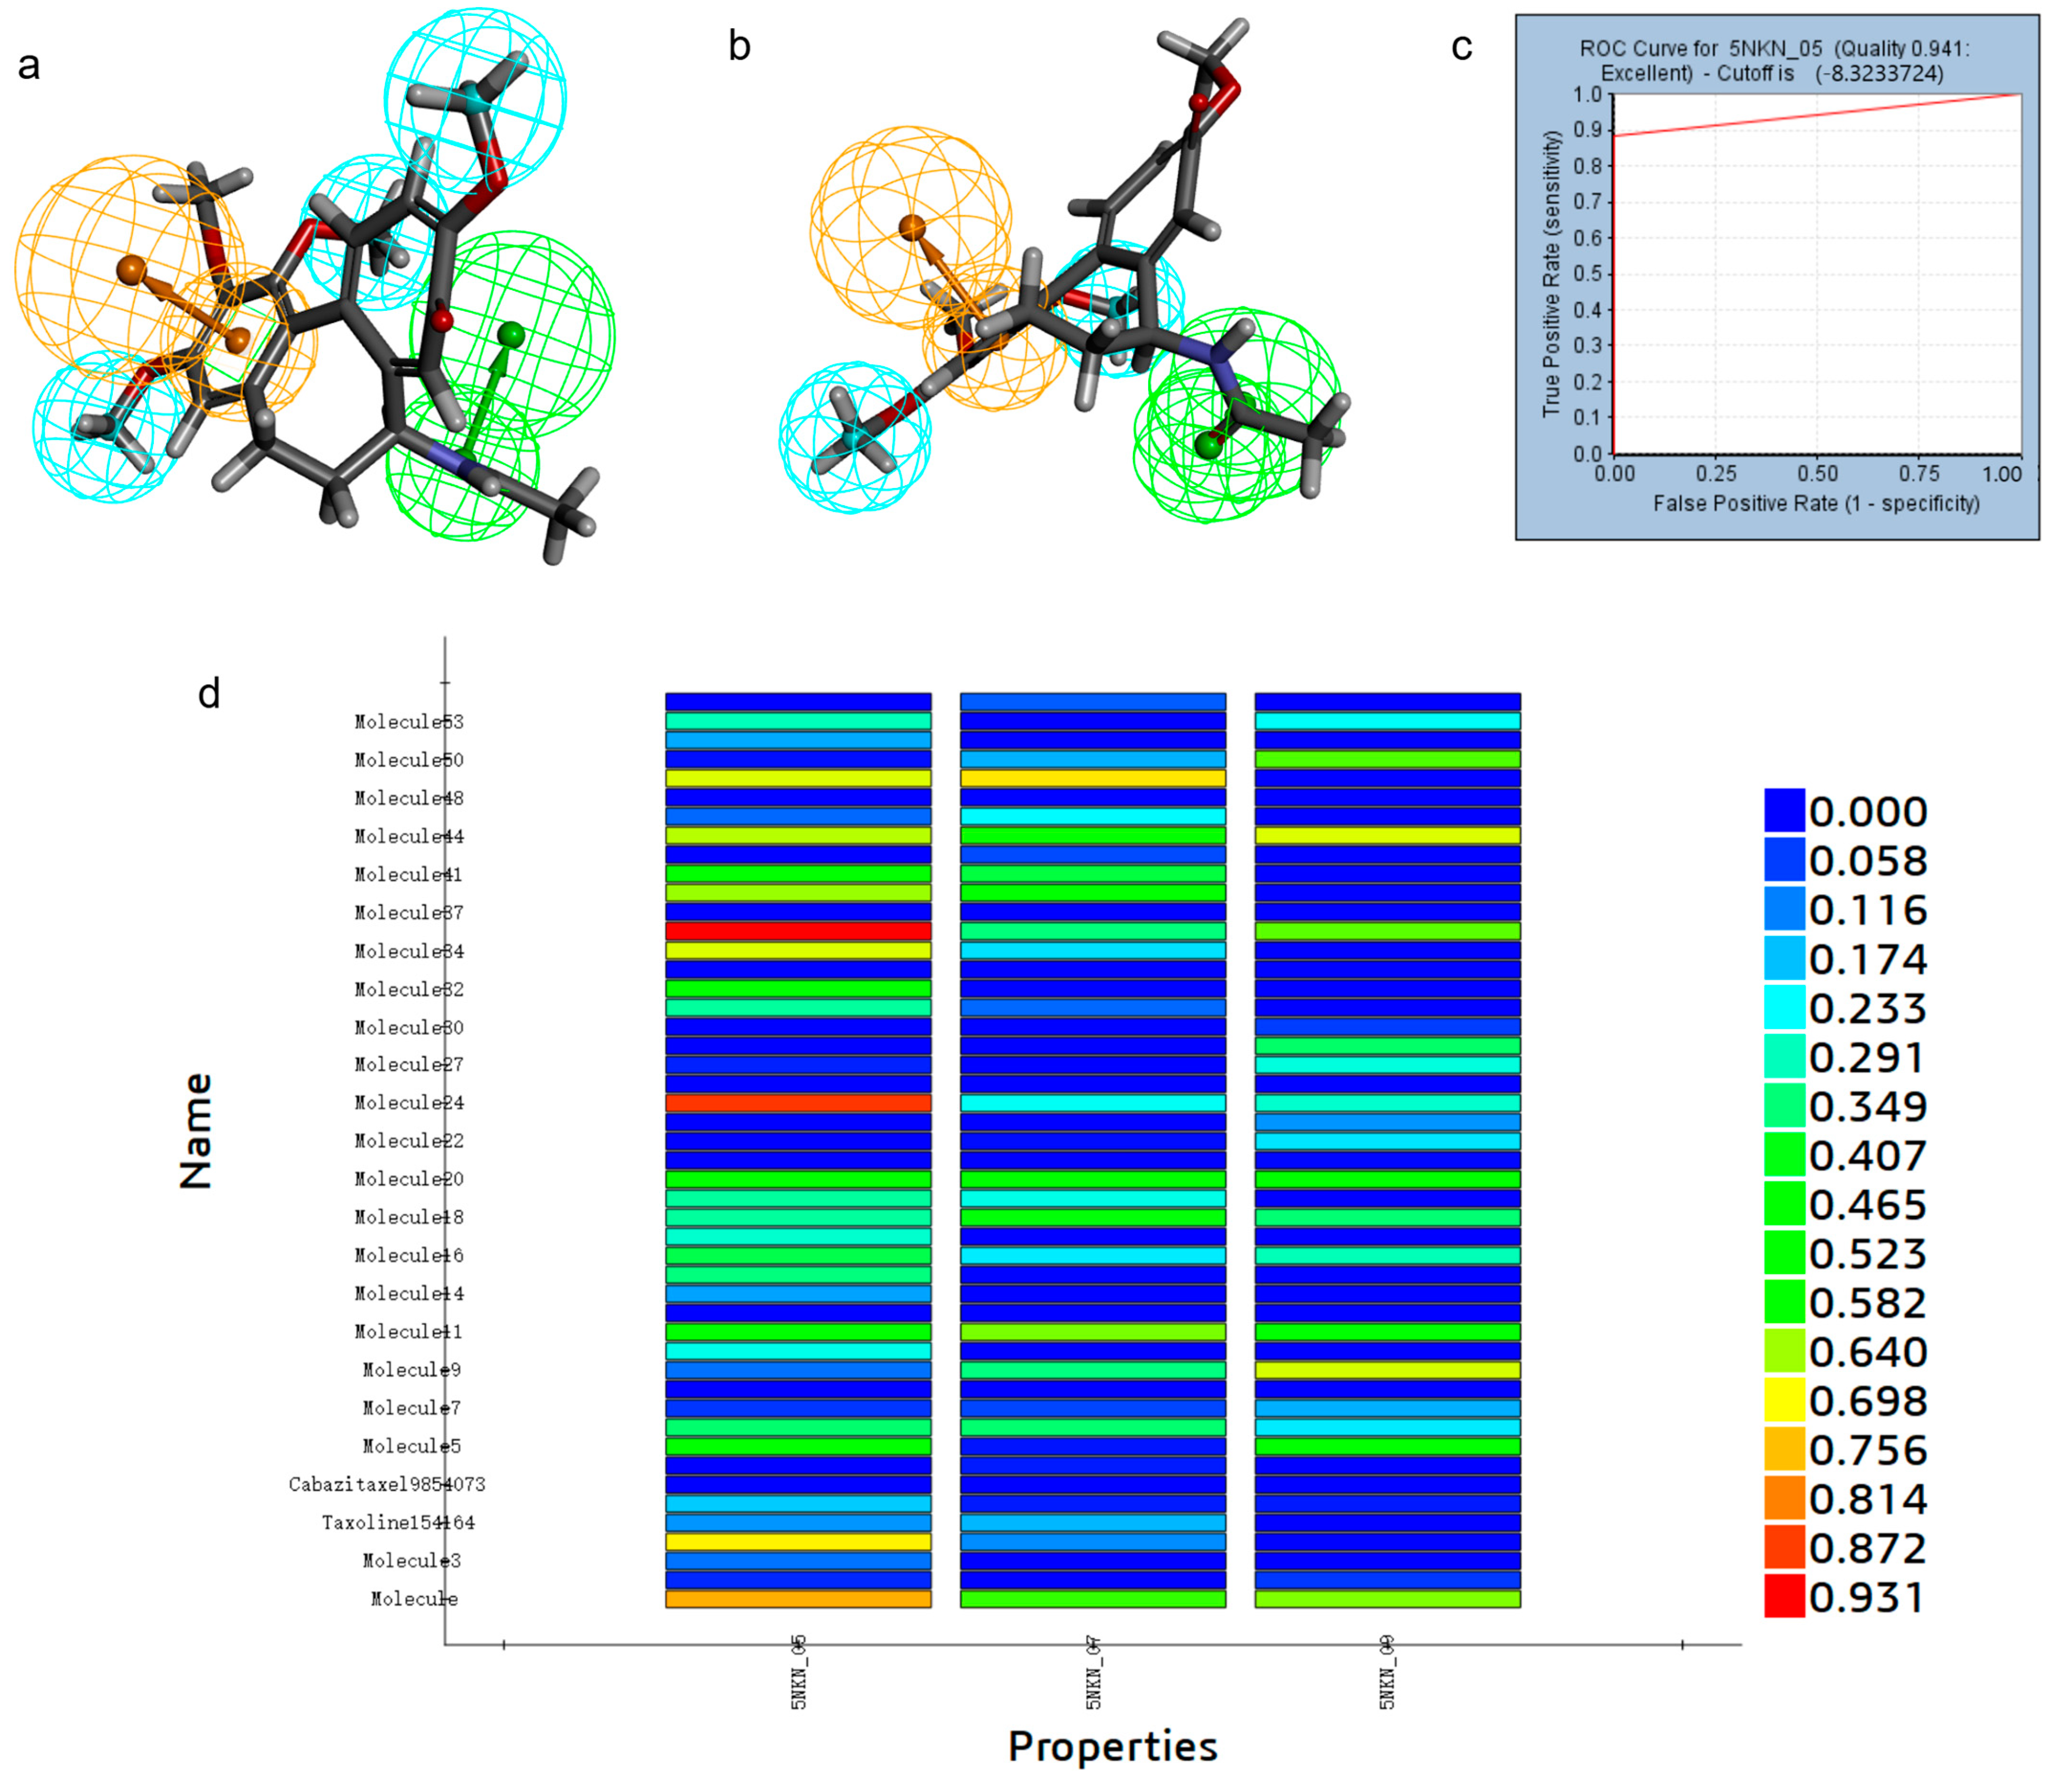
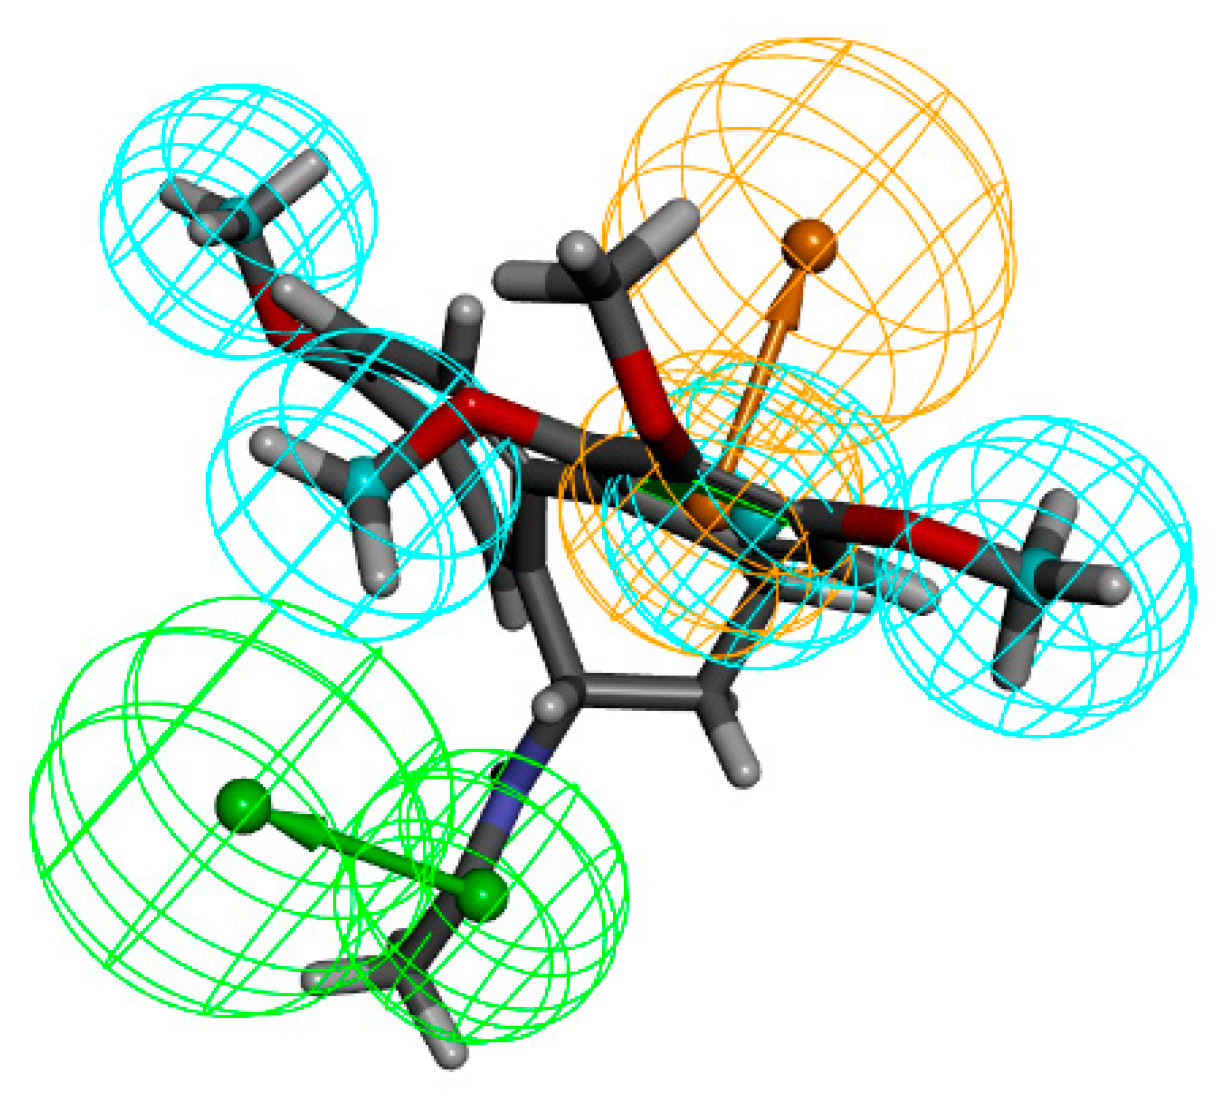
2.1. Establishment and Validation of Pharmacophore Modeling
2.2. Pharmacophore-Based Virtual Screening
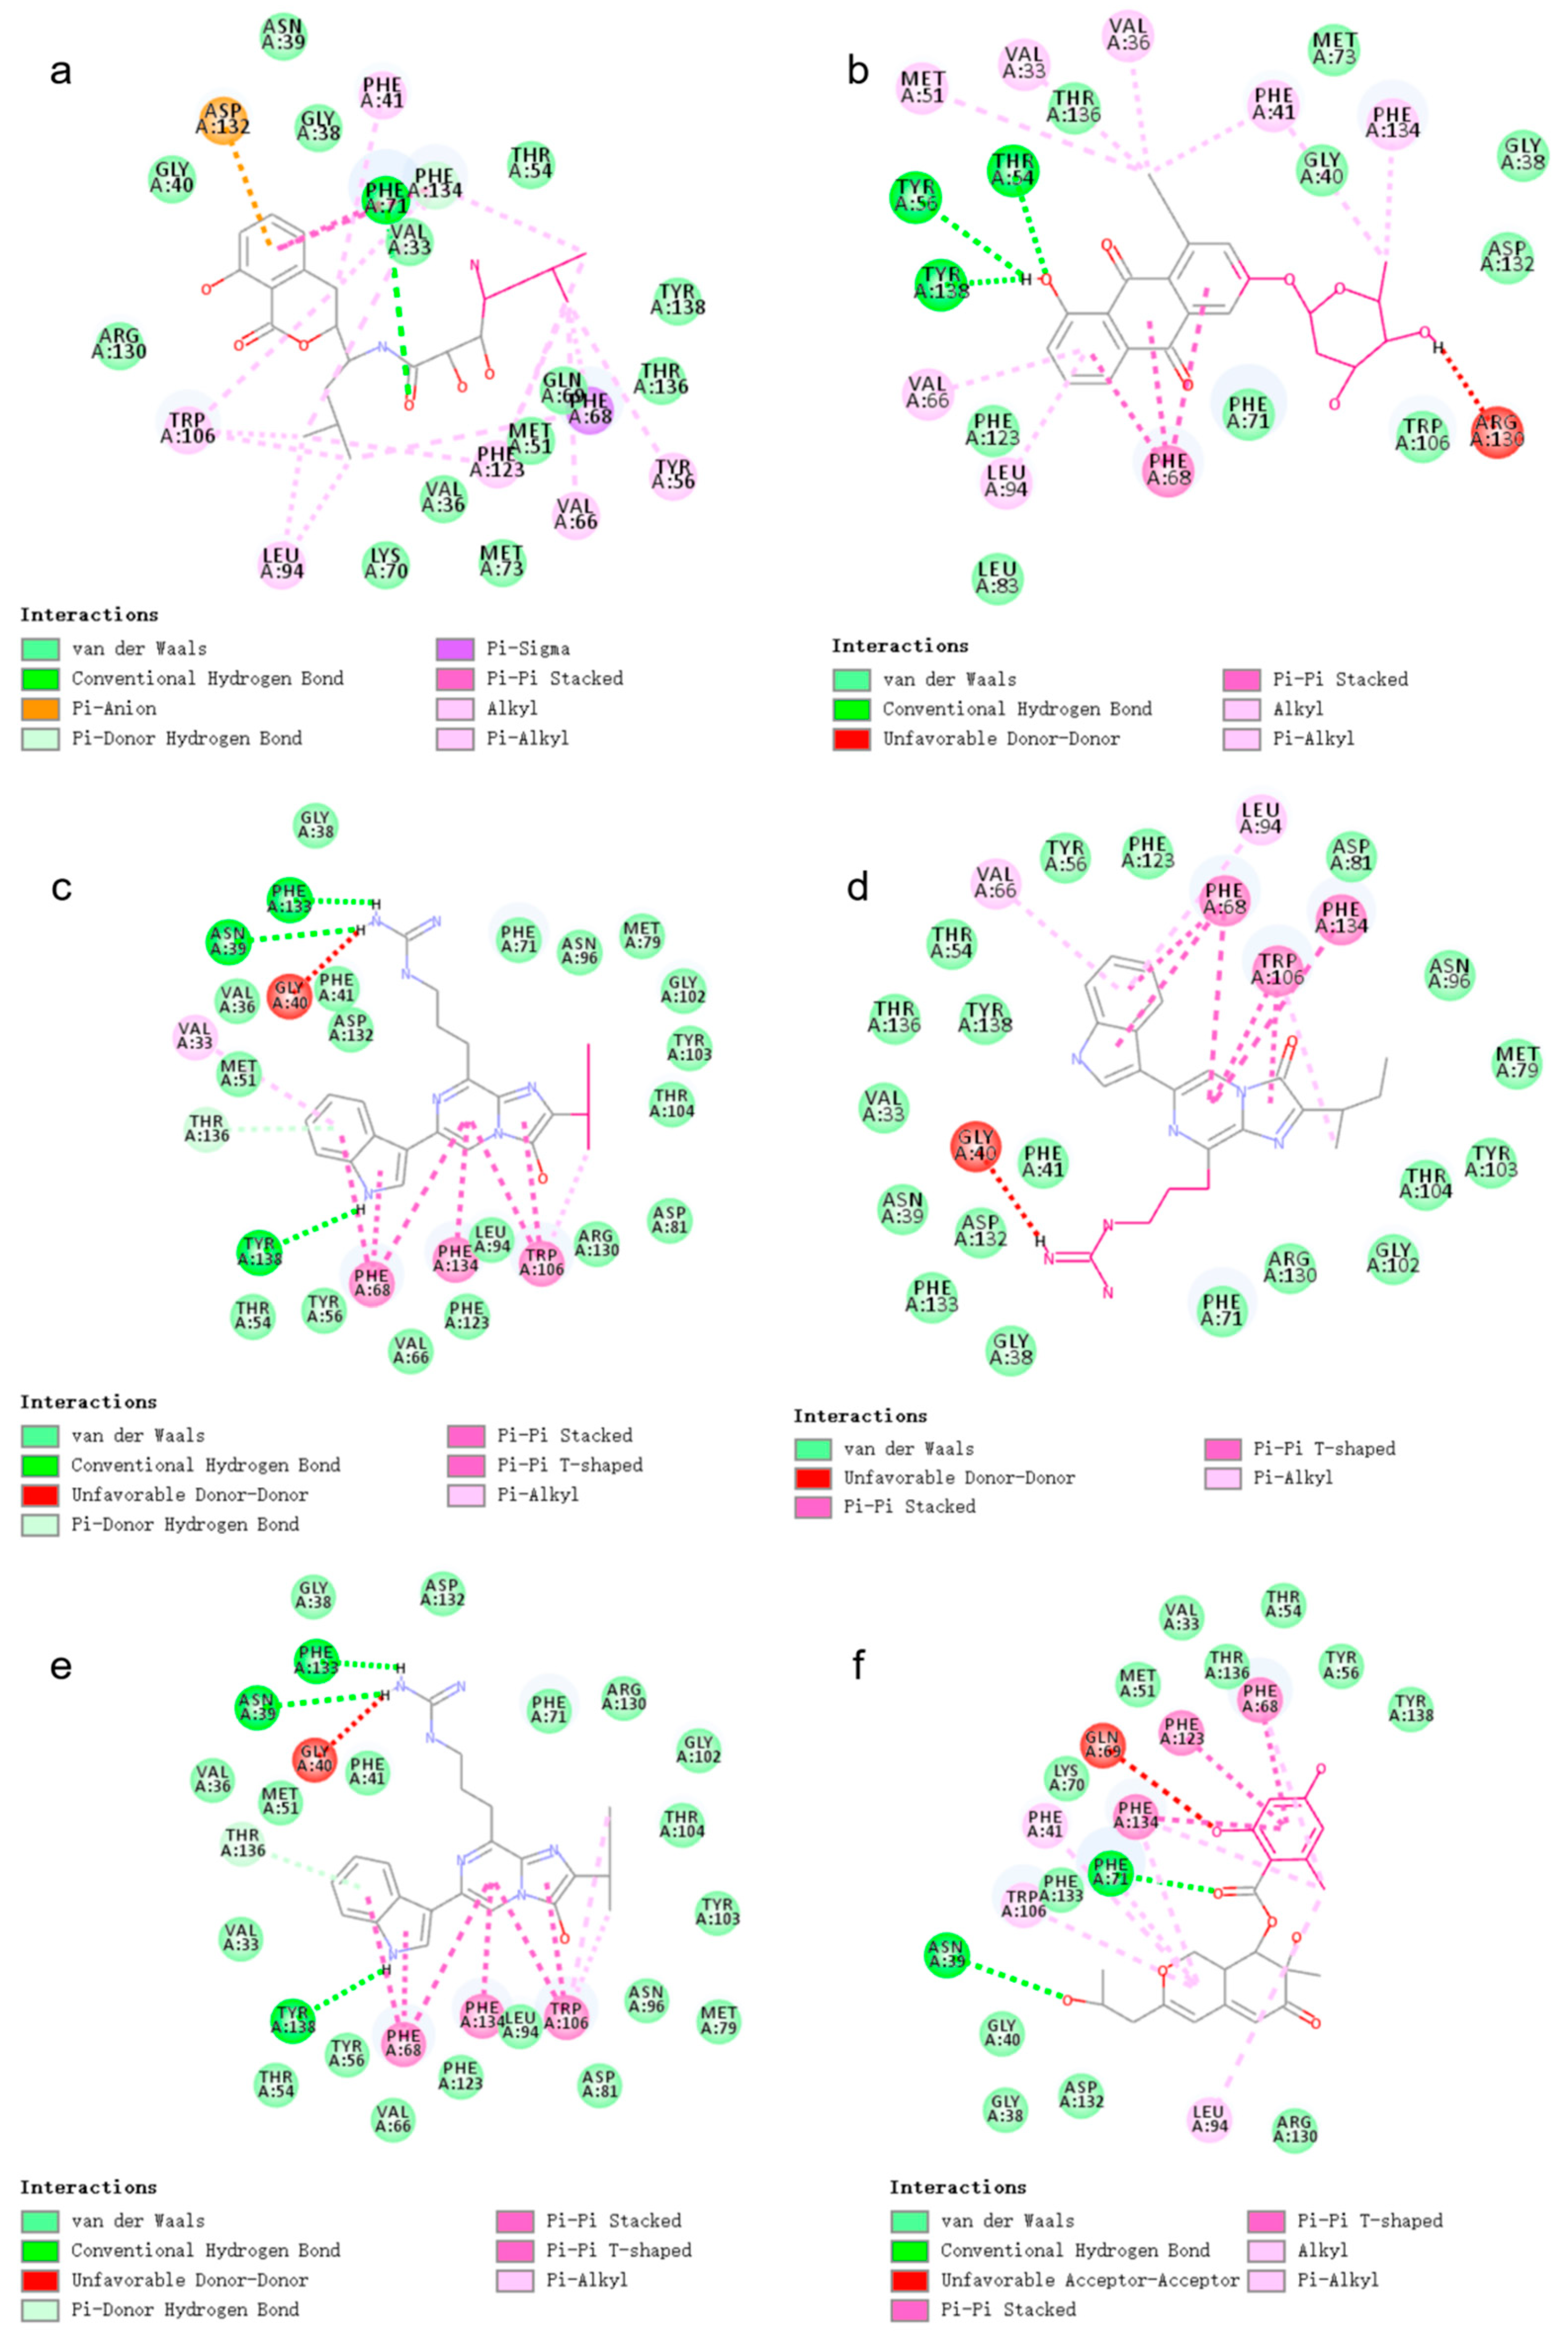
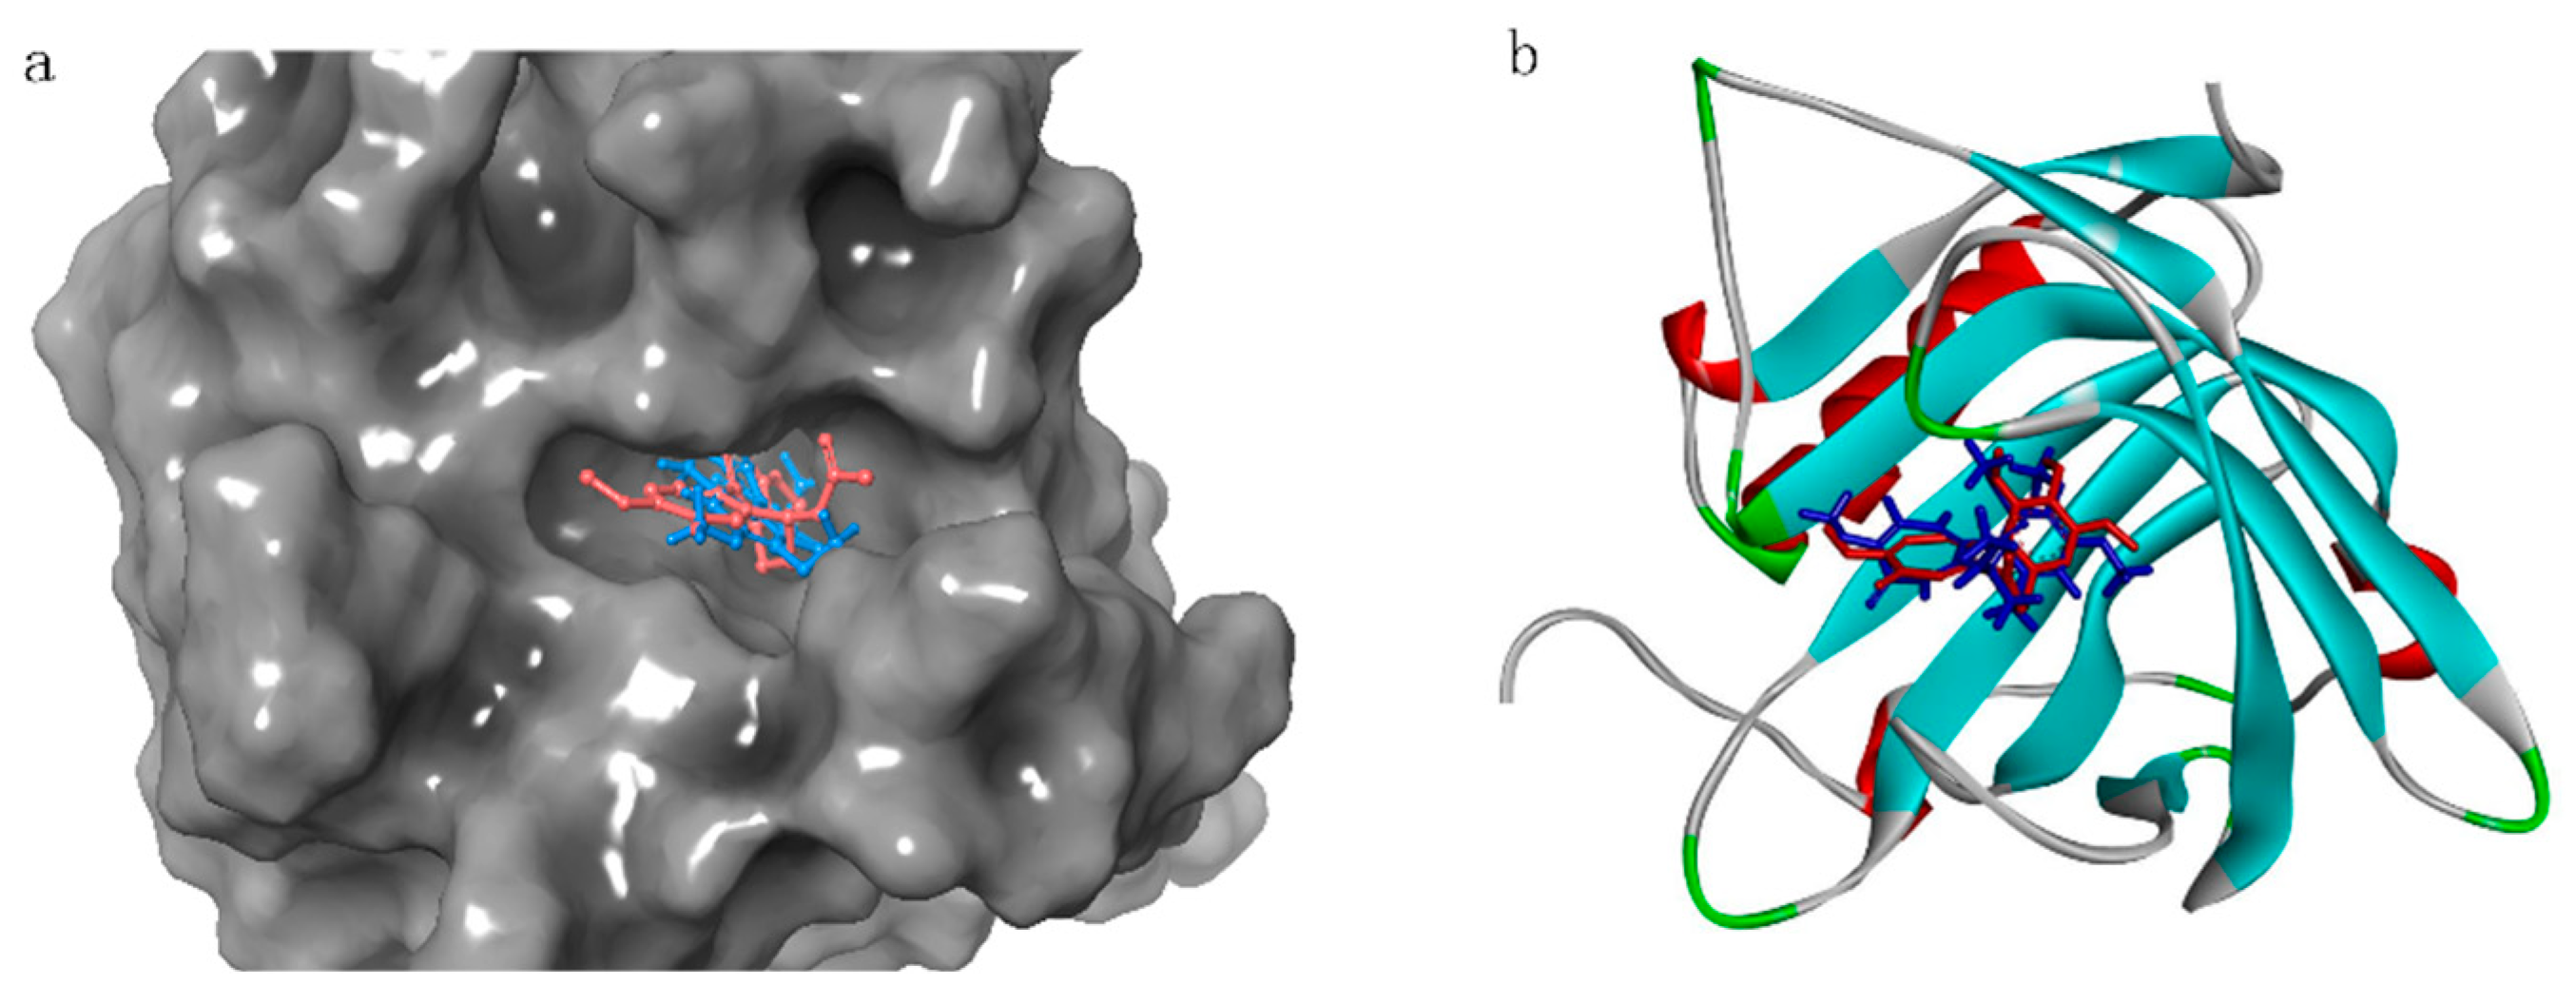
2.3. Docking
2.4. Fragment Optimization
2.5. Docking
2.6. Absorption, Distribution, Metabolism, Excretion, and Toxicity (ADMET) Analysis
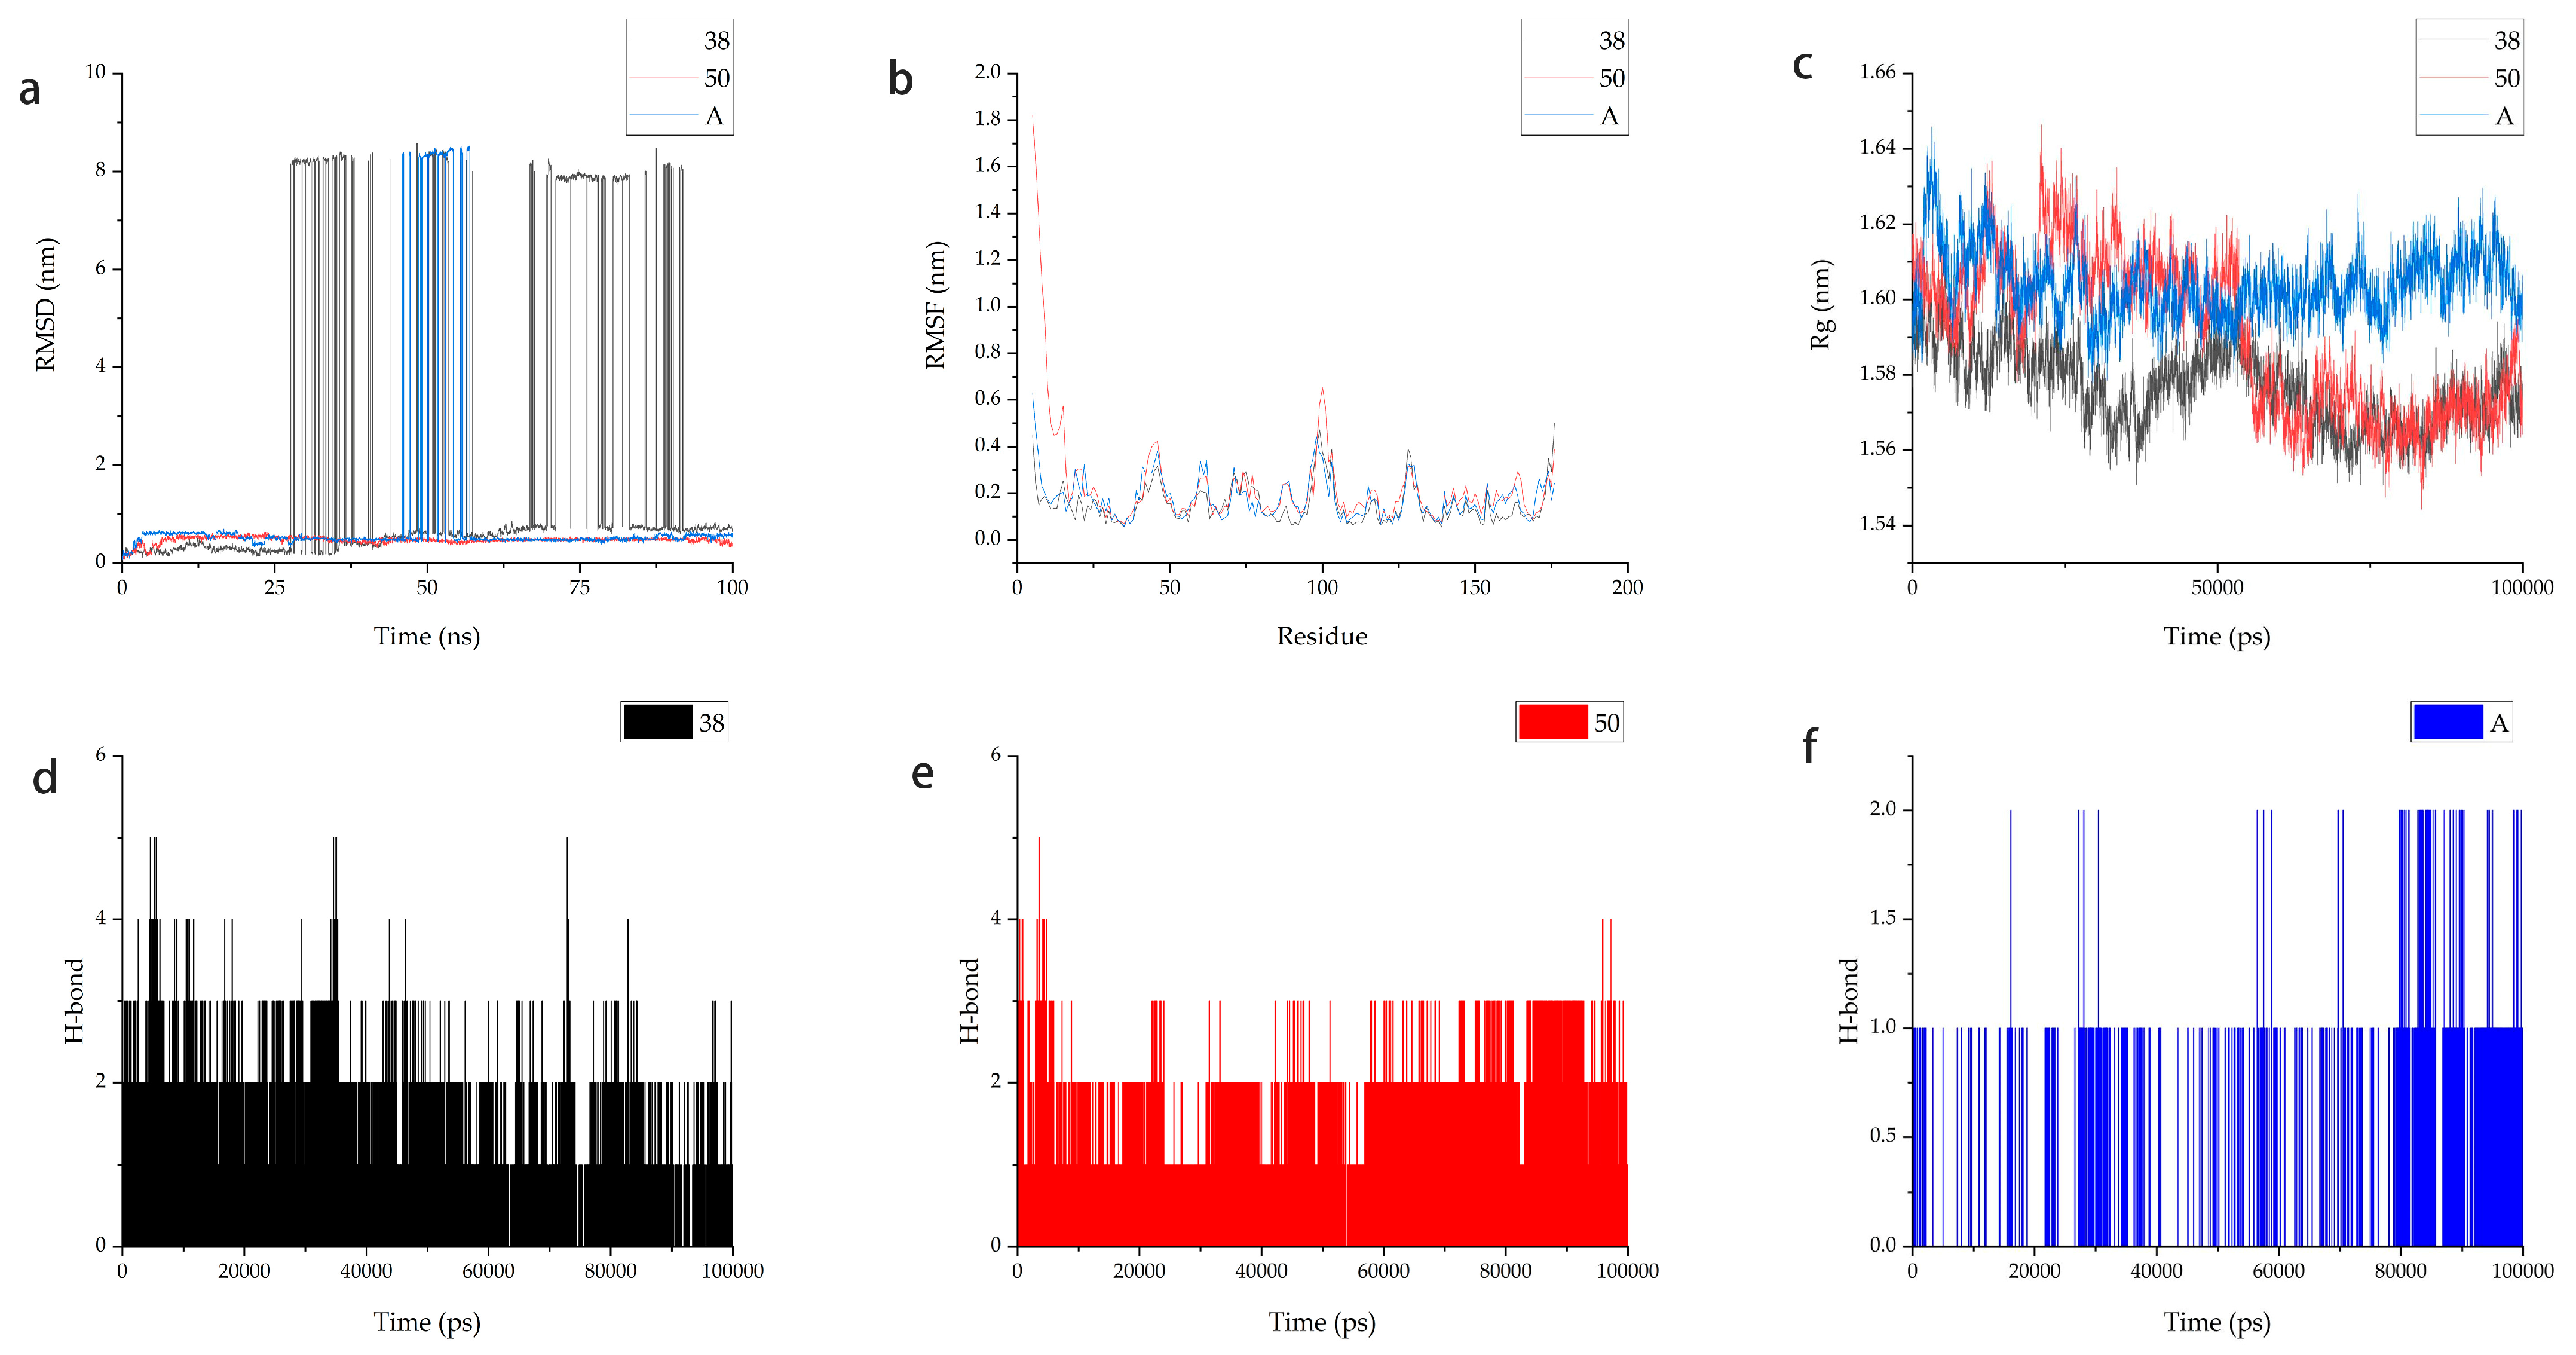
2.7. Molecular Dynamics
2.8. MM-PBSA
3. Discussion
4. Materials and Methods
4.1. Protein Preparation
4.2. Small Molecule Preparation
4.3. Pharmacophore Models
4.3.1. Establishment and Validation of Pharmacophore Models
4.3.2. Virtual Screening Based on Pharmacophores
4.4. Molecular Docking
4.4.1. Molecular Docking Using Maestro
4.4.2. Molecular Docking Using Discovery Studio
4.5. Fragment Optimization
4.6. ADME
4.7. Molecular Dynamics
4.8. MM-PBSA
5. Conclusions
Author Contributions
Funding
Institutional Review Board Statement
Data Availability Statement
Acknowledgments
Conflicts of Interest
References
- Santiago-Sánchez, G.S.; Pita-Grisanti, V.; Quiñones-Díaz, B.; Gumpper, K.; Cruz-Monserrate, Z.; Vivas-Mejía, P.E. Biological functions and therapeutic potential of lipocalin 2 in cancer. Int. J. Mol. Sci. 2020, 21, 4365. [Google Scholar] [CrossRef] [PubMed]
- Ekemen, S.; Bilir, E.; Soultan, H.; Zafar, S.; Demir, F.; Tabandeh, B.; Toprak, S.; Yapicier, O.; Coban, C. The Programmed Cell Death Ligand 1 and Lipocalin 2 Expressions in Primary Breast Cancer and Their Associations with Molecular Subtypes and Prognostic Factors. Breast Cancer Targets Ther. 2024, 16, 1–13. [Google Scholar]
- Flower, D.R.; North, A.C.; Sansom, C.E.; Enzymology, M. The lipocalin protein family: Structural and sequence overview. Biochim. Et Biophys. Acta (BBA)-Protein Struct. Mol. Enzymol. 2000, 1482, 9–24. [Google Scholar] [CrossRef]
- Hu, C.; Yang, K.; Li, M.; Huang, W.; Zhang, F.; Wang, H. Lipocalin 2: A potential therapeutic target for breast cancer metastasis. OncoTargets Ther. 2018, 11, 8099–8106. [Google Scholar] [CrossRef] [PubMed]
- Yang, J.; Bielenberg, D.R.; Rodig, S.J.; Doiron, R.; Clifton, M.C.; Kung, A.L.; Strong, R.K.; Zurakowski, D.; Moses, M.A. Lipocalin 2 promotes breast cancer progression. Proc. Natl. Acad. Sci. USA 2009, 106, 3913–3918. [Google Scholar] [CrossRef] [PubMed]
- Chiang, K.-C.; Yeh, T.-S.; Wu, R.-C.; Pang, J.-H.S.; Cheng, C.-T.; Wang, S.-Y.; Juang, H.-H.; Yeh, C.-N. Lipocalin 2 (LCN2) is a promising target for cholangiocarcinoma treatment and bile LCN2 level is a potential cholangiocarcinoma diagnostic marker. Sci. Rep. 2016, 6, 36138. [Google Scholar] [CrossRef]
- Deng, L.; He, S.; Li, Y.; Ding, R.; Li, X.; Guo, N.; Luo, L. Identification of lipocalin 2 as a potential ferroptosis-related gene in ulcerative colitis. Inflamm. Bowel Dis. 2023, 29, 1446–1457. [Google Scholar] [PubMed]
- Lee, E.-H.; Lee, J.-H.; Kim, D.-Y.; Lee, Y.-S.; Jo, Y.; Dao, T.; Kim, K.E.; Song, D.-K.; Seo, J.H.; Seo, Y.-K.; et al. Loss of SREBP-1c ameliorates iron-induced liver fibrosis by decreasing lipocalin-2. Exp. Mol. Med. 2024, 56, 1001–1012. [Google Scholar] [CrossRef] [PubMed]
- Yan, L.; Yang, F.; Wang, Y.; Shi, L.; Wang, M.; Yang, D.; Wang, W.; Jia, Y.; So, K.-F.; Zhang, L. Stress increases hepatic release of lipocalin 2 which contributes to anxiety-like behavior in mice. Nat. Commun. 2024, 15, 3034. [Google Scholar] [CrossRef]
- Deng, Y.; Lu, L.; Zhu, D.; Zhang, H.; Fu, Y.; Tan, Y.; Tan, X.; Guo, M.; Zhang, Y.; Yang, H.; et al. MafG/MYH9-LCN2 axis promotes liver fibrosis through inhibiting ferroptosis of hepatic stellate cells. Cell Death Differ. 2024, 31, 1127–1139. [Google Scholar] [CrossRef]
- Zhan, J.; Chen, J.; Deng, L.; Lu, Y.; Luo, L. Exploring the ferroptosis-related gene lipocalin 2 as a potential biomarker for sepsis-induced acute respiratory distress syndrome based on machine learning. Biochim. Et Biophys. Acta (BBA)-Mol. Basis Dis. 2024, 1870, 167101. [Google Scholar] [CrossRef]
- Zhou, Z.; Zhang, P.; Ya, D.; Liu, J.; Xu, Y.; Zhang, Y.; Tang, W.; Zhou, D.; Liao, R.; Liu, L.J.P. Withaferin A protects against epilepsy by promoting LCN2-mediated astrocyte polarization to stopping neuronal ferroptosis. Phytomedicine 2024, 132, 155892. [Google Scholar] [CrossRef] [PubMed]
- Liu, M.; Qi, F.; Wang, J.; Li, F.; Lv, Q.; Deng, R.; Liang, X.; Zhou, S.; Yu, P.; Xu, Y.J.P.; et al. Lcn2 secreted by macrophages through NLRP3 signaling pathway induced severe pneumonia. Protein Cell 2024, pwae045. [Google Scholar] [CrossRef] [PubMed]
- Luo, L.; Deng, L.; Chen, Y.; Ding, R.; Li, X. Identification of Lipocalin 2 as a Ferroptosis-Related Key Gene Associated with Hypoxic-Ischemic Brain Damage via STAT3/NF-κB Signaling Pathway. Antioxidants 2023, 12, 186. [Google Scholar] [CrossRef] [PubMed]
- Agrawal, S.; Chaugule, S.; More, S.; Rane, G.; Indap, M. Methanolic extract of Euchelus asper exhibits in-ovo anti-angiogenic and in vitro anti-proliferative activities. Biol. Res. 2017, 50, 41. [Google Scholar] [CrossRef] [PubMed]
- Gribble, G.W. Natural organohalogens: A new frontier for medicinal agents? J. Chem. Educ. 2004, 81, 1441. [Google Scholar] [CrossRef]
- Luo, L.; Wang, Q.; Liao, Y. The inhibitors of CDK4/6 from a library of marine compound database: A pharmacophore, ADMET, molecular docking and molecular dynamics study. Mar. Drugs 2022, 20, 319. [Google Scholar] [CrossRef]
- Luo, L.; Zhong, A.; Wang, Q.; Zheng, T. Structure-based pharmacophore modeling, virtual screening, molecular docking, ADMET, and molecular dynamics (MD) simulation of potential inhibitors of PD-L1 from the library of marine natural products. Mar. Drugs 2021, 20, 29. [Google Scholar] [CrossRef]
- Zheng, L.-H.; Wang, Y.-J.; Sheng, J.; Wang, F.; Zheng, Y.; Lin, X.-K.; Sun, M. Antitumor peptides from marine organisms. Mar. Drugs 2011, 9, 1840–1859. [Google Scholar] [CrossRef]
- Kaserer, T.; Beck, K.R.; Akram, M.; Odermatt, A.; Schuster, D. Pharmacophore models and pharmacophore-based virtual screening: Concepts and applications exemplified on hydroxysteroid dehydrogenases. Molecules 2015, 20, 22799–22832. [Google Scholar] [CrossRef] [PubMed]
- Daina, A.; Michielin, O.; Zoete, V. SwissADME: A free web tool to evaluate pharmacokinetics, drug-likeness and medicinal chemistry friendliness of small molecules. Sci. Rep. 2017, 7, 42717. [Google Scholar] [CrossRef] [PubMed]
- Chandrasekaran, P.; Weiskirchen, S.; Weiskirchen, R. Structure, Functions, and Implications of Selected Lipocalins in Human Disease. Int. J. Mol. Sci. 2024, 25, 4290. [Google Scholar] [CrossRef] [PubMed]
- Selvaraj, J. Molecular docking analysis of docetaxel analogues as duel lipocalin 2 inhibitors. Bioinformation 2020, 16, 438–443. [Google Scholar] [CrossRef] [PubMed]
- Zhang, S. Computer-aided drug discovery and development. Comput.-Aided Drug Discov. Dev. 2011, 716, 23–38. [Google Scholar]
- Usha, T.; Shanmugarajan, D.; Goyal, A.K.; Kumar, C.S.; Middha, S.K. Recent updates on computer-aided drug discovery: Time for a paradigm shift. Curr. Top. Med. Chem. 2017, 17, 3296–3307. [Google Scholar] [CrossRef] [PubMed]
- Luo, L.; Tan, H.; Liao, Y. Dynamics. In silico analysis of marine natural product for protein arginine methyltransferase 5 (PRMT5) inhibitors based on pharmacophore and molecular docking. J. Biomol. Struct. Dyn. 2023, 41, 13180–13197. [Google Scholar] [CrossRef]
- Almeida, V.M.; Dias, Ê.R.; Souza, B.C.; Cruz, J.N.; Santos, C.B.; Leite, F.H.; Queiroz, R.F.; Branco, A. Dynamics. Methoxylated flavonols from Vellozia dasypus Seub ethyl acetate active myeloperoxidase extract: In vitro and in silico assays. Biomol. Struct. Dyn. 2022, 40, 7574–7583. [Google Scholar] [CrossRef] [PubMed]
- da Rocha Galucio, N.C.; de Araújo Moysés, D.; Pina, J.R.S.; Marinho, P.S.B.; Júnior, P.C.G.; Cruz, J.N.; Vale, V.V.; Khayat, A.S.; do Rosario Marinho, A.M. Antiproliferative, genotoxic activities and quantification of extracts and cucurbitacin B obtained from Luffa operculata (L.) Cogn. Arab. J. Chem. 2022, 15, 103589. [Google Scholar]
- Lima, A.D.M.; Siqueira, A.S.; Möller, M.L.S.; Souza, R.C.D.; Cruz, J.N.; Lima, A.R.J.; Silva, R.C.D.; Aguiar, D.C.F.; Junior, J.L.D.S.G.V.; Gonçalves, E.C. In silico improvement of the cyanobacterial lectin microvirin and mannose interaction. J. Biomol. Struct. Dyn. 2022, 40, 1064–1073. [Google Scholar] [CrossRef]
- Rego, C.M.; Francisco, A.F.; Boeno, C.N.; Paloschi, M.V.; Lopes, J.A.; Silva, M.D.; Santana, H.M.; Serrath, S.N.; Rodrigues, J.E.; Lemos, C.T. Inflammasome NLRP3 activation induced by Convulxin, a C-type lectin-like isolated from Crotalus durissus terrificus snake venom. Sci. Rep. 2022, 12, 4706. [Google Scholar] [CrossRef]
- Kp, A.D.; Janakirama, A.R.S.; Martin, A. SIRT1 activation by Taurine: In vitro evaluation, molecular docking and molecular dynamics simulation studies. J. Nutr. Biochem. 2022, 102, 108948. [Google Scholar] [CrossRef] [PubMed]
- Pinzi, L.; Rastelli, G. Molecular docking: Shifting paradigms in drug discovery. Int. J. Mol. Sci. 2019, 20, 4331. [Google Scholar] [CrossRef] [PubMed]
- Ferreira, L.L.; Andricopulo, A.D. ADMET modeling approaches in drug discovery. Drug Discov. Today 2019, 24, 1157–1165. [Google Scholar] [CrossRef] [PubMed]
- Mark, P.; Nilsson, L. Structure and dynamics of the TIP3P, SPC, and SPC/E water models at 298 K. J. Phys. Chem. A 2001, 105, 9954–9960. [Google Scholar] [CrossRef]
- Sousa da Silva, A.W.; Vranken, W.F. ACPYPE-Antechamber python parser interface. BMC Res. Notes 2012, 5, 367. [Google Scholar] [CrossRef]
- Triballeau, N.; Acher, F.; Brabet, I.; Pin, J.P.; Bertrand, H.O. Virtual screening workflow development guided by the “receiver operating characteristic” curve approach. Application to high-throughput docking on metabotropic glutamate receptor subtype 4. J. Med. Chem. 2005, 48, 2534–2547. [Google Scholar] [CrossRef]
- Van Der Spoel, D.; Lindahl, E.; Hess, B.; Groenhof, G.; Mark, A.E.; Berendsen, H.J. GROMACS: Fast, flexible, and free. J. Comput. Chem. 2005, 26, 1701–1718. [Google Scholar] [CrossRef] [PubMed]
- Lindorff-Larsen, K.; Piana, S.; Palmo, K.; Maragakis, P.; Klepeis, J.L.; Dror, R.O.; Shaw, D.E. Improved side-chain torsion potentials for the Amber ff99SB protein force field. Proteins 2010, 78, 1950–1958. [Google Scholar] [CrossRef]
- Hosseini, F.S.; Amanlou, M. Anti-HCV and anti-malaria agent, potential candidates to repurpose for coronavirus infection: Virtual screening, molecular docking, and molecular dynamics simulation study. Life Sci. 2020, 258, 118205. [Google Scholar] [CrossRef]
- Nava, M. Implementing Dimer Metadynamics Using Gromacs; Wiley Online Library: Hoboken, NJ, USA, 2018. [Google Scholar]
- Kumari, R.; Kumar, R.; Open Source Drug Discovery, C.; Lynn, A. g_mmpbsa—A GROMACS tool for high-throughput MM-PBSA calculations. J. Chem. Inf. Model. 2014, 54, 1951–1962. [Google Scholar] [CrossRef]


| Pharmacophore | Number of Features | Feature Set | Sensitivity | Specificity | Roc Curve |
|---|---|---|---|---|---|
| RL_1 | 5 | AHHHR | 0.47059 | 1 | 0.735 |
| RL_2 | 5 | AHHHH | 0.29412 | 1 | 0.647 |
| RL_3 | 4 | HHHR | 0.47059 | 1 | 0.735 |
| RL_4 | 4 | HHHH | 0.47059 | 1 | 0.735 |
| RL_5 | 4 | AHHR | 0.88235 | 1 | 0.941 |
| RL_6 | 4 | AHHH | 0.82353 | 1 | 0.912 |
| RL_7 | 4 | AHHR | 0.88235 | 1 | 0.941 |
| RL_8 | 4 | AHHH | 0.88235 | 1 | 0.941 |
| RL_9 | 4 | AHHR | 0.88235 | 1 | 0.941 |
| RL_10 | 4 | AHHH | 0.82353 | 1 | 0.912 |
| Compound | Schrödinger | Discovery Studio |
|---|---|---|
| 44879 | −13.595 | 151.966 |
| 46563 | −12.384 | 150.88 |
| 50616 | −12.881 | 158.605 |
| 50617 | −12.41 | 156.421 |
| 50618 | −12.943 | 156.766 |
| 69081 | −12.976 | 146.947 |
| positive control A | −10.994 | 108.36 |
| Compound | Structure | Discovery Studio | Schrödinger |
|---|---|---|---|
| 44879 |  | 151.966 | −13.595 |
| 44879_4 | 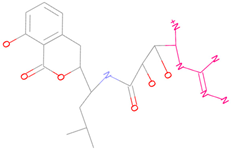 | 154.759 | −15.704 |
| Compound | Structure | Discovery Studio | Schrödinger |
|---|---|---|---|
| 69081 |  | 146.947 | −12.976 |
| 69081_38 | 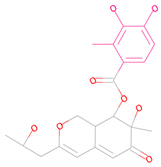 | 154.690 | −13.739 |
| 69081_50 | 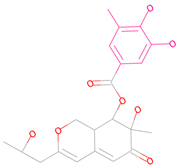 | 158.584 | −13.574 |
| Compound | 2D Structure | Molecular Weight (g/mol) | Log Po/w (iLOGP) | BBB Permeant | LogS (ESOL) | Solution | Number of Rotatable Bond | Number of Hydrogen Bond Acceptor | Number of Hydrogen Bond Donor |
|---|---|---|---|---|---|---|---|---|---|
| 44879_4 |  | 439.49 | 0.82 | NO | −1.92 | Low | 10 | 7 | 8 |
| 69081_38 |  | 404.41 | 2.16 | NO | −2.83 | High | 5 | 8 | 4 |
| 69081_50 |  | 404.41 | 2.20 | NO | −2.83 | High | 5 | 8 | 4 |
| Compound | Van Der Waals Energy | Electrostattic Energy | Polar Solvation Energy | SASA Energy | SAV Energy | WCA Energy | Binding Energy |
|---|---|---|---|---|---|---|---|
| 69081_50 | −154.108 ± 17.988 | −12.725 ± 12.112 | 76.153 ± 52.103 | −12.105 ± 9.125 | 0.000 ± 0.000 | 0.000 ± 0.000 | −102.785 ± 96.703 |
| A | −159.237 ± 91.219 | −23.169 ± 12.274 | 121.520 ± 56.482 | −15.625 ± 8.974 | 0.000 ± 0.000 | 0.000 ± 0.000 | −76.511 ± 68.704 |
| Protein | LibDockScore |
|---|---|
| LCN2 | 158.5340 |
| L-PGDS | 123.9620 |
| A1M | 96.1472 |
| RBP4 | 78.9032 |
Disclaimer/Publisher’s Note: The statements, opinions and data contained in all publications are solely those of the individual author(s) and contributor(s) and not of MDPI and/or the editor(s). MDPI and/or the editor(s) disclaim responsibility for any injury to people or property resulting from any ideas, methods, instructions or products referred to in the content. |
© 2025 by the authors. Licensee MDPI, Basel, Switzerland. This article is an open access article distributed under the terms and conditions of the Creative Commons Attribution (CC BY) license (https://creativecommons.org/licenses/by/4.0/).
Share and Cite
Zheng, N.; Li, X.; Zhou, N.; Luo, L. Identification of Novel LCN2 Inhibitors Based on Construction of Pharmacophore Models and Screening of Marine Compound Libraries by Fragment Design. Mar. Drugs 2025, 23, 24. https://doi.org/10.3390/md23010024
Zheng N, Li X, Zhou N, Luo L. Identification of Novel LCN2 Inhibitors Based on Construction of Pharmacophore Models and Screening of Marine Compound Libraries by Fragment Design. Marine Drugs. 2025; 23(1):24. https://doi.org/10.3390/md23010024
Chicago/Turabian StyleZheng, Ningying, Xuan Li, Nan Zhou, and Lianxiang Luo. 2025. "Identification of Novel LCN2 Inhibitors Based on Construction of Pharmacophore Models and Screening of Marine Compound Libraries by Fragment Design" Marine Drugs 23, no. 1: 24. https://doi.org/10.3390/md23010024
APA StyleZheng, N., Li, X., Zhou, N., & Luo, L. (2025). Identification of Novel LCN2 Inhibitors Based on Construction of Pharmacophore Models and Screening of Marine Compound Libraries by Fragment Design. Marine Drugs, 23(1), 24. https://doi.org/10.3390/md23010024