The average (±SD) chemical composition of cartilages from
S. canicula, expressed as percentage of dry weight, was 52.47 ± 0.10, 55.17 ± 0.74, and 45.19 ± 0.14 of protein for heads, fins and skeletons respectively; 37.66 ± 1.19, 38.70 ± 0.62 and 51.28 ± 0.24 of ash for heads, fins and skeletons respectively; 1.50 ± 0.19, 0.45 ± 0.08 and 0.04 ± 0.01 of fat for heads, fins and skeletons respectively. By difference, the percentage of total carbohydrates was: 8.37 (heads), 5.68 (fins) and 3.45 (skeletons). The content of moisture (as percentage of total weight) was 78.09 ± 0.17, 76.06 ± 1.57 and 70.17 ± 0.25 for heads, fins and skeletons respectively. Similar moisture and fat content, and lower ash and protein content, has been previously described for fin shark cartilage [
21].
2.1. Enzymatic Hydrolysis of Head Cartilages. Effect of pH and Temperature (T)
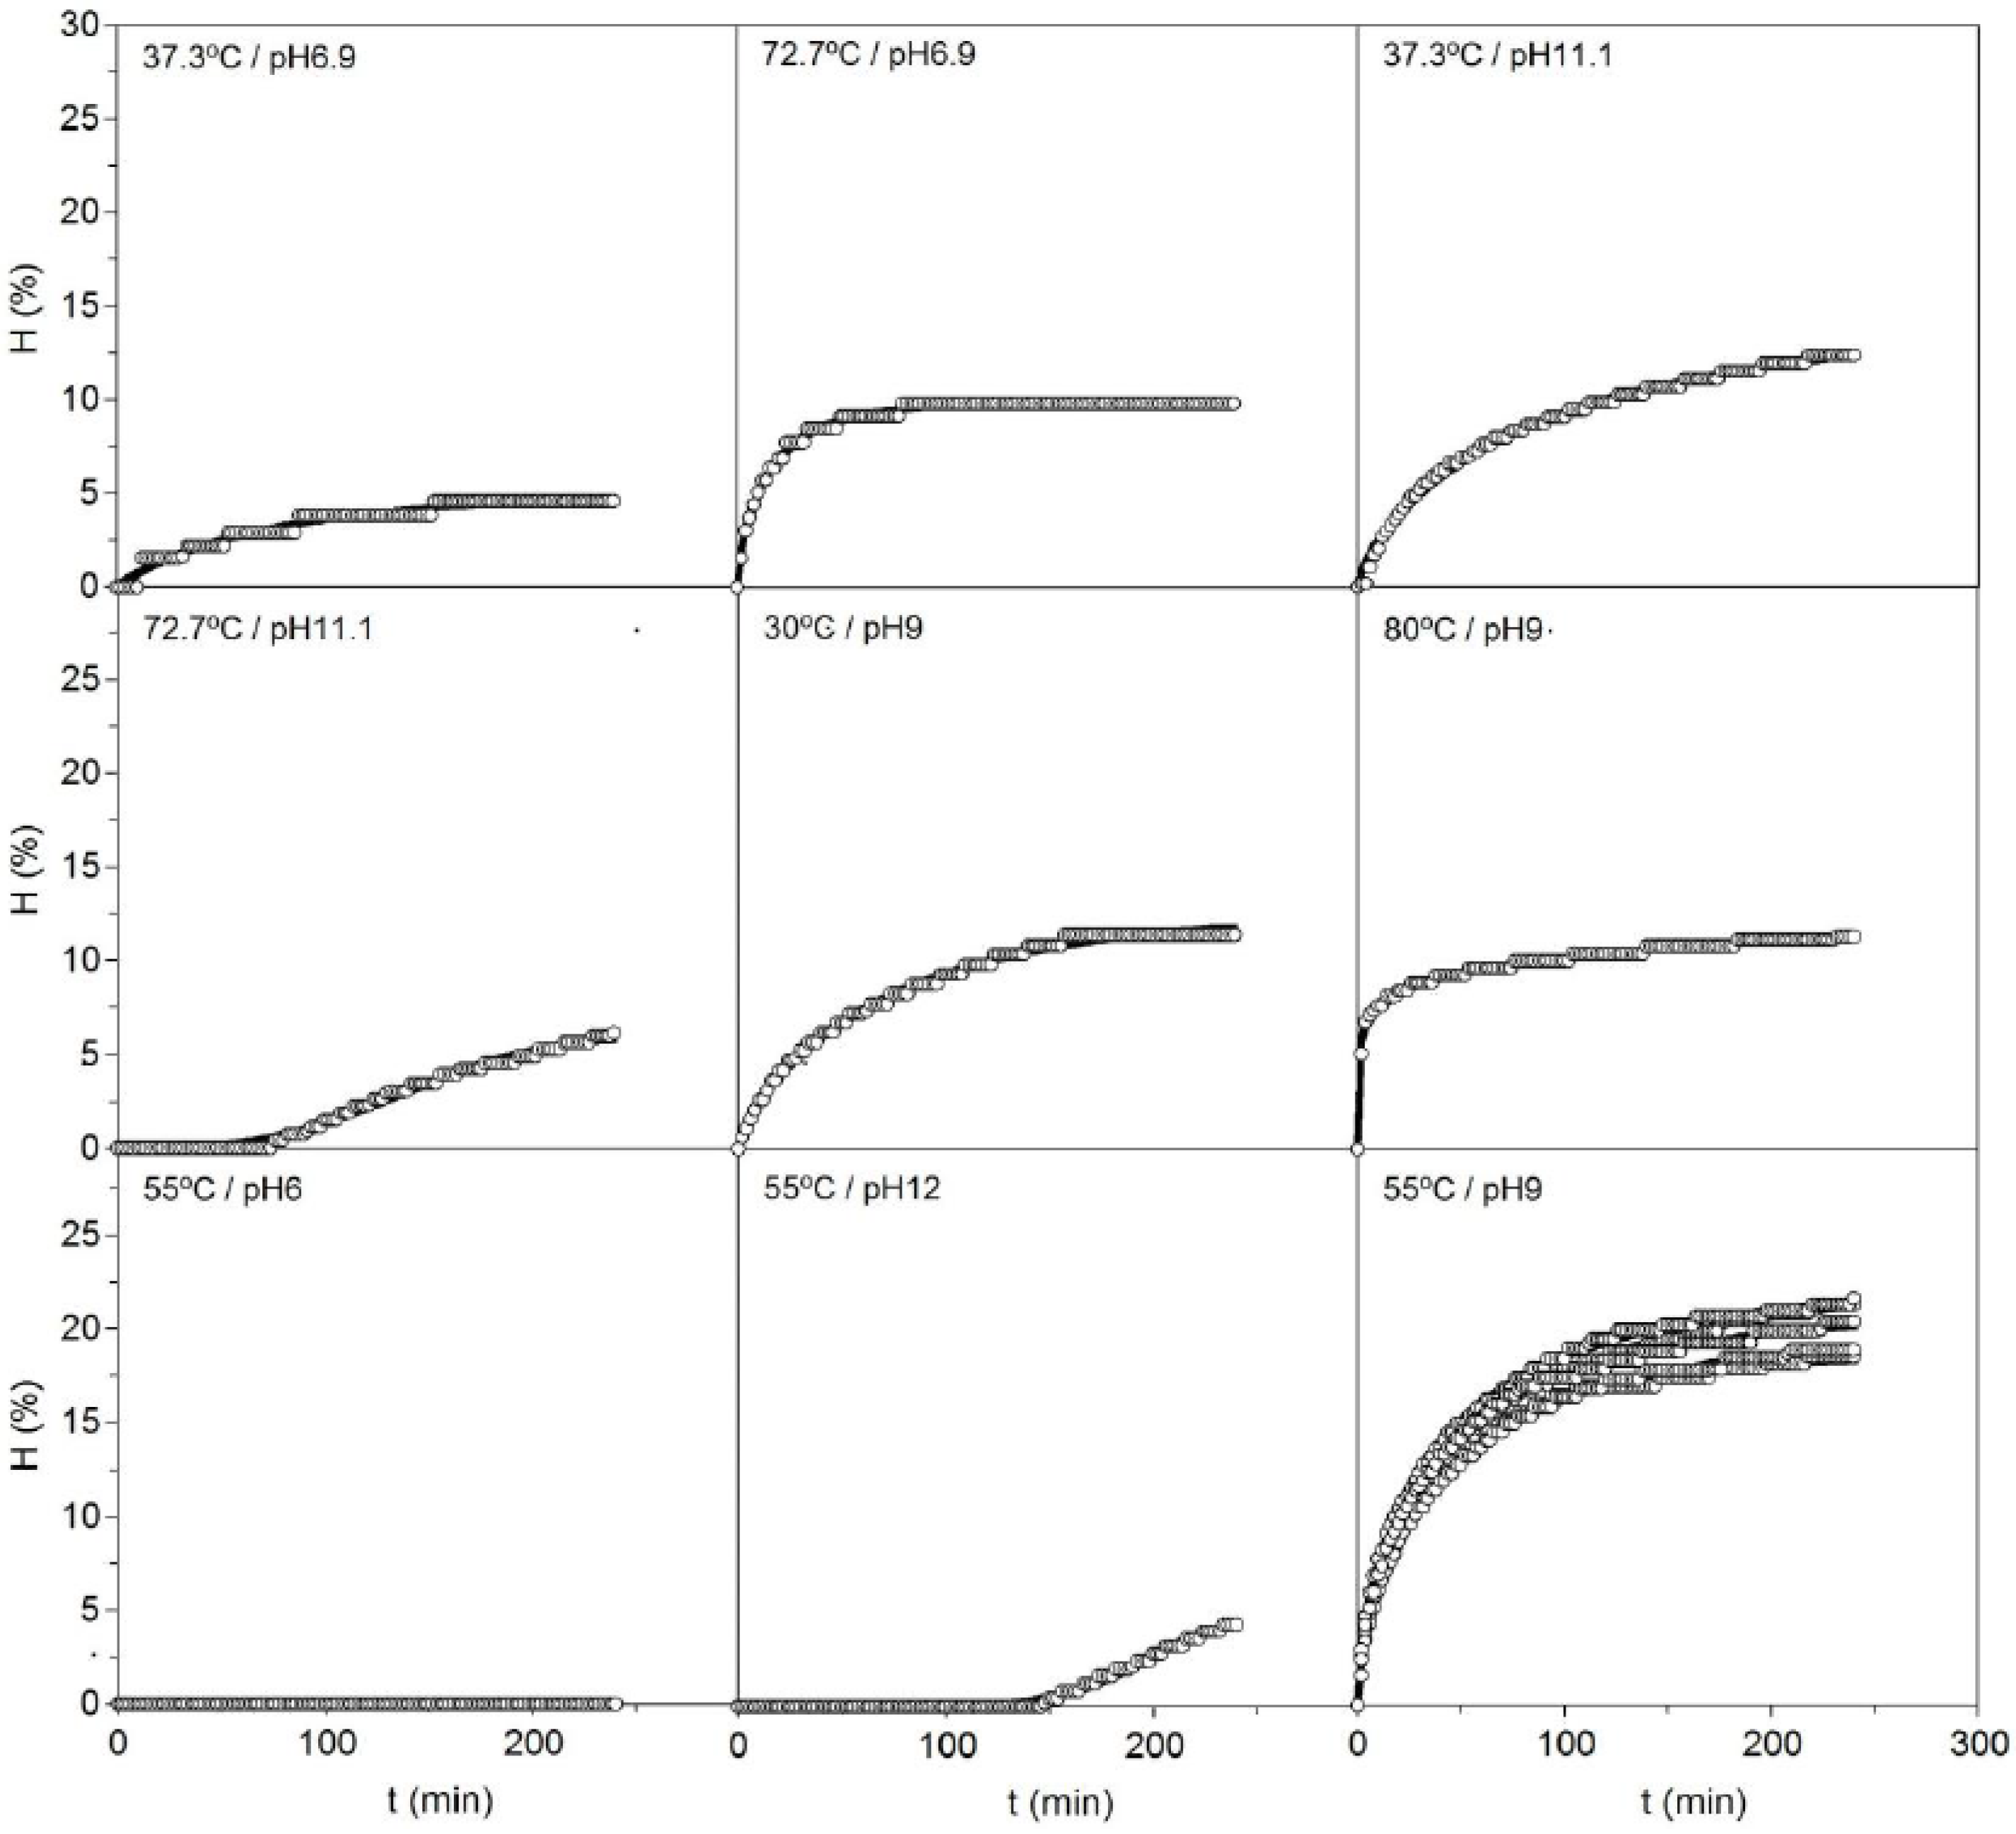
Alcalase hydrolysis of head cartilages from
S. canicula using different conditions of pH and temperature (
T) clearly showed non-linear patterns with various types of hyperbolic and sigmoid profiles (
Figure 1). In this context, the Weibull Equation (4) is a well-known mathematical tool for simulating sigmoid and hyperbolic profiles as well as mixture of both curves [
22]. It is also formulated with parameters of clear geometrical meaning and is routinely applied in the modelling of several systems and kinetics in toxicology, food technology and biotechnology [
23].
The present experimental data were perfectly described, in all cases, by the equation proposed, obtaining determination coefficients of not less than 0.982. The values of the kinetic parameters and the statistical analysis performed on the numerical fittings are summarized in
Table 1. All the parameters were statistically significant (α = 0.05) and autocorrelation was not observed in the residuals distribution (data not shown). For the case (pH 6 and
T = 55 °C), the values of parameters used as dependent variables (responses) in the subsequent surface response approach and calculation were established as zero.
Figure 1.
Kinetics of cartilage hydrolysis from
Scyliorhinus canicula heads using alcalase in each one of the experimental conditions defined in
Table 1. The experimental data (symbols) were fitted to the Weibull Equation (4) (continuous line).
Figure 1.
Kinetics of cartilage hydrolysis from
Scyliorhinus canicula heads using alcalase in each one of the experimental conditions defined in
Table 1. The experimental data (symbols) were fitted to the Weibull Equation (4) (continuous line).
Table 1.
Parametric estimations corresponding to the Weibull Equation (4) applied to the enzymatic hydrolysis kinetics at the experimental conditions studied. Independent variables are expressed in natural values in brackets. Numerical values of the parameters are shown with their confidence intervals. Determination coefficients (R2) and p-values from F-Fisher test are also summarized. Hm is the maximum degree of hydrolysis; β is a parameter related with the maximum slope of cartilage hydrolysis; τ is the time required to achieve the semi-maximum degree of hydrolysis and vm is the maximum hydrolysis rate at the τ-time.
| Experimental Conditions | Hm (%) | vm (%·min−1) | τ (min) | β | R2 | p-value |
|---|
| T:−1 (37.3 °C)/pH:−1 (6.9) | 5.05 ± 0.31 | 0.030 ± 0.004 | 51.51 ± 6.00 | 0.89 ± 0.10 | 0.982 | <0.001 |
| T:1 (72.7 °C)/pH:−1 (6.9) | 9.85 ± 0.04 | 0.262 ± 0.007 | 9.82 ± 0.34 | 0.75 ± 0.03 | 0.993 | <0.001 |
| T:−1 (37.3 °C)/pH:1 (11.1) | 14.04 ± 0.46 | 0.067 ± 0.005 | 54.65 ± 3.73 | 0.75 ± 0.03 | 0.996 | <0.001 |
| T:1 (72.7 °C)/pH:1 (11.1) | 5.93 ± 0.21 | 0.045 ± 0.002 | 139.0 ± 3.17 | 3.03 ± 0.19 | 0.991 | <0.001 |
| T:−1.41 (30.0 °C)/pH:0 (9.0) | 12.80 ± 0.33 | 0.079 ± 0.005 | 44.88 ± 2.32 | 0.80 ± 0.03 | 0.994 | <0.001 |
| T:1.41 (80.0 °C)/pH:0 (9.0) | 15.81 ± 2.03 | 0.082 ± 0.071 | 14.11 ± 12.42 | 0.21 ± 0.02 | 0.992 | <0.001 |
| T:0 (55.0 °C)/pH:−1.41 (6.0) | - | - | - | - | - | - |
| T:0 (55.0 °C)/pH:1.41 (12.0) | 4.34 ± 0.15 | 0.059 ± 0.003 | 190.23 ± 1.83 | 7.47 ± 0.44 | 0.993 | <0.001 |
| T:0 (55.0 °C)/pH:0 (9.0) | 18.83 ± 0.14 | 0.225 ± 0.006 | 19.65 ± 0.45 | 0.68 ± 0.02 | 0.997 | <0.001 |
| T:0 (55.0 °C)/pH:0 (9.0) | 23.44 ± 0.28 | 0.162 ± 0.006 | 30.10 ± 0.93 | 0.60 ± 0.01 | 0.999 | <0.001 |
| T:0 (55.0 °C)/pH:0 (9.0) | 19.86 ± 0.16 | 0.179 ± 0.004 | 26.70 ± 0.52 | 0.69 ± 0.01 | 0.998 | <0.001 |
| T:0 (55.0 °C)/pH:0 (9.0) | 22.67 ± 0.20 | 0.209 ± 0.006 | 23.80 ± 0.55 | 0.63 ± 0.01 | 0.998 | <0.001 |
| T:0 (55.0 °C)/pH:0 (9.0) | 21.06 ± 0.18 | 0.206 ± 0.006 | 23.21 ± 0.53 | 0.66 ± 0.02 | 0.998 | <0.001 |
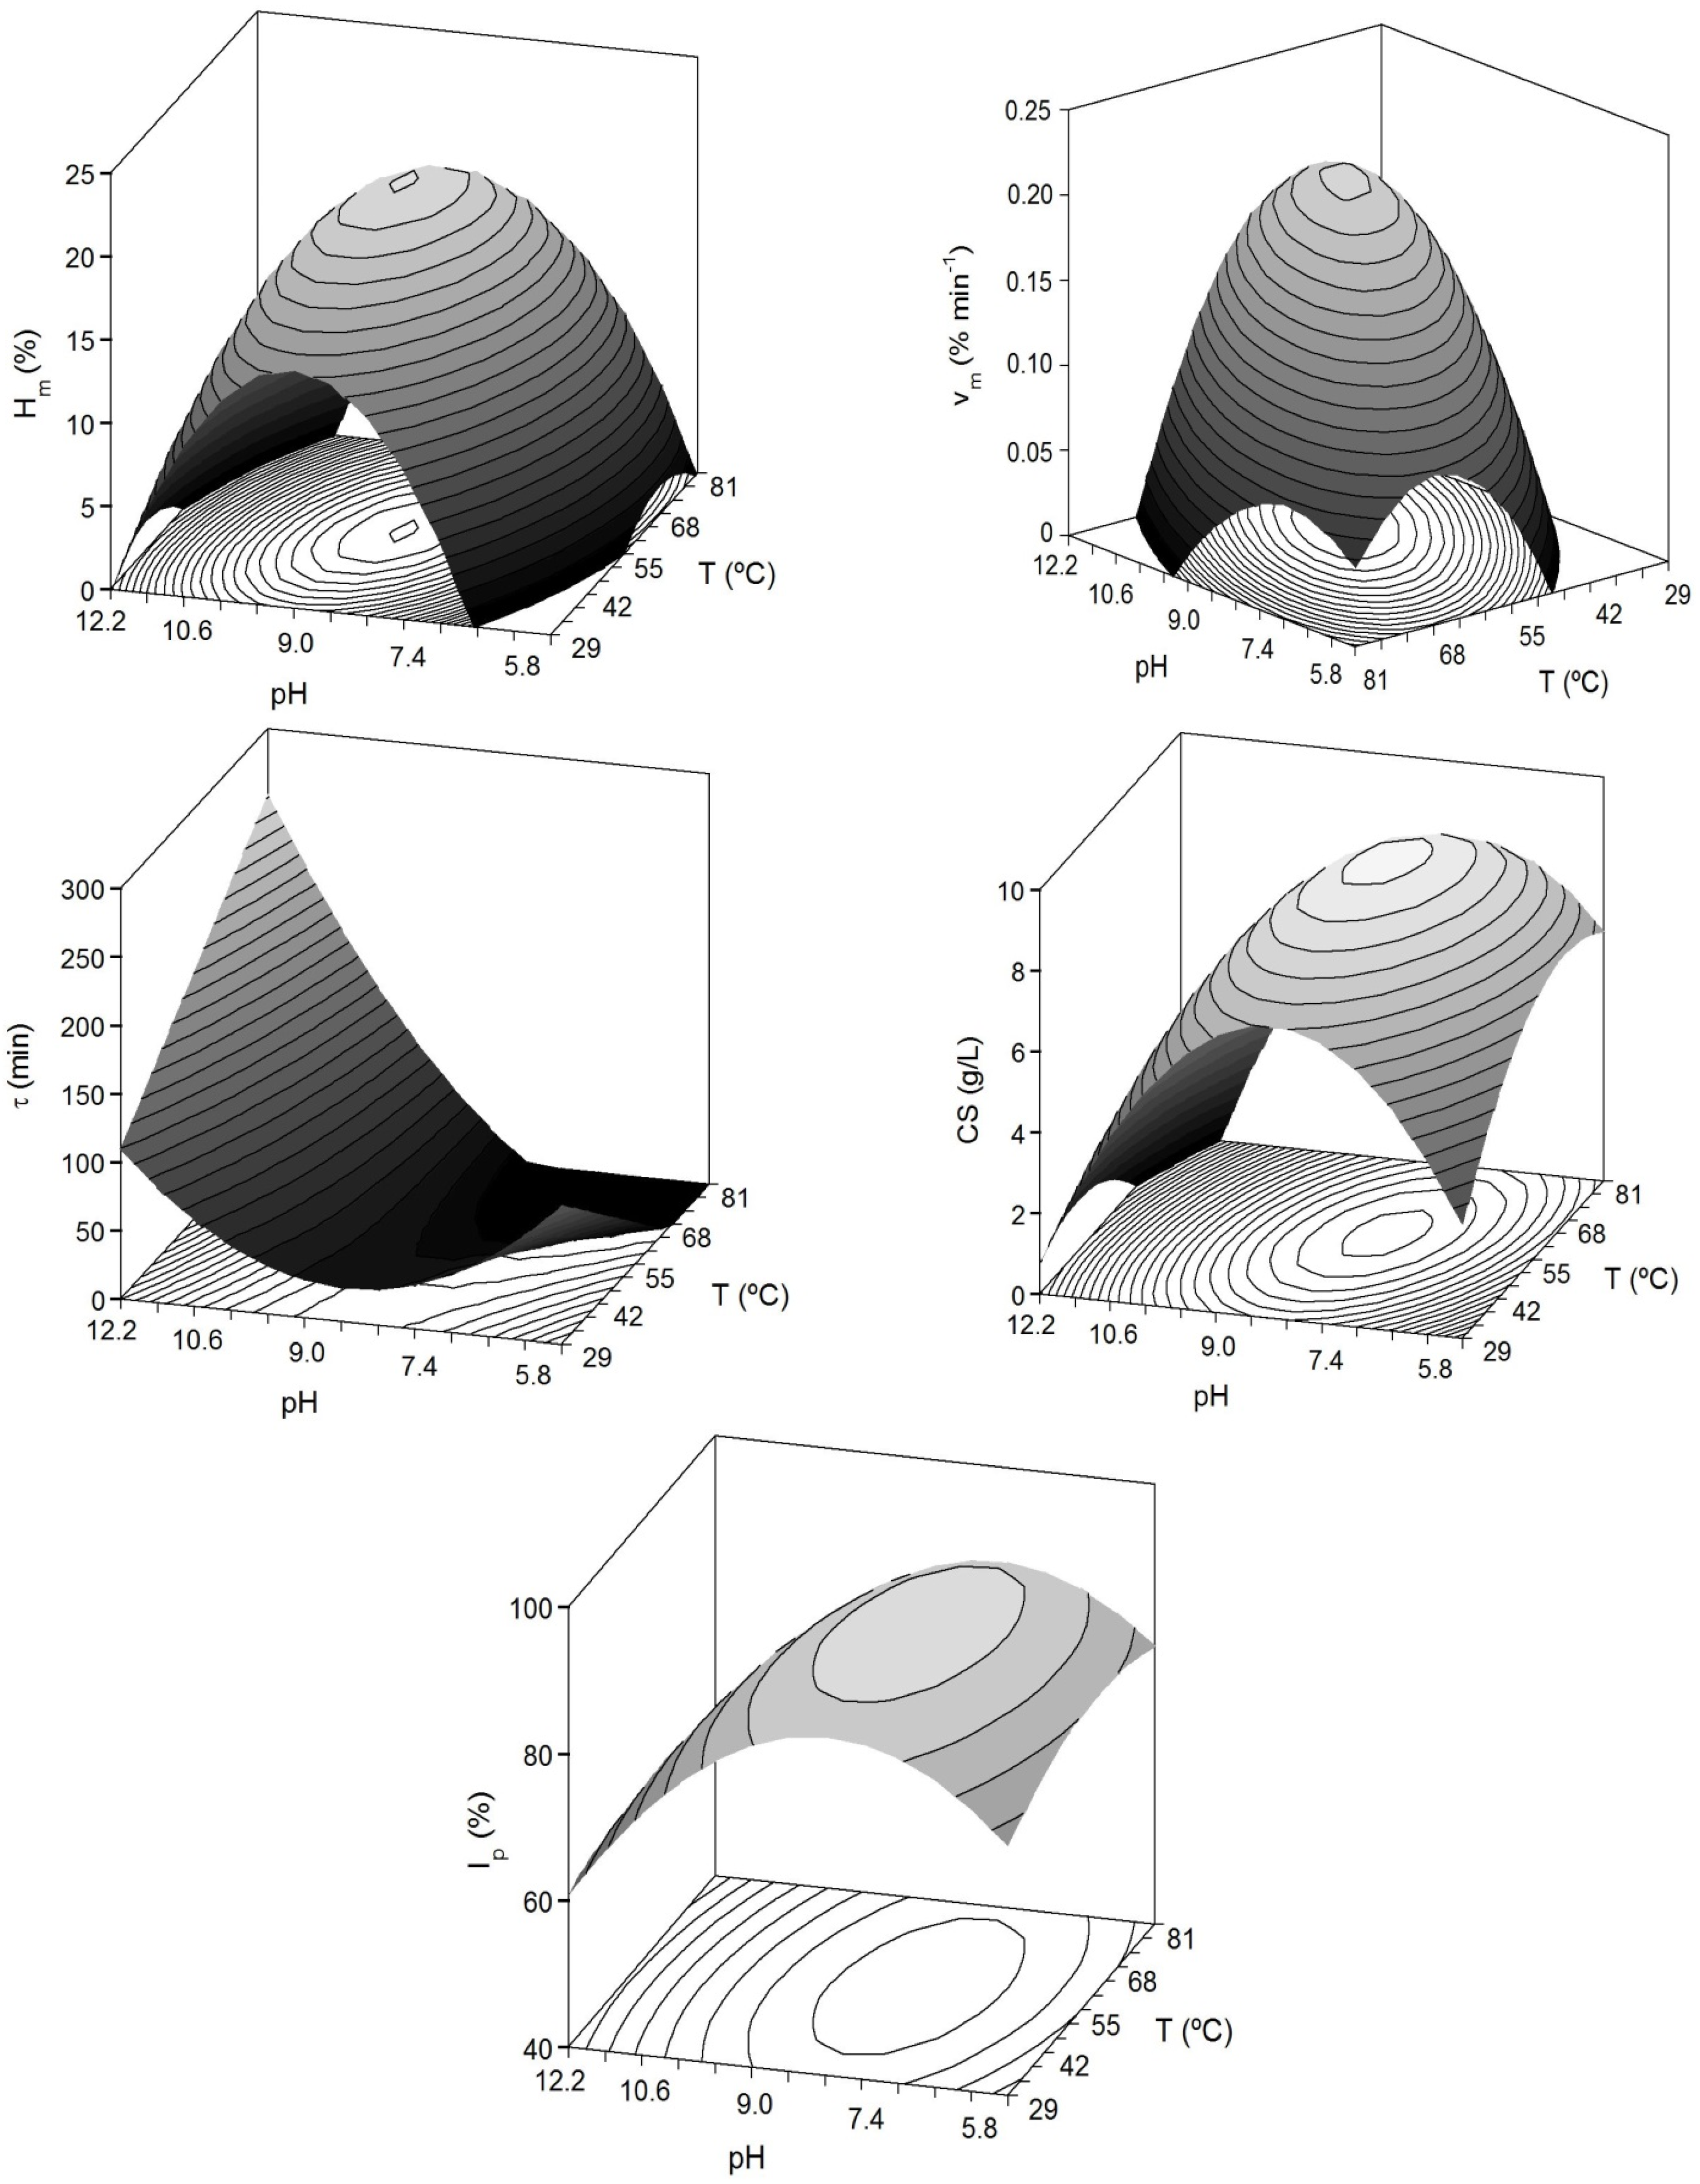
The combined effect of pH and
T on the kinetic parameters from Equation (4) was studied by means of surface response methodology (
Figure 2). Two more dependent variables were also assessed: (1) the concentration of CS was obtained from each sample of hydrolysed cartilage and processed in suboptimal conditions of 0.2 M NaOH and 1 v/v EtOH, according to Murado
et al. [
12]; (2) the index of CS purity in relation to total proteins (
Ip as %). The design and numerical responses of the 2-factor rotatable design are listed in
Table 2. For these two responses, the average and corresponding errors (calculated as the intervals of confidence in the five replicated conditions) were: 9.01 ± 0.36 g/L of CS and 89.61% ± 0.53% for
Ip.
Figure 2.
Predicted response surfaces by empirical equations summarized in
Table 3 corresponding to the combined effect of pH and
T on the different dependent variables evaluated for the study of head-cartilages proteolysis by alcalase.
Figure 2.
Predicted response surfaces by empirical equations summarized in
Table 3 corresponding to the combined effect of pH and
T on the different dependent variables evaluated for the study of head-cartilages proteolysis by alcalase.
Table 2.
Summary of the independent variables (T, pH) in the response surface design with the corresponding experimental (Ye) and predicted (Yp) results of alcalase head-cartilage hydrolysis, CS production and CS purity regarding total protein (Ip). Natural values of experimental conditions are in brackets.* Determination of CS and Ip was only done at the end of the hydrolysis time (4 h).
| Independent Variables | Hm (%) | vm (% min−1) | τ (min) | CS (g/L) * | Ip (%) * |
|---|
| X1: T | X2: pH | Ye | Yp | Ye | Yp | Ye | Yp | Ye | Yp | Ye | Yp |
|---|
| −1 (37.3) | −1 (6.9) | 5.05 | 5.21 | 0.030 | −0.018 | 51.5 | 41.7 | 7.09 | 6.86 | 85.12 | 84.64 |
| 1 (72.7) | −1 (6.9) | 9.85 | 11.67 | 0.282 | 0.178 | 9.8 | −21.3 | 9.21 | 8.35 | 89.43 | 86.33 |
| −1 (37.3) | 1 (11.1) | 14.04 | 11.67 | 0.067 | 0.119 | 54.7 | 79.1 | 3.85 | 4.74 | 76.48 | 74.85 |
| 1 (72.7) | 1 (11.1) | 5.93 | 5.21 | 0.045 | 0.041 | 139.0 | 142.1 | 3.00 | 3.25 | 77.42 | 73.17 |
| −1.41 (30) | 0 (9.0) | 12.80 | 14.58 | 0.079 | 0.065 | 44.9 | 24.7 | 7.45 | 7.40 | 85.25 | 86.01 |
| 1.41 (80) | 0 (9.0) | 15.81 | 14.58 | 0.082 | 0.148 | 14.1 | 24.7 | 7.38 | 7.40 | 82.02 | 86.01 |
| 0 (55) | −1.41 (6.0) | 0.00 | 2.45 | 0.00 | 0.055 | 0.00 | 24.9 | 6.00 | 6.78 | 80.12 | 81.69 |
| 0 (55) | 1.41 (12.0) | 4.34 | 2.45 | 0.059 | 0.055 | 190.2 | 166.5 | 2.50 | 1.69 | 62.32 | 65.51 |
| 0 (55) | 0 (9.0) | 18.83 | 21.17 | 0.225 | 0.196 | 19.7 | 24.7 | 9.02 | 9.01 | 89.77 | 89.60 |
| 0 (55) | 0 (9.0) | 23.44 | 21.17 | 0.162 | 0.196 | 30.1 | 24.7 | 9.00 | 9.01 | 89.64 | 89.60 |
| 0 (55) | 0 (9.0) | 19.86 | 21.17 | 0.179 | 0.196 | 26.7 | 24.7 | 9.60 | 9.01 | 90.28 | 89.60 |
| 0 (55) | 0 (9.0) | 22.67 | 21.17 | 0.209 | 0.196 | 23.8 | 24.7 | 8.99 | 9.01 | 89.71 | 89.60 |
| 0 (55) | 0 (9.0) | 21.06 | 21.17 | 0.206 | 0.196 | 23.2 | 24.7 | 8.45 | 9.01 | 88.63 | 89.60 |
The polynomial models describing the correlation between the variables and response followed the general form defined by Equation (5) and is shown in
Table 3.
Table 3.
Second order equations describing the effect of
T and pH on alcalase cartilage hydrolysis, CS production and
Ip-index (coded values according to criteria defined in
Table 1). The coefficient of adjusted determination (
) and
F-values (
F1,
F2, and
F3) is also shown. S: Significant; NS: Non-significant.
Table 3.
Second order equations describing the effect of T and pH on alcalase cartilage hydrolysis, CS production and Ip-index (coded values according to criteria defined in Table 1). The coefficient of adjusted determination () and F-values (F1, F2, and F3) is also shown. S: Significant; NS: Non-significant.
| Parameters | Hm | vm | τ | CS | Ip |
|---|
| b0 (intercept) | 21.17 | 0.196 | 24.69 | 9.01 | 89.60 |
| b1 (T) | - | 0.029 | - | - | - |
| b2 (pH) | - | - | 50.21 | −1.80 | −5.74 |
| b12 (TxpH) | −3.23 | −0.069 | 31.50 | −0.74 | −0.84 |
| b11 (T2) | −3.31 | −0.045 | - | −0.81 | −1.80 |
| b22 (pH2) | −9.42 | −0.071 | 35.73 | −2.40 | −8.05 |
| 0.929 | 0.752 | 0.874 | 0.927 | 0.882 |
| F1 | 53.62 | 5.33 | 28.86 | 39.01 | 23.40 |
| F2 | 0.39 | 0.67 | 0.41 | 0.52 | 0.54 |
| F3 | 1.17 | 5.09 | 24.76 | 2.71 | 21.11 |
A high proportion of variability (93% for
Hm and CS) was successfully described by the second order equations. In any case, the agreement among experimental and predicted data was always greater than 75% and the robustness was good in all cases; it demonstrated the predictive capacity of the empirical equations in the range of
T and pH here studied. The results of the multivariate analysis showed significant quadratic negative terms for pH and
T (
p < 0.05). This translates graphically in a dome (convex surface) with clear maximum points for the experimental domains of pH and
T (
Figure 2). The inverse response obtained for τ-parameter (concave surface) is in agreement with the fact that when the enzymatic hydrolysis is greater and faster (high
Hm and
vm), the values of τ are shorter.
From the equations summarized in
Table 3, the optima values of pH and
T (pH
opt and
Topt) that maximize the corresponding measured responses (
Ymax) can be obtained by mathematical optimization using numerical or manual derivation [
19] (
Table 4). The optimal ranges depending on the variable of response were 55–62.6 °C and 8.14–9 for
T and pH, respectively. Because all responses are equally important, it has been established the average of the values from
Table 4 as the compromise option to select the best condition of pH
opt and
Topt. Thus, the values for the subsequent treatment in the alkaline hydroalcoholic solution were: pH = 8.5 and
T = 58.1 °C.
Table 4.
Optima values of the two independent variables (
Topt and pH
opt) to obtain the maximum responses from the equations defined in
Table 3 and for the different dependent variables studied.
a In this case, the optima values of
T and pH are those that minimize the response of τ.
Table 4.
Optima values of the two independent variables (Topt and pHopt) to obtain the maximum responses from the equations defined in Table 3 and for the different dependent variables studied. a In this case, the optima values of T and pH are those that minimize the response of τ.
| | Hm | vm | τ | CS | Ip |
|---|
| Topt (°C) | 55.0 | 62.6 | - | 58.3 | 56.5 |
| pHopt | 9.0 | 8.6 | 9.0 a | 8.14 | 8.23 |
| Ymax | 21.17 | 0.204 | - | 9.38 | 90.6 |
In recent years, alcalase has shown excellent results in the hydrolysis of several fishing wastes, as for instance: Atlantic cod and cattle viscera [
24,
25], yellowfin tuna heads [
26], salmon by-products [
27] or cephalopods and shrimp wastewaters [
28,
29]. Kim
et al. [
30] performed a two-stage enzymatic hydrolysis for CS production from
Isurus oxyrinchus using a combination of alcalase and flavourzyme. Other proteases have also been evaluated for cartilage hydrolysis in the purification of glycosaminoglycans. Lypaine was applied to the degradation of skate cartilage [
31], papain was widely employed in the digestion of different tissues of several origins [
11,
21,
32] and procolax obtained from ray pancreas and commercial papain were compared working on ray cartilage [
12]. However, the high hydrolytic capacity, effectiveness on many different substrates and low cost, make alcalase a key enzyme for the recovery and pre-purification of CS from chondrichthyans discards and their by-products.
2.2. Enzymatic Hydrolysis of Skeletons and Fins Cartilages
In order to check whether the conditions described for heads were also suitable for the alcalase hydrolysis of other cartilages of
S. canicula (skeletons and fins), two conditions of pH’s (the initial obtained from the homogeneized cartilages and pH 8.5) at one temperature (58 °C) were assessed. Those modelled kinetics by Equation (4) are displayed in
Figure 3 and estimations of the parameters are listed in
Table 5.
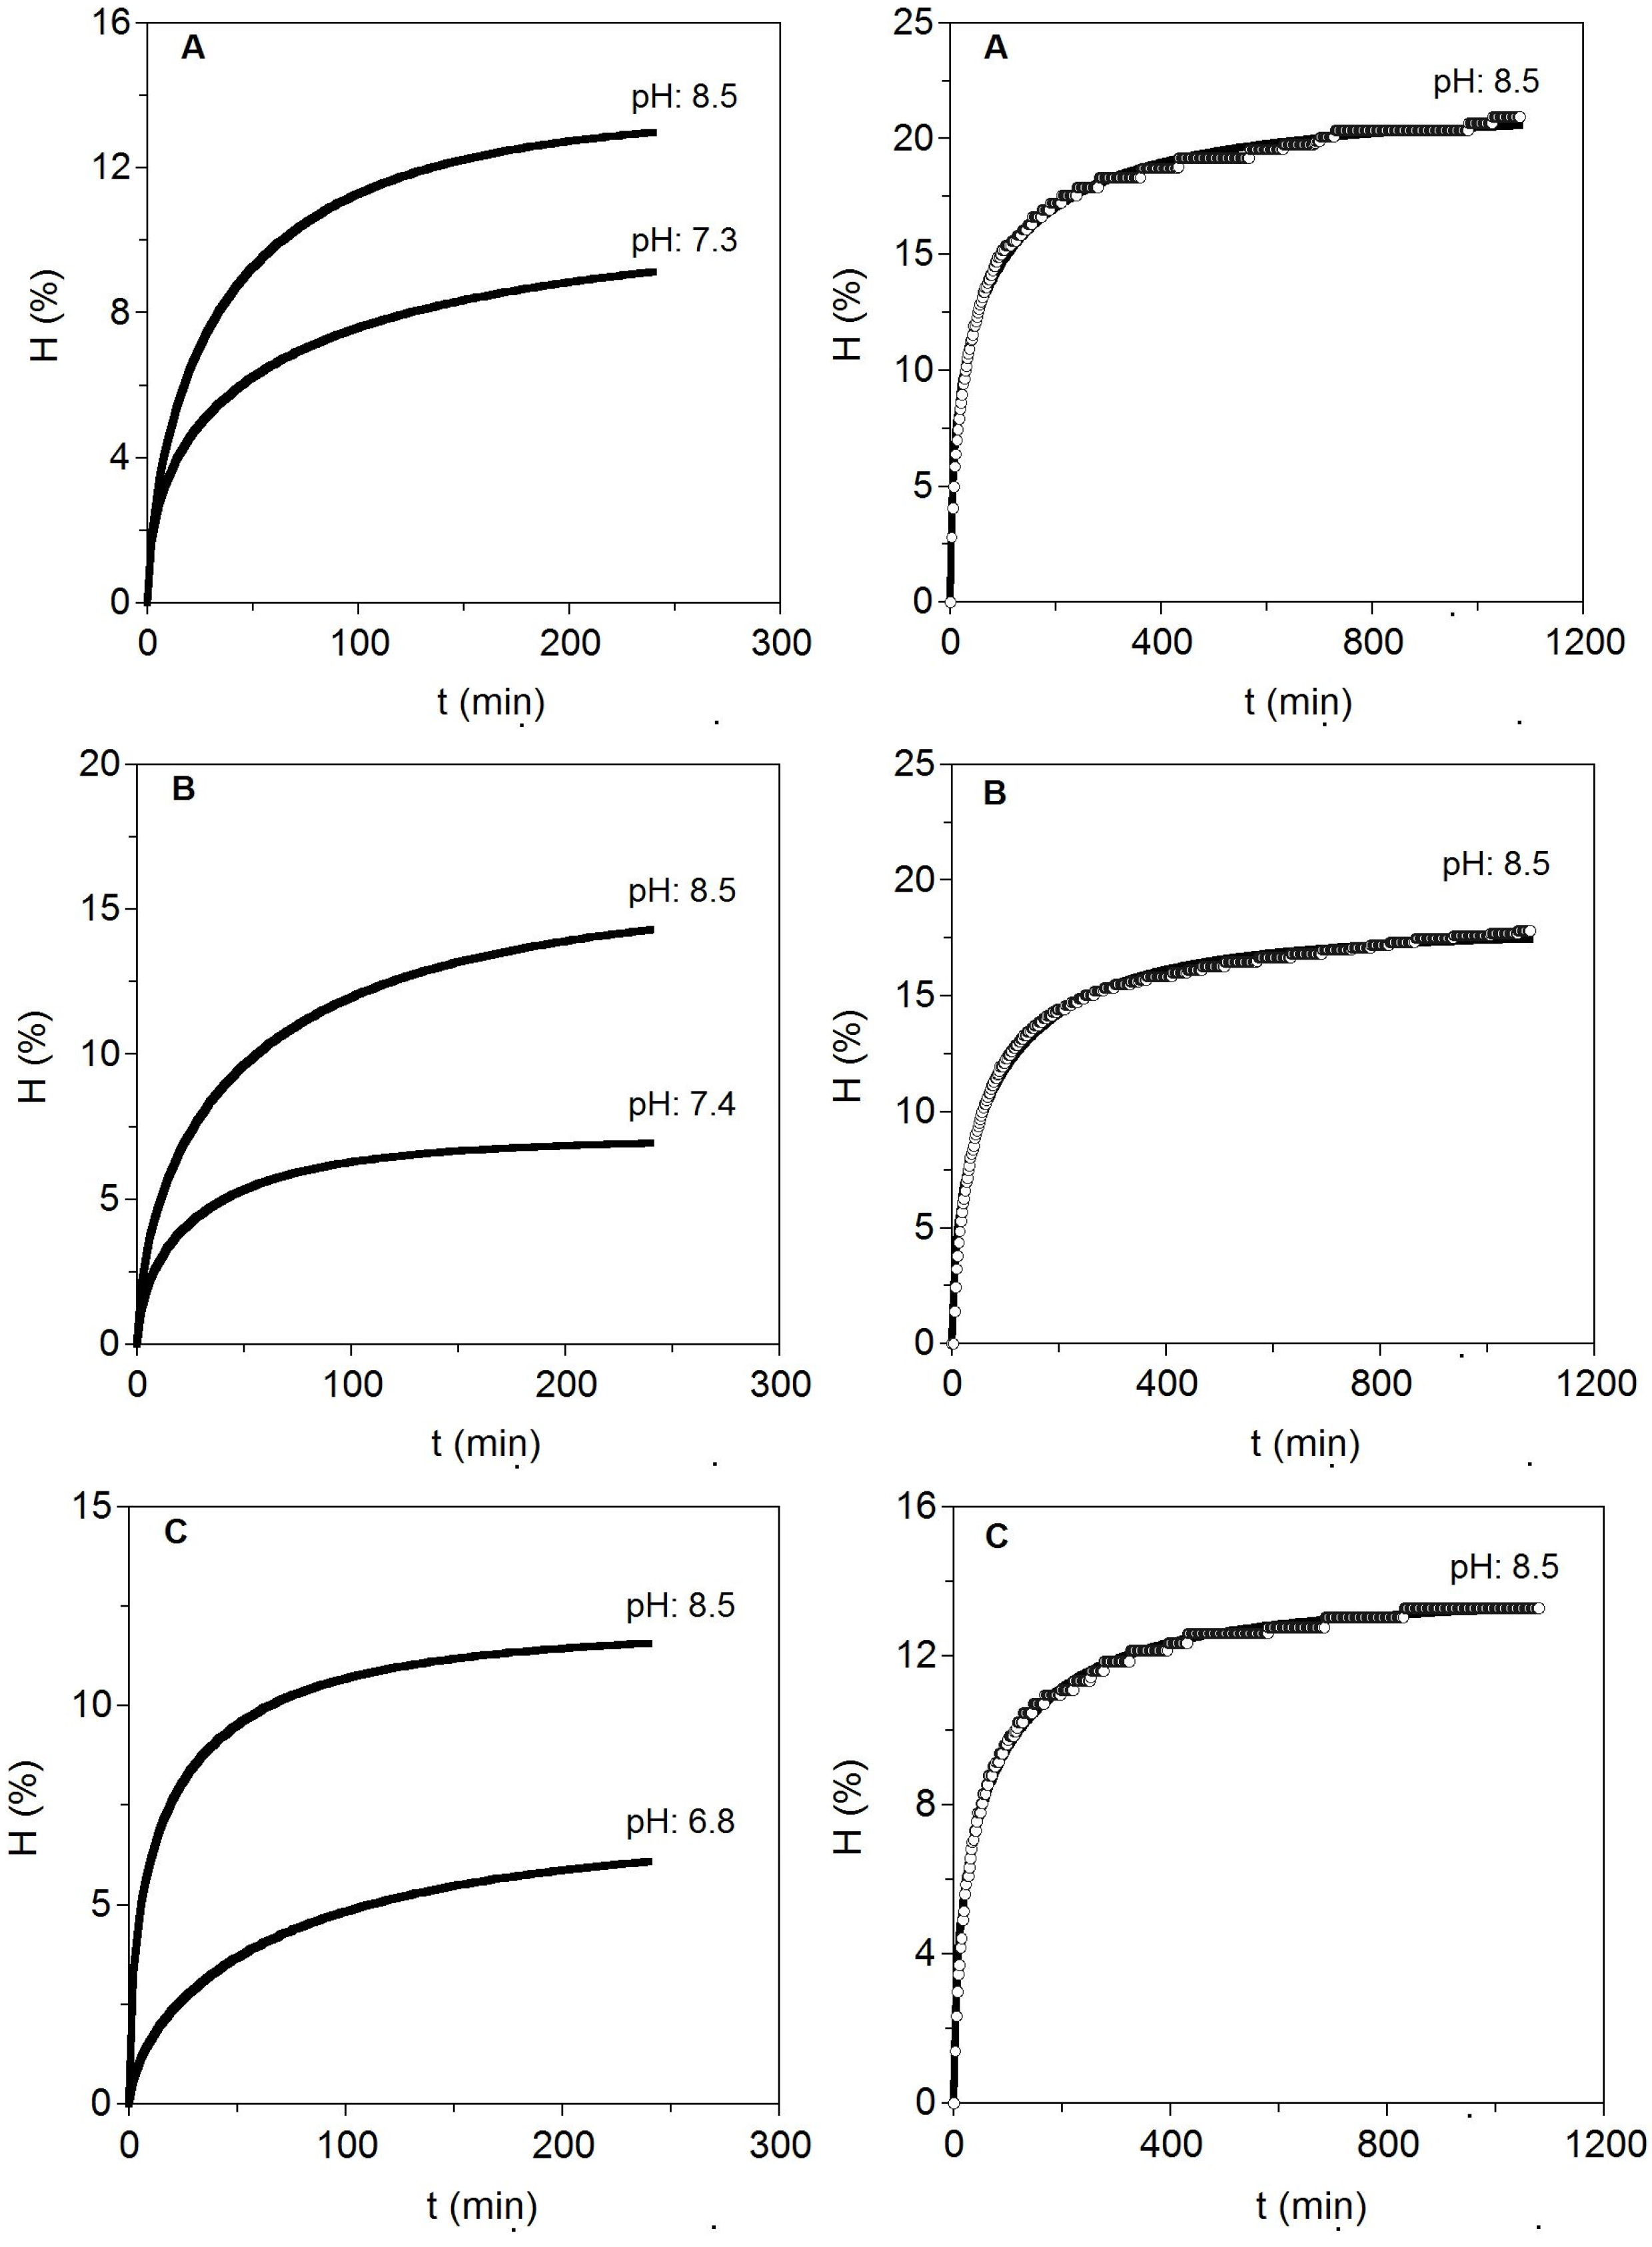
Figure 3.
Enzymatic hydrolysis at two pH levels for different cartilages from S. canicula wastes (left). To the right, long hydrolysis at the best pH selected are additionally shown. Experimental data were fitted to the Weibull Equation (4). (A) Fins; (B) Heads and (C) Skeletons.
Figure 3.
Enzymatic hydrolysis at two pH levels for different cartilages from S. canicula wastes (left). To the right, long hydrolysis at the best pH selected are additionally shown. Experimental data were fitted to the Weibull Equation (4). (A) Fins; (B) Heads and (C) Skeletons.
The results indicated that pH close to 8.5 was better than neutral pH for alcalase hydrolysis of cartilages. It suggests that the optimal conditions for heads can be also extrapolated to hydrolyse cartilages of skeleton and fins with similar positive results. In this context, higher maximum hydrolysis, maximum hydrolysis rate, CS production and CS purity index were significantly generated at alkaline pH. Moreover, the greatest hydrolysis (15.64%) and CS recovery (9.44 g/L) were produced in cartilaginous material from heads as substrate. Different extraction methods, including the use of high intense pulse fields (PEF), or a solvent-free mechanochemical extraction, have been tested for the production of CS from fish cartilage, reporting however, lower contents of CS, 6.92 g/L [
33] and 9.33 g/L [
34], than those obtained in this study for head shark cartilage. Longer kinetics of hydrolysis (18 h) at 58 °C and pH 8.5 were performed to establish more adequate time needed for enzyme catalysis. More than 8–10 h of proteolysis did not lead to significant increases in the degree of cartilages hydrolysis (less than 10% of variation).
Table 5.
Parametric estimations corresponding to the Weibull Equation (4) applied to the enzymatic hydrolysis kinetics at the two pH indicated. Numerical values of the parameters are shown with their confidence intervals. In addition, CS concentrations and Ip-index obtained by selective precipitation under standard conditions are also summarized. a In this case, the kinetics were prolonged up to 18 h.
| FINS | Hm (%) | vm (%·min−1) | τ (min) | β | R2 | CS (g/L) | Ip (%) |
|---|
| pH: 7.3 | 10.73 ± 0.06 | 0.058 ± 0.001 | 31.82 ± 0.56 | 0.50 ± 0.00 | 0.991 | 5.65 | 77.5 |
| pH: 8.5 | 13.59 ± 0.10 | 0.132 ± 0.003 | 22.84 ± 0.45 | 0.64 ± 0.01 | 0.999 | 6.50 | 83.7 |
| a pH: 8.5 | 21.13 ± 0.10 | 0.110 ± 0.002 | 30.82 ± 0.65 | 0.46 ± 0.01 | 0.992 | 6.75 | 88.3 |
| HEADS | | | | | | | |
| pH: 7.4 | 7.08 ± 0.01 | 0.094 ± 0.001 | 16.53 ± 0.09 | 0.64 ± 0.00 | 0.990 | 7.79 | 79.9 |
| pH: 8.5 | 15.64 ± 0.02 | 0.111 ± 0.001 | 29.26 ± 0.10 | 0.60 ± 0.00 | 0.999 | 9.44 | 86.9 |
| a pH: 8.5 | 17.72 ± 0.07 | 0.080 ± 0.001 | 42.60 ± 0.84 | 0.56 ± 0.01 | 0.992 | 9.68 | 89.6 |
| SKELETONS | | | | | | | |
| pH: 6.8 | 6.85 ± 0.02 | 0.037 ± 0.001 | 42.54 ± 0.26 | 0.67 ± 0.00 | 0.997 | 4.79 | 76.7 |
| pH: 8.5 | 11.93 ± 0.29 | 0.222 ± 0.021 | 9.25 ± 0.01 | 0.50 ± 0.04 | 0.969 | 6.07 | 80.4 |
| a pH: 8.5 | 13.49 ± 0.04 | 0.074 ± 0.001 | 31.69 ± 0.84 | 0.50 ± 0.01 | 0.995 | 6.91 | 87.1 |
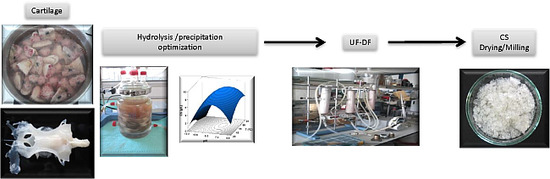
2.3. Optimisation of Alkaline Hydroalcoholic Treatment of Enzymatic Hydrolysates
Based on the optimised values described in the previous sections, the hydrolysates of cartilages from different origins (heads, skeletons and fins) were prepared under the following conditions: Hydrolysis time (10 h),
T = 58 °C, pH = 8.5 (using Tris-HCl buffer 0.1 M), alcalase = 0.1% (v/w) (2.4 AU/kg), solid:liquid ratio (1:1), agitation = 200 rpm. The alcalase hydrolysates were centrifuged at 6000 rpm/20 min and the supernatants were employed in the subsequent treatment with alkaline hydroalcoholic solutions, as described here in the
Experimental Section.
CS and
Ip responses (experimental and predicted) from such treatments of
S. canicula hydrolysates are summarized in
Table 6.
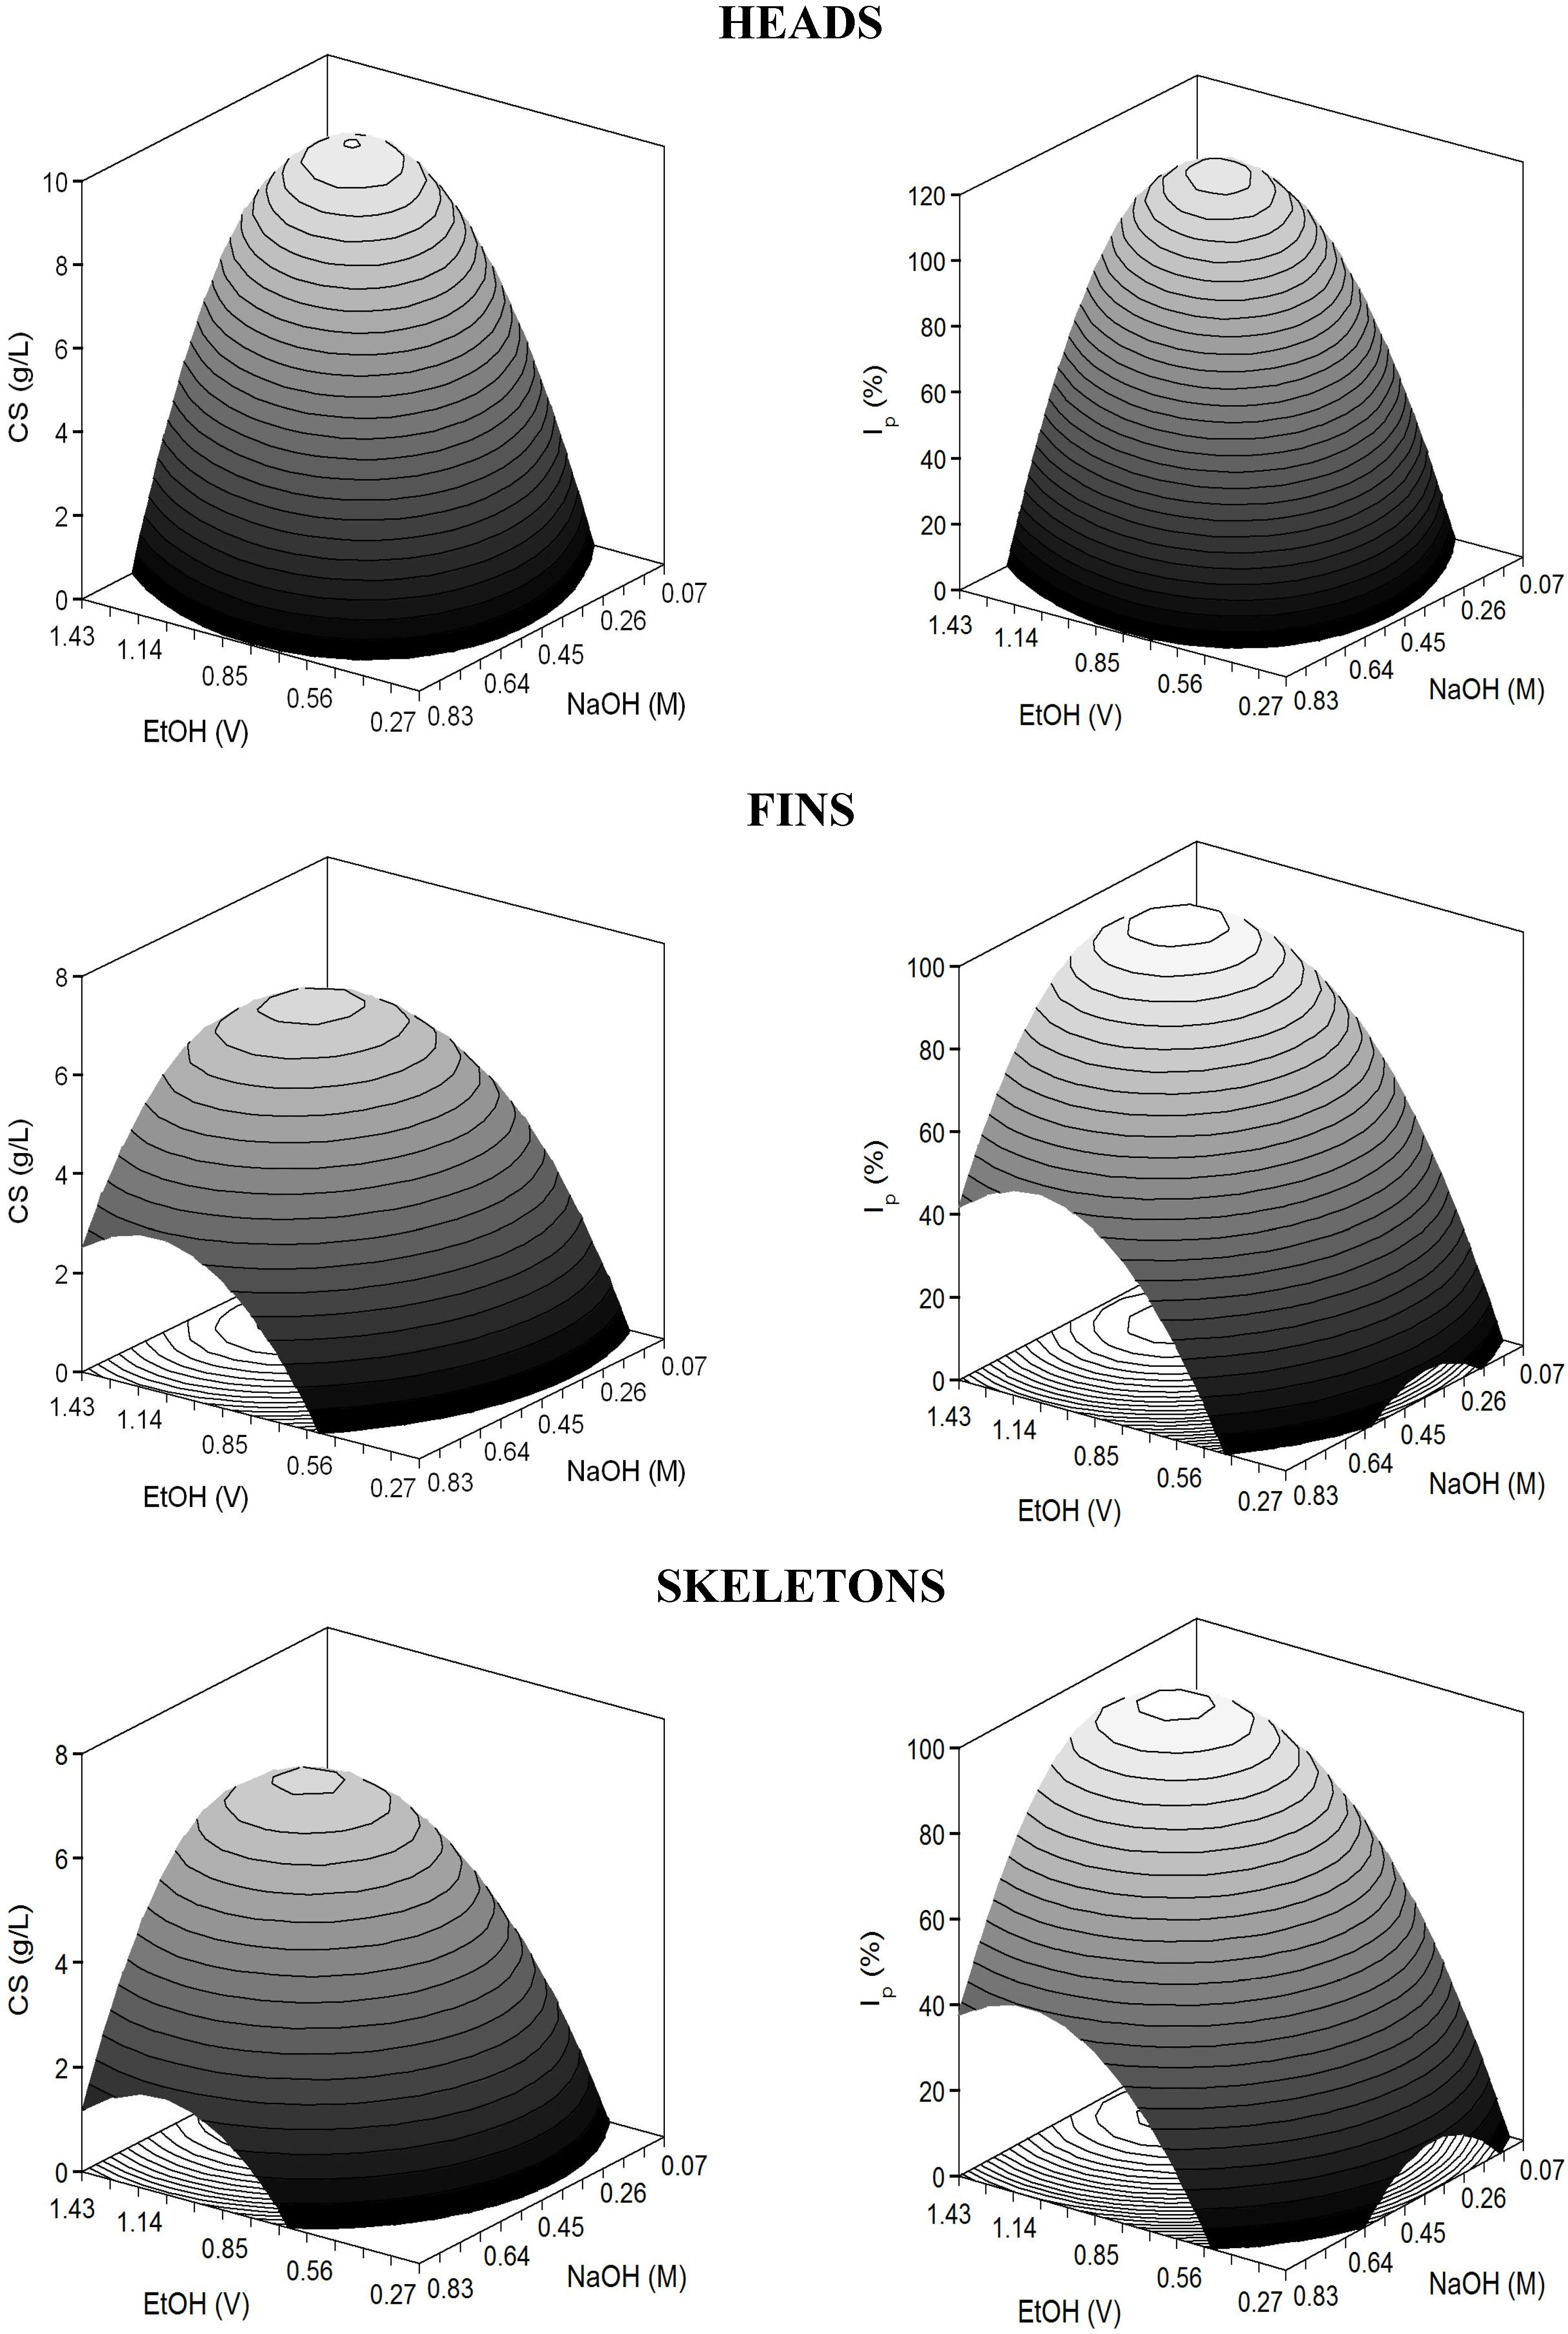
Data from CS production and purities were converted into second-order polynomial equations as a function of two independent variables (E and N). The equations describing those effects and their statistical results are represented in
Table 7.
The adjusted coefficients of determination were higher than 0.83 indicating a good correlation between experimental data and theoretical responses. In all cases, responses were significantly affected by positive E and N linear terms and negative quadratic coefficients of both variables (
p <0.05). The predicted response surfaces were very homogeneous displaying perfect domes (convex surfaces) in the experimental domain executed (
Figure 4). Nevertheless, cases of over and under-estimation were observed (
Table 6), which do not invalidate the results, and are due to not achieving coefficients of determination nearer to one (
Table 7). As described previously, the present
values revealed good but not perfect agreement among surfaces and experimental data; therefore little lack of fit is commonly obtained.
Table 6.
Summary of the independent variables (NaOH: N, EtOH: E) in the response surface design with the corresponding experimental (Ye) and predicted (Yp) results of selective precipitation of CS from S. canicula wastes. Natural values of experimental conditions are in brackets.
Table 6.
Summary of the independent variables (NaOH: N, EtOH: E) in the response surface design with the corresponding experimental (Ye) and predicted (Yp) results of selective precipitation of CS from S. canicula wastes. Natural values of experimental conditions are in brackets.
| | | HEADS | FINS | SKELETONS |
|---|
| Independent Variables | CS (g/L) | Ip (%) | CS (g/L) | Ip (%) | CS (g/L) | Ip (%) |
|---|
| X1: N | X2: E | Ye | Yp | Ye | Yp | Ye | Yp | Ye | Yp | Ye | Yp | Ye | Yp |
|---|
| −1 (0.20) | −1 (0.46) | 0.25 | 0.45 | 4.13 | 6.63 | 0.10 | 0.01 | 20.56 | 18.27 | 0.10 | −0.45 | 22.20 | 15.48 |
| 1 (0.70) | −1 (0.46) | 0.50 | 1.33 | 5.88 | 15.01 | 0.80 | 1.89 | 17.14 | 34.64 | 0.10 | 1.36 | 22.20 | 37.50 |
| −1 (0.20) | 1 (1.24) | 0.70 | 1.75 | 8.24 | 19.74 | 5.74 | 4.75 | 86.05 | 72.17 | 5.26 | 4.00 | 83.63 | 68.67 |
| 1 (0.70) | 1 (1.24) | 7.32 | 9.00 | 87.04 | 105.17 | 5.72 | 5.90 | 86.34 | 92.25 | 5.39 | 5.81 | 85.13 | 90.69 |
| −1.41 (0.10) | 0 (0.85) | 1.03 | 0.53 | 11.54 | 5.87 | 1.61 | 2.40 | 32.09 | 44.31 | 0.10 | 1.38 | 22.20 | 37.49 |
| 1.41 (0.80) | 0 (0.85) | 7.67 | 6.27 | 87.08 | 72.00 | 5.41 | 4.53 | 85.86 | 70.00 | 5.14 | 3.93 | 83.42 | 68.54 |
| 0 (0.45) | −1.41 (0.30) | 0.10 | −0.24 | 2.54 | −1.46 | 0.44 | −0.25 | 22.61 | 12.57 | 0.10 | −0.40 | 22.20 | 16.02 |
| 0 (0.45) | 1.41 (1.40) | 7.62 | 6.08 | 88.09 | 71.34 | 5.32 | 5.92 | 84.78 | 91.18 | 5.30 | 5.88 | 84.43 | 91.02 |
| 0 (0.45) | 0 (0.85) | 7.68 | 7.71 | 87.44 | 86.77 | 5.76 | 5.67 | 85.71 | 85.33 | 5.26 | 5.47 | 84.00 | 84.19 |
| 0 (0.45) | 0 (0.85) | 7.54 | 7.71 | 86.79 | 86.77 | 5.46 | 5.67 | 85.22 | 85.33 | 5.70 | 5.47 | 84.71 | 84.19 |
| 0 (0.45) | 0 (0.85) | 7.70 | 7.71 | 86.43 | 86.77 | 5.74 | 5.67 | 85.91 | 85.33 | 5.45 | 5.47 | 83.59 | 84.19 |
| 0 (0.45) | 0 (0.85) | 7.72 | 7.71 | 86.19 | 86.77 | 5.72 | 5.67 | 85.19 | 85.33 | 5.47 | 5.47 | 84.73 | 84.19 |
| 0 (0.45) | 0 (0.85) | 7.89 | 7.71 | 86.77 | 86.77 | 5.66 | 5.67 | 84.57 | 85.33 | 5.49 | 5.47 | 83.93 | 84.19 |
Table 7.
Second order equations describing the effect of N and E on selective precipitation of CS (coded values according to criteria defined in
Table 6). The coefficient of adjusted determination (
) and
F-values (
F1 and
F2) is also shown. S: Significant.
Table 7.
Second order equations describing the effect of N and E on selective precipitation of CS (coded values according to criteria defined in Table 6). The coefficient of adjusted determination () and F-values (F1 and F2) is also shown. S: Significant.
| | HEADS | FINS | SKELETONS |
|---|
| Parameters | CS | Ip | CS | Ip | CS | Ip |
|---|
| b0 (intercept) | 7.71 | 86.77 | 5.67 | 85.33 | 5.47 | 84.19 |
| b1 (N) | 2.04 | 23.45 | 0.76 | 9.11 | 0.91 | 11.01 |
| b2 (E) | 2.24 | 25.81 | 2.19 | 27.88 | 2.23 | 26.59 |
| b12 (N × E) | 1.59 | 19.26 | −0.18 | 0.93 | NS | NS |
| b11 (N2) | −2.17 | −24.06 | −1.11 | −14.17 | −1.42 | −15.68 |
| b22 (E2) | −2.41 | −26.07 | −1.43 | −16.83 | −1.38 | −15.43 |
| 0.897 | 0.905 | 0.885 | 0.830 | 0.857 | 0.849 |
| F1 | 21.97 | 23.88 | 19.54 | 12.71 | 18.92 | 17.85 |
| F2 | 0.67 | 0.66 | 0.67 | 0.69 | 0.55 | 0.56 |
Figure 4.
Predicted response surfaces by empirical equations summarized in
Table 7 corresponding to the combined effect of NaOH and EtOH on the selective treatment of CS from hydrolysate cartilages of
S. canicula.
Figure 4.
Predicted response surfaces by empirical equations summarized in
Table 7 corresponding to the combined effect of NaOH and EtOH on the selective treatment of CS from hydrolysate cartilages of
S. canicula.
The sequential combination of the two-stages for glycosaminoglycan recovery optimised until now led to almost 90% of CS purity against total protein. The best NaOH concentrations and volumes of ethanol for chemical treatment of hydrolysates were (averaging the two responses, CS concentration and purity): 0.64 M and 1.14 volumes for heads, 0.53 M and 1.16 volumes for fins and 0.54 M and 1.20 volumes for skeletons (
Table 8). The aforementioned little lack of fit might be also the cause of the over-estimation of
Ymax values showed in
Table 8. The optima levels of alkali and alcohol were higher than those found for cartilages of
Raja clavata [
12]. Ethanol has been reported to be an excellent reagent for the selective precipitation of CS, removing the major protein presents in the extract [
35]. However, increases in the quantity of ethanol used for the extraction of CS from shark cartilage, did not lead to increases in the yield of the CS obtained [
34,
36].
Table 8.
Optima values of the two independent variables (NaOH
opt and EtOH
opt) to obtain the best responses from the equations defined in
Table 7 and for the two dependent variables studied (CS concentration and purity).
Table 8.
Optima values of the two independent variables (NaOHopt and EtOHopt) to obtain the best responses from the equations defined in Table 7 and for the two dependent variables studied (CS concentration and purity).
| | HEADS | FINS | SKELETONS |
|---|
| | CS | Ip | CS | Ip | CS | Ip |
|---|
| NaOHopt (M) | 0.63 | 0.65 | 0.52 | 0.54 | 0.53 | 0.54 |
| EtOHopt (V) | 1.12 | 1.16 | 1.14 | 1.18 | 1.16 | 1.24 |
| Ymax | 9.24 | 106.4 | 6.59 | 98.6 | 6.52 | 97.6 |
2.4. Purification of CS by Ultrafiltration-Diafiltration Processes
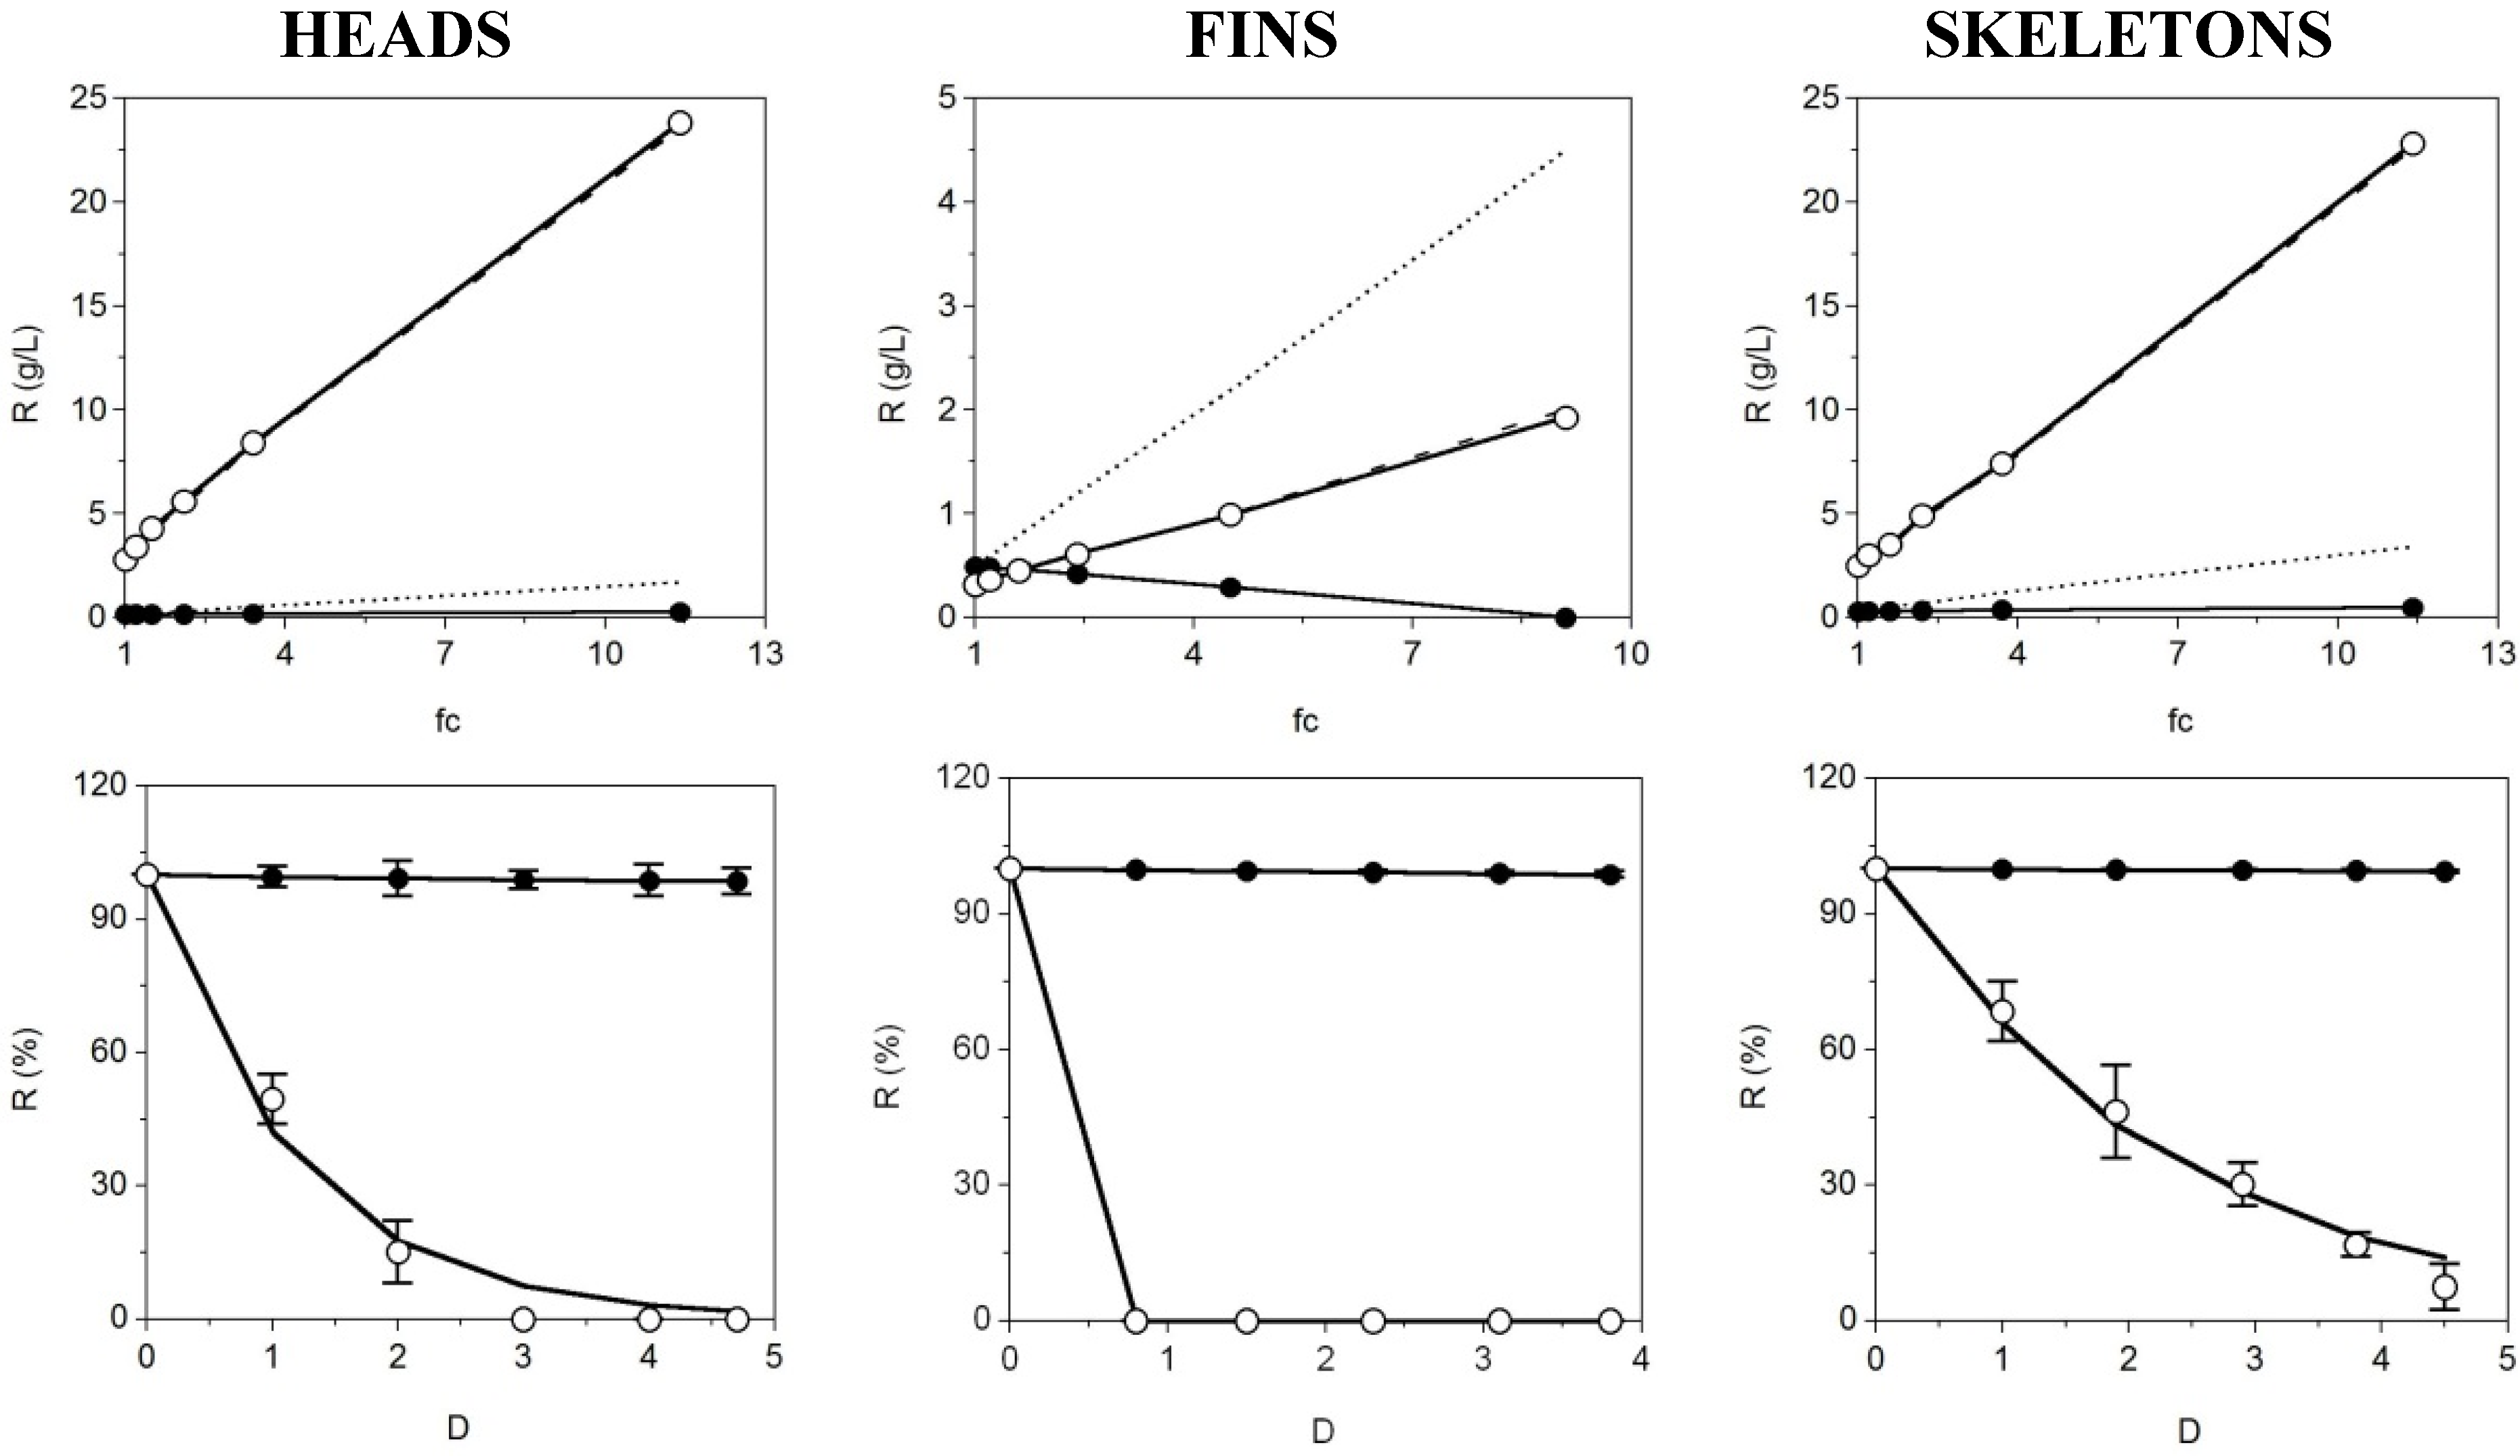
The last stage of CS purification was carried out using membrane technologies at a 30 kDa cut-off. Four-liter batches of CS neutralized solutions obtained under the optimal experimental conditions described in previous sections, were purified by a sequence of UF and DF performances. The progress of CS and protein levels
versus concentration factor by UF is displayed in
Figure 5 (Top).
Perfect correlation agreement among theoretical and experimental concentration factor patterns (more than nine-fold in all cases) was reached after the initial 30 kDa UF where the CS concentration from skeletons and heads cartilages was concentrated up to 20–25 g/L. In contrast, the protein was mainly permeated (complete disagreement between predicted and real data) suggesting a lower molecular weight than 30 kDa of the peptidic fraction. The difference of CS recovery comparing origins of the cartilages was due to the lower initial CS content in the fins solutions prepared for UF-DF. The proportion in weight of such cartilage is much lower in comparison to the other fractions, therefore when 4 L of fin solution are obtained, in order to perform representative membrane experiments, the initial concentration of CS is indeed much lower. The filtrate flows during UF processes (concentration step) were maintained in average values of (mL/min): 755, 520 and 900 for fins, head and skeleton samples respectively. The flow falls were inferior to 15% of the average values.
Equation (6) accurately predicted the data of retention dynamics obtained by the DF process (
Figure 5, bottom) with high statistical correlation (
R2 > 0.988) (
Table 9). All the parameter determinations and the estimation of CS and protein rejection at three diavolumes (
R3D) are also defined in
Table 9.
Figure 5.
UF-DF process for CS purification from S. canicula cartilages of three origins at 30 kDa. Top: Concentration of retained protein (○) and CS (●) in linear relation with the factor of volumetric concentration (fc) showing experimental data (points) and theoretical profiles corresponding to a completely retained solute (discontinuous line). Bottom: Progress of protein (○) and CS (●) retention with the increase of diavolume from DF process (D). Equation (6) was used to fit the experimental data. Error bars are the confidence intervals (α = 0.05; n = 2).
Table 9.
Parametric estimates from DF purification data (with MWCO of 30 kDa) of CS and proteins fitted to the Equation (6). Determination coefficients (R2) are also shown. NS: Non-significant.
Table 9.
Parametric estimates from DF purification data (with MWCO of 30 kDa) of CS and proteins fitted to the Equation (6). Determination coefficients (R2) are also shown. NS: Non-significant.
| | | CS | Proteins |
|---|
| | R0 | 2.52 ± 1.84 | 100.0 ± 22.6 |
| | Rf | 97.4 ± 1.91 | 0.0 |
| HEADS | s | 0.829 ± 0.189 | 0.134 (NS) |
| | R2 | 0.996 | 0.988 |
| | R3D | 1.01 | 92.6 |
| | R0 | 23.2 (NS) | - |
| | Rf | 76.8 ± 41.8 | - |
| FINS | s | 0.985 ± 0.030 | - |
| | R2 | 0.999 | - |
| | R3D | 1.02 | - |
| | R0 | 20 (NS) | 100.0 ± 13.5 |
| | Rf | 80 (NS) | 0.0 |
| SKELETONS | s | 0.994 ± 0.119 | 0.561 ± 0.115 |
| | R2 | 0.998 | 0.992 |
| | R3D | 0.36 | 73.2 |
The values of the coefficients corresponding to CS, demonstrate that the retention was almost total (
s ~ 1,
Rf > 76% and
R3D < 1.1%). In the case of proteins, the permeation of fin solutions was complete at the beginning of the DF and needed more than 3 or 4 relative diavolumes for the heads and skeletons samples, respectively. The complete desalination of retentates was also observed (data not shown). These results reveals the high efficiency of the 30 kDa UF-DF system as a final step to CS retention and recovery and protein discard from
S. canicula wastes. The purity of CS retentates (in terms of
Ip-values) after drying was: 98%, 97% and 96.2% for head, skeleton and fins. If an ulterior purification might be still required, dried samples could return to the alkaline-alcoholic treatment and UF-DF separation, in similar conditions to those described previously. The final yields of CS were (as % of wet weight cartilage): 4.8, 3.3 and 1.5 for heads, fins and skeleton materials, respectively. Membrane separation techniques have been used as the last step of purification of chondroitin sulphate from different cartilage sources, because of the high separation efficiency, different cut-off membranes, ease of scale-up and cost effectiveness [
37]. Lignot
et al. [
31] using the UF technique showed lower concentration factors for CS in skate, than those found in this study (up to nine times).
Other methods for the separation/purification of CS are found in literature, including gel filtration [
36] or ion-exchange chromatography [
38], however the purity of the final CS did not showed any increase in comparison to our results. An initial analysis of chemical composition of sulphate groups indicated that all CS from different types of cartilage were similar with a proportion of sulphation in C6 (6S) and C4 (4S) of 40%–44% and 39%–43% respectively (unpublished data). It also confirmed the validity of the optimisation developed herein. Based on a similar proposal but obtaining different optimal conditions [
12], the 6S proportion was 75% in ray cartilage (unpublished data).


 ,
, 

