2. Results and Discussion
Compound
1 obtained as an amorphous yellow solid, revealed an [M + Na]
+ peak at
m/
z 330.1220, suggesting a molecular formula of C
18H
17N
3O
2 and 12 degrees of unsaturation. The IR spectrum showed bands due to lactam carbonyl functions (1663 cm
−1) [
15], while the UV absorptions at 208, 224, 273, 282, 412, and 434 nm suggested the presence of triazapyrene lactam core in the molecule [
13]. The
1H NMR spectrum displayed the characteristic signals for one isolated methoxy protons 8-OCH
3 (δ
H 4.12, 3H, s), two sets of coupled protons at H-2 (δ
H 8.73, d,
J = 8.0 Hz) and H-3 (δ
H 7.48, d,
J = 8.0 Hz), and H-5 (δ
H 7.76, d,
J = 5.5 Hz) and H-6 (δ
H 8.70, d,
J = 5.5 Hz), and the isolated proton H-7 (δ
H 7.39, 1H, s), which can be found in most of aaptamine structures [
13]. Unlike the other aaptamine analogs reported in the literature [
2,
14], the absence of proton 1-NH and methoxy protons 9-OCH
3 in
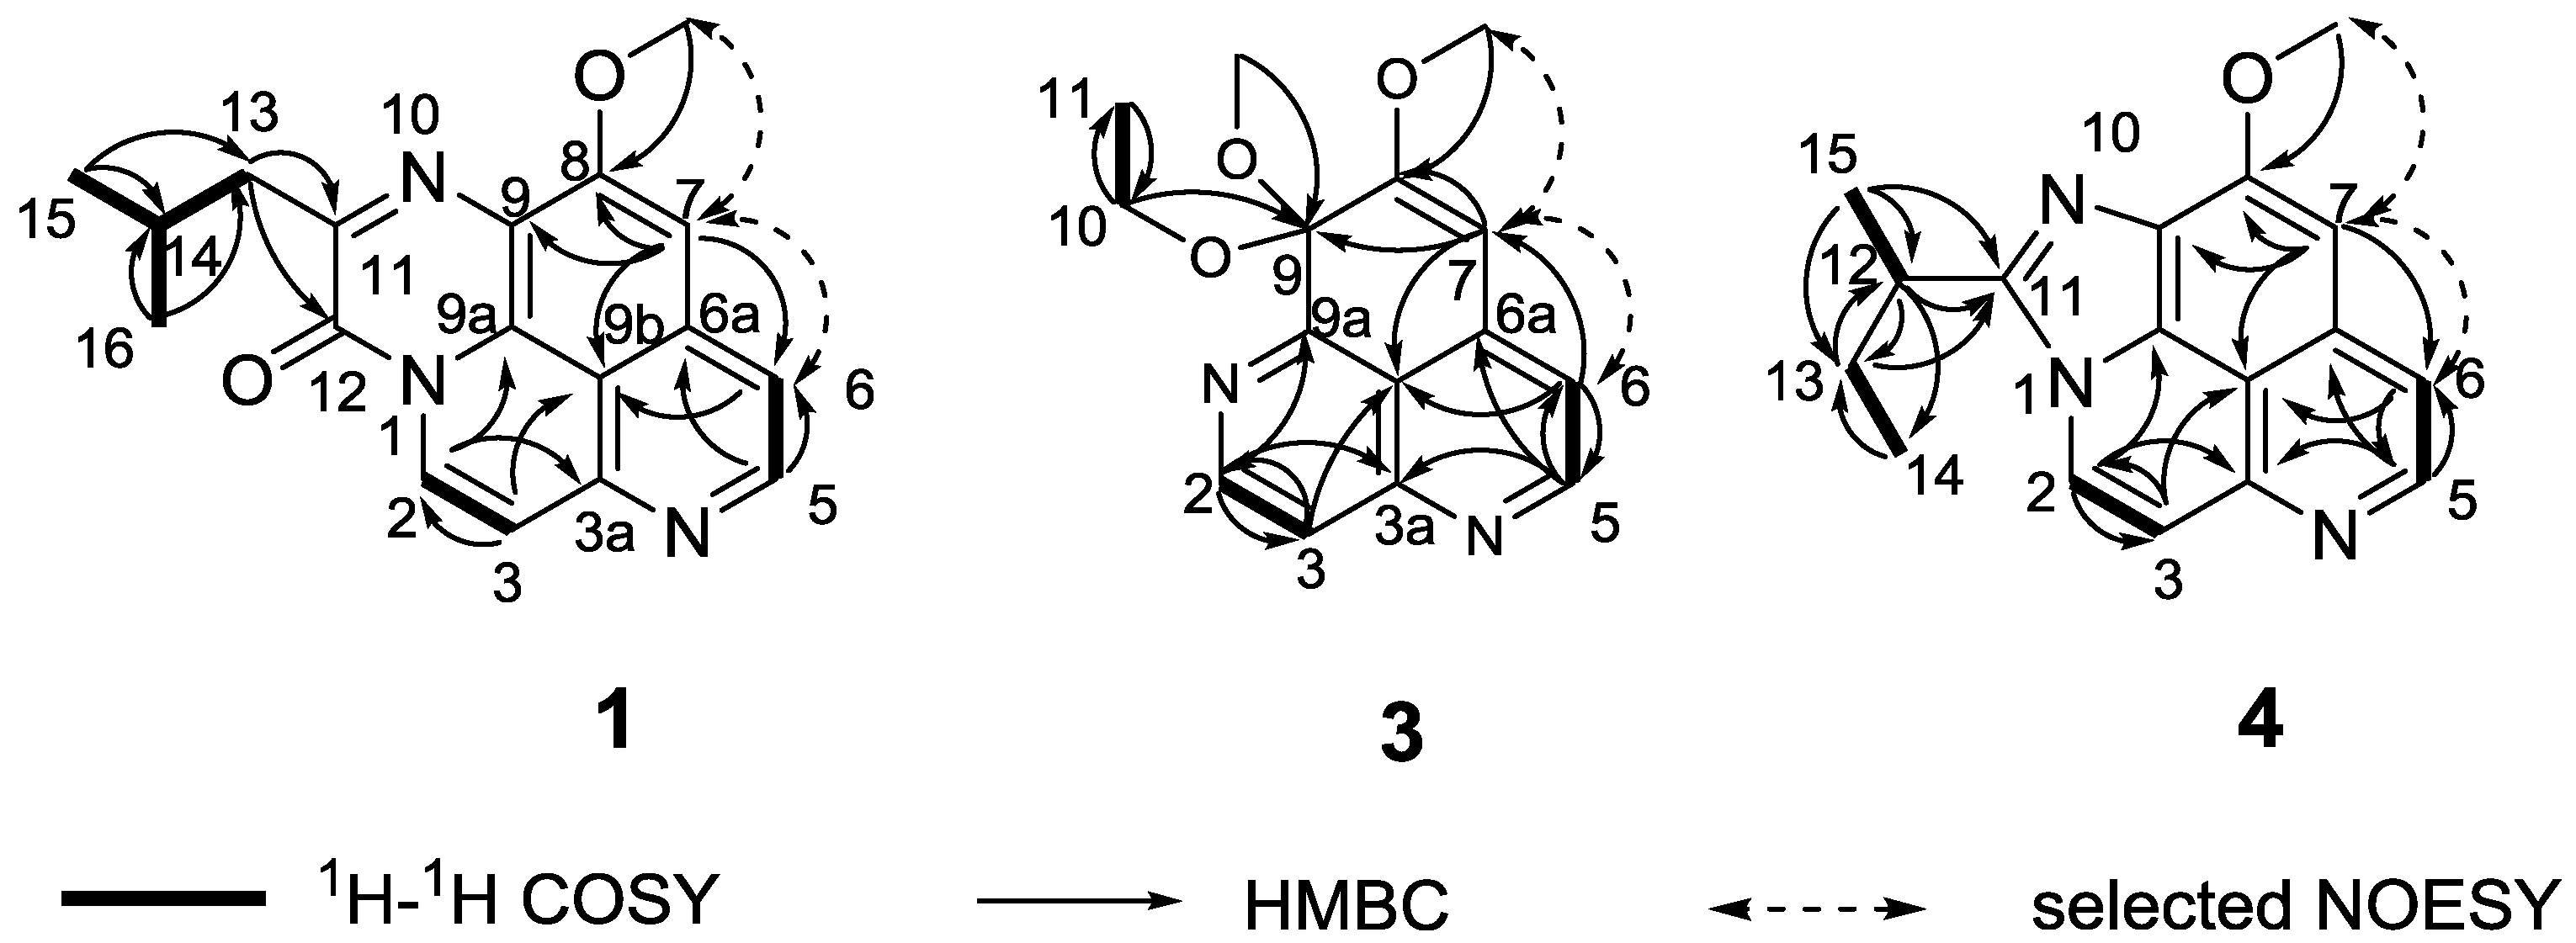
1 indicated the substitutions of both N-1 and C-9. In addition, key HMBC correlations from H-2 to C-3a (δ
C 148.2) and C-9a (δ
C 126.7), from H-3 to C-2 (δ
C 126.5) and C-9b (δ
C 112.8), from H-5 to C-6 (δ
C 116.9) and C-6a (δ
C 137.1), from H-6 to C-5 (δ
C 147.4), C-7 (δ
C 99.2), and C-9b, from H-7 to C-6, C-8 (δ
C 157.3), C-9 (δ
C 119.5), and C-9b, and from 8-OCH
3 to C-8 (
Figure 1 and
Supplementary Figure S5), confirmed that
1 was an aaptamine congener [
13]. Moreover, the quaternary carbons at C-11 (δ
C 153.9) and C-12 (δ
C 150.7) were confirmed to be a sp
2 quaternary carbon and a lactam carbonyl, respectively, by comparison the
13C NMR data with the reported aaptamine derivatives [
13]. The quaternary carbon C-11 was further linked to C-9 via a nitrogen atom on consideration of its chemical shifts. Apart from these signals, one methine carbon (δ
C 26.7), one methylene carbon (δ
C 42.4), and two overlapped methyl carbons (δ
C 22.6, 22.6) remained unassigned. These signals were revealed to be an isobutyl group, supported by COSY correlations of H
2-13 (δ
H 2.91)/H-14 (δ
H 2.34), H-14/H
3-15 (δ
H 0.99), and H-14/H
3-16 (δ
H 0.99). The isobutyl group was tethered to C-12 via C-11, based on the HMBC correlations from H
2-13 to C-11 and C-12. Since all the above resonances accounted for 11 out of the 12 degrees of unsaturation, the remaining one degree of unsaturation was assumed to the presence of a tetracyclic system in
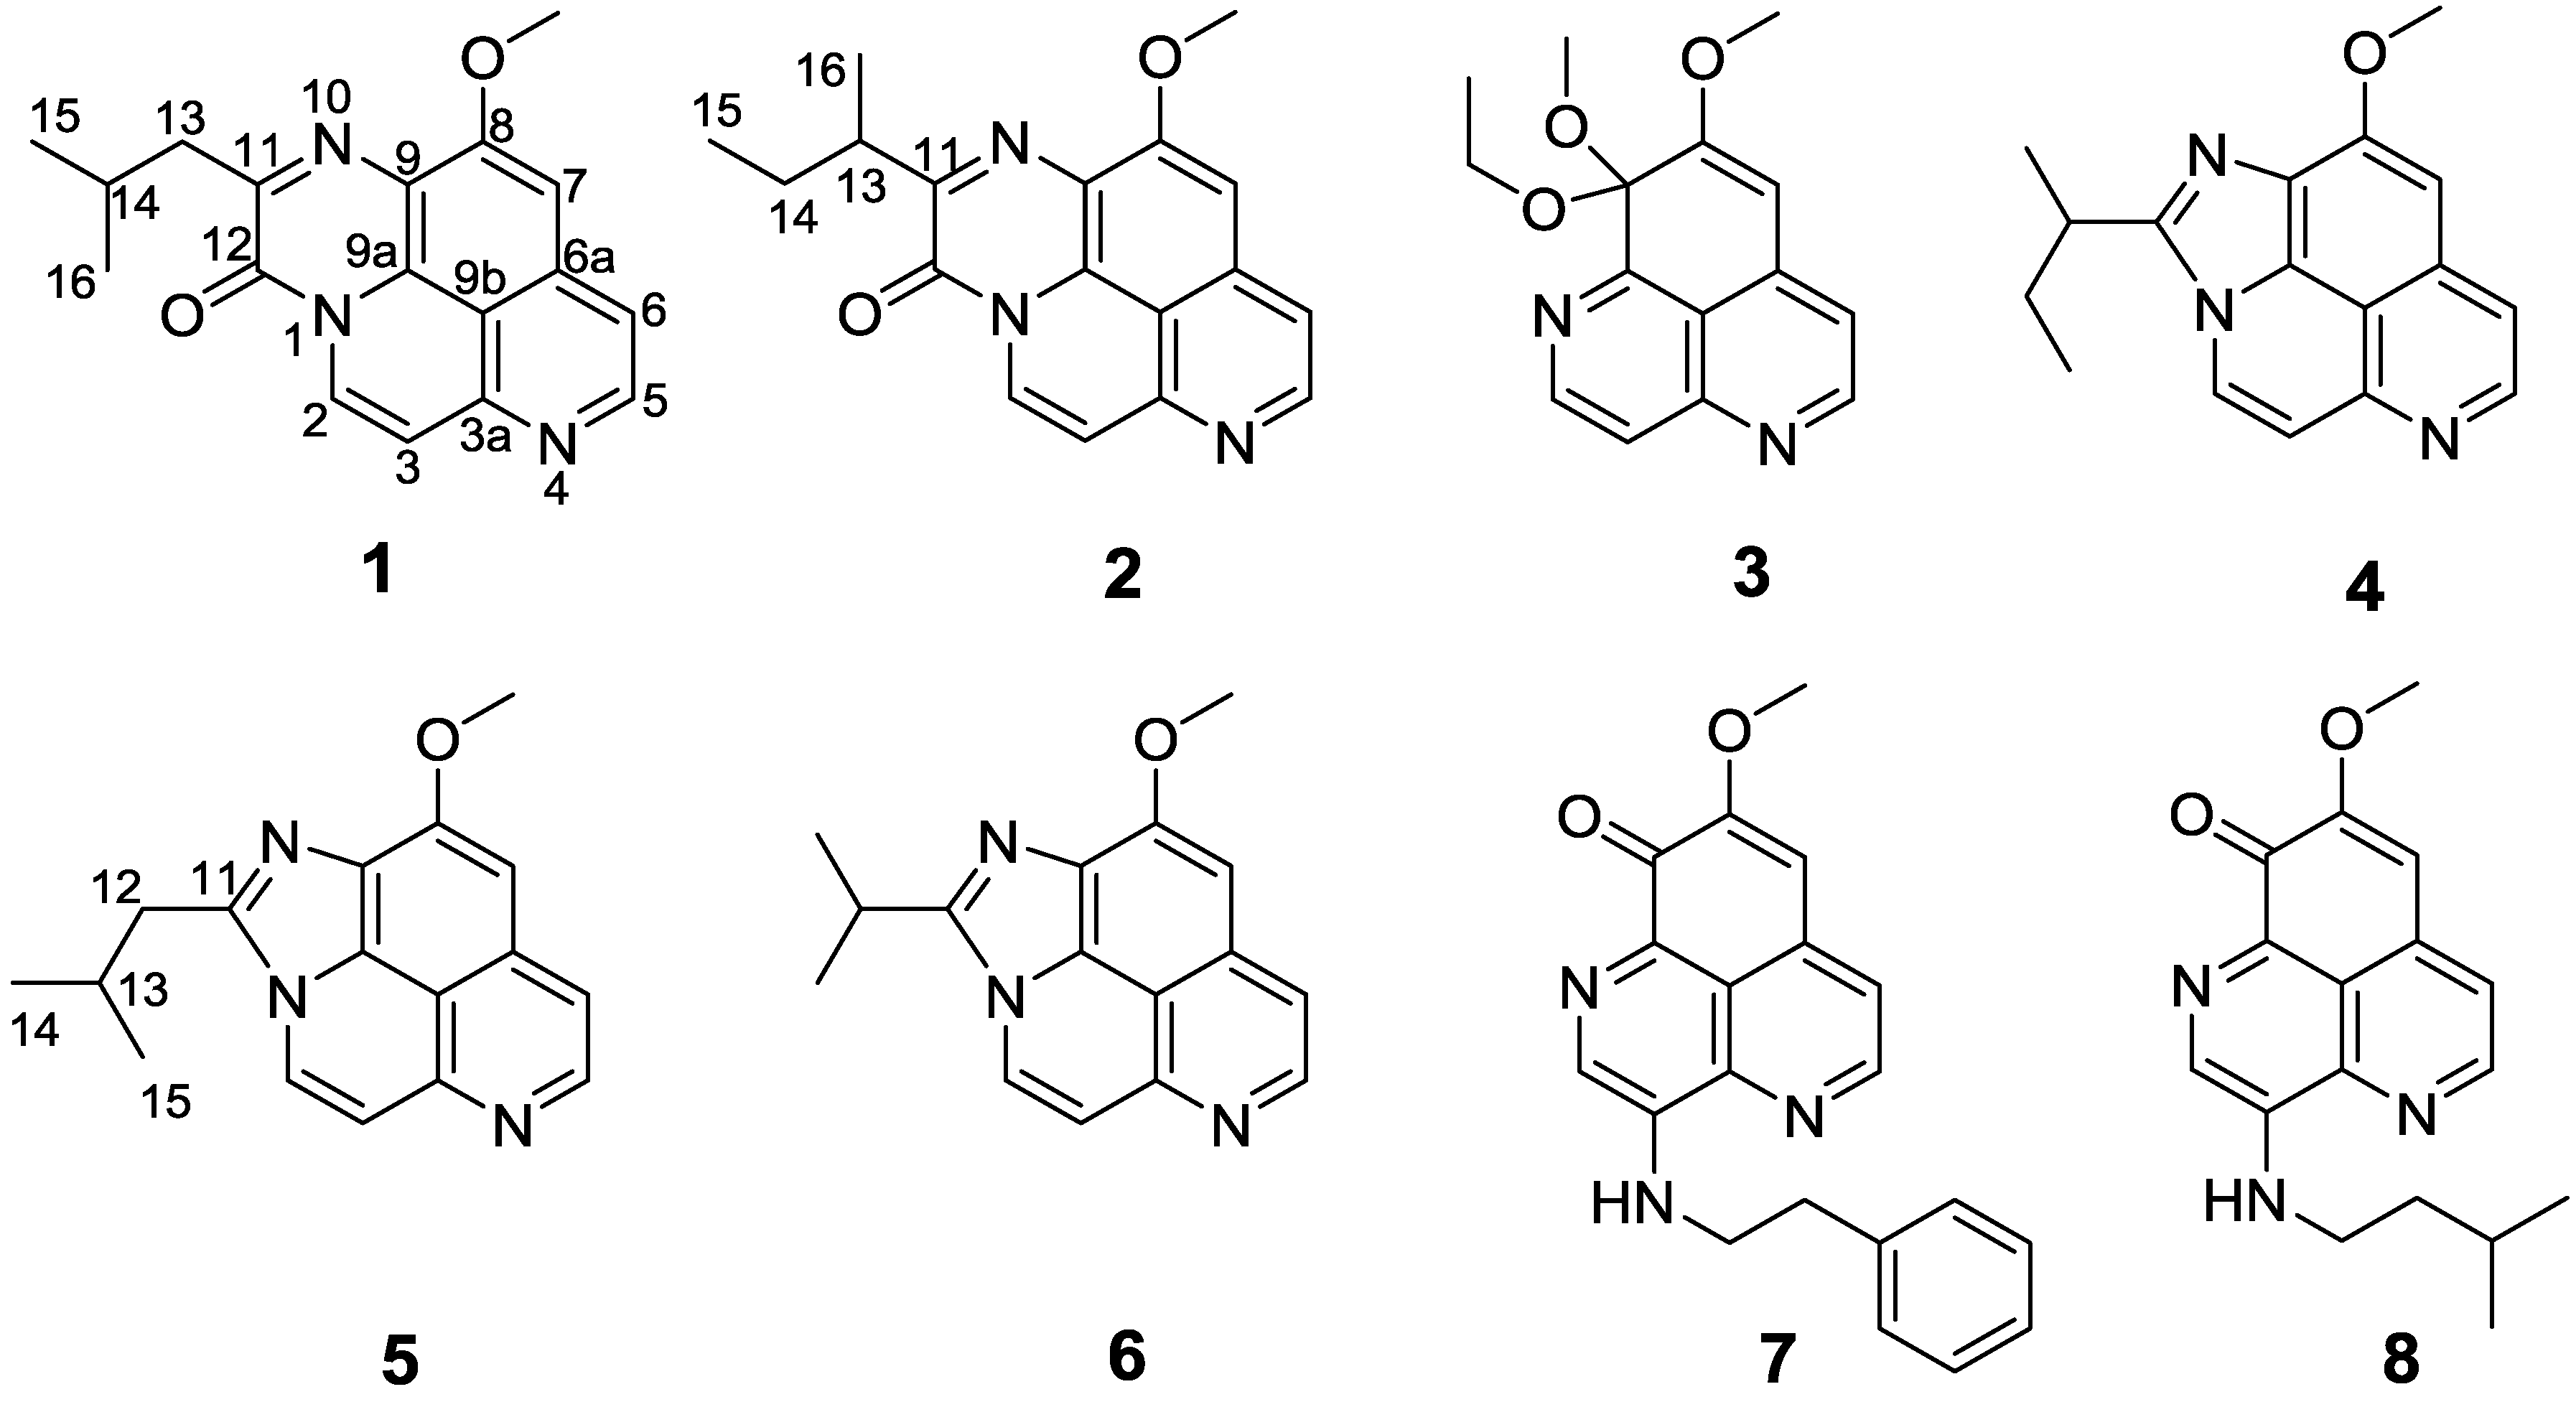
1. Finally, a directly bridge between N-1 and C-12 could be rationalized the remaining one degree of unsaturation and the molecular formula. Therefore, the structure of compound
1 was unambiguously assigned as depicted in
Figure 2.
Figure 1.
COSY, HMBC and selected NOESY correlations of compounds 1, 3, and 4.
Figure 1.
COSY, HMBC and selected NOESY correlations of compounds 1, 3, and 4.
Figure 2.
Structures of compounds 1–8.
Figure 2.
Structures of compounds 1–8.
Compound
2 was also obtained as a yellow solid. The molecular formula of C
18H
17N
3O
2 was deduced from its HRESIMS data (
m/
z 308.1400 [M + H]
+) in combination with extensive NMR analyses. The NMR data for
2 indicated an overall structure similar to
1, with the only difference at the side chain substituted to C-11 (
Table 1 and
Table 2). The
1H NMR data for
2 lacked two overlapped methyl doublets at δ
H 0.99, and instead one methyl doublet at δ
H 1.31 and one methyl triplet at δ
H 0.91 were evident. These data suggested that the isobutyl group in
1 was replaced by a
sec-butyl group in
2, which was supported by the COSY correlations of H
2-14 (δ
H 1.65/1.94)/H
3-15 (δ
H 0.91) and H-13 (δ
H 3.51)/H
3-16 (δ
H 1.31), as well as the HMBC correlations from H
2-14 and H
3-15 to C-13 (δ
C 37.7), and from H-13, H
2-14, and H
3-16 to C-11 (δ
C 157.8).
Table 1.
13C NMR Data for Compounds 1–5.
Table 1.
13C NMR Data for Compounds 1–5.
| Carbon | 1 a | 2 a | 3 b | 4 b | 5 b |
|---|
| 2 | 126.5 | 126.6 | 147.6 | 125.7 | 125.3 |
| 3 | 118.6 | 116.9 | 122.5 | 114.6 | 115.5 |
| 3a | 148.2 | 148.3 | 149.6 | 145.6 | 146.2 |
| 5 | 147.4 | 147.5 | 156.1 | 144.8 | 144.4 |
| 6 | 116.9 | 116.9 | 117.8 | 116.2 | 116.2 |
| 6a | 137.1 | 137.2 | 139.3 | 134.8 | 134.8 |
| 7 | 99.2 | 99.3 | 99.6 | 97.4 | 97.2 |
| 8 | 157.3 | 157.3 | 162.3 | 156.8 | 156.4 |
| 9 | 119.5 | 120.9 | 96.3 | 126.2 | 126.2 |
| 9a | 126.7 | 126.5 | 155.7 | 129.4 | 129.4 |
| 9b | 112.8 | 112.9 | 116.8 | 112.3 | 112.4 |
| 8-OCH3 | 56.3 | 56.4 | 56.1 | 56.6 | 56.5 |
| 9-OCH3 | | | 52.0 | | |
| 10 | | | 60.0 | | |
| 11 | 153.9 | 157.8 | 15.3 | 151.8 | 146.7 |
| 12 | 150.7 | 150.3 | | 34.3 | 36.2 |
| 13 | 42.4 | 37.7 | | 29.2 | 28.8 |
| 14 | 26.7 | 27.3 | | 12.1 | 22.7 |
| 15 | 22.6 | 11.9 | | 19.2 | 22.7 |
| 16 | 22.6 | 17.9 | | | |
Compound
3 was obtained as a yellow solid. The molecular formula was determined as C
15H
16N
2O
3 by an HRESIMS ion peak at
m/
z 295.1058 [M + Na]
+. The
1H NMR spectrum revealed the resonances for two sets of coupled protons at δ
H 8.93 (d,
J = 5.4 Hz) and 7.87 (d,
J = 5.4 Hz), as well as 8.91 (d,
J = 4.8 Hz) and 7.14 (d,
J = 4.8 Hz), one singlet at δ
H 6.14, and two methoxy groups at δ
H 3.96 and 3.22, indicating the characteristic patterns for aaptamine congener [
16]. The COSY and key HMBC correlations gave the postulated structure (
Figure 1,
Supplementary Figures S25 and S26). HMBC correlation from the methoxy (δ
H 3.22) to C-9 (δ
C 96.3) indicated that the methoxy was tethered to C-9. In addition, the remaining unassigned signals, one oxymethylene (δ
H/δ
C 3.23 and 3.47/60.0), and one methyl (δ
H/δ
C 1.13/15.3) were determined as an ethoxy group by COSY correlations of H-10a (δ
H 3.23)/H
3-11 (δ
H 1.13) and H-10b (δ
H 3.47)/H
3-11, which was placed at C-9 by the HMBC correlations from H-10a and H-10b to C-9. Based on these data, the structure of compound
3 can be unambiguously assigned as a methylethylketal derivative of demethyl(oxy)aaptamine as shown in
Figure 2. Compound
3, however, could possibly be an artifact from the extraction process with EtOH as a solvent.
Table 2.
1H NMR Data for Compounds 1–5 (J in Hz).
Table 2.
1H NMR Data for Compounds 1–5 (J in Hz).
| Position | 1 a | 2 a | 3 b | 4 b | 5 b |
|---|
| 2 | 8.73, d (8.0) | 8.76, d (8.0) | 8.93, d (5.4) | 8.27, d (7.2) | 8.18, d (7.2) |
| 3 | 7.48, d (8.0) | 7.49, d (8.0) | 7.87, d (5.4) | 7.57, d (7.2) | 7.43, d (7.2) |
| 5 | 8.70, d (5.5) | 8.71, d (5.5) | 8.91, d (4.8) | 8.65, d (6.0) | 8.68, d (6.0) |
| 6 | 7.76, d (5.5) | 7.68, d (5.5) | 7.14, d (4.8) | 7.72, d (6.0) | 7.43, d (6.0) |
| 7 | 7.39, s | 7.40, s | 6.14, s | 7.13, s | 7.01, s |
| 8-OCH3 | 4.12, s | 4.13, s | 3.96, s | 4.29, s | 4.26, s |
| 9-OCH3 | | | 3.22, s | | |
| 10a | | | 3.23, m | | |
| 10b | | | 3.47, m | | |
| 11 | | | 1.13, t, (7.2) | | |
| 12 | | | | 3.45, m | 3.16, d (7.2) |
| 13a | 2.91, d (7.0) | 3.51, m | | 1.96, m | 2.44, m |
| 13b | | | | 2.16, m | |
| 14a | 2.34, m | 1.65, m | | 0.98, t (7.2) | 1.08, d (7.2) |
| 14b | | 1.94, m | | | |
| 15 | 0.99, d (7.0) | 0.91, t (7.0) | | 1.62, d (6.6) | 1.08, d (7.2) |
| 16 | 0.99, d (7.0) | 1.31, d (7.0) | | | |
Compound
4 was isolated as a yellow solid. The molecular formula was established as C
17H
17N
3O on the basis of its HRESIMS spectrum, indicating the presence of 11 degrees of unsaturation. All 17 carbons were well resolved in the
13C NMR spectrum, and were classified by chemical shifts, DEPT and HSQC spectra as seven quaternary carbons (δ
C 156.8, 151.8, 145.6, 134.8, 129.4, 126.2, and 112.3), five olefinic methines (δ
C 144.8, 125.7, 116.2, 114.6, and 97.4), one methoxy (δ
C 56.6), one methine (δ
C 34.3), one methylene (δ
C 29.2), and two methyl groups (δ
C 19.2, 12.1). In the
1H NMR spectrum, the presence of two sets of coupled protons at H-2 (δ
H 8.27, d,
J = 7.2 Hz) and H-3 (δ
H 7.57, d,
J = 7.2 Hz), and H-5 (δ
H 8.65, d,
J = 6.0 Hz) and H-6 (δ
H 7.72, d,
J = 6.0 Hz), one isolated singlet at H-7 (δ
H 7.13, s), and one aromatic methoxy proton signal at 8-OCH
3 (δ
H 4.29, s), indicated that compound
4 was an aaptamine congener, with an 1,9-disubstituted-8-methoxybenzo[
de][1,6]naphthyridine skeleton [
16]. Key HMBC correlations shown in
Figure 1 confirmed this proposal structure (
Supplementary Figure S35). Apart from these signals, two methyls (δ
H/δ
C 0.98/12.1, and 1.62/19.2), one methylene (δ
H/δ
C 1.96, 2.16/29.2), one methine (δ
H/δ
C 3.45/34.3), and one quaternary sp
2 carbon (δ
C 151.8) remained unassigned. Furthermore, COSY correlations of H
3-14 (δ
H 0.98)/H-13a (δ
H 1.96), H
3-14/H-13b (δ
H 2.16), and of H
3-15 (δ
H 1.62)/H-12 (δ
H 3.45), together with the key HMBC correlations from H-13a and H-13b to C-12 (δ
C 34.3), from H
3-14 to C-12, and from H-12 to C-13 (δ
C 29.2) established the presence of a
sec-butyl group. Significant HMBC correlations from H-12, H-13a, H-13b, and H-15 to C-11 (δ
C 151.8) suggested the
sec-butyl group connected to the quaternary sp
2 carbon C-11 (
Figure 1). On the basis of one still unassigned degree of unsaturation, the deshielded resonance of C-12, as well as the comparison of the
13C NMR data of the C-11 with the literature data of known alkaloids possess triaza-cyclopenta[
cd]phenalene skeleton isolated by Laurent Calcul and co-workers [
16], C-11 was directly tethered to N-1 and N-10. Therefore, the structure of compound
4 was unambiguously assigned. However, the absolute configuration of C-12 could not be definitively determined on the basis of spectral data.
Compound
5 was also isolated as a yellow solid, assigned a molecular formula of C
17H
17N
3O, implying 11 degrees of unsaturation, as deduced from the HRESIMS spectrum. The
13C NMR and DEPT spectra exhibited 17 carbon resonances corresponding to two methyl, one methoxy, one methylene, six methine, and seven quaternary carbons. Moreover, the overall appearance of the NMR spectrum geared to compound
5 showed close structural similarity between
4 and
5, indicating the same triaza-cyclopenta[
cd]phenalene skeleton, except for that C-11 was substituted by an isobutyl group in
5. This was also confirmed by the COSY correlations of H
3-14 (δ
H 1.08)/H-13 (δ
H 2.44), H-13/H
3-15 (δ
H 1.08), and H-13/H
2-12 (δ
H 3.16), and the HMBC correlations from H
2-12 and H-13 to C-11 (δ
C 146.7). Thus, compound
5 was identified as shown in
Figure 2.
Besides the five new compounds
1–
5, the known compounds 2-isopropyl-10-methoxyimidazo[4,5,1-ij]pyrido[2,3,4-de]quinoline (
6) [
16], 3-(phenethylamino)demethyl(oxy)aaptamine (
7) [
10], and 3-(isopentylamino)demethyl(oxy)aaptamine (
8) [
10] were also obtained and elucidated by comparison of their physical and spectroscopic features with the data reported in the literature (
Supplementary Table S1 and Figures S51–S56).
All the isolated compounds, except
1–
2, were tested for antifungal activity against six fungi, including
Candida parapsilosis,
C. glabrata,
C. albicans,
Cryptococcus neoformans,
Trichophyton rubrum, and
Microsporum gypseum, using fluconazole as a positive control (
Table 3). Compound
7 showed antifungal activity against
C. albicans,
C. parapsilosis,
C. neoformans,
T. rubrum, and
M. gypseum with MIC values of 32, 64, 32, 4, and 16 μg/mL, respectively. Compound
8 displayed potential antifungal activity against fungi
C. neoformans,
T. rubrum, and
M. gypseum with MIC values of 64, 8, and 32 μg/mL, respectively. The rest compounds tested exhibited weak activity against the above fungi. In addition, these compounds, except
1–
2, were also assessed for their inhibitory activity against HIV-1 replication, compounds
6–
8 inhibited 27.7%, 88.0%, and 72.3%, respectively, while the other isolates were inactive at the same concentration.
Table 3.
Antifungal and Anti-HIV-1 Activities of Compounds 3–8.
Table 3.
Antifungal and Anti-HIV-1 Activities of Compounds 3–8.
| Compound | Antifungal Activity | Anti-HIV-1 Activity (10 μM) |
|---|
| C. albicans | C. parapsilosis | C. neoformans | C. glabrata | T. rubrum | M. gypseum |
|---|
| 3 | >64 | 32 | >64 | >64 | > 64 | > 64 | NA |
| 4 | >64 | > 64 | >64 | >64 | > 64 | 64 | NA |
| 5 | >64 | > 64 | >64 | >64 | > 64 | 64 | NA |
| 6 | >64 | > 64 | >64 | >64 | > 64 | 64 | 27.7% |
| 7 | 32 | 64 | 32 | >64 | 4 | 16 | 88.0% |
| 8 | >64 | >64 | 64 | >64 | 8 | 32 | 72.3% |
| fluconazole | 0.25 | 1.00 | 0.25 | 2 | 4 | 16 | NT |
3. Experimental Section
3.1. General Experimental Procedures
Optical rotation data were carried out on a Perkin-Elmer model 341 polarimeter (Perkin-Elmer Inc., Waltham, MA, USA) with a 1 dm cell. UV and IR (KBr) spectra were performed on a Hitachi U-3010 spectrophotometer (Hitachi Inc., Tokyo, Japan) and Jasco FTIR-400 spectrometer (Jasco Inc., Tokyo, Japan), respectively. 1H, 13C, DEPT135, COSY, HSQC, HMBC, and NOESY NMR spectra were recorded at room temperature (rt) on Bruker AVANCE-600 and Bruker AMX-500 instruments (Bruker Biospin Corp., Billerica, MA, USA). HRESIMS and ESIMS data were obtained on a Waters Q-Tof micro YA019 mass spectrometer (Waters Corp., Milford, MA, USA). Reversed-phase HPLC was performed on YMC-Pack Pro C18 RS (5 μm) columns (YMC Co. Ltd., Kyoto, Japan) with a Waters 1525 separation module (Waters Corp., Milford, MA, USA) equipped with a Waters 2998 Photodiode Array (PDA) detector (Waters Corp., Milford, MA, USA). Silica gel (200-300 mesh, Qingdao Ocean Chemical Co., Qingdao, China), Sephadex LH-20 (18-110 μm, Pharmacia Co., Piscataway, NJ, USA), and ODS (50 μm, YMC Co. Ltd., Kyoto, Japan) were used for column chromatography. TLC was carried out using HSGF 254 plates (Qingdao Ocean Chemical Co., Qingdao, China) and visualized by spraying with anisaldehyde-H2SO4 reagent.
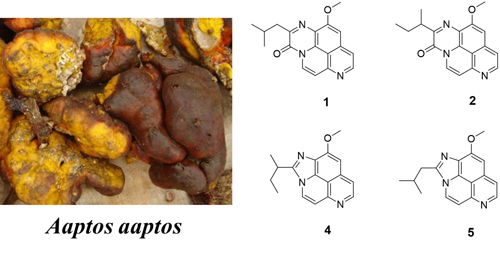
3.2. Animal Material
The sponge samples were collected off Woody (Yongxing, Hainan, China) Island and Seven Connected Islets in the South China Sea in June 2007, and identified as A. aaptos by Jin-He Li (Institute of Oceanology, Chinese Academy of Sciences, Qingdao, China), A voucher sample (No. OLS) was deposited in the Laboratory of Marine Drugs, Department of Pharmacy, Changzheng Hospital, Second Military Medical University, Shanghai, China.
3.3. Extraction and Isolation
The air-dried sponge (2.3 kg, dry weight) was powdered, and extracted with 95% aqueous EtOH at rt. The combined extracts were concentrated under reduced pressure to yield the crude extract (109.7 g), which was suspended in H2O and extracted with CH2Cl2 and n-BuOH to afford the CH2Cl2- and n-BuOH-soluble extracts. The CH2Cl2-soluble extract (84.4 g) was partitioned between 90% aqueous MeOH and n-hexane, and n-hexane layer was collected and concentrated under reduced pressure to afford the n-hexane-soluble extract (52.0 g). The 90% aqueous MeOH phase was diluted to 60% aqueous MeOH with H2O, which was extracted with CH2Cl2 to afford the CH2Cl2-soluble extract (14.2 g). The CH2Cl2-soluble extract was subjected to vacuum liquid chromatography (VLC) on silica gel by gradient elution using CH2Cl2/MeOH (100:1, 80:1, 60:1, 50:1, 30:1, 20:1, 10:1, 8:1, 5:1, 1:1, 0:1, v/v) as solvents to give seven fractions (A–G). Fraction B (1.8 g) was subjected to column chromatography (CC) on Sephadex LH-20 with CH2Cl2/MeOH (1:1) as the eluting solvent to afford six subfractions (B1–B6). Subfraction B3 was separated by column chromatography (CC) on ODS (50 μm) eluting with MeOH-H2O (2:3–1:0) to give six fractions (Fr.B31–B36). Compound 3 (13.0 mg) was obtained by preparative TLC from Fr.B33. Fraction D (1.8 g) was separated by CC on silica gel eluting in a stepwise manner with CH2Cl2/MeOH (60:1, 50:1, 30:1, 15:1, 10:1, 5:1, 0:1, v/v) to afford six fractions (D1–D6). Fraction D4 was purified by reversed-phase HPLC with an elution of 50% MeCN detected at the wavelength of 249 nm to give metabolites 7 (2.0 mL/min, tR = 11.5 min, 18.6 mg), and 8 (2.0 mL/min, tR = 12.8 min, 5.8 mg). Fraction D5 were isolated by reversed-phase HPLC eluting with 50% MeCN detected at 254 nm to afford 6 (2.0 mL/min, tR = 28.5 min, 1.5 mg), 4 (2.0 mL/min, tR = 30.3 min, 2.5 mg), and 5 (2.0 mL/min, tR = 31.5 min, 1.5 mg), whereas the purification of D6 by reversed-phase HPLC eluting with 80% MeCN detected at 244 nm resulted in the isolation of 1 (2.0 mL/min, tR = 15.0 min, 2.3 mg), 2 (2.0 mL/min, tR = 16.3 min, 2.0 mg).
2-Isobutyl-11-methoxy-3
H-[1,6]naphthyridino[6,5,4-
def]quinoxalin-3-one (
1): yellow solid; UV (MeOH) (log ε) λ
max 208 (4.31), 224 (4.36), 273 (3.96), 282 (4.22), 412 (4.18), 434 (4.12); IR (KBr) ν
max 3404, 2955, 2926, 2856, 1730, 1663, 1638, 1597, 1527, 1472, 1387, 1320, 1256, 1174, 1098, 1010, 849 cm
−1;
1H and
13C NMR data, see
Table 1 and
Table 2; HRESIMS
m/
z 330.1220 [M + Na]
+ (calcd for C
18H
17N
3O
2Na, 330.1218).
2-(
Sec-butyl)-11-methoxy-3
H-[1,6]naphthyridino[6,5,4-
def]quinoxalin-3-one (
2): yellow solid;
3.10 (
c 0.10, MeOH); UV (MeOH) (log ε) λ
max 204 (3.82), 224 (3.78), 273 (3.56), 282 (3.59), 391 (3.35), 410 (3.53), 432 (3.49); IR (KBr) ν
max 3371, 2960, 2927, 2855, 1728, 1665, 1637, 1597, 1527, 1469, 1383, 1320, 1257, 1176, 1100, 1032, 846 cm
−1;
1H and
13C NMR data, see
Table 1 and
Table 2; HRESIMS
m/
z 308.1400 [M + H]
+ (calcd for C
18H
18N
3O
2, 308.1399).
9-Ethoxy-8,9-dimethoxy-9
H-benzo[
de][1,6]naphthyridine (
3): yellow solid;
−7.16 (
c 0.15, MeOH); UV (MeOH) (log ε) λ
max 202 (3.59), 229 (3.67), 352 (3.23); IR (KBr) ν
max 3064, 2928, 2855, 1716, 1673, 1641, 1570, 1490, 1458, 1413, 1371, 1349, 1305, 1276, 1223, 1201, 1176, 1075, 694, 917, 869, 656, 575 cm
−1;
1H and
13C NMR data, see
Table 1 and
Table 2; HRESIMS
m/
z 295.1058 [M + Na]
+ (calcd for C
15H
16N
2O
3Na, 295.1059).
2-(
Sec-butyl)-10-methoxyimidazo[4,5,1-
ij]pyrido[2,3,4-
de]quinolone (
4): yellow solid;
−15.98 (
c 0.12, MeOH); UV (MeOH) (log ε) λ
max 210 (4.00), 225 (3.98), 239 (4.03), 272 (3.71), 360 (3.55); IR (KBr) ν
max 3315, 3065, 2960, 2926, 2854, 1731, 1688, 1607, 1573, 1515, 1465, 1419, 1366, 1307, 1279, 1167, 1020, 840, 799 cm
−1;
1H and
13C NMR data, see
Table 1 and
Table 2; HRESIMS
m/
z 280.1452 [M + H]
+ (calcd for C
17H
18N
3O, 280.1450).
2-Isobutyl-10-methoxyimidazo[4,5,1-
ij]pyrido[2,3,4-
de]quinolone (
5): yellow solid; UV (MeOH) (log ε) λ
max 211 (4.10), 225 (4.09), 239 (4.14), 272 (3.82), 361 (3.66); IR (KBr) ν
max 3342, 3050, 2957, 2925, 2869, 2853, 1729, 1688, 1607, 1572, 1542, 1515, 1465, 1420, 1348, 1324, 1307, 1279, 1194, 1167, 1020, 840 cm
−1;
1H and
13C NMR data, see
Table 1 and
Table 2; HRESIMS
m/
z 280.1448 [M + H]
+ (calcd for C
17H
18N
3O, 280.1450).
3.4. Antifungal Evaluation
Concentration (MIC) values of compounds
3–
8 were determined against six indicators (
C. parapsilosis,
C. glabrata,
C. albicans,
C. neoformans,
T. rubrum, and
M. gypseum), following the National Center for Clinical Laboratory Standards (NCCLS) methods [
17,
18]. Fluconazole was used as the positive control. Briefly, samples (dissolved in DMSO) were serially diluted in 20% DMSO/saline and transferred (10 μL) in duplicate to 96 well flat bottom microplates. Bacterial strains were grown aerobically at 0 °C in SDA for 16–20 h. A set of different concentrations of compounds
3–
8 prepared in RPMI 1640 were next inoculated with the microorganisms and incubated 24 h for
C. parapsilosis, and
C. glabrata at 35 °C, 46 h for
C. albicans at 35 °C, 72 h for
C. neoformans at 35 °C, and 4–7 days for
T. rubrum and
M. gypseum at 30 °C. The MIC values were evaluated in triplicate for each compound.
3.5. Anti-HIV-1 Activity Assay
The antiviral activity against HIV-1 was evaluated by using a cell-based VSVG/HIV-1 pseudotyping system as described [
19,
20]. For the infection assay, briefly, 293T cells were plated on 24-well plates at the density of 6 × 10
4 cells per well one day prior to infection. Compounds with the concentrations of 10 μM were incubated with target cells for 15 min prior to adding VSVG/HIV-1. The same amount of solvent alone was used as blank control. After postinfection for 48 h, cells were lysed in 50 μL Cell Lysis Reagent (Promega Corp., Beijing, China). Luciferase activity of the cell lysate was measured by a FB15 luminometer (Berthold Detection Systems, Titertek-Berthold, Pforzheim, Germany).

 ,
, 
