Abstract
This study aims to analyze the nexus between CO2 emissions, urbanization, and economic activity, as well as identify whether the pollution haven hypothesis is proven in Indonesia. It utilized time series data of Indonesia during the 1971–2019 period. Furthermore, the vector error correction model (VECM) was used to determine the long-run and short-run interplay using cointegration and Granger causality approaches. The empirical results showed the pollution haven hypothesis occurred in Indonesia. A long-term relationship with CO2 emissions was observed from the model. In addition, unidirectional causality occurred from urbanization, economic growth, exports, and foreign direct investment to CO2 emissions in the short term. It was concluded that the achievement of the Paris Agreement will be successful when the committed countries are courageous in transforming their economy. However, major adjustments are needed, where all parties need to have the same vision towards net zero carbon.
1. Introduction
The 2021 UN climate change conference (COP26) was held in Glasgow, Scotland, on 31 October–12 November 2021. This event is an extension of the Paris Agreement and serves as a reminder that a big agenda needs to be immediately carried out to address climate change due to human activities. Several countries are challenged with the trade-off between economic growth and environmental degradation. The environmental Kuznets curve (EKC) hypothesis explains an inverted U-shaped relationship between economic growth and environmental degradation. This means environmental pressure increases in the early stages of economic growth due to the increased release of pollutants as well as extensive and intensive exploitation of natural resources associated with greater use of production (Grossman and Krueger 1991; Özokcu and Özdemir 2017; Shahbaz et al. 2019; Rahman et al. 2020).
Also, it is found that the efforts to reach a turning point are challenging in terms of improving environmental quality. CO2 emissions are increased when economic development activities are high. This indicates that the quicker the regional economic growth, the worse the air pollution (Hossain 2011; Ben Abdallah et al. 2013; Hasanov et al. 2018).
Before the pandemic, Indonesia was ranked as one of the world’s emerging markets at the end of 2019. In fact, the economic growth has been reasonably consistent at about 5.1% in 2019 due to the strong trust of foreign investors. However, in 2015, Indonesia became the fourth-largest emitter of greenhouse gases, which is a major source of concern. According to the World Bank Indicators released in 2020, there was an increase in CO2 emissions of 4.4%/year on average between 2001 and 2018. The highest increase and lowest decrease in the emissions occurred in 2011 and 2013 at 14.8% and 7.5%, respectively. Furthermore, the economic performance increased by 0.1–0.28 points, but the air quality decreased by more than 10%, a condition that will be a threat to Indonesia. According to the World Bank, about 220 million Indonesians will live in cities and towns by 2045. Consequently, the high population density will lead to accelerated economic activity in the region. This is in line with Liang et al. (2019), who stated that rapid urbanization will promote social and economic development but raise some environmental pollution problems (Camagni et al. 1998). This implies that environmental quality will deteriorate as more resources are used to promote economic activity.
COP26 provides momentum for the nation to prepare risk mitigation in international trade with the application of levies on carbon emissions. Empirical studies related to the influence of international trade in Indonesia showed different results. Bhattacharya et al. (2017) found that there was no significant effect between trade openness and CO2 emissions. Meanwhile, Nathaniel (2020) stated that Indonesian trade can reduce natural CO2 emissions in the short-term but exacerbate environmental degradation in the long-term. The open economic system has contributed to CO2 emissions (Chen et al. 2021a); therefore, this study focused more specifically on the relationship between exports and imports of CO2 emissions due to the carbon emission tax policy on international trade. In addition, it harbors suspicion about the two responses that are different from CO2 emissions; hence, separate identification is needed to determine the final policy. Studies of exports and imports have provided different results. Exports promote an increase in emissions (Salehnia et al. 2020) and also improve environmental quality (Hasanov et al. 2018; Pié et al. 2018). The result of import activities showed that imports cause environmental degradation (Hasanov et al. 2018; Pié et al. 2018; Salehnia et al. 2020), while Aljawareen and Saddam (2017) stated that it is a stimulus for improving air quality.
In advance, the existence of the pollution haven hypothesis needs to be tested. Salahuddin et al. (2019) used the link between trade openness induced by globalization to prove the pollution haven hypothesis. Meanwhile, this study examines whether foreign direct investment results in increased CO2 emissions. The reinforcing reason is that Indonesia has great potential for foreign investment. According to the United Nations Conference on Trade and Development (UNCTAD), Indonesia is among the top 20 developing countries that were the destination for FDI globally in 2017 and 2018. Hence, the relationship between investment and the environment in these countries can be examined to prove the pollution haven hypothesis. Based on previous studies, there is a two-way relationship between FDI and CO2 emissions (Tang and Tan 2015; Omri et al. 2014). The connection between CO2 emissions and FDI will be beneficial to the environment when the pollution haven hypothesis is not discovered (Chen et al. 2021b). Meanwhile, Omri et al. (2014) stated that FDI had a unidirectional relationship and a positive effect on CO2 emissions in Qatar. Kizilkaya (2017) discovered that foreign direct investment was ineffective on CO2 emissions in Turkey. Therefore, this study aims to analyze the interplay of urbanization, economic growth, exports, imports, foreign direct investment, and CO2 emissions. It also proves whether the pollution halo or haven hypotheses existed in Indonesia from 1971 to 2019. It is of prominent importance to developing countries or those highly dependent on international trade, related to the global commitment to reducing carbon emissions and the transition process toward a low-carbon country.
The theoretical basis and previous empirical studies are presented after the background of the study to comprehend the relationship between urbanization, economic growth, export, import, foreign direct investment, and CO2 emissions. Afterward, the methods section provides an overview of the variables used, and the stages carried out. The next section presents the results, which are subsequently deepened by the discussion, as well as the conclusions and policy implications.
2. Literature Review
The relationship between urbanization and environmental quality is founded on the concept of an urban area in which demand-driven activities center on cost reduction. This is due to its closeness to other regions with similar proximity, endowment resources, and high population density. In addition, because of this association, people are able to rationally relocate to urban areas. Urbanization is formed through socio-economic development. According to Pernia et al. (1983), population growth is often higher in rural areas than urban areas. This indicates that there is a direct demographic effect, which involves reducing the proportion of urban areas. It was also stated that population growth hampers economic development. This indicates that urbanization is either influenced directly or indirectly by socio-economic development, through population growth. Meanwhile, Firebaugh (1979) stated that it is influenced directly and indirectly by the deterioration of rural conditions and economic development, as well as previous urbanization, respectively. Hence, urbanization theory should consider the conditions in rural and urban areas because it is applied to both developed and developing countries.
The migration of people to urban areas is carried out through different phases of the urbanization process as follows (Sarungu 2001). Firstly, there is agrarian urbanization, which entails innovation in agricultural technology application and leads to an increase in assertive productivity. Secondly, there is urbanization in industrialized metropolitan areas. It is characterized by an increasing concentration of population and economic activity in the vicinity of major cities, as well as substantial infrastructure investment to facilitate efficient export and import operations (Turok and McGranahan 2013). Thirdly, in a growing metropolitan area, there is a postindustrial non-metropolitan counter urbanization, which is characterized by a reduction in the population’s physical and socioeconomic capacity.
The findings of empirical studies showed different results. Urbanization and pollution have bidirectional causality (Santillán-Salgado et al. 2020; Nosheen et al. 2020; Salahuddin et al. 2019; Amin et al. 2020; Abbasi et al. 2020;), while there is a one-way causality between urbanization and CO2 (Ponce and Alvarado 2019; Bashir et al. 2021). Specifically, several empirical studies were conducted to determine the process that occurs in post-industrial non-metropolitan counter-urbanization. Urban regions, road area per capita, and GDP were found to have negative effects on CO2 emissions (Qiu et al. 2019). Therefore, it needs to be controlled with careful planning and mitigation of CO2 emissions (Yang et al. 2015; Hassan et al. 2020) because emissions and urbanization have a relationship (Santillán-Salgado et al. 2020).
Previous studies showed an inverted U-shaped relationship between economic growth and environmental degradation which is in line with the environmental Kuznets curve (EKC) hypothesis (Borhan et al. 2012; Lin and Zhu 2018; Hanif 2018; Tang and Tan 2015; dan C. H. Wang et al. 2019). An initial study by Grossman and Krueger (1991) and Tanger et al. (2011) reported the inverse relationship between CO2 emissions and economic growth. The interesting outcome was presented by Hossain (2011) and Hossain (2012), which stated that several literatures had failed to establish an inverse U relationship with the real-life data. Particularly in developed and developing countries, the studies that examined the causal relationship between energy consumption and growth produced three different results. Other studies reportedly discovered two-way causation, as well as unidirectional causes and causality direction from output growth to energy consumption.
Economists also conducted studies on the relationship between FDI and economic growth. Externalities were transferred from industrialized to developing countries, based on the assumption that FDI is an important asset to boost greater development. According to developing countries, the investment served as a means of transferring factors, due to the accelerating pace of general purpose technologies (GPT), while introducing advanced technology and science. This means the countries exploited these factors as assets to increase economic growth. Furthermore, FDI defines economic openness from a financial standpoint, which has been proven to promote economic growth, although this has not been shown in the United States (Omri et al. 2015). The consequence of this openness is the emergence of negative externalities. The pollution haven hypothesis was developed from the studies of Copeland and Taylor (1994) and Chen et al. (2021a). Based on this hypothesis, three dimensions (Aliyu 2005) were observed. Firstly, heavily polluting enterprises relocated from industrialized to developing countries, where strict environmental regulations were not enforced. Global free trade, on the other hand, has increased industrial and polluting activities by relocating to nations with weak environmental policies. Secondly, the transfer of hazardous waste from developed to developing countries (industrial production and nuclear energy). This issue was also the subject of the Basle Convention on hazardous waste. Thirdly, multinational companies involved in the production of petroleum and its products, as well as lumber and other forest resources, including the extraction of non-renewable natural resources in developing countries without control. These factors are related to conscious environmental policy decisions and how they impact the environment, production, and future trade. However, the pollution haven hypothesis has two empirical consequences, namely (1) FDI outflows in developed countries are positively correlated with environmental policy tightening, and (2) Pollution in developing countries is positively correlated with the inflows of FDI. The existence of foreign investment brings technological efficiency compared to those within the country (Balogh and Jámbor 2017; Adams et al. 2020; dan Salehnia et al. 2020). In addition, Aljawareen and Saddam (2017) showed that FDI had a positive interplay with CO2 emissions in Qatar. The selected studies about the pattern of CO2 emissions, urbanization, and economic activities are summarized in Table 1.

Table 1.
Literature review of pattern of CO2 emissions, urbanization, and economic activities.
3. Methodology
This study was conducted using a descriptive quantitative method. The data were obtained from the International Energy Agency in 2021 and the World Development Indicators (WDI) that were published by the World Bank in 2021. Furthermore, time series data were obtained from 1971 to 2019. This period was selected based on the consideration that the first UN Environmental Conference was conducted in Stockholm in 1971. The variables description is presented in Table 2.
Table 2.
Variables Description.
Besides urbanization and foreign direct investment, which is taken as the proportion of total GDP, all variables are expressed in the form of logarithms to minimize the effect of heteroscedasticity (Maparu and Mazumder 2017). Table 3 shows a summary of the descriptive statistics of variables.
Table 3.
Descriptive Statistics.
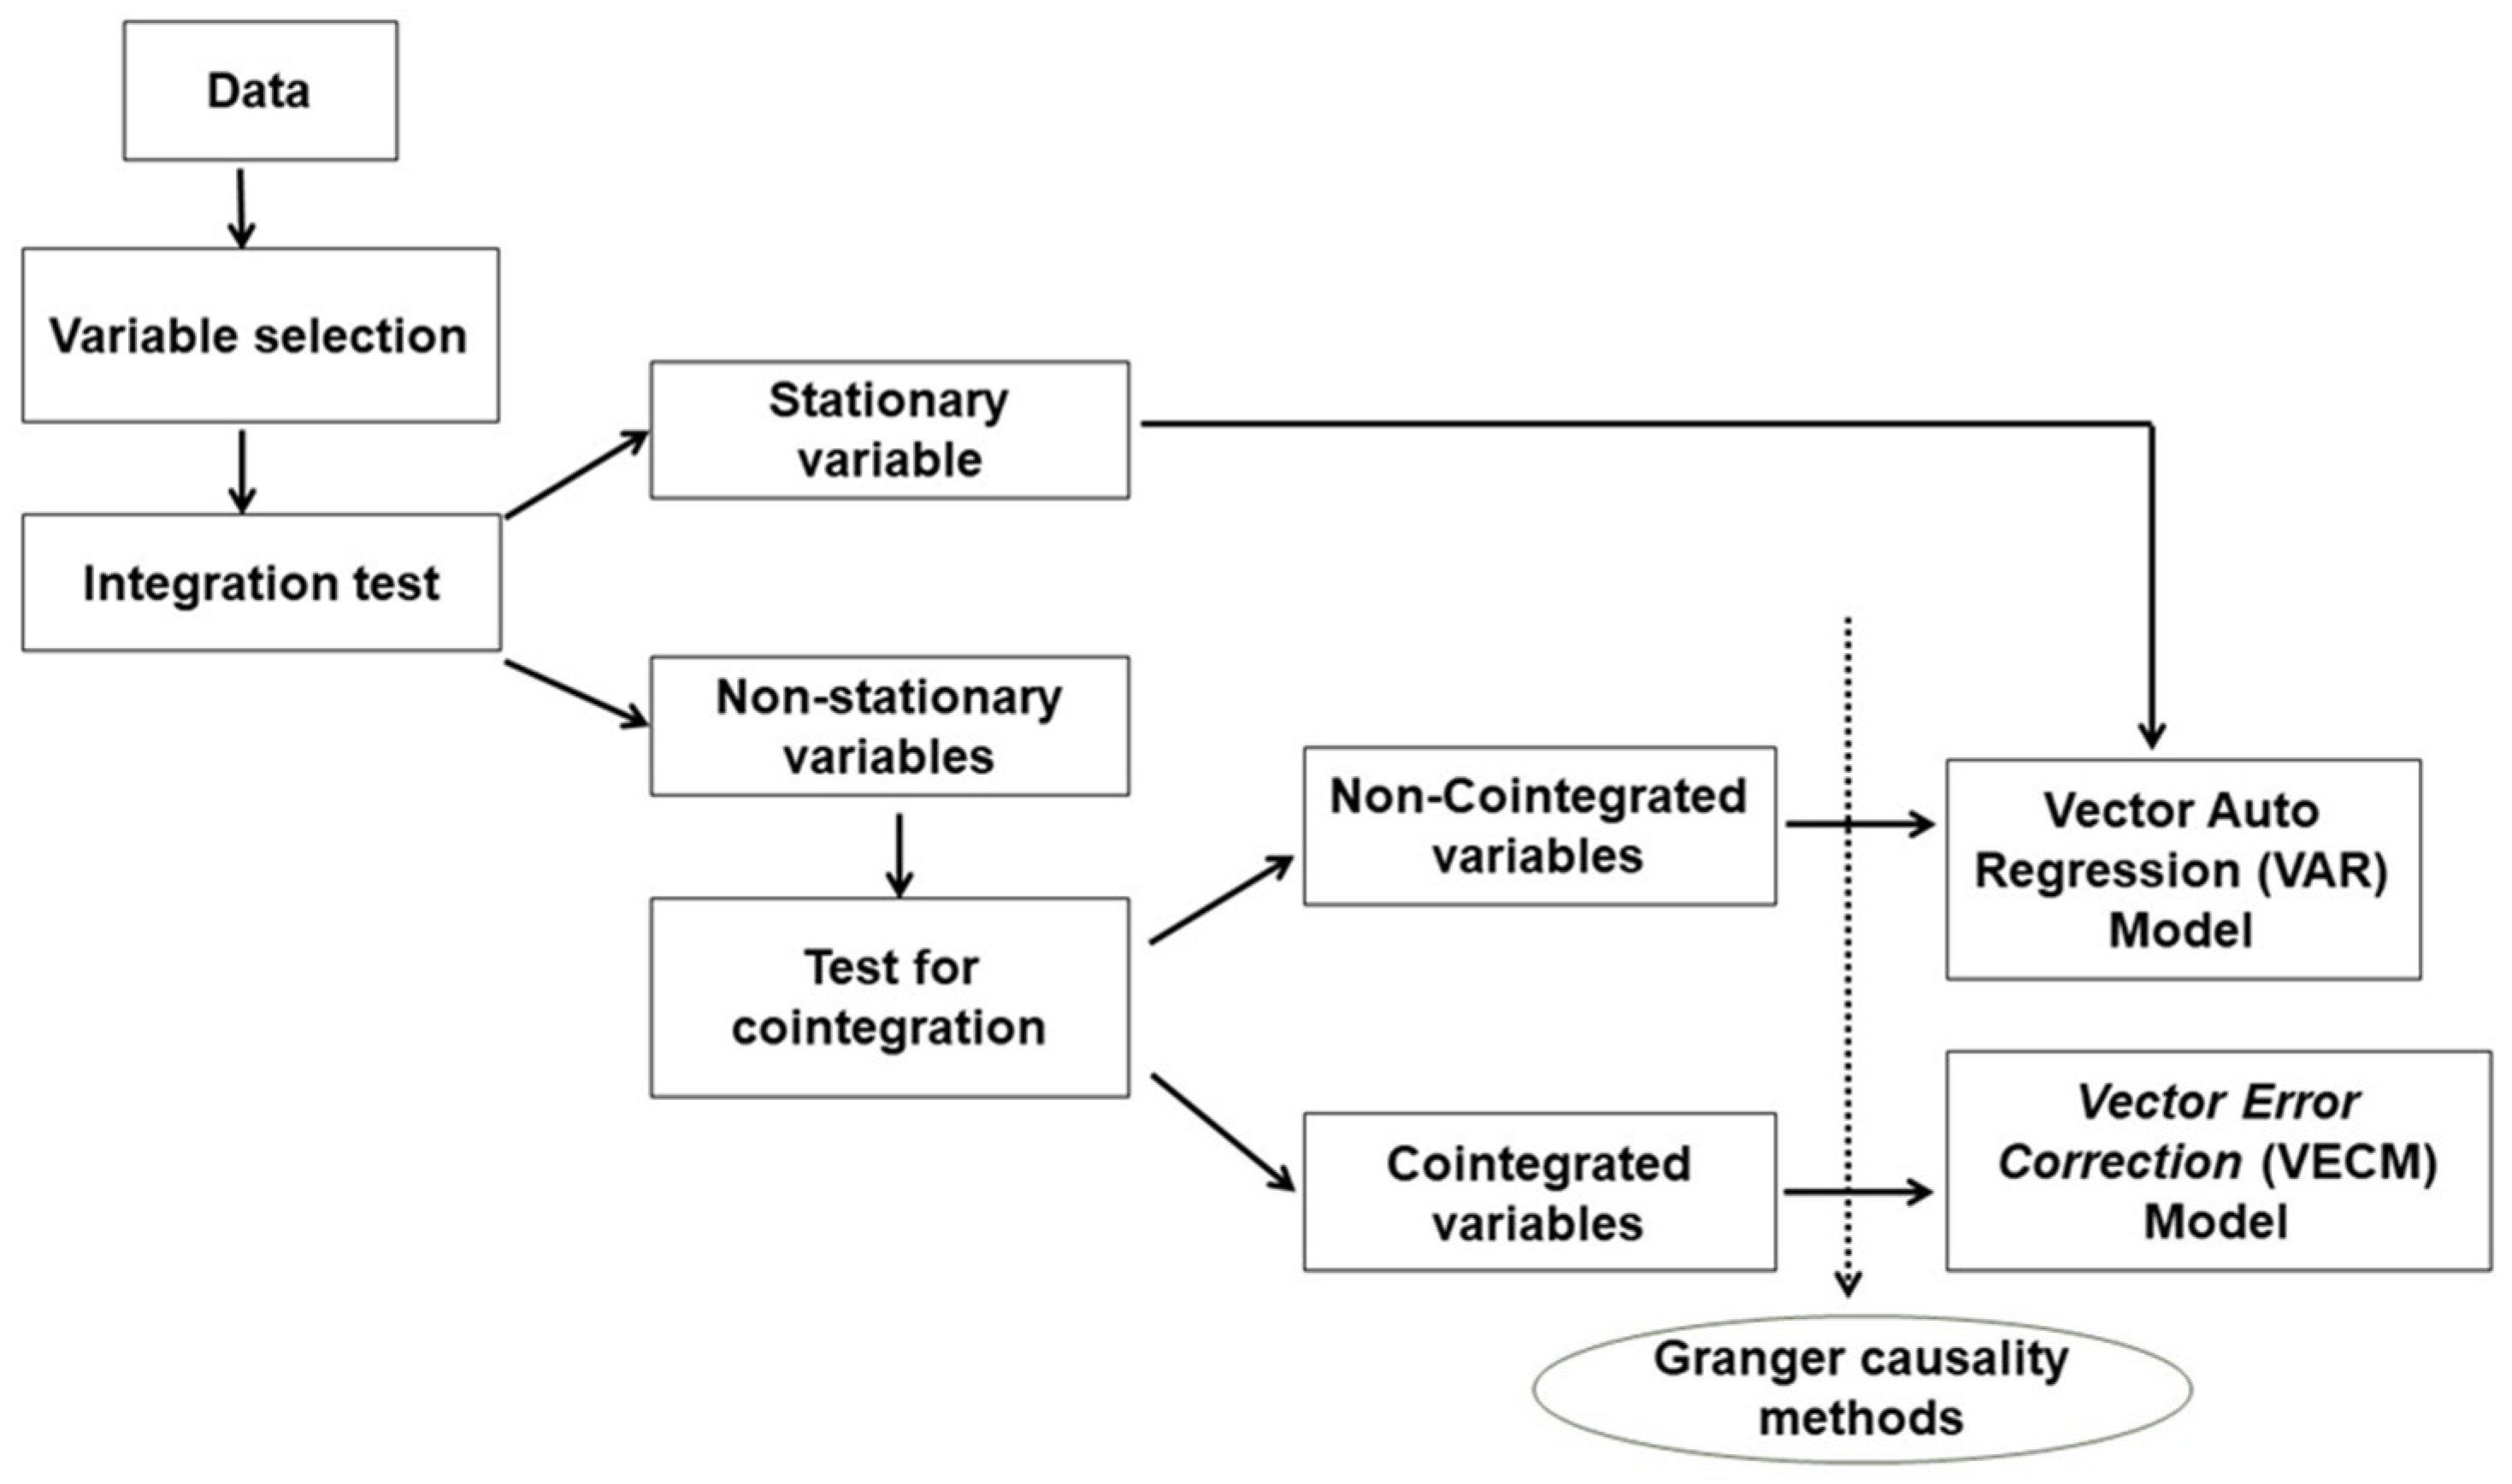
In this study, the analysis was conducted in different stages (Figure 1).
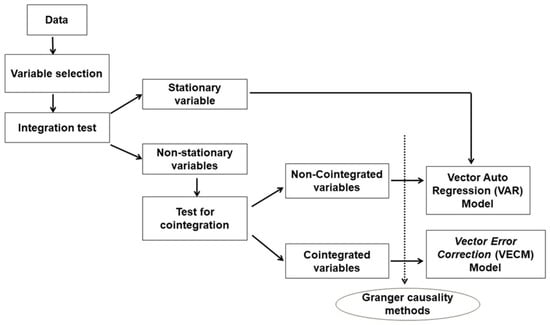
Figure 1.
Test Stages in Granger Causality.
The first step is to use a preliminary statistical test to verify stationarities for all variables. This is conducted through the usual unit root method, which is known as the augmented Dickey–Fuller test (ADF). This step is important for two reasons: (1) The causality test is highly sensitive to serial stationarity, and (2) most of the time-series data for macroeconomic indicators are non-stationary. The ADF test is very popular for testing sequence integration of variables. Empirically, Equation (1) is represented as follows:
where = time series to be tested, = the selected exogenous regressor that contained constants and trends, and = the parameters that should be estimated, = the white noise error terms, = the maximum lag length determined using Schwarz information and Akaike information criteria (SIC and AIC), and = delta. According to the second step, when both series were integrated from the same order, the lag length was determined through the AIC and SIC, with the presence of cointegration also checked. Furthermore, the null hypothesis (H0: δ = 0) was tested against the alternative (Ha: δ < 0). When the null hypothesis is true, the existence of a unit root is confirmed, with the series observed as non-stationary. However, when the null hypothesis is rejected, stationary series are indicated.
Based on this study, the cointegration test was carried out through the Johansen method by focusing on the statistical value of the trace and maximum Eigen analysis value. The vector error correction model (VECM) is used when variables are co-integrated. However, when not co-integrated, the vector auto regression (VAR) model is used. Therefore, the general model for the regression is shown as follows (Maparu and Mazumder 2017):
where, = the vector of the non-stationary variable k I (1), = the vector of the deterministic variable, and = the parameters to be calculated, = the innovation vector, and p = the VAR sequence.
According to the Granger causality test for equation (2), a variable (x) was stated to be a Granger causal to the other (y). This was observed when the lagging value of x increased the predictability of y, provided that other data were present. Moreover, the bivariate causality was divided into 3 categories, as follows: (1) Unidirectional: This causality was direct from x to y, when the coefficient on lagged xt was significantly different from zero as a group. It was also directed from x to y, when yt is the dependent variable and the coefficient on lagged yt does not differ significantly from zero. The causality was also directed from x to y when xt is the dependent variable. (2) Bidirectional: This indicated a relationship between x and y when the coefficient on the lagged xt significantly differed from zero as a group. Moreover, it indicated a relationship, when yt is the dependent variable. The coefficient on lagged yt was significantly different from zero, when xt is the dependent variable. (3) Independence: The causality occurred when the coefficients on xt and yt lagged were significantly different from zero in both equations.
If the variables are cointegrated, the vector error correction model (VECM) can be used instead of VAR. Equation (3) shows the general model for VECM.
where, is the first difference operator, and = the parameters to be calculated, = the white noise error terms, and q = the maximum lag length.
The vector error correction model (VECM) can be used for testing Granger causality between the variables of CO2 emissions, urbanization, economic growth, exports, imports, and foreign direct investment. The empirical equation of VECM is presented as follow:
where and are the coefficients to be estimated and is the lagged residual term derived from the long-run relationship. If is negative and significantly different from zero, it is a long-term interplay. is the maximum lag length, is the first difference operator, and is the error term.
Recall Equation (4). We can break it down into the following equations:
The long-term equilibrium is shown by the negative ECT coefficient. It indicates a correction of the variable movement towards its long-term equilibrium; hence, the coefficient should be negative. This indicates that the closer to zero the coefficient values are, the quicker the adjustment towards long-run equilibrium.
4. Results and Discussion
4.1. Empirical Results
Before examining cointegration between variables, we present an overview related to CO2 emissions in Indonesia during the period 1971–2019. This is necessary to find out its role towards net zero emissions through the vector error correction model.
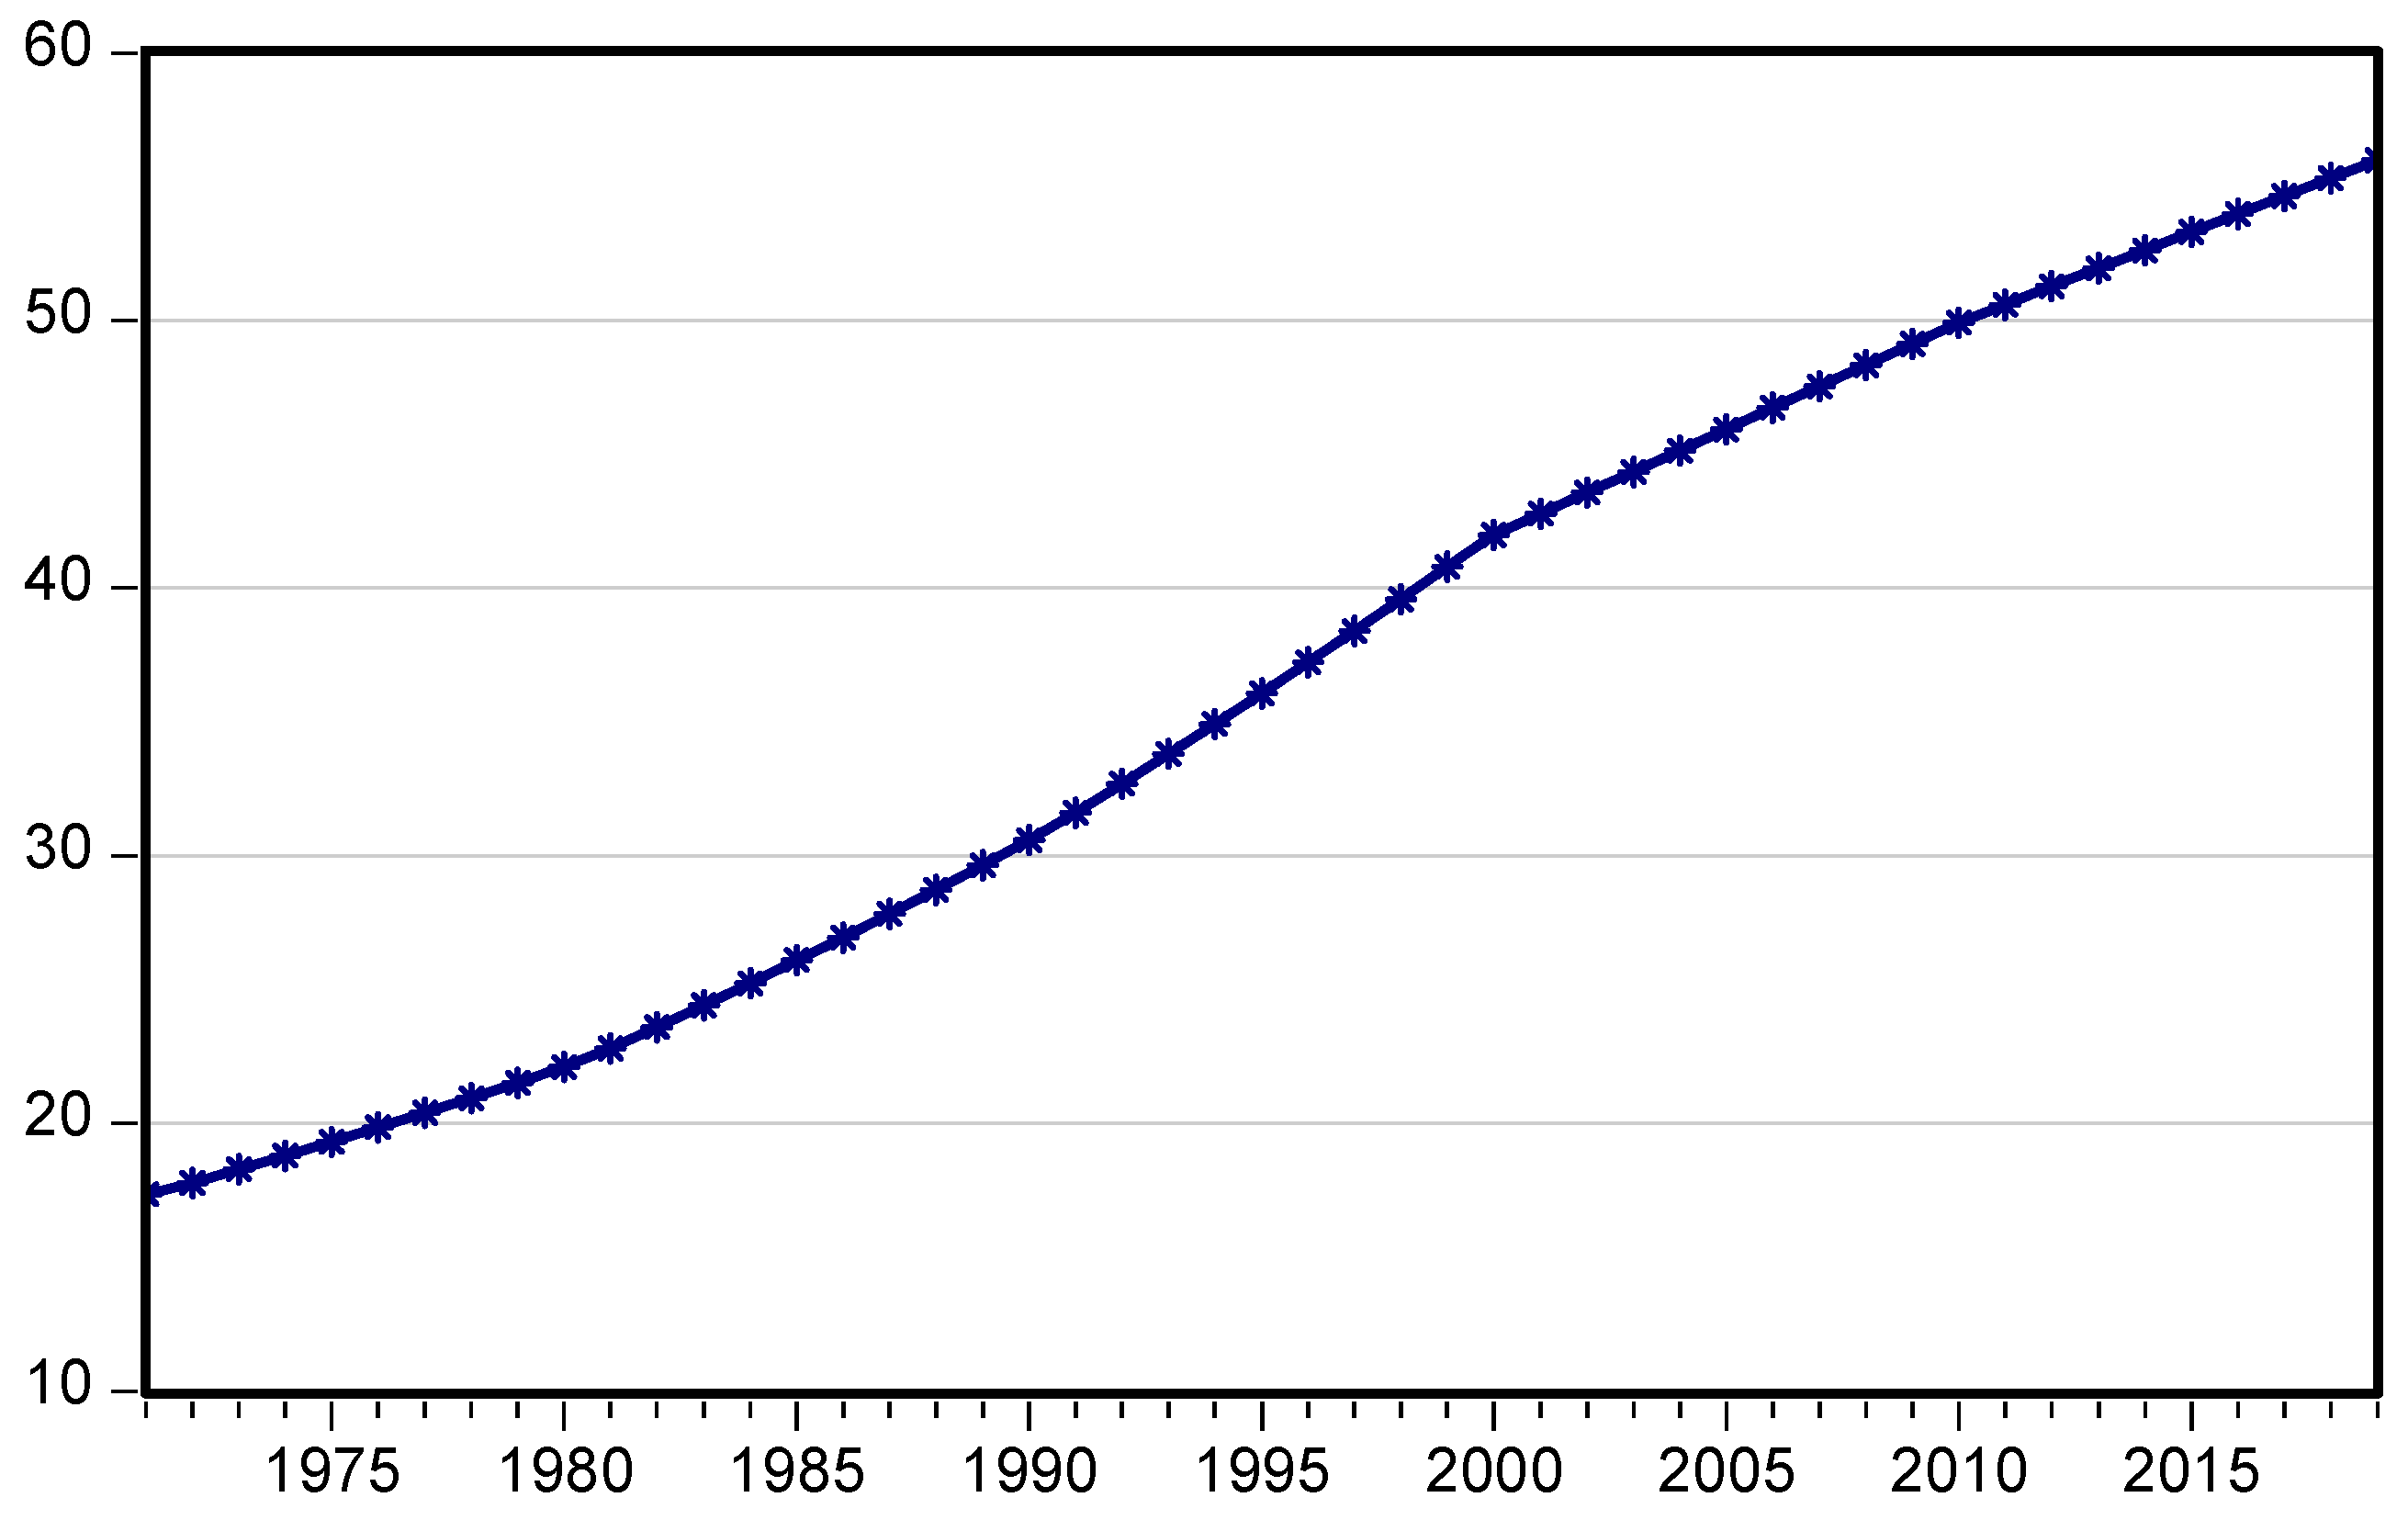
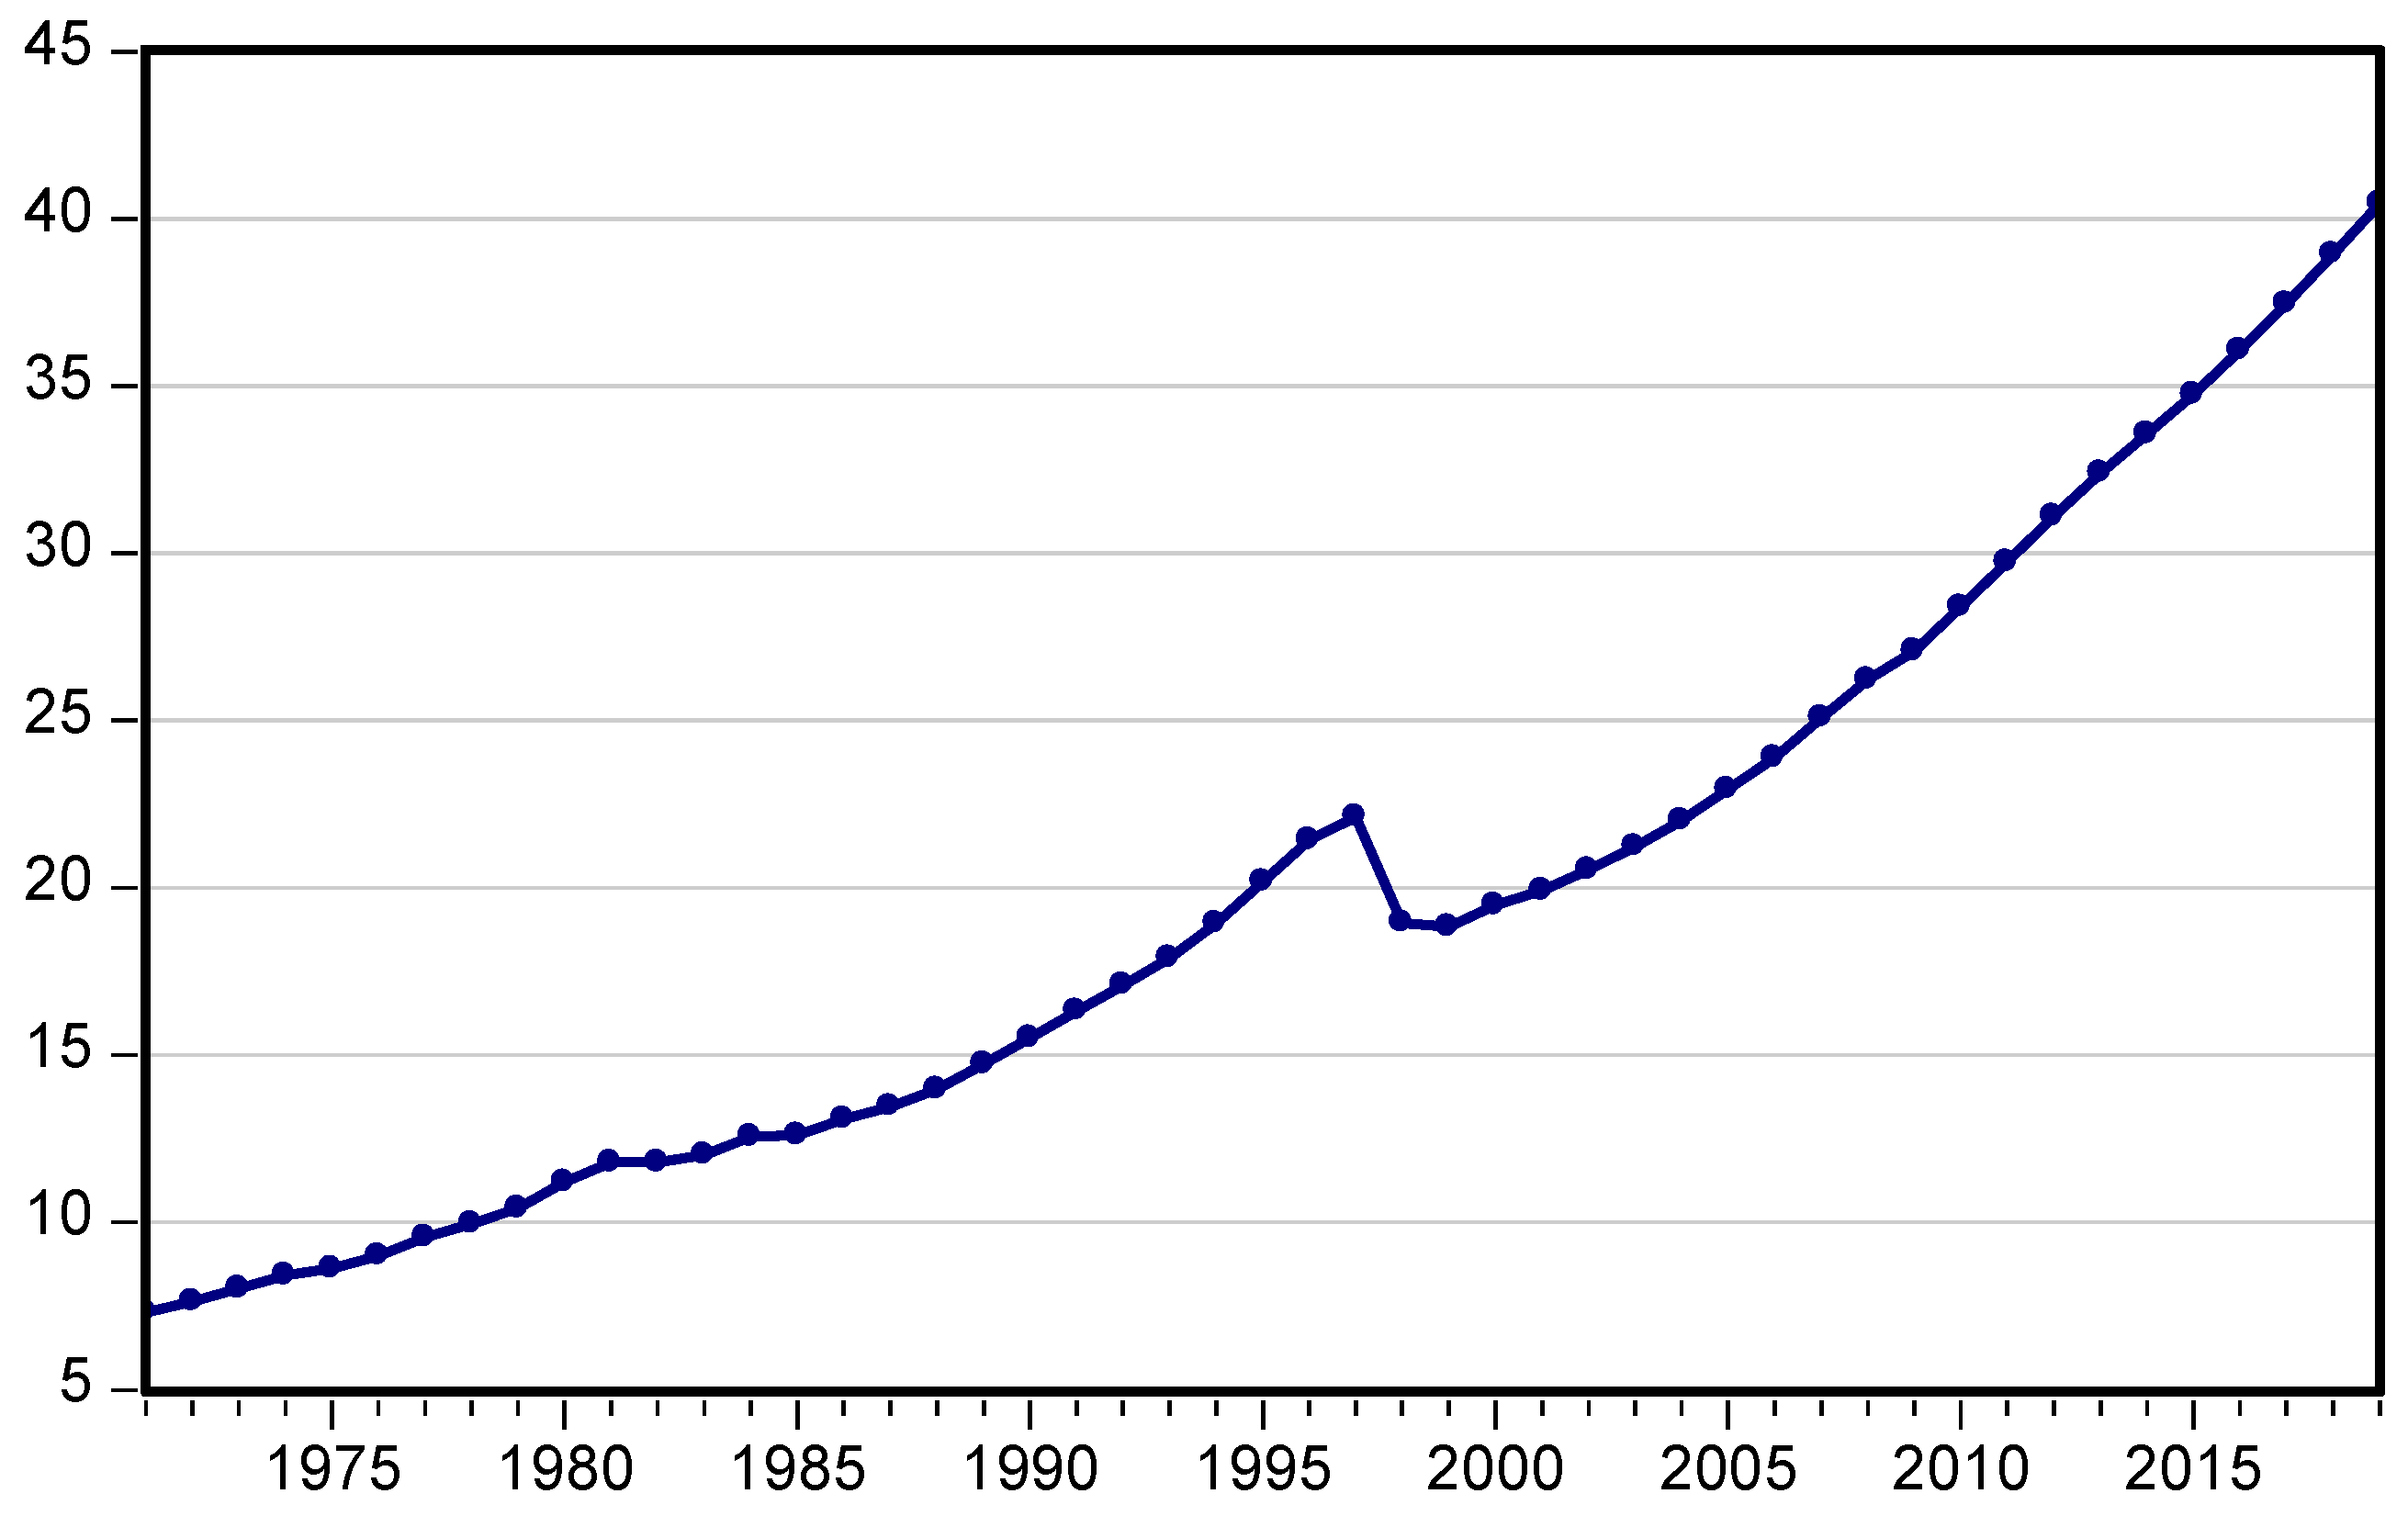
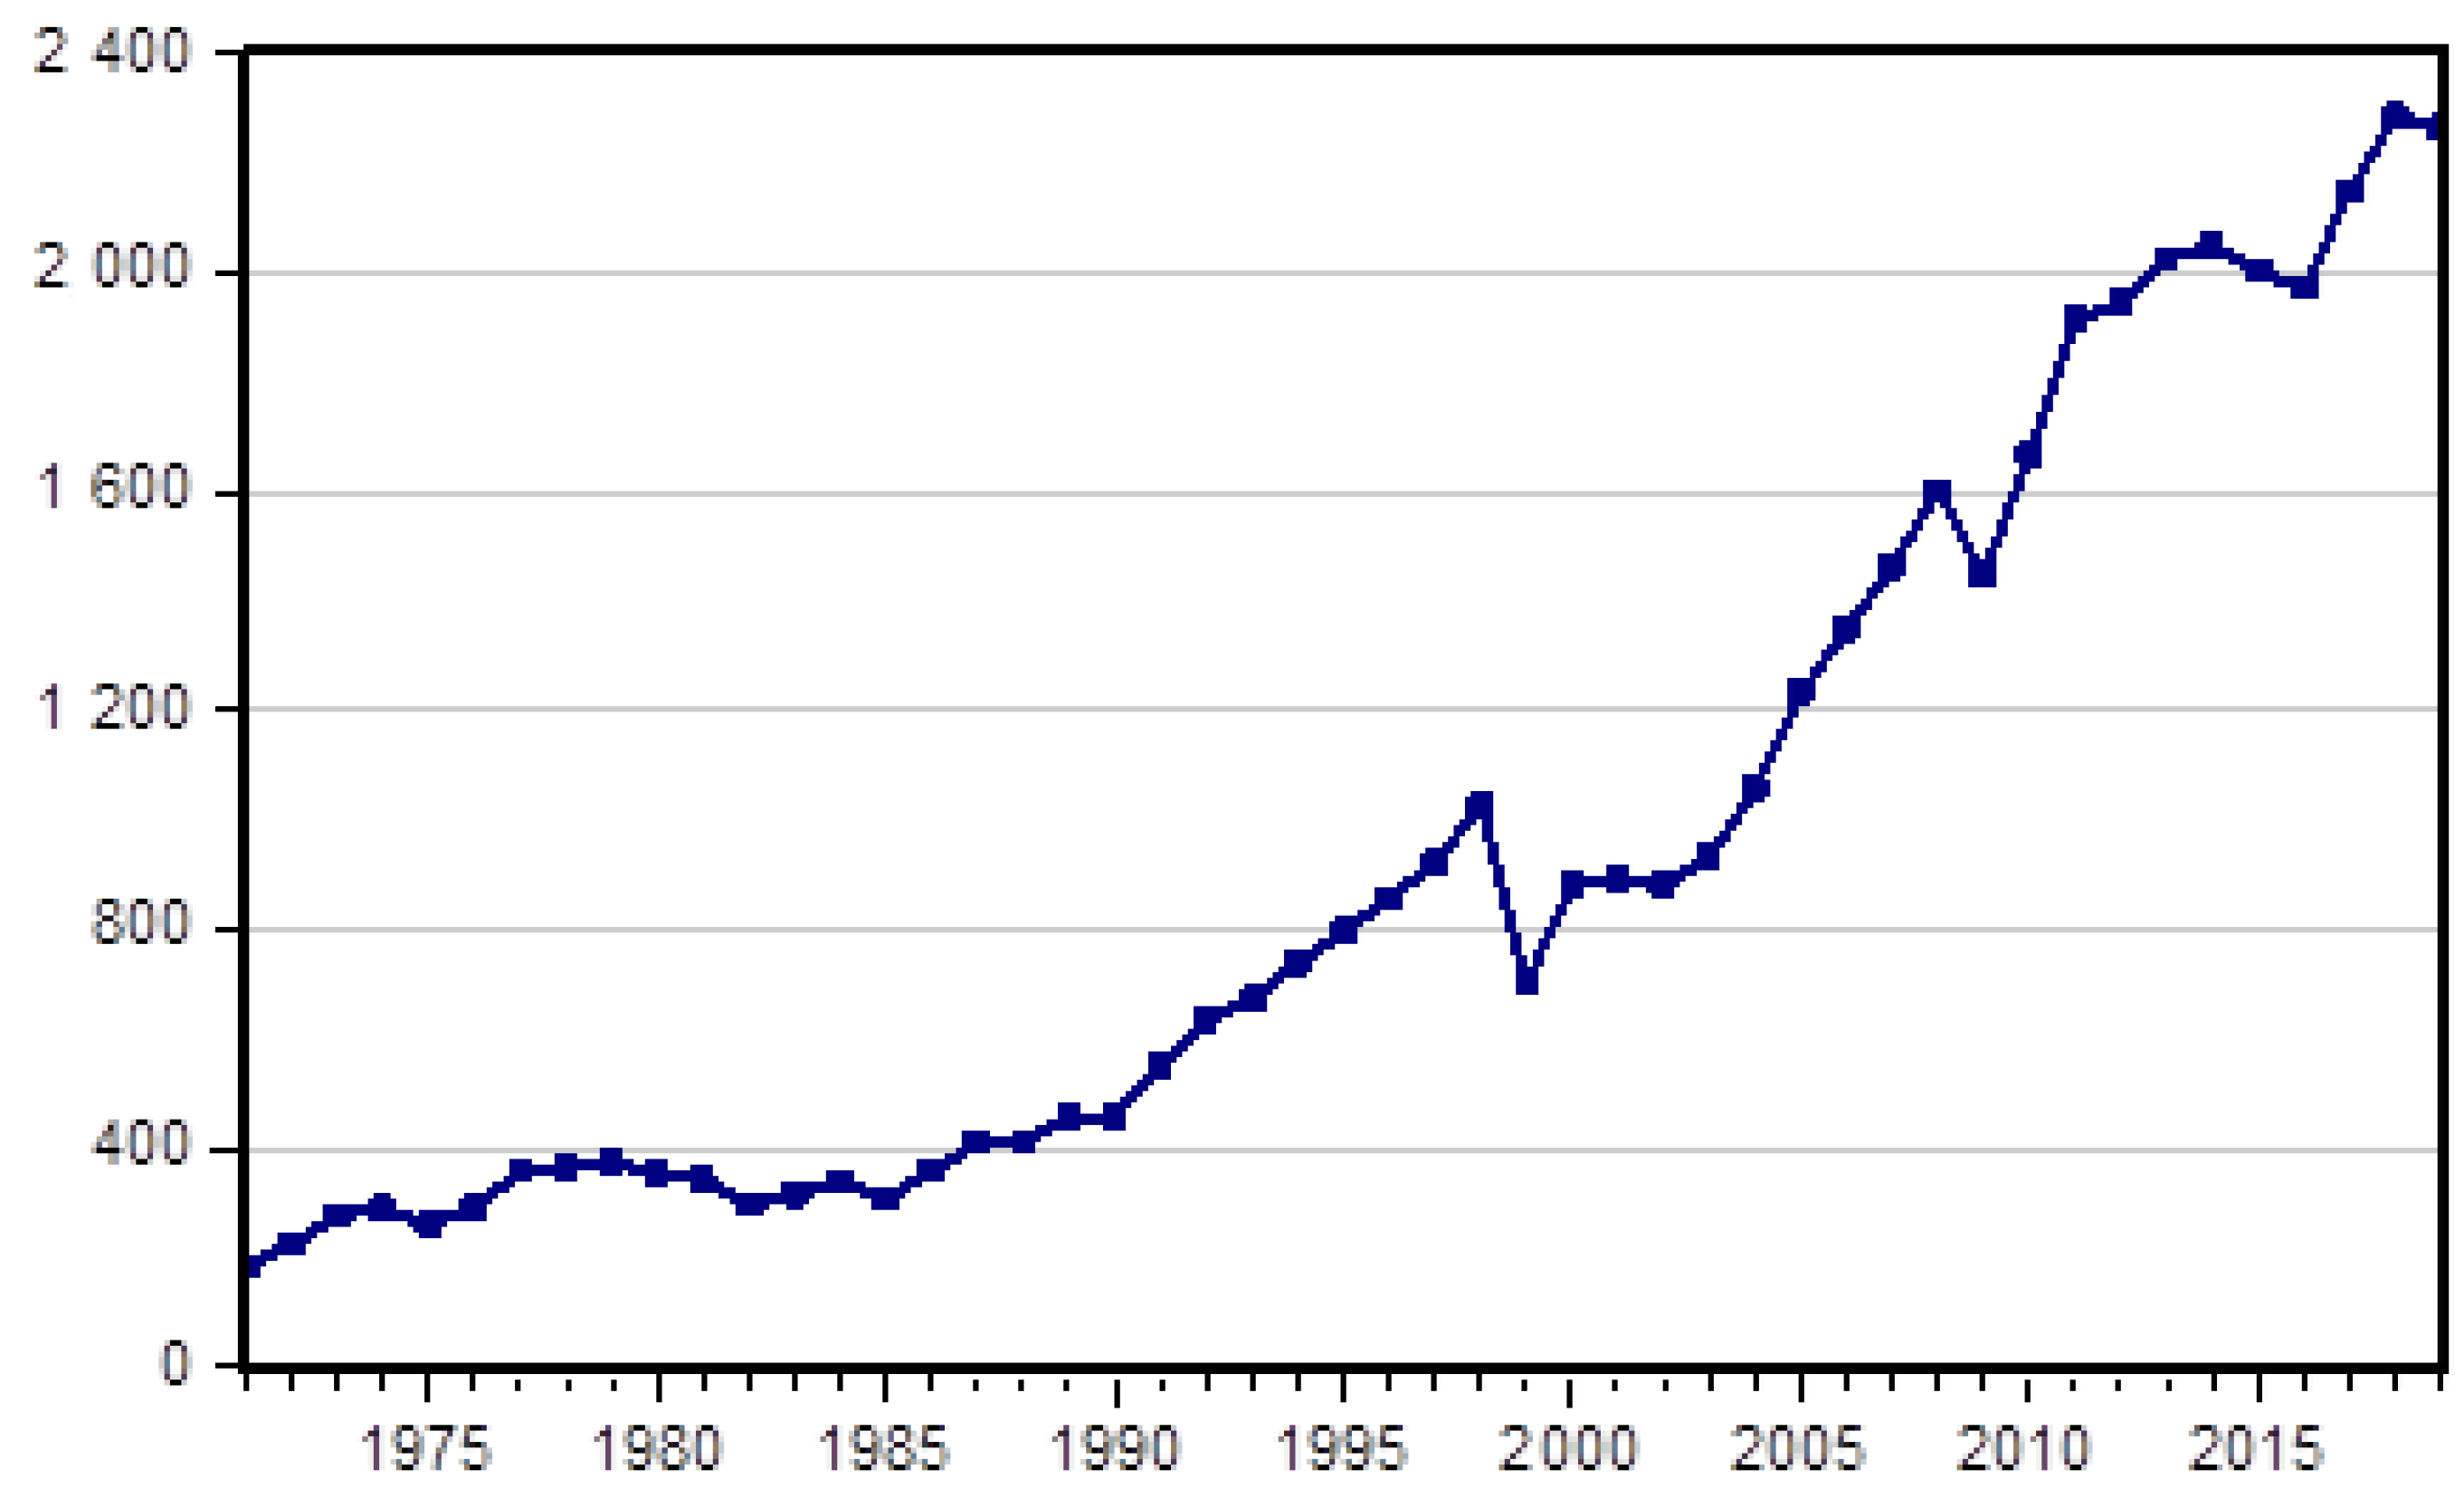
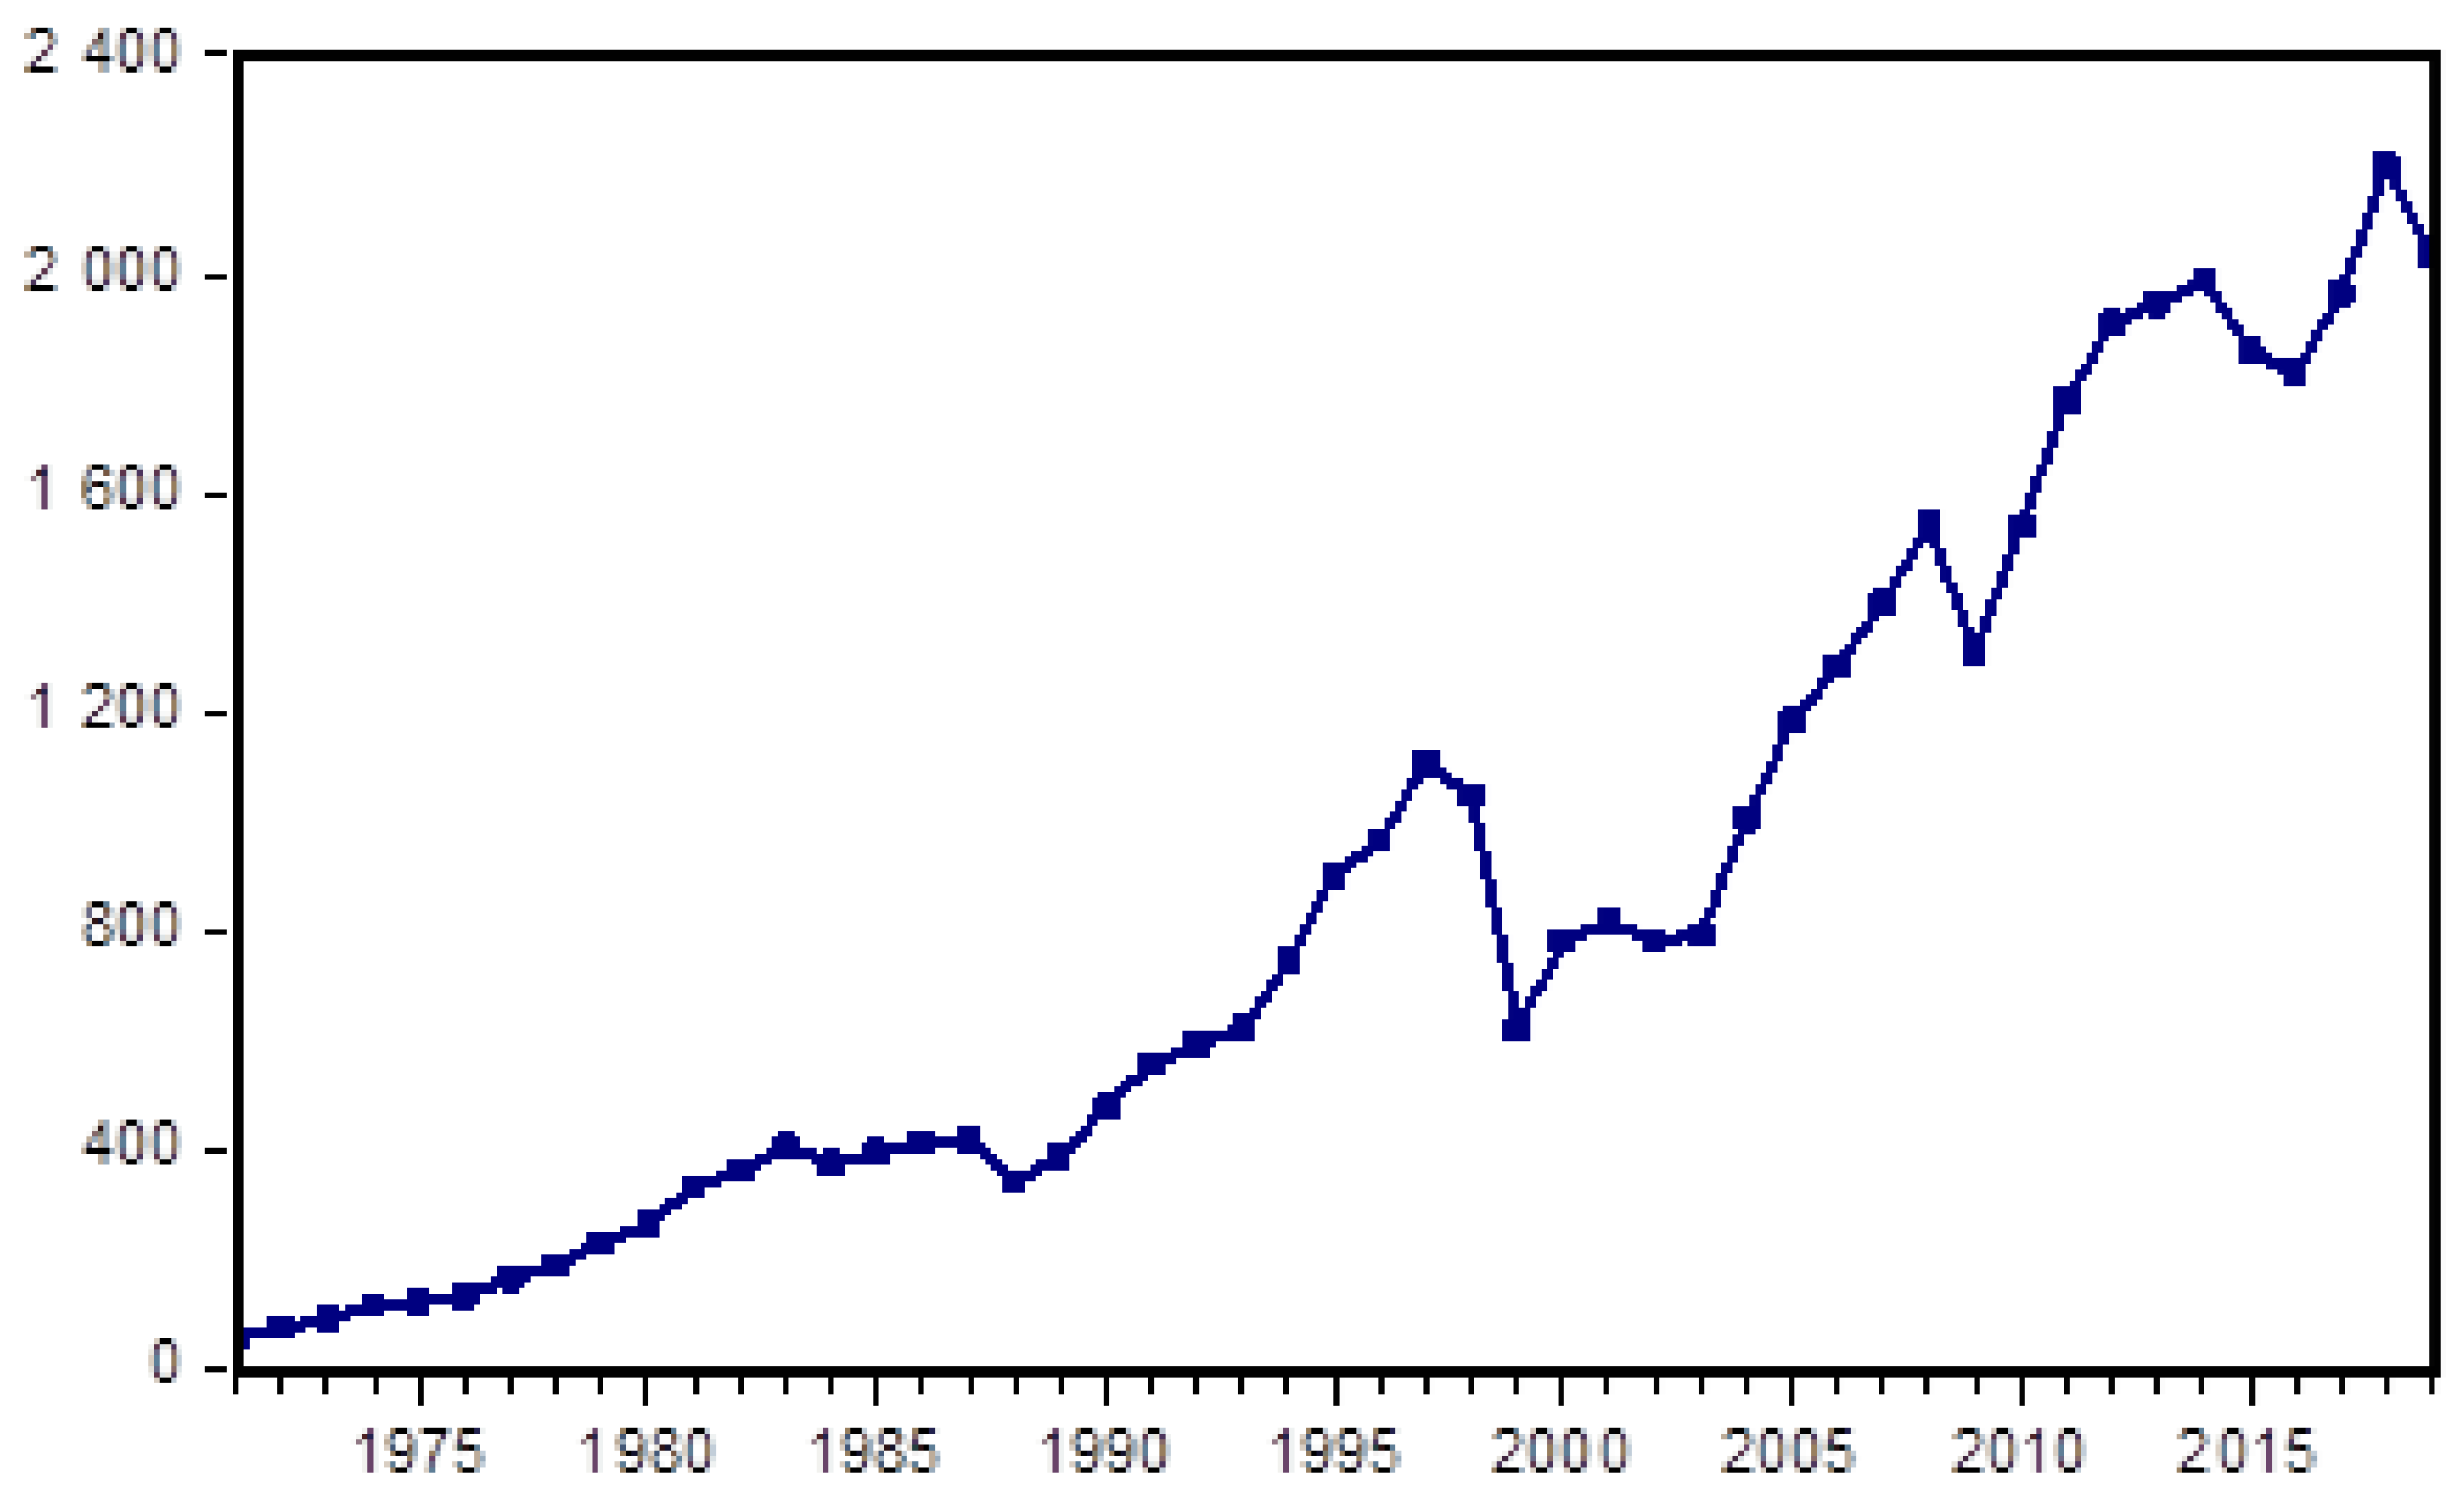
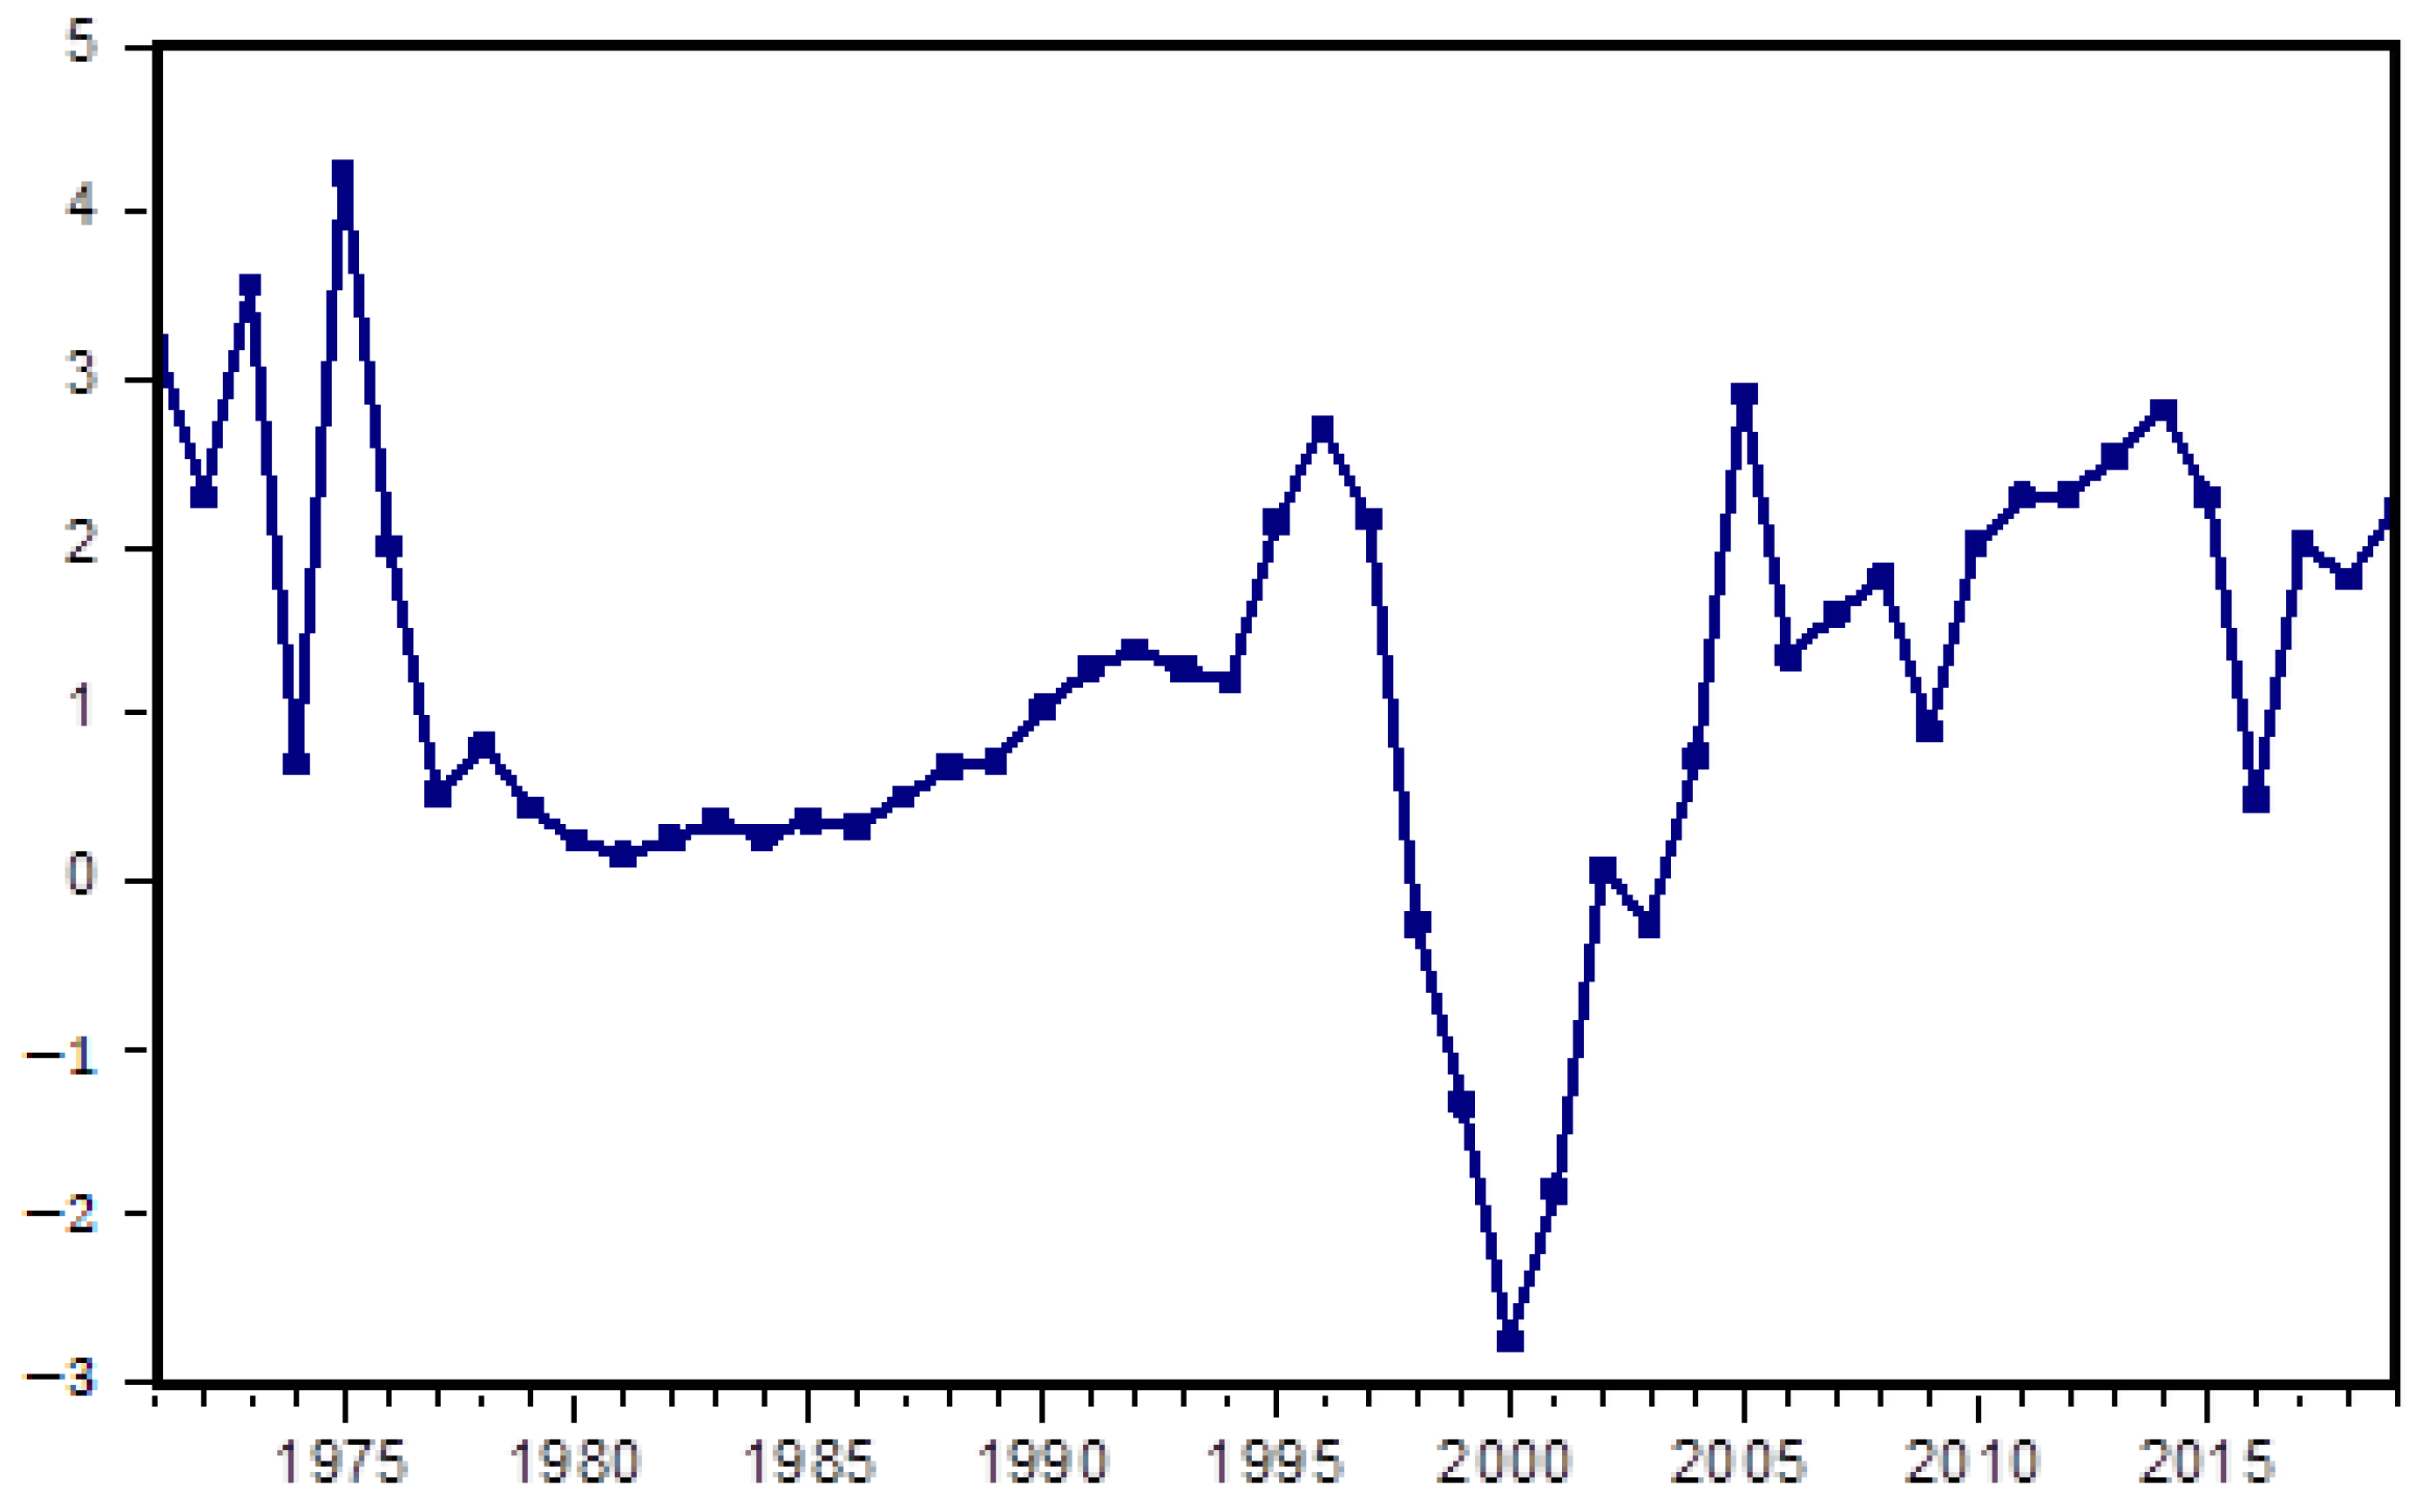
Figure 2 shows trends in CO2 emissions that have occurred since 1971, tending to increase. It implies that significant growth in emissions has occurred since 1971, accompanied by increasing urbanization and economic growth (Figure 3 and Figure 4). Prior to the economic crisis in 1998, an international agreement did not influence the reduction of CO2 emissions in Indonesia. Carbon emissions constantly rose after the first United Nations Environmental Conference, which was conducted in Stockholm in 1971. Since 1998, a significant increase in economic activities, such as exports and imports (Figure 5 and Figure 6), have led to relatively higher emissions. The Kyoto Protocol, which was signed in 1997, made the trend of carbon emissions fluctuate, as well as the Paris Agreement in 2015. It implies the influence of international agreement diplomacy on economic activities related to the reduction of CO2 emissions. Figure 7 shows the volatility of FDI net inflows. Since the heaviest economic crisis in 1998, foreign direct investment has tended to increase. Global shocks had brought it down in 2008 and 2016, but it rose again at the end of 2019. This confirms that the interest of investors in Indonesia is still high.
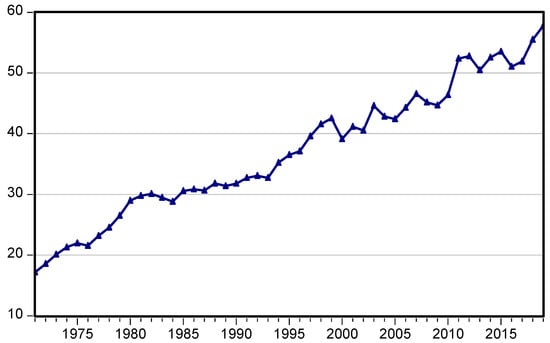
Figure 2.
Time trend of CO2 Emissions.
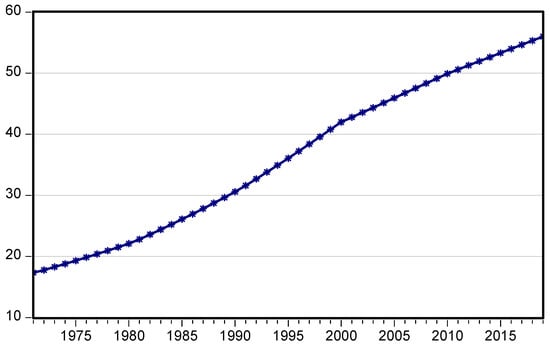
Figure 3.
Time trend of Urbanization.
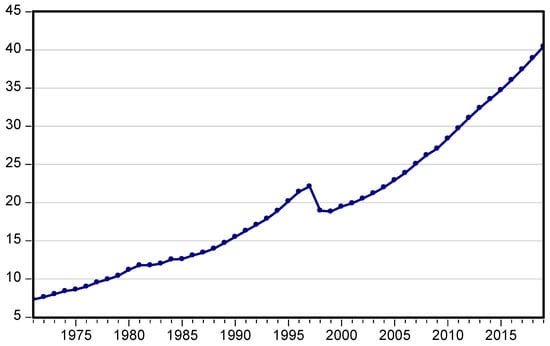
Figure 4.
Time trend of Economic growth.
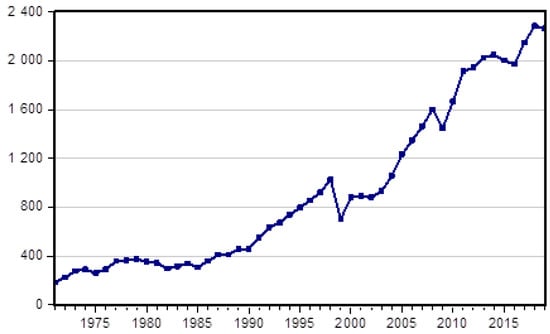
Figure 5.
Time trend of Export.

Figure 6.
Time trend of Import.
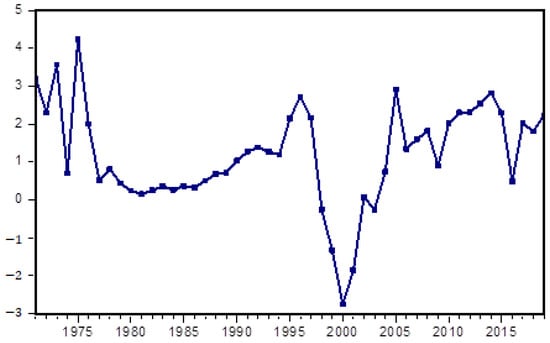
Figure 7.
Time trend of Foreign Direct Investment.
The dynamic causal relationship between CO2 emissions, urbanization, economic growth, export, and import activities, as well as foreign direct investment, was assessed through several steps. Firstly, each variable containing the unit root was checked. Secondly, the test to determine whether there was a long-term cointegration relationship between the variables was conducted. Thirdly, the estimation of the VECM to deduce the Granger causal relationship between the variables was carried out. A summary of the results is shown in Table 4 based on the first stage, which is the unit root identification of each variable.
Table 4.
Root Test of ADF-PP.
The first stage was the ADF unit root test, which showed that the variables of CO2 emissions, urbanization, economic growth, exports, imports, and foreign investment were not stationary in the level integration analysis (Table 4). Furthermore, the first difference was conducted on all stationary variables I (1), except for the UD. This indicated that there was a difference in the level of stationarity within the UD variable, as the Levin–Lin–Chu (LLC), Im–Pesaran–Shin (IPS), Fisher–ADF, and Fisher–PP tests were carried out, respectively. The summary of the results is shown in Table 5. Based on the use of the Levin–Lin–Chu, Pesaran–Shin, and ADF–PP methods, the first difference root test showed that all results were stationary at I (1), due to the probability which was less than 5%. This also confirmed that the variables of CO2 emissions, urbanization, economic growth, exports, imports, and foreign investment, were tested for cointegration.
Table 5.
Group Unit Root Test.
The optimal lag length was determined based on the Akaike information criterion (AIC). According to the determination of the most optimal lag, the highest LR and low AIC, HQIC, and SBIC values were observed. The results showed the optimal lag length used was two, through the consideration of the lowest AIC value. Subsequently, a stability test was conducted to determine the usable model (VAR or VECM). The results also showed the variables to be used met the stability criteria, as the modulus values were less than one; hence, the VAR or VECM was used.
After passing the stability analysis, the cointegration test was conducted. Furthermore, the Johansen cointegration test was found to be based on the linear determinism assumption (intercept and trend). A long-term balance was observed when the trace or Max-Eigen values were more than the critical value of 5%. Therefore, the results of the Johansen cointegration test based on Trace and Max-Eigen statistics are summarized in Table 6.
Table 6.
Johansen Cointegration Test.
The null hypothesis of Johansen’s test stated that cointegration occurred when at least one analysis was cointegrated. The null hypothesis was accepted based on the results, which showed trace and Max-Eigen test values of two and one cointegrations at the 0.05 level, respectively. This indicated that there was cointegration between variables, as CO2 emissions, urbanization, economic growth, exports, imports, and foreign direct investment, had a long-term relationship within the period of 1971 to 2019 in Indonesia. These variables were also eligible for the VEC framework.
Based on the use of VECM, the causality source was identified from the significance test that was conducted for the coefficient of the independent variable. According to the short-term causality, the Granger causality/block exogeneity Wald tests were used to determine the nullity of the parameters associated with the independent variable in each VECM equation, through the χ2-Wald statistic. However, causality in the long term was tested by the significance of the adjustment speed. The t-statistic of the ECT coefficient that showed a long-term causal effect was also used.
Table 7 shows three out of six vectors had a negative value of ECT-1, but only Equation (5) was statistically significant at a 1% significance degree. This means only CO2 emissions had an equilibrium in the long-term. In addition, unidirectional causality occurs from urbanization, economic growth, exports, and foreign direct investment to CO2 emissions in the short-term. Likewise, imports into urbanization and economic growth had a one-way relationship to exports and imports (Table 7).
Table 7.
Granger Causality/Block Exogeneity Wald Tests.
4.2. Impulse Response
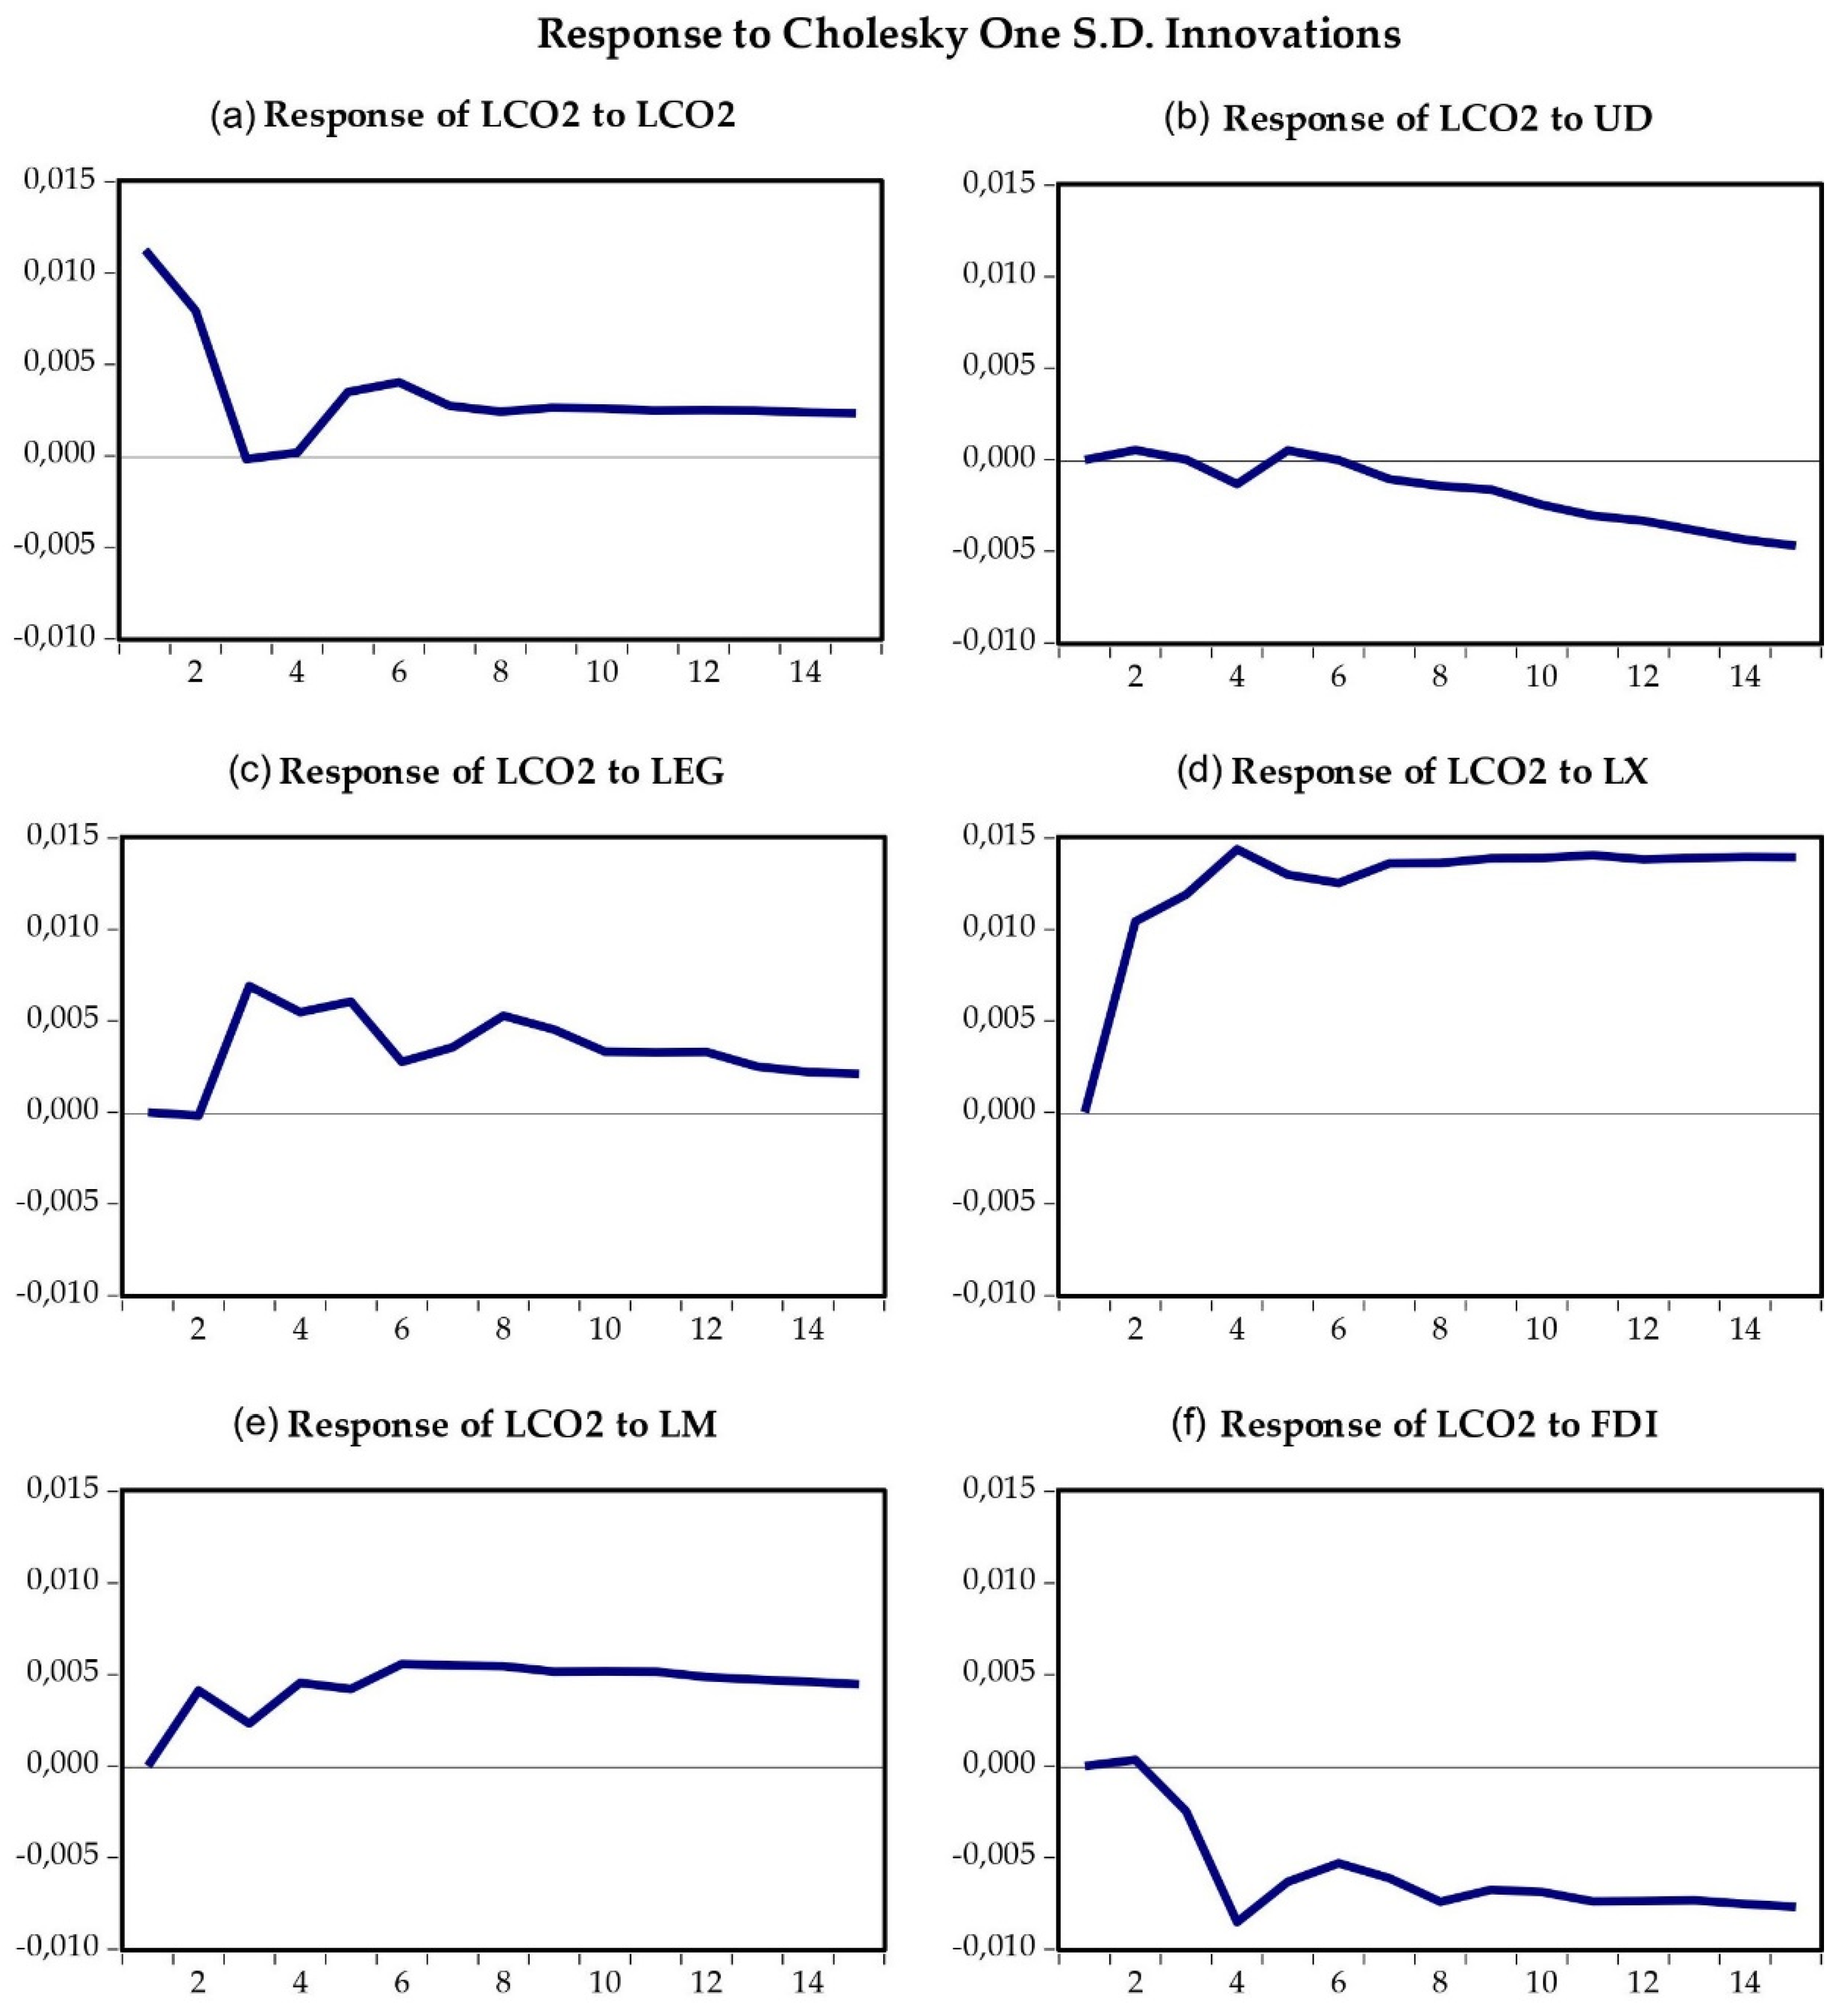
Impulse response CO2 emissions to urbanization showed that the urban density was included in the counter-urbanization phase in the short-term. This phase is characterized by a decrease in the environmental, physical, and socio-economic carrying capacity of the population in the larger metropolitan area (Sarungu 2001). The high level of urbanization can result in rapid population growth that leads to agglomeration and will be followed by efforts of people to fulfill their needs. Due to the speed and scale of escalation in these cities, they can induce great pressure on the environment and pose environmental degradation or threats to sustainable development (Cohen 2006). This result is in line with Agung PS et al. (2017) and Liang et al. (2019). In the long-term, CO2 emissions will decrease along with the awareness of city dwellers about the importance of health and quality of life. This is consistent with the negative response of CO2 emissions to urban density (Figure 8b). Therefore, urbanization can be directed to reduce CO2 emissions by using the potential spillover of technology and high levels of education. This is consistent with Liu and Liu (2019), Hassan et al. (2020), and Wang et al. (2020).
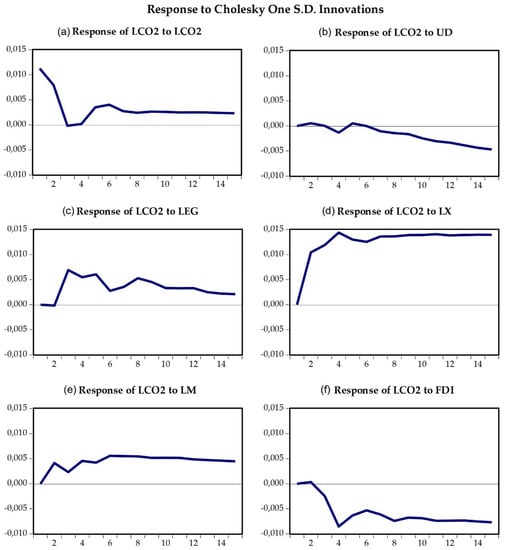
Figure 8.
Impulse response functions.
Assuming FDI changes, the response of CO2 emissions was positive in the short run, but was negative in the third year, reaching its lowest point in the fourth year, and subsequently tends to move steadily (Figure 8f). The positive response of CO2 emissions during the shock in FDI was consistent with the VECM estimation in this study. It also showed an increase in FDI in the long run, leading to environmentally oriented investment. This is in line with Adams et al. (2020), Salehnia et al. (2020), and Chen et al. (2021b). This is a great target that developing countries should build upon in order to realize the halo pollution hypothesis, along with the increasing FDI values every year. The responses of CO2 emissions to export and import economic activities were positive. A shock to exports will increase CO2 emissions sharply until the fourth year, and subsequently the changes tend to be stable in the long term (Figure 8d). The same pattern was shown by imports. Although the response to CO2 emissions was smaller than the shock to exports, it was also positive to changes in imports (Figure 8e). This is a formidable challenge for net-zero carbon. Actually, the policy of goods or commodities received from the rest of the world for Indonesian consumption has led to the procurement of cordial environmental commodities which minimizes the occurrence of CO2 emissions. The Government of Indonesia issued Statute Law Number 32 (UU No 32) in 2009 concerning Environmental Protection and Management (UU PPLH) as well as Statute Law Number 18 (UU No 18) in 2008 concerning Waste Management (UU Waste Management). It was subsequently strengthened by the stipulation of Statute Law Number 7 (UU No 7) in 2014 concerning Trade, specifically Article 50 paragraph (1) and (2) which states that all goods can be exported or imported, except those prohibited, restricted, or otherwise stipulated by law. The newest implementation is regulated in Government Regulation No. 22 (PP No 22) in 2021 concerning the implementation of environmental protection and management. The climate change emergency at COP26 is time-bound, making net zero carbon policy mandatory for companies. Based on the results of variance decomposition (Table 8), the largest contribution to emissions comes from export activities. Therefore, failure to immediately adapt to a net zero carbon policy can lead to loss of global market share.
Table 8.
Variance Decomposition of LCO2.
4.3. Variance Decomposition
Initially, the largest contribution to CO2 emissions in the short term is the variance in the variable itself, but its contribution decreased afterward. The largest contribution was taken over by exports. Initially, it contributed only 34%, but increased continuously to become the largest at the end of the period (Table 8). Economic growth, FDI, urbanization, and imports also showed an increasing trend of contributions.
The biggest contribution from export activities to CO2 emissions should be the main notice related to Indonesia’s commitment to achieving net-zero carbon by 2070. It should also be noted that international agreements to reduce CO2 emissions were more or less efficient, but on the other hand, it has reduced the competitiveness and exports of several countries (C. H. Wang et al. 2019). Some countries in Asia, Europe, and America have implemented climate change mitigation programs to reduce emissions, which influences trading regulations. Requirements are set to the product; hence, it can be accepted globally by fulfilling sustainability requirements. For example, low-emission industrial product companies do not carry out deportations or execute forest conservation policies.
Foreign direct investment contributes to economic growth (Omri et al. 2014). It recognizes that investment, advanced technology, and knowledge can be transferred from industrialized countries to developing countries as an important asset to increase economic growth (Raz et al. 2012). Therefore, FDI can accelerate the speed of general purpose technologies (GPT) as the engine of growth. However, in some countries, the existence of this investment turns out to provide negative externalities to the environment, thereby proving the pollution haven hypothesis (Aliyu 2005; Aljawareen and Saddam 2017). The results showed foreign direct investment contributed significantly to CO2 emissions. Economic agents should anticipate such factors carefully in order to remain competitive in the global economy due to climate change. For example, the European Union makes policies regarding sanitary and phytosanitary goods to protect human and animal health, as well as environmental requirements (sustainable forest certificates and ecolabels, origin of products) for wood commodities. Other requirements, such as health and safety (free of fluorocarbon and formaldehyde emissions) and expensive costs are also not easy to manage. These should be borne by Indonesian entrepreneurs. Similarly, the Japanese government has a standard for wood products (Japan Agricultural Standard, JAS) and other export destination countries. Therefore, the right strategy is needed to synergize between economic growth air quality. Although economic activities should be carried out, it needs to be balanced in order to achieve net zero carbon.
5. Conclusions
This study aims to analyze the pattern of urbanization, economic growth, exports, imports, foreign direct investment, and CO2 emissions. It also proved whether the halo or haven pollution hypotheses existed in Indonesia from 1971 to 2019. According to the results, CO2 emissions had an equilibrium in the long-term. In addition, unidirectional causality occurred from urbanization, economic growth, exports, and foreign direct investment to CO2 emissions in the short term. Likewise, imports into urbanization and economic growth indicated a one-way relationship to exports and imports. This consequently strengthened the IPAL model by Dietz and Rosa (1997), which stated that population, income, and technology are considered as the main drivers of environmental impact.
The pollution haven hypothesis exists in Indonesia, and FDI had a one-way interplay with CO2 emissions. The government should regulate air pollution by conditioning urbanization to be environmentally friendly through building several green open spaces and public transportation that uses accommodative fuel or renewable energy. Gradually, capital should be directed to investments that promote the economy to thrive. Foreign investment is used as a pillar to support the realization of a green urban development model. This is achieved by limiting negative environmental externalities through procurement and physical investment, particularly in power generation, transportation, and manufacturing industries.
Countries that are committed to climate change prevention in the Paris Agreement should compile long-term development plans that are integrated with strategies to reduce the amount of greenhouse gas emissions. In other words, the target for reducing emissions in its implementation needs to be coherent with several existing policies, specifically Indonesia’s ambition to escape from the middle-income trap. The toughest challenge for the country is the use of coal energy sources. The transfer of coal plants to renewable energy in 2040 requires the support of international cooperation, technology, economic feasibility, and international funding to assist the energy transition. Therefore, the formation of a healthy and prosperous state ecosystem can be achieved when there is collaboration from all economic agents.
Author Contributions
Conceptualization, D.M.N., I.M., L.H. and S.S.; methodology, D.M.N. and L.H.; software, D.M.N.; validation, I.M., L.H. and S.S.; formal analysis, D.M.N. and L.H.; investigation, D.M.N.; resources, D.M.N. and S.S.; data curation, L.H. and S.S.; writing—original draft preparation, D.M.N.; writing—review and editing, D.M.N., I.M., L.H. and S.S.; visualization, D.M.N.; supervision, I.M., L.H. and S.S.; project administration, D.M.N. All authors have read and agreed to the published version of the manuscript.
Funding
This research received no external funding.
Institutional Review Board Statement
Ethical review and approval were waived for this study due to meet the ethical requirements of international research publication.
Informed Consent Statement
Not applicable.
Data Availability Statement
The corresponding author [D.M.N] of the present work is available for any information about data availability.
Acknowledgments
The authors are grateful to Julianus Johnny Sarungu, MS for providing constructive discussion and the Rector of the Universitas Negeri Semarang for the scholarship of the Doctoral Program in Economics.
Conflicts of Interest
The authors declare no conflict of interest.
References
- Abbasi, Muhammad Ali, Shabana Parveen, Saleem Khan, and Muhammad Abdul Kamal. 2020. Urbanization and energy consumption effects on carbon dioxide emissions: Evidence from Asian-8 countries using panel data analysis. Environmental Science and Pollution Research 27: 18029–43. [Google Scholar] [CrossRef] [PubMed]
- Adams, Samuel, Elliot Boateng, and Alex O. Acheampong. 2020. Transport energy consumption and environmental quality: Does urbanization matter? Science of the Total Environment 744: 140617. [Google Scholar] [CrossRef]
- Adedoyin, Festus Fatai, and Festus Victor Bekun. 2020. Modelling the interaction between tourism, energy consumption, pollutant emissions and urbanization: Renewed evidence from panel VAR. Environmental Science and Pollution Research 27: 38881–900. [Google Scholar] [CrossRef] [PubMed]
- Agung PS, Prima, Djoni Hartono, and Agni Alam Awirya. 2017. The Effect of Urbanization on Energy Consumption and CO2 Emissions: Analysis of Provinces in Indonesia. Jurnal Ekonomi Kuantitatif Terapan 10: 1–107. [Google Scholar] [CrossRef]
- Akalpler, Ergin, and Simbarashe Hove. 2019. Carbon emissions, energy use, real GDP per capita and trade matrix in the Indian economy-an ARDL approach. Energy 168: 1081–93. [Google Scholar] [CrossRef]
- Akorede, Yusuf Fatai, and Rafia Afroz. 2020. The relationship between urbanization, CO2 emissions, economic growth and energy consumption in Nigeria. International Journal of Energy Economics and Policy 10: 491–501. [Google Scholar] [CrossRef]
- Ali, Hamisu Sadi, AS. Abdul-Rahim, and Mohammed Bashir Ribadu. 2017. Urbanization and carbon dioxide emissions in Singapore: Evidence from the ARDL approach. Environmental Science and Pollution Research 24: 1967–74. [Google Scholar] [CrossRef]
- Ali, Rafaqet, Khuda Bakhsh, and Muhammad Asin Yasin. 2019. Impact of urbanization on CO2 emissions in emerging economy: Evidence from Pakistan. Sustainable Cities and Society 48: 101553. [Google Scholar] [CrossRef]
- Aliyu, Mohammed Aminu. 2005. Foreign Direct Investment and the Environment: Pollution Haven Hypothesis Revisited. Paper presented at the Eight Annual Conference on Global Economic Analysis, Lübeck, Germany, June 9–11; Available online: https://www.gtap.agecon.purdue.edu/resources/download/2131.pdf?q=pollution-haven-hypothesis (accessed on 1 January 2021).
- Aljawareen, Adnan, and Ahmed Saddam. 2017. The Impact of GDP, FDI, and Import on Carbon Dioxide Emissions in of GCC Countries: A Panel Data Approach. European Scientific Journal 7881: 31–56. [Google Scholar]
- Al-Mulali, Usama, and Low Sheau-Ting. 2014. Econometric analysis of trade, exports, imports, energy consumption and CO2 emission in six regions. Renewable and Sustainable Energy Reviews 33: 484–98. [Google Scholar] [CrossRef]
- Al-Mulali, Usama, Hassan Gholipour Fereidouni, Janice Y. M. Lee, and Che Normee Binti Che Sab. 2013. Exploring the relationship between urbanization, energy consumption, and CO2 emission in MENA countries. Renewable and Sustainable Energy Reviews 23: 107–12. [Google Scholar] [CrossRef]
- Amin, Azka, Babar Aziz, and Xi-Hua Liu. 2020. The relationship between urbanization, technology innovation, trade openness, and CO2 emissions: Evidence from a panel of Asian countries. Environmental Science and Pollution Research 27: 35349–63. [Google Scholar] [CrossRef] [PubMed]
- Anwar, Asim, Mustafa Younis, and Inayat Ullah. 2020. Impact of urbanization and economic growth on CO2 emission: A case of far east Asian countries. International Journal of Environmental Research and Public Health 17: 2531. [Google Scholar] [CrossRef] [Green Version]
- Balogh, Jeremiás Máté, and Attila Jámbor. 2017. Determinants of CO2 emission: A global evidence. International Journal of Energy Economics and Policy 7: 217–26. [Google Scholar]
- Bashir, Abdul, Didik Susetyo, Suhel Suhel, and Azwardi Azwardi. 2021. Relationships between Urbanization, Economic Growth, Energy Consumption, and CO2 Emissions: Empirical Evidence from Indonesia. Journal of Asian Finance, Economics and Business 8: 79–90. [Google Scholar] [CrossRef]
- Bashir, Abdul, K. M. Husni Thamrin, Muhammad Farhan, Mukhlis, and Dirta Pratama Atiyatna. 2019. The causality between human capital, energy consumption, CO2 emissions, and economic growth: Empirical evidence from Indonesia. International Journal of Energy Economics and Policy 9: 98–104. [Google Scholar] [CrossRef]
- Batool, Syeda Azra, Humar Ahmad, Syed Muhammad Ahmad Hassan Gillani, Hamad Raza, Muhammad Siddique, Nohman Khan, and Muhammad Imran Qureshi. 2021. Investigating the causal linkage among economic growth, energy consumption, urbanization and environmental quality in asean-5 countries. International Journal of Energy Economics and Policy 11: 319–27. [Google Scholar] [CrossRef]
- Bekhet, Hussain Ali, and Nor Salwati Othman. 2017. Impact of urbanization growth on Malaysia CO2 emissions: Evidence from the dynamic relationship. Journal of Cleaner Production 154: 374–88. [Google Scholar] [CrossRef] [Green Version]
- Ben Abdallah, Khaled, Mounir Belloumi, and Daniel De Wolf. 2013. Indicators for sustainable energy development: A multivariate cointegration and causality analysis from Tunisian road transport sector. Renewable and Sustainable Energy Reviews 25: 34–43. [Google Scholar] [CrossRef]
- Bhattacharya, Mita, Khalid Ahmed, Zahid Shaikh, Muhammad Ramzan, and Ilhan Ozturk. 2017. Emission intensive growth and trade in the era of the Association of Southeast Asian Nations (ASEAN) integration: An empirical investigation from ASEAN-8. Journal of Cleaner Production 154: 530–40. [Google Scholar] [CrossRef]
- Borhan, Halimahton, Elsadig Musa Ahmed, and Mizan Hitam. 2012. The Impact of CO2 on Economic Growth in Asean 8. Procedia -Social and Behavioral Sciences 35: 389–97. [Google Scholar] [CrossRef] [Green Version]
- Camagni, Roberto, Roberta Capello, and Peter Nijkamp. 1998. Towards sustainable city policy: An economy-environment technology nexus. Ecological Economics 24: 103–18. [Google Scholar] [CrossRef]
- Chandran, V. G. R., and Chor Foon Tang. 2013. The impacts of transport energy consumption, foreign direct investment and income on CO2 emissions in ASEAN-5 economies. Renewable and Sustainable Energy Reviews 24: 445–53. [Google Scholar] [CrossRef]
- Chen, Fuzhong, Guohai Jiang, and Getachew Magnar Kitila. 2021a. Trade openness and CO2 emissions: The heterogeneous and mediating effects for the belt and road countries. Sustainability 13: 1958. [Google Scholar] [CrossRef]
- Chen, Zuocheng, Krishna P. Paudel, and Rongqing Zheng. 2021b. Pollution halo or pollution haven: Assessing the role of foreign direct investment on energy conservation and emission reduction. Journal of Environmental Planning and Management 65: 311–36. [Google Scholar] [CrossRef]
- Chikaraishi, Makoto, Akimasa Fujiwara, Shinji Kaneko, Phetkeo Poumanyvong, Satoru Komatsu, and Andrey Kalugin. 2015. The moderating effects of urbanization on carbon dioxide emissions: A latent class modeling approach. Technological Forecasting and Social Change 90: 302–17. [Google Scholar] [CrossRef]
- Cohen, Barney. 2006. Urbanization in developing countries: Current trends, future projections, and key challenges for sustainability. Technology in Society 28: 63–80. [Google Scholar] [CrossRef]
- Copeland, Brian R., and M. Scott Taylor. 1994. North-South Trade and the Environment. The Quarterly Journal of Economics 109: 755–87. [Google Scholar] [CrossRef]
- Dietz, Thomas, and Eugene A. Rosa. 1997. Effects of population and affluence on CO2 emissions. Proceedings of the National Academy of Sciences of the United States of America 94: 175–79. [Google Scholar] [CrossRef] [Green Version]
- Dong, Feng, Ying Wang, Bin Su, Yifei Hua, and Yuanqing Zhang. 2019. The process of peak CO2 emissions in developed economies: A perspective of industrialization and urbanization. Resources, Conservation and Recycling 141: 61–75. [Google Scholar] [CrossRef]
- Ergas, Christina, Matthew Clement, and Julius McGee. 2016. Urban density and the metabolic reach of metropolitan areas: A panel analysis of per capita transportation emissions at the county-level. Social Science Research 58: 243–53. [Google Scholar] [CrossRef] [PubMed]
- Firebaugh, Glenn. 1979. Struktural Determinants of Urbanization in Asia and Latin America, 1950–1970. American Sociological Review 44: 199–215. [Google Scholar] [CrossRef]
- Grossman, Gene M., and Alan B. Krueger. 1991. Environmental Impacts of a North American Free Trade Agreement. Cambridge: National Bureau of Economic Research. [Google Scholar] [CrossRef]
- Hanif, Imran. 2018. Impact of economic growth, nonrenewable and renewable energy consumption, and urbanization on carbon emissions in Sub-Saharan Africa. Environmental Science and Pollution Research 25: 15057–67. [Google Scholar] [CrossRef] [PubMed]
- Hasanov, Fakhri J., Brantley Liddle, and Jeyhun I. Mikayilov. 2018. The impact of international trade on CO2 emissions in oil exporting countries: Territory vs consumption emissions accounting. Energy Economics 74: 343–50. [Google Scholar] [CrossRef]
- Hassan, Syed Tauseef, Enjun Xia, and Chien-Chiang Lee. 2020. Mitigation pathways impact of climate change and improving sustainable development: The roles of natural resources, income, and CO2 emission. Energy & Environment 32: 1–26. [Google Scholar] [CrossRef]
- Hossain, Md. Sharif. 2011. Panel estimation for CO2 emissions, energy consumption, economic growth, trade openness and urbanization of newly industrialized countries. Energy Policy 39: 6991–99. [Google Scholar] [CrossRef]
- Hossain, Sharif. 2012. An Econometric Analysis for CO2 Emissions, Energy Consumption, Economic Growth, Foreign Trade and Urbanization of Japan. Low Carbon Economy 3: 92–105. [Google Scholar] [CrossRef] [Green Version]
- Joshua, Udi, Festus Victor Bekun, and Samuel Asumadu Sarkodie. 2020. New insight into the causal linkage between economic expansion, FDI, coal consumption, pollutant emissions and urbanization in South Africa. Environmental Science and Pollution Research 27: 18013–24. [Google Scholar] [CrossRef] [Green Version]
- Kizilkaya, Oktay. 2017. The impact of economic growth and foreign direct investment on CO2 emissions: The case of Turkey. Turkish Economic Review 4: 106–18. [Google Scholar]
- Liang, Longwu, Zhenbo Wang, and Jiaxin Li. 2019. The effect of urbanization on environmental pollution in rapidly developing urban agglomerations. Journal of Cleaner Production 237: 117649. [Google Scholar] [CrossRef]
- Lin, Boqiang, and Junpeng Zhu. 2018. Changes in urban air quality during urbanization in China. Journal of Cleaner Production 188: 312–21. [Google Scholar] [CrossRef]
- Liu, Fengyun, and Chuanzhe Liu. 2019. Regional disparity, spatial spillover effects of urbanisation and carbon emissions in China. Journal of Cleaner Production 241: 118226. [Google Scholar] [CrossRef]
- Maparu, Tuhin Subhra, and Tarak Nath Mazumder. 2017. Transport infrastructure, economic development and urbanization in India (1990–2011): Is there any causal relationship? Transportation Research Part A: Policy and Practice 100: 319–36. [Google Scholar] [CrossRef]
- Martínez-Zarzoso, Inmaculada, and Antonello Maruotti. 2011. The impact of urbanization on CO2 emissions: Evidence from developing countries. Ecological Economics 70: 1344–53. [Google Scholar] [CrossRef] [Green Version]
- Nathaniel, Solomon Prince. 2020. Ecological footprint, energy use, trade, and urbanization linkage in Indonesia. GeoJournal 86: 2057–70. [Google Scholar] [CrossRef]
- Nathaniel, Solomon, and Syed Abdul Rehman Khan. 2020. The nexus between urbanization, renewable energy, trade, and ecological footprint in ASEAN countries. Journal of Cleaner Production 272: 122709. [Google Scholar] [CrossRef]
- Nosheen, Misbah, Muhammad Ali Abbasi, and Javed Iqbal. 2020. Analyzing extended STIRPAT model of urbanization and CO2 emissions in Asian countries. Environmental Science and Pollution Research 27: 45911–24. [Google Scholar] [CrossRef]
- Omri, Anis, Duc Khuong Nguyen, and Christophe Rault. 2014. Causal interactions between CO2 emissions, FDI, and economic growth: Evidence from dynamic simultaneous-equation models. Economic Modelling 42: 382–89. [Google Scholar] [CrossRef] [Green Version]
- Omri, Anis, Saida Daly, Christophe Rault, and Anissa Chaibi. 2015. Financial development, environmental quality, trade and economic growth: What causes what in MENA countries. Energy Economics 48: 242–52. [Google Scholar] [CrossRef] [Green Version]
- Özokcu, Selin, and Özlem Özdemir. 2017. Economic growth, energy, and environmental Kuznets curve. Renewable and Sustainable Energy Reviews 72: 639–47. [Google Scholar] [CrossRef]
- Pernia, Ernesto, Cayetano W. Paderanga Jr., and Victorina P. Hermoso. 1983. The Spatial and Urban Demension of Development In Philippines. Quezon City: Philippine Institute for Development Studies, pp. 1–70. [Google Scholar]
- Phong, Le Hoang, Dang Thi Bach Van, and Ho Hoang Gia Bao. 2018. The role of globalization on carbon dioxide emission in Vietnam incorporating industrialization, urbanization, gross domestic product per capita and energy use. International Journal of Energy Economics and Policy 8: 275–83. [Google Scholar] [CrossRef]
- Pié, Laia, Laura Fabregat-Aibar, and Marc Saez. 2018. The influence of imports and exports on the evolution of greenhouse gas emissions: The case for the european union. Energies 11: 1644. [Google Scholar] [CrossRef] [Green Version]
- Ponce, Pablo, and Rafael Alvarado. 2019. Air pollution, output, FDI, trade openness, and urbanization: Evidence using DOLS and PDOLS cointegration techniques and causality. Environmental Science and Pollution Research 26: 19843–58. [Google Scholar] [CrossRef] [PubMed]
- Qiu, Guo, Rui Song, and Shiwei He. 2019. The aggravation of urban air quality deterioration due to urbanization, transportation and economic development–Panel models with marginal effect analyses across China. Science of the Total Environment 651: 1114–25. [Google Scholar] [CrossRef] [PubMed]
- Rahman, Mohammad Mafizur, Kais Saidi, and Mounir Ben Mbarek. 2020. Economic growth in South Asia: The role of CO2 emissions, population density and trade openness. Heliyon 6: e03903. [Google Scholar] [CrossRef]
- Raz, Arisyi F., Tamarind P. K. Indra, and Dea K. Artikasih. 2012. The Global Financial Crisis And Economic Growth: An Analysis of The East Asian Economy. Buletin Ekonomi Moneter Dan Perbankan 15: 37–56. [Google Scholar] [CrossRef]
- Salahuddin, Mohammad, Jeff Gow, Md Idris Ali, Md Rahat Hossain, Khaleda Shaheen Al-Azami, Delwar Akbar, and Ayfer Gedikli. 2019. Urbanization-globalization-CO2 emissions nexus revisited: Empirical evidence from South Africa. Heliyon 5: e01974. [Google Scholar] [CrossRef] [Green Version]
- Salehnia, Narges, Nooshin Karimi Alavijeh, and Nasrin Salehnia. 2020. Testing Porter and pollution haven hypothesis via economic variables and CO2 emissions: A cross-country review with panel quantile regression method. Environmental Science and Pollution Research 27: 31527–42. [Google Scholar] [CrossRef]
- Santillán-Salgado, Roberto J., Humberto Valencia-Herrera, and Francisco Venegas-Martínez. 2020. On the Relations among CO2 Emissions, Gross Domestic Product, Energy Consumption, Electricity Use, Urbanization, and Income Inequality for a Sample of 134 Countries. International Journal of Energy Economics and Policy 10: 195–207. [Google Scholar] [CrossRef]
- Sarungu, Julianus Johnny. 2001. Patterns of the Effect of Public and Private Development Financing on the Urbanization Process in Indonesia [Airlangga University]. Available online: http://repository.unair.ac.id/32329/3/gdlhub-gdl-s3-2007-sarungujj-3547-dise20-p.pdf (accessed on 6 December 2020).
- Shahbaz, Muhammad, Ilham Haouas, and Thi Hong Van Hoang. 2019. Economic growth and environmental degradation in Vietnam: Is the environmental Kuznets curve a complete picture? Emerging Markets Review 38: 197–218. [Google Scholar] [CrossRef]
- Tang, Chor Foon, and Bee Wah Tan. 2015. The impact of energy consumption, income and foreign direct investment on carbon dioxide emissions in Vietnam. Energy 79: 447–54. [Google Scholar] [CrossRef]
- Tanger, Shaun M., Peng Zeng, Wayde Morse, and David N. Laband. 2011. Macroeconomic conditions in the U.S. and congressional voting on environmental policy: 1970–2008. Ecological Economics 70: 1109–20. [Google Scholar] [CrossRef]
- Turok, Ivan, and Gordon McGranahan. 2013. Urbanization and economic growth: The arguments and evidence for Africa and Asia. Environment and Urbanization 25: 465–82. [Google Scholar] [CrossRef]
- Vo, Anh The, Duc Hong Vo, and Quan Thai-Thuong Le. 2019. CO2 Emissions, Energy Consumption, and Economic Growth: New Evidence in the ASEAN Countries. Journal of Risk and Financial Management 12: 145. [Google Scholar] [CrossRef] [Green Version]
- Wang, Chien Ho, Ming Hui Ko, and Wan Jiun Chen. 2019. Effects of Kyoto Protocol on CO2 emissions: A five-country rolling regression analysis. Sustainability 11: 744. [Google Scholar] [CrossRef] [Green Version]
- Wang, Shaojian, Shuang Gao, Shijie Li, and Kuishuang Feng. 2020. Strategizing the relation between urbanization and air pollution: Empirical evidence from global countries. Journal of Cleaner Production 243: 118615. [Google Scholar] [CrossRef]
- Yang, Wenyue, Tao Li, and Xiaoshu Cao. 2015. Examining the impacts of socio-economic factors, urban form and transportation development on CO2 emissions from transportation in China: A panel data analysis of China’s provinces. Habitat International 49: 212–20. [Google Scholar] [CrossRef]

Publisher’s Note: MDPI stays neutral with regard to jurisdictional claims in published maps and institutional affiliations. |
© 2022 by the authors. Licensee MDPI, Basel, Switzerland. This article is an open access article distributed under the terms and conditions of the Creative Commons Attribution (CC BY) license (https://creativecommons.org/licenses/by/4.0/).