Article

Application of Social Network Analysis to Visualization and Description of Industrial Clusters: A Case of the Textile Industry

by
Marina Y. Sheresheva
1,*,
Lilia A. Valitova
1,
Elena R. Sharko
2 and
Ekaterina V. Buzulukova
1
1
Department of Economics, Lomonosov Moscow State University, 119991 Moscow, Russia
2
Department of Marketing at the Graduate School of Business, National Research University Higher School of Economics, 119049 Moscow, Russia
*
Author to whom correspondence should be addressed.
J. Risk Financial Manag. 2022, 15(3), 129; https://doi.org/10.3390/jrfm15030129
Submission received: 29 December 2021 / Revised: 25 February 2022 / Accepted: 4 March 2022 / Published: 8 March 2022
(This article belongs to the Special Issue Trends in Information Technology)

Abstract

:
This paper discusses the issues of industrial cluster analysis. Initially, the authors explore theoretical approaches to understanding the clusters phenomenon and their identification and analysis. Looking at industrial clusters as network structures connected by various forms of interaction between members, such as ownership linkages, transactions, the presence of common counterparts, and participation in arbitration processes, the authors propose visualizing clusters using social network analysis metrics. This approach helps to address one of the main difficulties when contacting the members of industrial clusters for a subsequent survey or in-depth interviewing. The analysis concludes with a discussion of the proposed method as a way to identify cluster members and determine the most significant ones that are the primary nodes of the network. These key members usually possess enough relevant information about the structure, coordination mechanisms, general strategy, and cluster management system. Therefore, it is possible to limit the list of interviewed respondents without a substantial loss in empirical data quality. The case of the textile industry cluster presented in this paper confirms the applicability of social network analysis to the visualization and description of industrial clusters.

1. Introduction

The cluster model of business organization has had broad recognition since the 1990s. Out of about 1400 cluster organizations created in the world economy in the 1990s, approximately 60% had government funding (Ménard 1996). The general flow of clustering in different countries that began in the 2000s continues today with different directions and forms of cluster policies. The most widespread are the so-called “cluster initiatives”, organizational efforts to increase the growth and competitiveness of clusters within the region (Maskell 2001; Islankina and Thurner 2018). Cluster initiatives mainly focus on the creation of “artificial” clusters, or cluster organizations, with the aim to coordinate the actions of participants, develop their cooperation, support innovation, and attract external resources such as foreign investment, a skilled workforce, know-how, and financial capital (Melnik 2015).
Many countries benefit from the cluster model of business organization, including the leading economies, namely China, the USA, and EU countries (Brenner and Mühlig 2013). More than half of all enterprises in the USA are collaborating within clusters, producing more than 60% of their GDP. There are about 3000 clusters in the EU that account for almost every fourth job in Europe (61.8 million jobs, or 23.4% of the total employment) and about half of employment in exporting industries (50.3%). Productivity within clusters is higher than the average productivity in the economy, corresponding to a 25% above average productivity effect. The usage of clusters differs across sectors. The highest employment shares of clusters are in leather and related products (85.5% of all employment is based in clusters), footwear (71.5%), and video production and distribution (70.5%). The employment shares of clusters are the lowest and below 30 percent in metal mining and music and sound recording (EOCIC 2020).
A century ago, Alfred Marshall was among the first to point out that groups of collaborating enterprises located close to each other and engaged in related activities can benefit from positive externalities (Marshall 1922). He underlined that the concentration of firms in close geographical proximity within “industrial districts” allowed all firms to enjoy the benefits of large-scale industrial production and of technical and organizational innovations.
Since then, many authors studied the phenomena of clusters, industrial districts, and other kinds of business structures that help economic actors to gain positive effects from joint activities. In recent years, there is a growing body in the academic literature on industrial cluster identification (Vom Hofe and Bhatta 2007; Brachert et al. 2011; Stejskal 2011; Papagiannidis et al. 2018; Kozonogova et al. 2019). However, the literature on the issue of identifying and depicting industrial clusters as inter-organizational networks arising and developing in emerging markets is relatively scarce.
In this paper, we focus on social network analysis (SNA) as a promising tool to visualize industrial clusters, taking as an example the case of the Russian textile industry. Looking at industrial clusters as network structures connected by various forms of interaction between cluster members, including property ties, transactions, the presence of common counterparts, and participation in arbitration processes, the authors propose to visualize clusters using social network analysis metrics. This approach helps to overcome one of the main difficulties when contacting the members of industrial clusters for a subsequent survey or in-depth interviewing. The analysis concludes with an examination of the proposed method as a way to identify cluster members and determine the most significant ones that are the main nodes of the network. These key members usually possess enough relevant information about the structure, coordination mechanisms, general strategy, and cluster management system. Therefore, it was possible to limit the list of interviewed respondents without a substantial loss of empirical data quality.
The rest of the paper is organized as follows. In Section 2, we discuss theoretical approaches to understanding the phenomenon of industrial clusters, as well as approaches to cluster identification. In Section 3, we clarify the methods implemented in the study and briefly describe the process of data collection and analysis. In Section 4, we discuss the results in the application of the proposed method as a way to identify cluster members and determine the most significant ones. Section 5 contains conclusions, research limitations, and directions for future research.

2. Literature Review

2.1. Industrial Cluster as an Inter-Organizational Network

The active study of clusters as real-life phenomena that provide positive economic consequences for their participants began at the turn of the previous and current centuries (Porter 1998; Martin and Sunley 2003; Brenner 2004). Researchers from different areas (e.g., business management, economics, and social and geographical science) are trying to explain the phenomena. “As a result of different disciplines’ varying research objects, many definitions of clusters exist” (Bode et al. 2010, p. 92).
Most definitions of business or industrial clusters as localized groups of organizations are based on Michael Porter’s approach (Porter 1998). He described clusters as geographically proximate groups of interconnected companies and associated institutions in a particular field linked by commonalities and complementarities, and he underlined that clusters encompass an array of linked industries and other entities important to competition (Porter 1998, 2000).
Therefore, the specific features of industrial clusters are geographic localization, a “core” of producers, the complementarity of the resources and competencies of cluster members, coopetition (i.e., cooperative strategies along with competitive intentions (Newlands 2003; Sheresheva 2016)), network externalities (Sozinova et al. 2017; Felzensztein et al. 2018), and empirically confirmed long-term sustainable relationships of cluster members (Bode et al. 2010; Breznitz 2013).
Sustainability is ensured through an internal system of norms and rules that are understandable for all cluster members and through long-term collaboration attractive to them as business actors. Simultaneously, each organization pursues its own goals. Therefore, the need for alignment of interests is always in place; orchestration emerges as a capacity to capture, extract and generate value for the cluster (Sheresheva 2010; Bittencourt et al. 2018; Orekhova et al. 2020). It is also important (and empirically confirmed) that institutions external to the cluster substantially influence the internal system of norms and rules established by cluster members (Bek et al. 2013; Valitova et al. 2021).
The system of norms and rules that takes shape within a cluster includes a mechanism for resolving conflicts and is partly determined by external institutions. Thus, Albino et al. (2007) noted that in many Italian industrial districts, an association of firms operating in the district or a chamber of commerce can play an intermediary role. Intarakumnerd (2005) underlined that there are many forms of intermediary organizations, such as industrial and trade associations, professional associations, research technology organizations, private foundations, and so on.
There are two different ways to initiate clusters. Most authors consider the organic (“grass root”) model of cluster creation by private companies a more effective one, leading to stronger results (Razminienė et al. 2021). They underline that the model of cluster initiation led by public administration usually provokes a sudden reaction with a less probable long-term existence of the newly established cluster (Kowalski 2020).
Cluster members can gain a competitive advantage over similar “unsystematically organized” economic entities (Agafonov 2010, 2015). An industrial cluster provides a competitive advantage not only through cooperation in production and marketing but also through the implementation of joint strategies in the field of technological innovation (Peeters et al. 2001; Bek et al. 2013; Yim et al. 2020). It is worth underlining that the individual potentials of cluster members and system resources are equally important, with their synergy provided by the presence of a knowledge network (Expósito-Langa et al. 2015; Belso-Martínez et al. 2020).
Accordingly, a full-fledged cluster is not just a collection of enterprises embedded in a specific production chain. It is an inter-organizational network structure (Sheresheva 2010; Martínez et al. 2012) or business ecosystem in the terms of James Moore, who set up a new metaphor for coopetition drawn from the study of biology and social systems. He suggested that any company is not only a member of a single industry but a part of a business ecosystem that crosses a variety of industries. As part of a business ecosystem, companies “co-evolve” around innovations, and they work cooperatively and competitively to support new products and satisfy customer needs. The cluster member entities also include suppliers, lead producers, competitors, and other stakeholders. Over time, they co-evolve their capabilities and roles and tend to align themselves with the directions set by one or more central companies (Moore 1993, 1996). Clusters include not only producing firms but also scientific and educational institutions, non-profit organizations, foundations, centers created by regional authorities to support companies in the cluster, and other organizations (Baggio and Sheresheva 2014).
Inter-organizational collaboration within a cluster allows achieving a synergy effect through the sharing of resources, use of common infrastructure, and coordination of strategies (Sheresheva 2010; Khakimov 2019; Razminienė et al. 2021). One can say that the competitiveness of clusters lies within the most common things: knowledge, relationships, innovations, a common pool of resources, and digital transformations (Pavelkova et al. 2021). At the same time, if we consider clusters as network structures (Bergenholtz and Waldstrøm 2011), then there is a need for a mechanism to align the different interests of stakeholders and coordinate their actions. The growth of inter-organizational structure complexity also includes a danger of reduced flexibility and ability to innovate. Therefore, not only positive but also negative externalities are possible (Giuliani et al. 2019). Actually, benefits for cluster members are usually asymmetric (McCann and Folta 2011). Some authors also argue that in many cases, clustering appears to be not a way to develop competitiveness but simply a way to survive (Pavelkova et al. 2021).
Therefore, a real cluster is a strategic inter-organizational network of a sectoral or inter-sectoral nature, integrating the resources and key competencies of firms and other organizations concentrated and localized within a certain territory (Sheresheva 2010). Clustering is generating network synergy among industries, universities, research institutes, and other actors in a specific region so that it has a competitive edge over other regions (Yim et al. 2020). The benefits for business from the development of a cluster may include increased efficiency, reduced transaction costs, higher flexibility, and innovative potential, though these benefits are not guaranteed per se.

2.2. Approaches to Identifying Industrial Clusters

The issue of cluster identification is still a subject of discussion, both in the academic community and in practice. In general, we can talk about the existence of several widely used approaches and subdivide them into two groups, namely top-down and bottom-up ones. A top-down approach presupposes the search for a spatial concentration of production and focuses on specific types of economic activity. When using a bottom-up approach, the identification of clusters on a specific territory occurs based on the presence of previously known enterprises and leading industries (Kudrjavtseva and Zhabin 2014).
Up to now, most researchers focused on identifying vertically organized structures consisting of enterprises connected by the technology of producing the final product (Kozonogova et al. 2019). At the same time, much less attention is paid to the explicit and implicit horizontal ties that arise between firms of a similar type competing between each other at various stages of production. The horizontal ties between entities belonging to clusters are highly diversified and poorly formalized. These relations are based on mutual trust, greater openness of communications, internal mutual control, and contractual relations.
There is an algorithm for cluster identification that was proposed by Michael Porter (Porter 2003, 2004). Initially, the spatial localization of industries or enterprises (territorial industry specialization) is determined based on an estimate of the number of people employed in the respective industries. Local industries focused on meeting the needs of local residents (for example, retail trade), according to Porter’s methodology, are not part of cluster identification process.
After identifying industries with higher employment concentrations, Porter identified enterprises that were in spatial proximity to each other. Further, the composition of clusters was specified by excluding those enterprises that had performance indicators (employment and output) weakly correlated with each other. Porter assumed that firms belonging to a cluster gain a competitive advantage due to the achieved synergetic effect, which is an additional factor of sustainability.
In our opinion, Porter’s approach, like any other top-down approach (for example, the methodology of the European Cluster Laboratory), is limited in its scope, as it does not allow moving from the analysis of industrial clusters as a concentration of enterprises to the analysis of clusters as ecosystems of symbiotic organizations. Co-localization of enterprises belonging to related economic activities can potentially form a cluster, but this approach does not provide an opportunity to understand the network ties between firms.
In this regard, the application of social network analysis (SNA) to the study of industrial clusters has high potential. As an example, Esposito-Langa, Thomas-Mikel, and Molina-Morales conducted an empirical study on a set of firms in the Valencian textile cluster to show the sources of innovation activity and provide a picture of innovation processes in the cluster (Expósito-Langa et al. 2015). At the first stage, they applied the SNA method to study the structure of relationships and then conducted a series of individual interviews with representatives of organizations participating in the cluster in order to obtain more detailed and in-depth information. As a result, it was possible to demonstrate that network analysis is capable of resolving several tasks related to the identification of business relationships, which constitute one of the most difficult metrics for analysis.
We propose an approach to identifying clusters also based on representing them as a network of interacting firms.

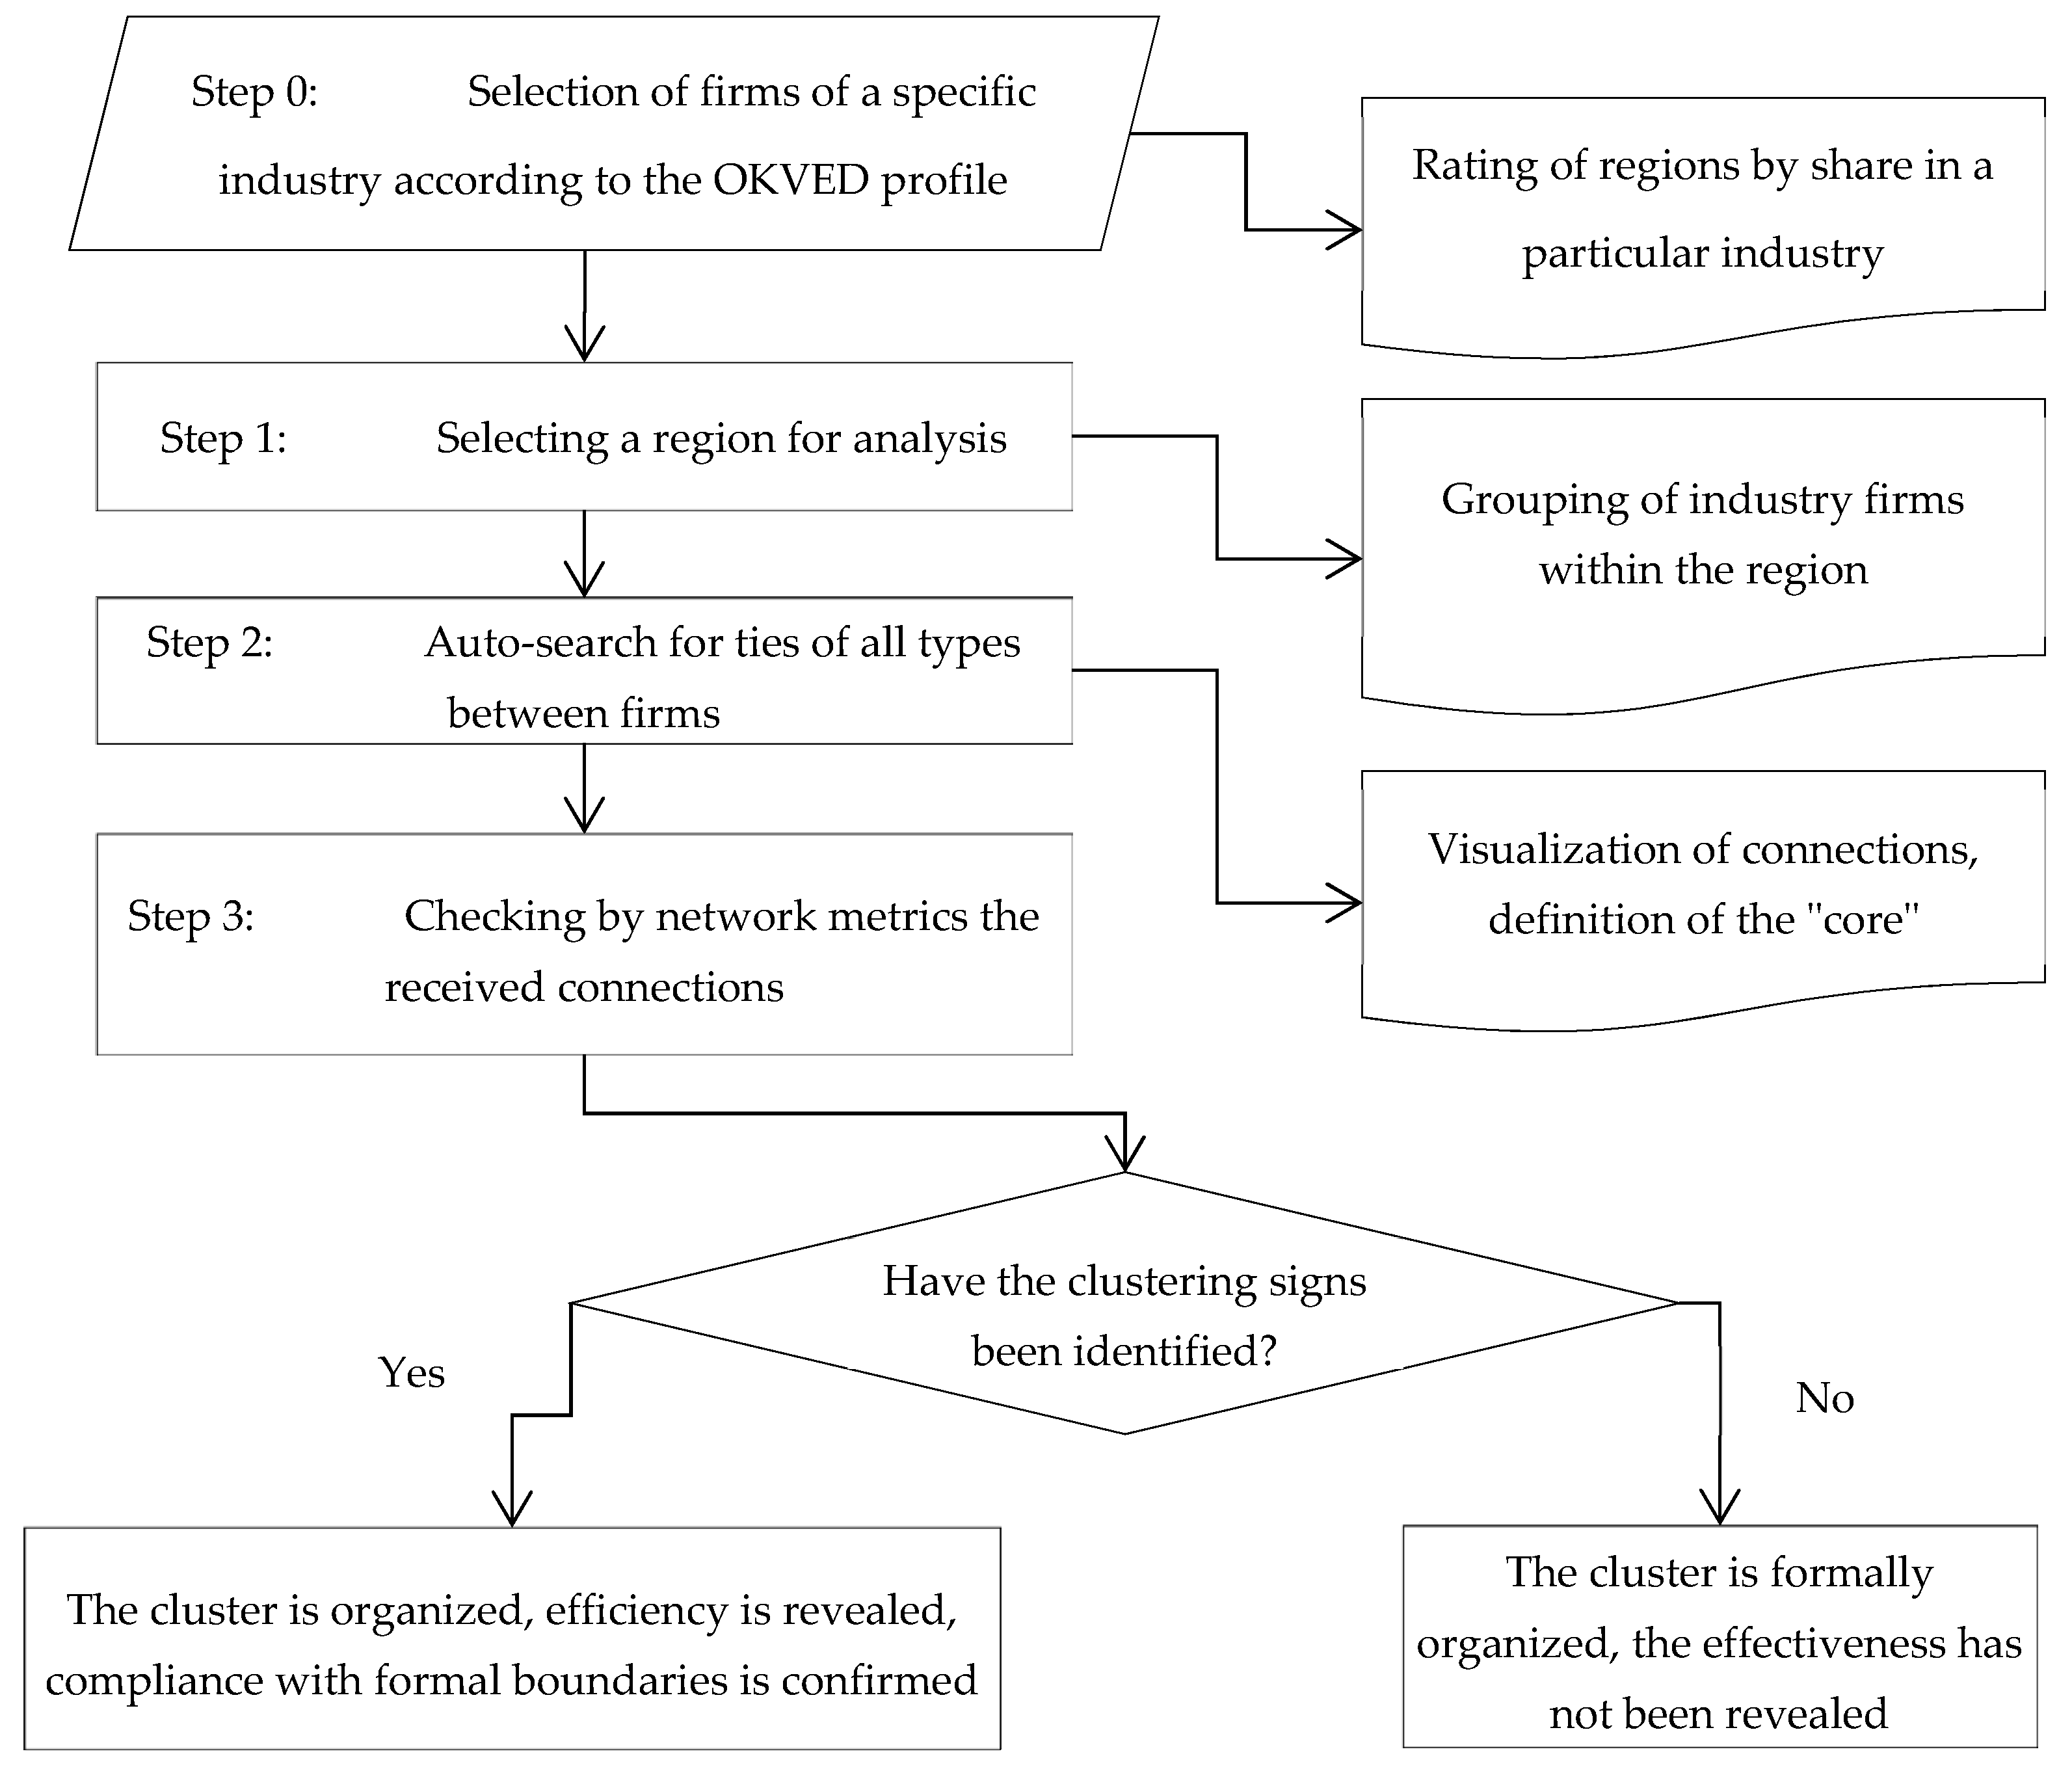
3. Materials and Methods

In our analysis presented in this paper, we tried to combine two approaches. First, we used information on process linkages based on the inter-sectoral balance tables («input-output tables») in order to identify related industries. At the same time, we considered information on the real business relationships between firms. In the second stage of analysis, we described the initial network structure based on the received information on the links between textile firms and firms from related industries. In the third stage, we calculated the specific network metrics and determined the importance of each firm in terms of its position (role) in the network. The next stages of the study are still on the way presently. We started interviewing the most “connected” cluster participants to gain detailed information on inter-firm relationships and to refine the cluster network structure. The algorithm of the proposed approach is shown in Figure 1.
Our initial research object was the plethora of textile-related entities in the Ivanovo region of Russia that we assumed would form an industry-related cluster.
The considerations of our choice were the following.
Firstly, the textile industry has well-defined boundaries from the sectoral linkages point of view (connected only with the electric power industry, the chemical industry, and tailoring). This made it easier to identify cluster members and limit their foreseeable number.
Secondly, there are enterprises belonging to all stages of the textile technological cycle in Russia, despite the significant volume of imports of fabrics and finished garments.
Thirdly, the production of fibers, fabrics, and tailoring is an old traditional industry in the Ivanovo region well-represented by enterprises of various sizes, including a large number of small and medium enterprises (SMEs).
We agree with those researchers who emphasized that we should count as a real industrial cluster a collaborative network of organizations that actually exists, regardless of its formal status (Fedorov 2021). Therefore, the list of cluster members identified by the government bodies should be considered only as an attempt to identify the composition and boundaries of the actual structure (Porter 2004). Our objective was to confirm that the Ivanovo region case presented below was an example of the “unobservable” de facto existing cluster while not being recorded by official Russian statistics, as cluster participants do not wish to formalize their way of collaboration and declare themselves as a cluster.
The textile industry has historically been developed in the Ivanovo region since the 18th century. Textile manufacturing continues to be a regional specialization of local and regional significance (the region’s share in textile industry employment is 16.6%, and the industry’s share in regional employment is 6.4%). Despite this fact, the official cluster registers (Russian Cluster Observatory and the Russian Ministry of Industry and Trade registers) do not record the existence of any textile cluster in the region. Actually, the Russian Ministry of Industry and Trade identifies only two industrial parks related to the textile industry. These are Krasnaya Talka, created on the basis of previously existing production facilities with reconstructed engineering and transport infrastructure (6 residents), and Rodniki, created on the basis of the Bolshevik textile mill (57 residents).
In order to explore clusters of textile enterprises, we turned to the open database of industrial enterprises developed by the information and analytical company SPARK-Interfax (SPARK-Interfax 2021). According to the SPARK-Interfax register, there are at least 470 enterprises for the main type of activity “textile industry” and “garment production” in the Ivanovo region, of which at least 50 entities have a “lifespan” of more than 20 years.
We selected the Ivanovo region enterprises recorded as textile and garment producers. In addition, we included industry wholesalers. As a result, we compiled a list of 928 companies engaged in the production and selling of textiles and garments. Thirteen firms on this list indicated “spinning of fibers” as their main activity, 76 indicated “fabric production”, 17 said “production of non-wovens”, 152 said “production of clothes”, 172 said “wholesale trade”, 152 said “retail” (including 5 Internet retailers), 1 said “higher education” (St. Petersburg Higher School of Folk Arts), 1 said “professional education”, and 7 said “freight traffic”. In addition, six organizations included in the list referred to “activities for the management and operation of prisons, correctional colonies, and other penitentiary institutions, as well as for the provision of rehabilitation assistance to former prisoners”. Former prisoners sew clothes there; therefore, one could rightfully consider these organizations as participants in the textile cluster.
In order to determine the cluster’s overall boundaries, it is necessary to understand the presence and nature of the interactions between the enterprises and organizations concentrated in a local area (Valitova et al. 2021). One can consider both formal contracts (partnership, work, and property contracts) between cluster members and informal ties (trust, interaction on the same platform, information exchange, belonging to the same business association, etc.).
Information about the links between firms within the industry is mostly not open to the public. Business management does not disclose the names of their counterparts, intermediaries, etc., and enters into appropriate non-disclosure agreements. In some cases (for example, when diligence checks are conducted by commercial banks or potential counterparts), firms disclose information from accounting and tax reporting, data on separate divisions and licenses, and commercial information including a list of customers, the pricing policy, tax audit results, and a business’s reputation.
The toolkit for checking the reliability of potential counterparts includes various accounting or legal services and information platforms for aggregating complete information about an economic actor. In order to obtain information about binary connections between enterprises in the textile industry necessary for further analysis, we used data on the counterparts of the “Search Ties” service of SPARK-Interfax. This included open source information, including information published by the Federal Tax Service, Arbitration Courts, the Bailiff Service, and other Russian official bodies. Specifically, the following information was collected:
  • Ownership of equity management (including arbitration management);
  • Connections between possible relatives;
  • Registration address, phone, and e-mail;
  • Historical connections;
  • Franchise;
  • Common counterparts (for government contracts, arbitration courts, etc.).
Equity ownership is the most formalized and reliable part of the data on relationships between enterprises. The logic of considering a network of affiliated enterprises to be an industrial cluster (a network of interacting enterprises) is as follows. A share in equity provides the highest level of control over the counterpart. This is much greater than control through informal and formal agreements, as it guarantees the fulfillment of business obligations under conditions of uncertainty and gives business ties additional resilience.
The next stage of the study was the analysis of pairwise connections between enterprises in the textile industry using social network analysis (SNA), which is appropriate for investigating social structures (Borgatti et al. 2018; He 2019; Khalid 2019). In addition to compact visualization of all ties, SNA software based on networks and graph theory allows one to evaluate network metrics in terms of both the characteristics of the network itself and each of its constituent nodes. In our case, we used the analytical package NodeXL Basic (NodeXL 2021).
NodeXL can analyze the pairwise relationships between firms (which were obtained in the previous steps from the SPARK “Search Ties” information), and then it creates a complete picture of the business relationships between firms based on these binary ties. SNA originates from mathematical graph theory. In addition to the idea of representing a network as a graph from vertices and edges, it also counts certain metrics, namely the characteristics of the nodes in terms of their position in the network (for instance, metrics of centrality) and the characteristics of a whole network (network density, average geodesic distance, etc.).
For the real objects (in our case, firms), these network metrics make economic sense, as they highlight the most significant members of the cluster in terms of connections with other participants.
We examined a sample of the textile industry enterprises, for which this production is the main one, limiting the number of enterprises for research to the 10,000 “oldest” enterprises (i.e., those that were from 5 years to 61 years old).

4. Results and Discussion

Our analysis has shown that out of the 10,000 enterprises in the sample, 7266 had ties with at least 1 enterprise. The Ivanovo region that we chose was part of these connections 1388 times. In terms of the share of interacting enterprises in the textile industry among all ties, the Ivanovo region was in 4th place (7%) after Moscow (16%), the Moscow region (8%), and St. Petersburg (7%). Thus, when moving from the analysis of potential cluster members to the analysis of the identified ties, the Ivanovo region remained among the leaders in terms of interacting enterprises in the industry.
We analyzed the ratio of industry enterprise ties formed within the region (29%) and outside it (with the same firms in other regions). The result gives reason to go beyond a rigid regional tie when identifying a network structure.
There are large beneficiaries that own equity shares in Russian textile industry enterprises, namely the Federal Property Management Agency, the Ministry of Economic Development, the All-Russian Association of the Blind (VOS), the All-Russian Society of the Deaf (VOG), and the All-Russian Society of Disabled People (ARSDP).
The interpretation notes for Figure 2 are the following:
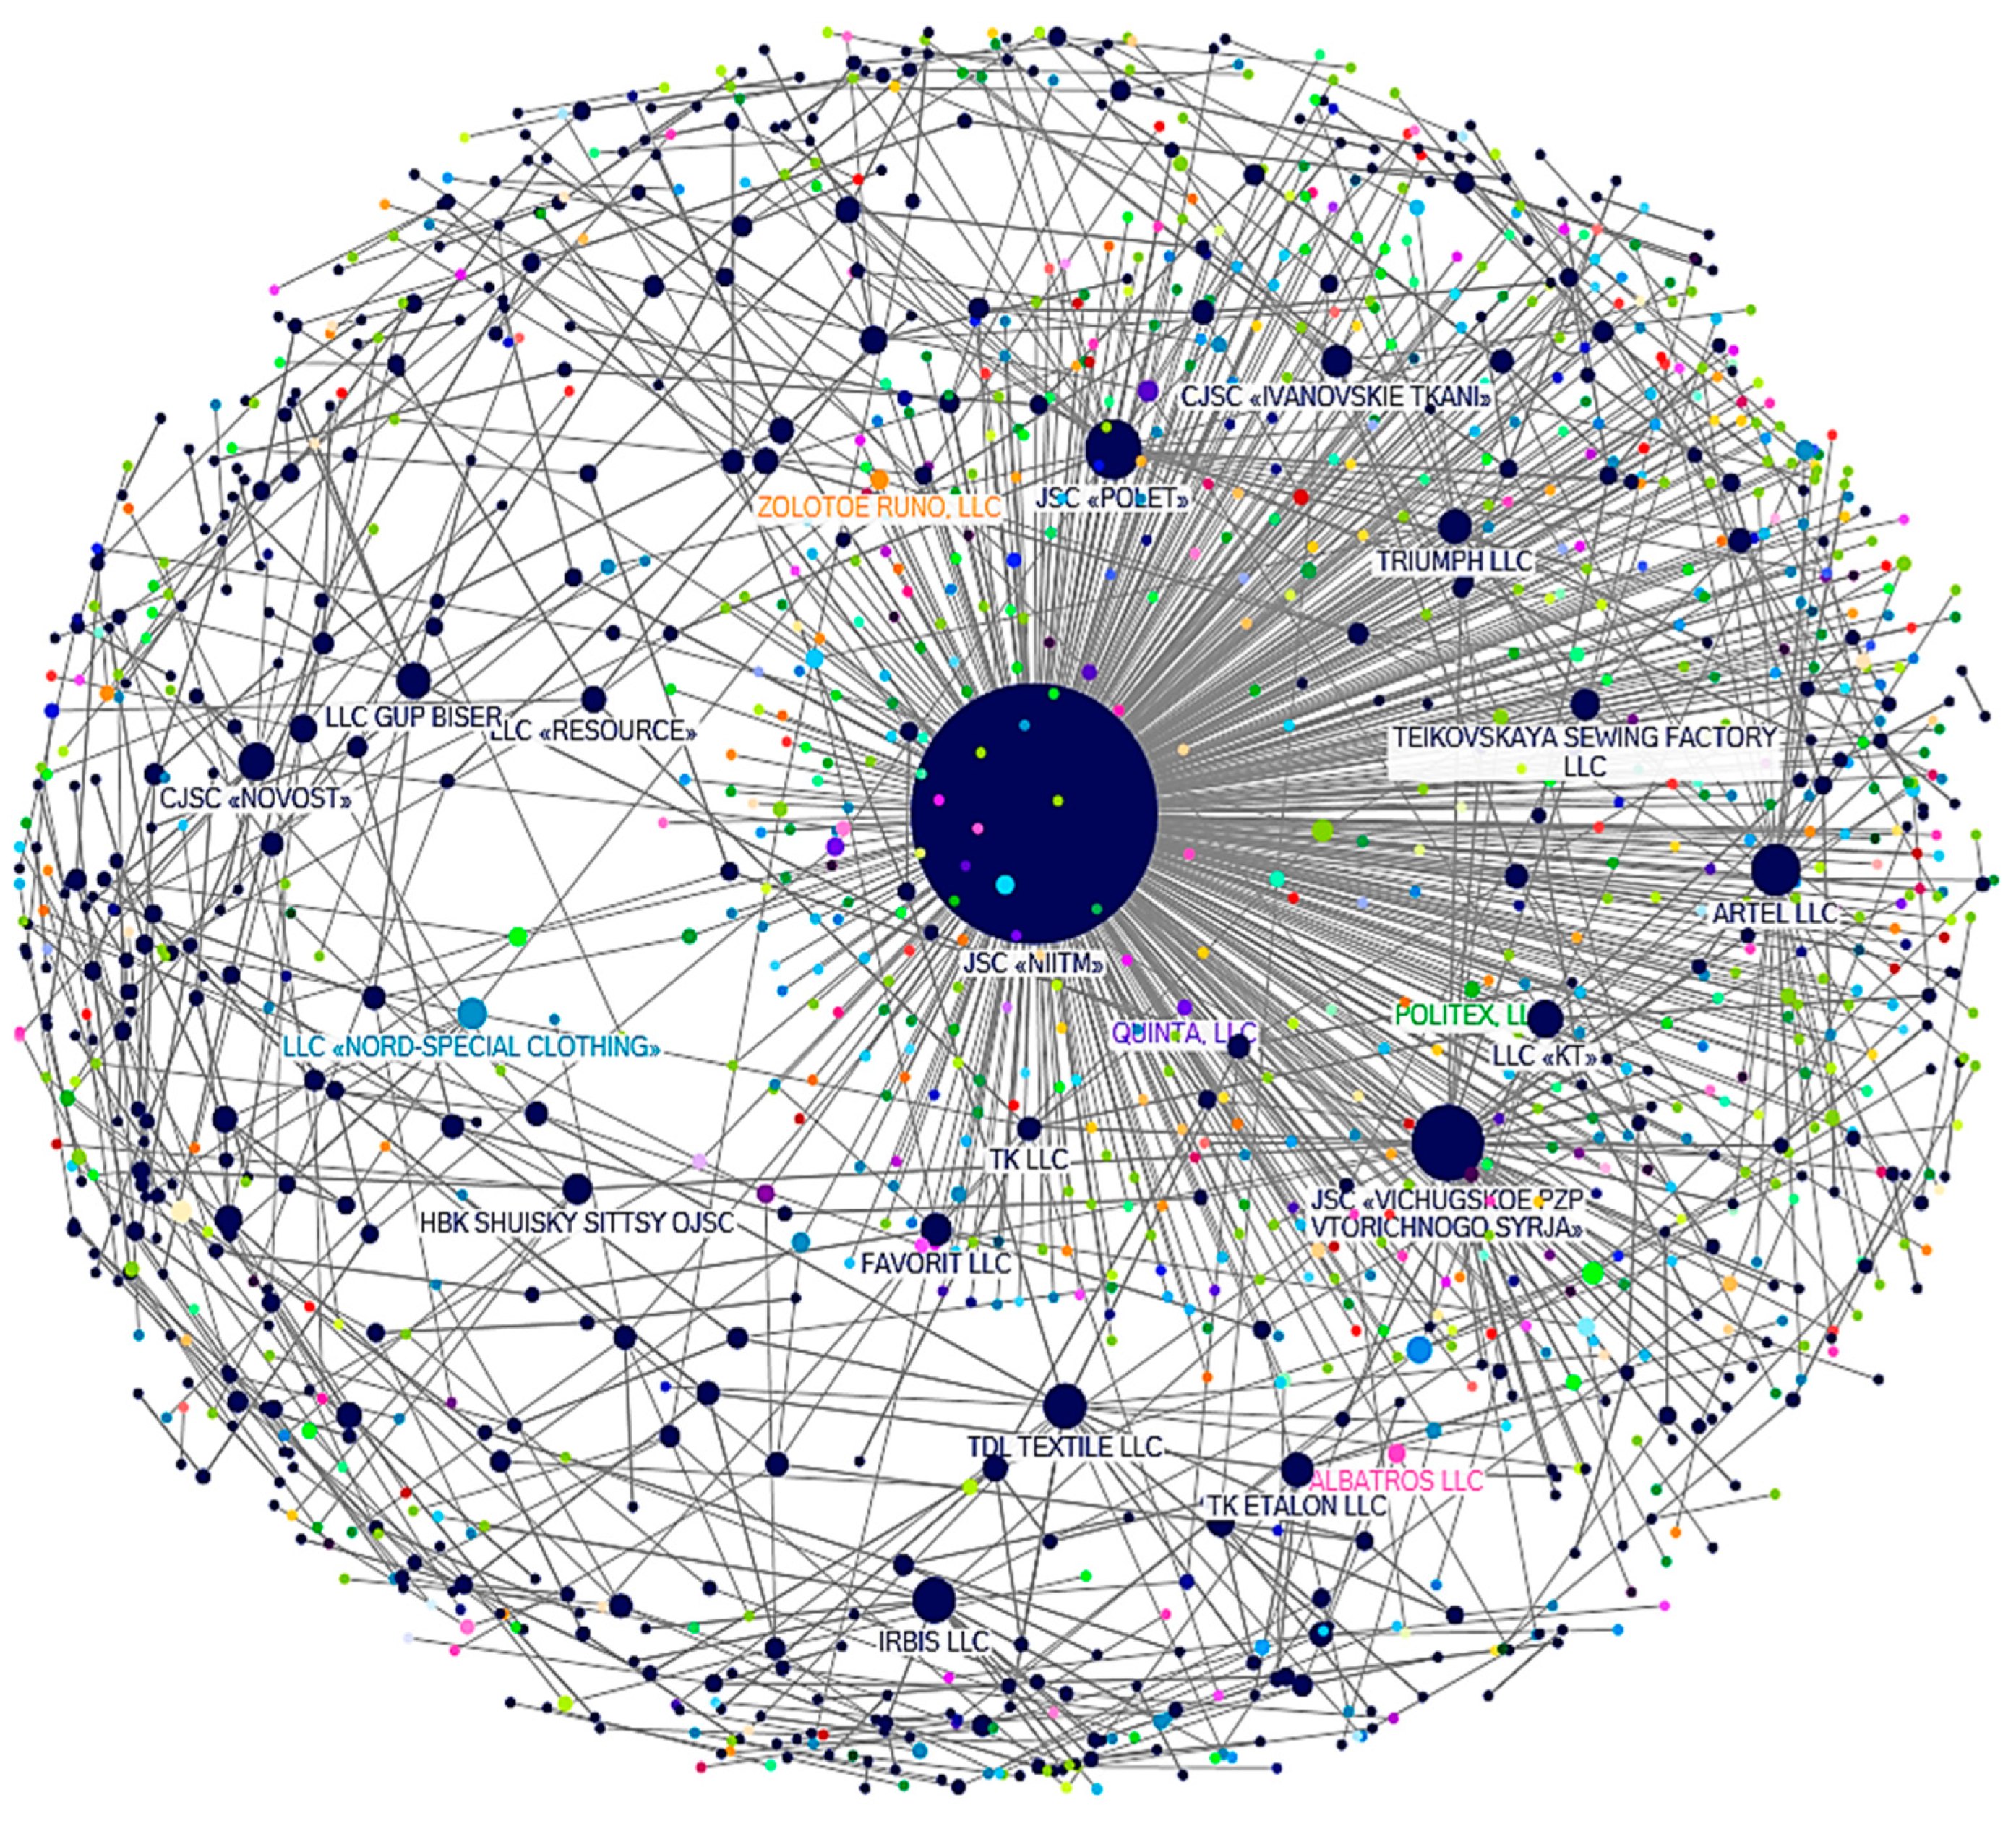
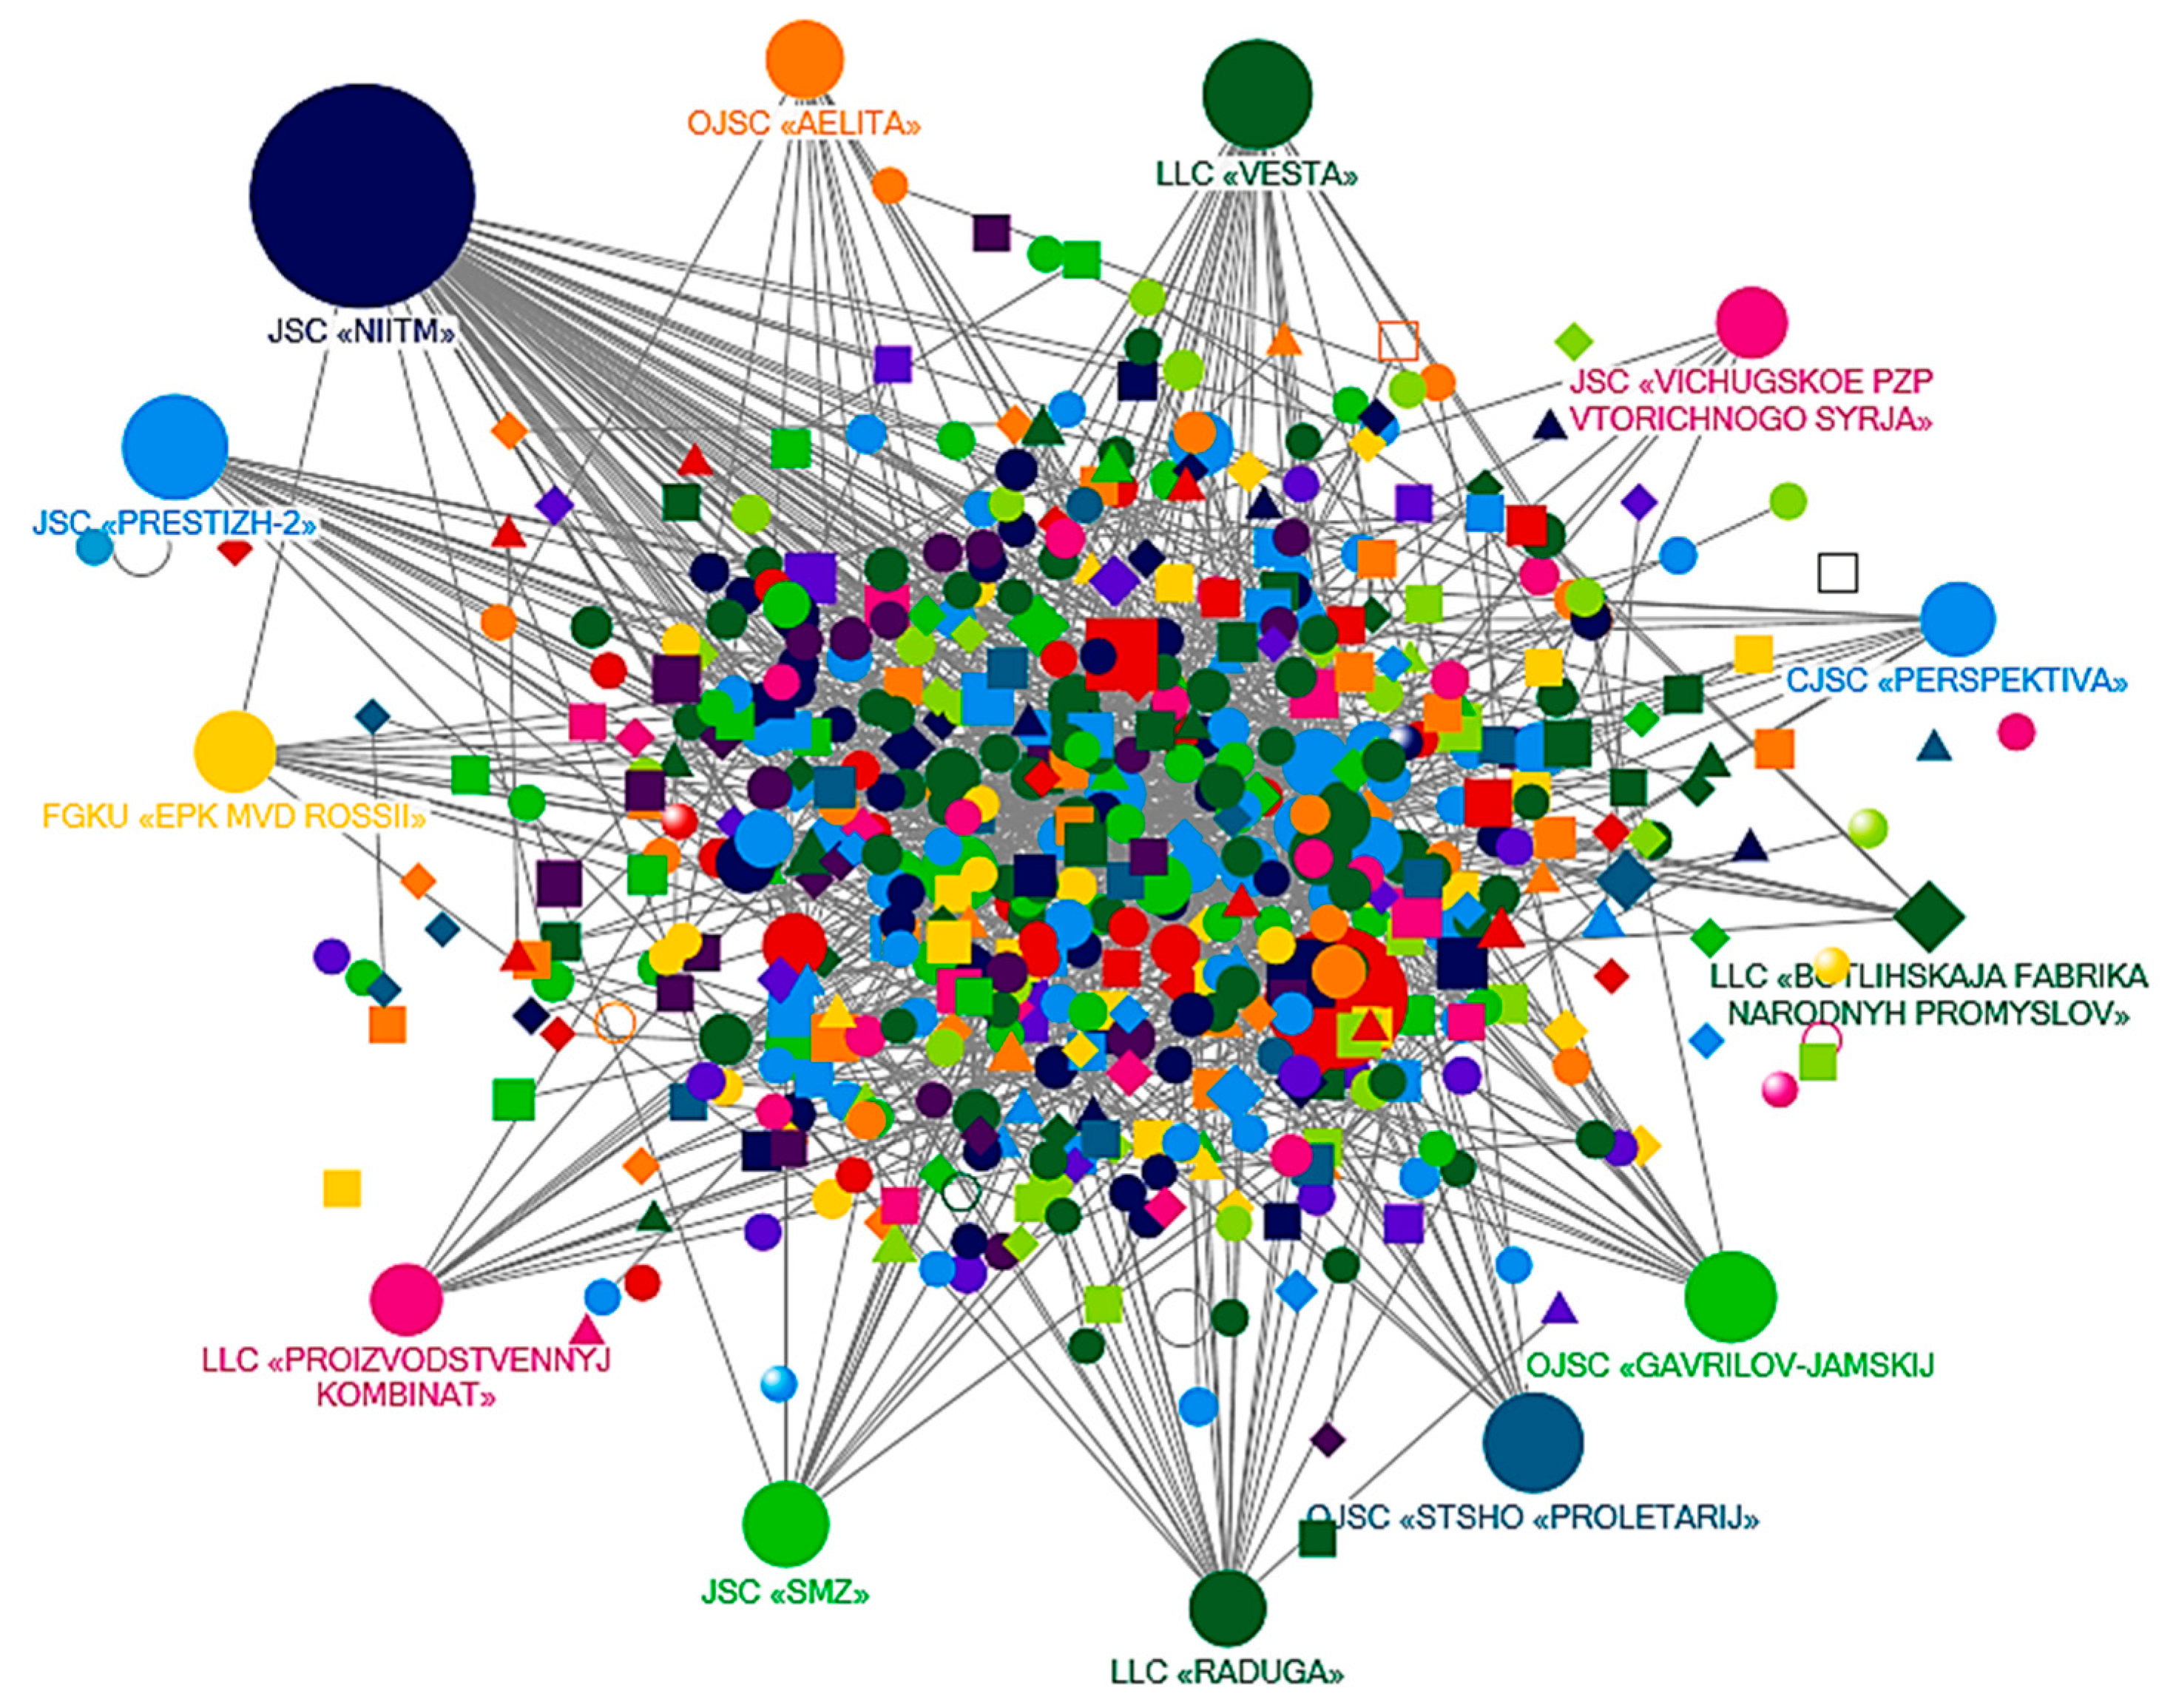
  • Only firms with more than four connections are present;
  • The size of the node reflects the number of connections;
  • Firms from different regions are indicated in different colors.
Figure 2 shows a network of interconnected textile enterprises in all 85 Russian regions. In terms of the total number of connections between the network participants, first place was taken by the Ivanovo JSC “Scientific Research Institute of Textile Materials” (JSC “NIITM”), created on the basis of the reorganized Federal State Unitary Enterprise “Scientific Research Institute of Textile Materials”. The JSC “NIITM” had connections with 538 textile industry enterprises. This was followed by the Moscow enterprise LLC “Vesta” (123 connected firms), Yekaterinburg JSC “Prestizh-2” (112 connected firms), JSC Serpukhovskoe textile and clothing production STSHO “Proletarij” (101 connected firms), and Yaroslavl flax plant JSC “Gavrilov-Yamskij Lnokombinat” (82 connected firms). There were firms with a large number of ties in the textile industry in almost every region.
We also calculated another network metric, namely the betweenness centrality that gives more weight to those nodes (firms) that perform important intermediary functions. Enterprises with these functions were located in the Ivanovo region, in Moscow and the Moscow region, the Sverdlovsk, Chelyabinsk, Yaroslavl, and Belgorod regions, the Republic of Mari El, Kabardino-Balkaria, and Tatarstan. The maximum number of chains of counterparts passed through them and between any two enterprises not directly connected. The result of the analysis by betweenness centrality was almost the same, as only one firm, Tver LLC “Raduga”, entered the same list of leading firms (see Table A1).
Table A2 lists the 30 businesses with the most numerous ties. There were manufacturers of fibers and fabrics, enterprises producing garments and overalls, departmental ateliers, a handicraft factory, an industrial research institute, as well as the production of non-woven materials from recyclable materials. These are several types of enterprises, with some of them tightly connected with the cluster “core” by technological chains and some providing communication with the “outside world” (i.e., with customers). In general, one can conclude that there were elements of a cluster industrial system, namely the basic production “core”, universities and research organizations, and groups of interconnected enterprises.
One can see that wholesalers, retailers, transportation providers, and training entities were not part of the sample. These activities were not included in the final sample for depicting the network due to a large amount of data, although adding them could have improved the completeness of “the big picture”.
By applying the described network approach to the allocation of clusters at the regional level, we isolated the enterprises of the Ivanovo region; that is, we considered a network consisting of edges, one of the nodes of which was the Ivanovo textile enterprise (see Figure 3).
It was found that the textile industry enterprises of the Ivanovo region were connected with the textile industry enterprises from 74 Russian regions to the greatest extent, with the Ivanovo firms (29%) first, followed by Moscow and the Moscow region (20%), St. Petersburg (5%), Krasnodar, Nizhny Novgorod, Novosibirsk, Perm, Tyumen, Samara, and Yaroslavl regions (2% each). Thus, it made sense to identify a regional textile cluster centered in Ivanovo while only taking into account the location of the largest industrial institute in the Ivanovo region. However, the real cluster boundaries went far beyond this particular region.
The most significant participants in the selected textile cluster—not necessarily the largest ones, but the leading ones from the network metrics perspective—were the JSC NIITM, as well as (in second place) the Vichugskoye production and procurement enterprise of recyclable materials. The last one had established connections with textile enterprises in many regions, the sewing association JSC Polet, LLC Artel—which produces nonwovens—and LLC TDL TEXTIL, a large Ivanovo manufacturer of bed linens. Table A3 shows a list of the 30 participants of the Ivanovo regional textile cluster with the most numerous connections.
The next stage of our research will include conducting surveys of textile cluster participants and in-depth interviews with the management of the most significant enterprises in the network. We can assume that, as in the case of social systems, cluster participants have obtained specific roles in terms of information possession and the relative advantages of reduced transaction costs in communicating with other cluster members. In this case, the researchers are able to refer to a limited list of respondents.
Table A4 contains a list of questions on our topics of interest: the history of cluster origins, the synergy effect (integration) for cluster participants, the alignment of stakeholders’ interests and coordination methods (management), the possible competitive ad-vantages, and the vision for the future.
We conducted a preliminary round of interviews and realized that it was necessary to narrow and clarify the range of firms surveyed, given both the limited financial and human and time resources.

5. Conclusions

Based on the conducted study, we can make some concluding remarks.
This research contributes to the academic literature on cluster development in transition economies by visualization of the intensive ties of Russian textile industry enterprises with the use of SNA software based on networks and graph theory.
Based on the literature review, we identified a gap in the methodology for determining the boundaries and ties of the cluster structures. In some cases, there was a discrepancy between the formally recognized clusters and real industrial clusters as network structures. Our study aimed to fill this gap in methodological and practical aspects.
Our analysis of the official Russian industrial clusters’ registers led to the understanding that the top-down approaches that propose looking at real clusters, with a strong focus on regional specialization and the enterprises belonging to the particular industry, would be insufficient in the case of the huge emerging market of the Russian Federation. Identification of real industrial clusters would also require analyzing the interactions between the formally collaborating firms situated in some locations. Moreover, there is a need to understand if these associations of firms are reporting on collaboration while primarily seeking to obtain compensation costs from federal or regional authorities based on becoming part of the register. Such a goal has nothing to do with the goals of real industrial clusters voluntarily formed by actors that align their interests and collaborate to gain a competitive advantage with their system of internal norms, rules, and coordination mechanisms.
The approach proposed by the authors was tested on a real case of the Ivanovo textile industry. Understanding industrial clusters as network structures connected by various forms of interaction between enterprises—by means of common property, transactions, the presence of common counterparts, and participation in arbitration processes—made it possible to visualize the cluster using network metrics and determine the main network nodes and their functionality. Thus, we identified the firms with the largest number of connections with other cluster members. These firms occupy a central position, linking the chain of counterparts of any network participants. These key members usually possess enough relevant information about the structure, coordination mechanisms, general strategy, and cluster management system. Therefore, it is possible to limit the list of interviewed respondents to these key entities without a substantial loss of empirical data quality. The case of the textile industry cluster presented in this paper confirms the applicability of social network analysis to the visualization and description of industrial clusters.
The next stage of the research is on the way now. We contacted the key actors (pointed out as important nodes in Figure 2 and Figure 3) and started a series of in-depth interviews to unveil if our initial results led to the identification of a real cluster. We compared the realized business connections between the textile firms mentioned by the respondents with the network ties depicted by means of SNA. The first conducted interviews confirmed that there are long-term relations between the key members of the cluster depicted in the first stage.
The findings confirm that SNA metrics are appropriate for visualizing industrial clusters as network structures connected by various forms of interaction between cluster participants, including equity ownership, transactions, and the presence of common counterpart participation in arbitration processes. This approach helps to overcome one of the main constraints when contacting the participants of industrial clusters for a subsequent survey or in-depth interviews.
Thus, a preliminary analysis of network interactions within the industry performed at the stage of formal cluster creation can help to either confirm or refute the potential effectiveness of “combining into a cluster”. The proposed approach can be applied to any industry where cluster structures are located and thus “check” for the compliance of truly effective network ties between participants. The obtained results of the analysis of network interactions of any cluster allow us to review the “correctness” of the cluster structure, determine the “real core” of the cluster, and understand which companies form a real cluster.
Finally, one can underline the implications for state policy. These focus on long-term economic development and competitiveness. Michael Porter has shown geographic concentrations of interconnected firms, and supporting or coordinating organizations in clusters are an important competitive strategy for governments to support. Taking into account that the aim of cluster policy is to boost the development of individual industries and regions, the possibility of obtaining a holistic picture based on information about linkages between enterprises is of particular importance in the implementation of cluster policies and decisions on public financing. In addition, understanding the organizational structure and its participants helps predict the development of the industry in the long term.
There are a number of limitations to this study. The lack of empirical data obtained for a broader sample of textile clusters from different regions is the biggest limitation. Therefore, collecting empirical data by means of interviewing CEOs of firms that are cluster members is a promising avenue for future research. The identification of cluster members and the selection of the most significant ones in terms of possessing important information about the structure, coordination mechanisms, general strategy, and cluster management system opens the way for receiving information on the above-listed issues in the course of in-depth interviews.
Future studies with access to longitudinal data will be able to cover the immediate status and long-term trends in the evolution of clustering of enterprises. This would improve the relevance and practical applicability of this research.

Author Contributions

Conceptualization, M.Y.S.; methodology, M.Y.S.; software, L.A.V.; validation, L.A.V.; formal analysis, E.R.S. and L.A.V.; resources, E.V.B., E.R.S. and L.A.V.; data curation, E.V.B., E.R.S. and L.A.V.; writing—original draft preparation, M.Y.S. and L.A.V.; writing—review and editing, M.Y.S.; visualization, L.A.V.; supervision, M.Y.S.; funding acquisition, M.Y.S. All authors have read and agreed to the published version of the manuscript.

Funding

This research was funded by the Lomonosov Moscow State University’s Faculty of Economics under the research project “Network methods application in the analysis of institutional factors of industrial clusters’ formation and development”.

Institutional Review Board Statement

Not applicable.

Informed Consent Statement

Not applicable.

Data Availability Statement

The data presented in this study are available on request from the corresponding author.

Conflicts of Interest

The authors declare no conflict of interest.

Appendix A

Table A1. Textile enterprises with the highest «betweenness centrality» metrics.
EnterpriseBetweenness CentralityRegion
JSC «NIITM»7,810,948Ivanovo region
LLC «VESTA»1,485,712Moscow
JSC «PRESTIZH-2»1,225,938Sverdlovsk region
LLC «RADUGA»1,156,502Chelyabinsk region
OJSC «STSHO «PROLETARIJ»901,402Moscow region
LLC «STIL»832,502Republic of Mari El
OJSC «GAVRILOV-JAMSKIJ LNOKOMBINAT»722,649Yaroslavl region
JSC «SMZ»709,992Moscow region
LLC «SILUET»670,088Kabardino-Balkarian Republic
FGKU «EPK MVD ROSSII»657,070Moscow
OJSC «AELITA»527,000Republic of Tatarstan
LLC «NADEZHDA»499,376Belgorod region
JSC = joint-stock company; OJSC = open joint-stock company; CJSC = closed joint-stock company; LLC = limited liability company; MUC = municipal unitary company; SFSI = state-owned federal state institution.
Table A2. Top 30 Russian textile enterprises with the largest number of connections.
EnterpriseNumber of ConnectionsRegionIndustry
1JSC «NIITM»538Ivanovo regionScientific research institute, manufacturing of other textiles
2LLC «VESTA»123MoscowCotton fabrics production
3JSC «PRESTIZH-2»112Sverdlovsk regionProduction of other clothing and accessories
4OJSC «STSHO «PROLETARIJ»101Moscow regionCarded wool fiber spinning
5OJSC « GAVRILOV-JAMSKIJ LNOKOMBINAT»82Yaroslavl regionManufacturing of textile fabrics
6JSC «SMZ»71Moscow regionManufacturing of finished textiles other than clothing
7SFSI «JEPK MVD ROSSII»63MoscowProduction of workwear
8OJSC «TREHGORNAJA MANUFAKTURA»62MoscowCotton fabrics production
9OJSC «AJELITA»58Republic of TatarstanManufacture of outerwear from textile materials, except knitted
10LLC «RADUGA»56Chelyabinsk regionProduction of workwear
11«LECHEBNO-PROIZVODSTVENNYE MASTERSKIE PRI KOVASHEVSKOJ PSIHIATRICHESKOJ BOLNICE»55Leningrad regionProduction of other clothing and accessories
12CJSC «PERSPEKTIVA»52Moscow regionProduction of workwear
13LLC «BOTLIHSKAJA FABRIKA NARODNYH PROMYSLOV»50Dagestan RepublicFelt production
14LLC «PROIZVODSTVENNYJ KOMBINAT»48Orenburg regionManufacture of outerwear from textile materials, except knitted
15JSC «VICHUGSKOE PZP VTORICHNOGO SYRJA»47Ivanovo regionProduction of non-woven textile materials and products other than clothing
16MUC «AURGAZINSKOE RPU BON»46Republic of Bashkortostan Production of other clothing and accessories
17LLC «KOMPRESSIONNYJ LAJNER»41Tomsk regionProduction of knitted and knitted hosiery products
18LLC «NADEZHDA»39Belgorod regionProduction of workwear
19LLC «SOZVEZDIE»36Nizhny Novgorod regionProduction of ropes, twine, and networks
20LLC «GENERALNYJ PROGON»35MoscowManufacture of outerwear from textile materials, except knitted or knitted
21LLC «BMP «ROSTOK»35Altai TerritoryProduction of other clothing and accessories
22JSC «DETSKAJA SHVEJNAJA KOMPANIJA»34MoscowProduction of other clothing and accessories
23LLC «JELEGANT»33Krasnoyarsk TerritoryProduction of other clothing and accessories
24LLC «SSHF»31Vladimir regionManufacture of outerwear from textile materials, except knitted
25LLC «AVS PLJUS»31Sverdlovsk regionProduction of other outerwear
26JSC PO «DINAMO»31MoscowManufacturing of finished textiles other than clothing
27LLC «SILUJET»30Kabardino-Balkarian RepublicProduction of other outerwear
28JSC «TEKSKOR»30Volgograd regionProduction of cord fabrics
29LLC «STIL»29Republic of Mari ElProduction of other outerwear
30JSC «POLET»29Ivanovo regionManufacturing of finished textiles other than clothing
JSC = joint-stock company; OJSC = open joint-stock company; CJSC = closed joint-stock company; LLC = limited liability company; MUC = municipal unitary company; SFSI = state-owned federal state institution.
Table A3. Top 30 participants of the Ivanovo textile cluster by the number of connections.
EnterpriseNumber of ConnectionsRegionIndustry
1JSC «NIITM»538Ivanovo regionScientific research institute, manufacturing of other textiles
2JSC «VICHUGSKOE PZP VTORICHNOGO SYRJA»47Ivanovo regionSalvage
3JSC «POLET»29Ivanovo regionGarment production
4ARTEL LLC22Ivanovo regionProduction of nonwoven materials
5TDL TEXTILE LLC17Ivanovo regionGarment production
6IRBIS LLC17Ivanovo regionProduction of workwear
7CJSC «NOVOST»12Ivanovo regionProduction of workwear
8LLC «KT»12Ivanovo regionProduction of workwear
9LLC GUP BISER11Ivanovo regionProduction of workwear
10TK ETALON LLC10Ivanovo regionFabrics production
11TRIUMPH LLC10Ivanovo regionClothing production
12CJSC «IVANOVO TISSUES»9Ivanovo regionFabrics production
13FAVORIT LLC9Ivanovo regionProduction of workwear
14HBK SHUISKY SITTSY OJSC8Ivanovo regionFabrics production
15TEIKOVSKAYA SEWING FACTORY LLC8Ivanovo regionClothing production
16LLC «NORD-SPECIAL CLOTHING»8Moscow regionProduction of workwear
17TD TEXTILE LLC7Ivanovo regionProduction of workwear
18LLC CAS «RED BRANCH»7Ivanovo regionProduction of non-woven textiles
19TEXTILE TRADITIONS LLC7Ivanovo regionManufacturing of finished textiles other than clothing
20OSWTEX LLC7Ivanovo regionProduction of workwear
21SHUYSKOYE SEWING ENTERPRISE NO. 1 LLC6Ivanovo regionProduction of workwear
22LLC «PSHC»6Ivanovo regionProduction of workwear
23GALTEX LLC6Ivanovo regionFabrics production
24LLC «RESOURCE»6Ivanovo regionPreparation and spinning of textile fibers
25ALS LLC6Ivanovo regionProduction of knitted fabric
26LLC «TEXTILE COMPANY» RUSSIAN HOUSE «6Ivanovo regionFabrics production
27SPETSODEZHDA LLC6Perm TerritoryProduction of workwear
28JSC «IVANOVOISKOZH»6Ivanovo regionManufacturing of textiles
29SHUISKY TEXTILE LLC5Ivanovo regionProduction of knitted fabric
30TK LLC5Ivanovo regionManufacturing of finished textiles other than clothing
JSC = joint-stock company; OJSC = open joint stock company; CJSC = closed joint-stock company; LLC = limited liability company; MUC = municipal unitary company; SFSI = state-owned federal state institution.
Table A4. Questionnaire for interviewing participants of the textile cluster.
SubjectQuestions
The history of the textile industry in the regionThe state of the industry in the region before the cluster. Are there any Soviet or pre-revolutionary capacities? What state are they in now? How can you describe the dynamics of the industry before and after the advent of the cluster?
The history of the clusterHow did the cluster appear? Who was the initiator: business or state? How actively does the region’s business participate in the cluster? Are there barriers to joining the cluster? Is it possible to work without participating in the cluster?
Integration of firms within the clusterHow are firms integrated into a cluster? Is there a common infrastructure? Are there common purchasing and sales? If not, why? Is there a specialization between firms? Is there competition between companies? What is the relationship between the cluster members?
Cluster managementHow is the cluster managed? Who makes strategic decisions? Are there governing bodies? If yes, how are they formed, and if not, how is cooperation between cluster members regulated?
Cluster’s competitive advantageDo the firms see the benefits of networking? What competitive advantages do firms have?
Network membersHow easy can a firm from outside enter the cluster, such as big market players from other regions, fashion designers, textile schools, or special workshops?
The strategy and the vision for the futureWhat is the strategy and the vision of the textile industry in your region? What challenges does it face? What is the cluster’s development strategy? What can be improved in the cluster’s structure, coordination, or monitoring?

References

  1. Agafonov, Vladimir A. 2010. Cluster strategy: A systemic approach. Economic Science of Contemporary Russia 3: 77–91. Available online: https://cyberleninka.ru/article/n/klasternaya-strategiya-sistemnyy-podhod (accessed on 30 November 2021).
  2. Agafonov, Vladimir A. 2015. Regional Innovation Clusters. Regional Economics and Management: Electronic Scientific Journal, 4301. Available online: https://eee-region.ru/article/4301 (accessed on 30 November 2021).
  3. Albino, Vito, Nunzio Carbonara, and Ilaria Giannoccaro. 2007. Supply chain cooperation in industrial districts: A simulation analysis. European Journal of Operational Research 177: 261–80. [Google Scholar] [CrossRef]
  4. Baggio, Rodolfo, and Marina Sheresheva. 2014. Network approach in economics and management: The interdisciplinary nature. Vestnik Moskovskogo Universiteta. Ekonomika/Moscow University Economics Bulletin 2: 3–21. Available online: https://www.researchgate.net/publication/281116682_Setevoj_podhod_v_ekonomike_i_upravlenii_mezdisciplinarnyj_harakter (accessed on 30 November 2021).
  5. Bek, Mikhail A., Nadezhda N. Bek, Marina Y. Sheresheva, and Wesley J. Johnston. 2013. Perspectives of SME innovation clusters development in Russia. Journal of Business & Industrial Marketing 28: 240–59. [Google Scholar] [CrossRef]
  6. Belso-Martínez, José Antonio, Francisco Mas-Verdu, and Lorenzo ChinchillaMira. 2020. How do interorganizational networks and firm group structures matter for innovation in clusters: Different networks, different results. Journal of Small Business Management 58: 73–105. [Google Scholar] [CrossRef]
  7. Bergenholtz, Carsten, and Christian Waldstrøm. 2011. Inter-organizational network studies—A literature review. Industry and Innovation 18: 539–62. [Google Scholar] [CrossRef]
  8. Bittencourt, Bruno Anicet, Aurora Carneiro Zen, Vitor Schmidt, and Douglas Wegner. 2018. The orchestration process for emergence of clusters of innovation. Journal of Science and Technology Policy Management 11: 277–90. [Google Scholar] [CrossRef] [Green Version]
  9. Bode, Alexander, Tobias B. Talmon l’Armee, and Simon Alig. 2010. Research note: Clusters vs. networks—A literature-based approach towards an integrated concept. International Journal of Globalisation and Small Business 4: 92–110. [Google Scholar] [CrossRef]
  10. Borgatti, Stephen P., Martin G. Everett, and Jeffrey C. Johnson. 2018. Analyzing Social Networks, 2nd ed. London: Sage. [Google Scholar]
  11. Brachert, Matthias, Mirko Titze, and Alexander Kubis. 2011. Identifying industrial clusters from a multidimensional perspective: Methodical aspects with an application to Germany. Papers in Regional Science 90: 419–39. [Google Scholar] [CrossRef]
  12. Brenner, Thomas. 2004. Local Industrial Clusters: Existence, Emergence and Evolution. London: Routledge. [Google Scholar]
  13. Brenner, Thomas, and André Mühlig. 2013. Factors and Mechanisms Causing the Emergence of Local Industrial Clusters: A Summary of 159 Cases. Regional Studies 47: 480–507. [Google Scholar] [CrossRef]
  14. Breznitz, Shiri M. 2013. Cluster Sustainability: The Israeli Life Sciences Industry. Economic Development Quarterly 27: 29–39. Available online: https://journals.sagepub.com/doi/10.1177/0891242412471846 (accessed on 30 November 2021). [CrossRef]
  15. EOCIC. 2020. European Panorama of Clusters and Industrial Change; Luxembourg: Publications Office of the European Union. Available online: https://clustercollaboration.eu/sites/default/files/news_attachment/european_panorama_2020.pdf (accessed on 30 November 2021).
  16. Expósito-Langa, Manuel, José-Vicente Tomás-Miquel, and F. Xavier Molina-Morales. 2015. Innovation in clusters: Exploration capacity, networking intensity and external resources. Journal of Organizational Change Management 28: 26–42. [Google Scholar] [CrossRef] [Green Version]
  17. Fedorov, Sergey. 2021. Cluster policy and innovative activity of industrial enterprises. Vestnik Moskovskogo Universiteta. Ekonomika/Moscow University Economics Bulletin 4: 161–85. [Google Scholar] [CrossRef]
  18. Felzensztein, Christian, Eli Gimmon, and Kenneth R. Deans. 2018. Coopetition in regional clusters: Keep calm and expect unexpected changes. Industrial Marketing Management 69: 116–24. Available online: https://isiarticles.com/bundles/Article/pre/pdf/85841.pdf (accessed on 30 November 2021). [CrossRef]
  19. Giuliani, Elisa, Pierre-Alexandre Balland, and Andrés Matta. 2019. Straining but not thriving: Understanding network dynamics in underperforming industrial clusters. Journal of Economic Geography 19: 147–72. [Google Scholar] [CrossRef]
  20. He, Shuangnan. 2019. Research on the Cooperation Networks of Xiuyan Jade Carving Industry Based on SNA. In International Conference on Management, Finance and Social Sciences Research (MFSSR 2019). London: Francis Academic Press. [Google Scholar] [CrossRef]
  21. Intarakumnerd, Patarapong. 2005. The roles of intermediaries in clusters: The Thai experiences in high-tech and community-based clusters. Asian Journal of Technology Innovation 13: 23–43. [Google Scholar] [CrossRef]
  22. Islankina, Ekaterina, and Thomas Wolfgang Thurner. 2018. Internationalization of cluster initiatives in Russia: Empirical evidence. Entrepreneurship & Regional Development 30: 776–99. [Google Scholar] [CrossRef]
  23. Khakimov, Ziyodulla A. 2019. Synergy effect textile clusters of Uzbekistan. Asian Journal of Technology & Management Research 9: 65–71. Available online: http://ajtmr.com/papers/Vol9Issue1/Vol9Iss1_P8.pdf (accessed on 30 November 2021).
  24. Khalid, Haris. 2019. Systematic literature review on social network analysis. Paper presented at the 2019 International Conference on Innovative Computing (ICIC), Lahore, Pakistan, November 1–2; pp. 1–7. [Google Scholar] [CrossRef]
  25. Kowalski, Arkadiusz M. 2020. Towards an Asian model of clusters and cluster policy: The super cluster strategy. Journal of Competitiveness 12: 74–90. [Google Scholar] [CrossRef]
  26. Kozonogova, Elena, Daniil Kurushin, and Julia Dubrovskaya. 2019. Computer visualization of the identify industrial clusters task using GVMap. Scientific Visualization 11: 126–41. [Google Scholar] [CrossRef]
  27. Kudrjavtseva, Tatiana, and Nikolay Zhabin. 2014. Formation of an algorithm to define clusters in regional economy. Nauchno-tehnicheskie vedomosti Sankt-Peterburgskogo gosudarstvennogo politehnicheskogo universiteta. Economics 3: 124–31. Available online: https://cyberleninka.ru/article/n/formirovanie-algoritma-identifikatsii-klasterov-v-ekonomike-regiona (accessed on 30 November 2021).
  28. Marshall, Alfred. 1922. Principles of Economics. New York: McMillan Publishing Company. [Google Scholar]
  29. Martin, Ron, and Peter Sunley. 2003. Deconstructing clusters: Chaotic concept or policy panacea? Journal of Economic Geography 3: 5–35. [Google Scholar] [CrossRef]
  30. Martínez, Adriana, José A. Belso-Martínez, and Francisco Más-Verdú. 2012. Industrial clusters in Mexico and Spain: Comparing inter-organizational structures within context of change. Journal of Organizational Change Management 25: 657–81. [Google Scholar] [CrossRef]
  31. Maskell, Peter. 2001. Towards a knowledge-based theory of the geographical cluster. Industrial and Corporate Change 10: 921–43. [Google Scholar] [CrossRef]
  32. McCann, Brian T., and Timothy B. Folta. 2011. Performance differentials within geographic clusters. Journal of Business Venturing 26: 104–23. [Google Scholar] [CrossRef]
  33. Melnik, Mikhail Ion. 2015. Confronting the Challenges of Asymmetry of Information and Competition: The Rise of eBay. In Trends and Innovations in Marketing Information Systems. Hershey: IGI Global, pp. 293–307. [Google Scholar]
  34. Ménard, Claude. 1996. On clusters, hybrids, and other strange forms: The case of the French poultry industry. Journal of Institutional and Theoretical Economics (JITE)/Zeitschrift für die Gesamte Staatswissenschaft 152: 154–83. [Google Scholar]
  35. Moore, James F. 1993. Predators and prey: A new ecology of competition. Harvard Business Review 71: 75–86. Available online: https://www.researchgate.net/publication/13172133_Predators_and_Prey_A_New_Ecology_of_Competition (accessed on 30 November 2021). [PubMed]
  36. Moore, James F. 1996. The Death of Competition: Leadership and Strategy in the Age of Business Ecosystems. New York: Harper Business. [Google Scholar]
  37. Newlands, David. 2003. Competition and Cooperation in Industrial Clusters: The Implications for Public Policy. European Planning Studies 11: 521–32. [Google Scholar] [CrossRef]
  38. NodeXL. 2021. NodeXL Official Site. Available online: https://nodexl.com/ (accessed on 15 October 2021).
  39. Orekhova, Svetlana V., Andrei V. Misyura, and Julia S. Bausova. 2020. Strategy vs. business model: Evolution and differentiation. Vestnik Moskovskogo Universiteta. Ekonomika/Moscow University Economics Bulletin 3: 160–81. [Google Scholar] [CrossRef]
  40. Papagiannidis, Savvas, Eric W. K. See-To, Dimitris G. Assimakopoulos, and Yang Yang. 2018. Identifying industrial clusters with a novel big-data methodology: Are SIC codes (not) fit for purpose in the Internet age? Computers & Operations Research 98: 355–66. [Google Scholar]
  41. Pavelkova, Drahomira, Miroslav Zizka, Lubor Homolka, Adriana Knapkova, and Natalie Pelloneova. 2021. Do clustered firms outperform the non-clustered? Evidence of financial performance in traditional industries. Economic Research-Ekonomska Istraživanja 34: 1–23. [Google Scholar] [CrossRef]
  42. Peeters, Ludo, Marc Tiri, and Adrian Berwert. 2001. Identification of Techno-Economic Clusters Using Input-Output Data: Application to Flanders and Switzerland. In Innovative Clusters: Drivers of National Innovation Systems. Paris: OECD, pp. 251–72. Available online: https://www.researchgate.net/publication/282236332_Identification_of_techno-economic_clusters_using_input-output_data_application_to_Flanders_and_Switzerland (accessed on 30 November 2021).
  43. Porter, Michael E. 1998. Clusters and the New Economics of Competition. Harvard Business Review 76: 77–90. Available online: https://hbr.org/1998/11/clusters-and-the-new-economics-of-competition (accessed on 25 November 2021). [PubMed]
  44. Porter, Michael E. 2000. Location, competition, and economic development: Local clusters in a global economy. Economic Development Quarterly 14: 15–34. [Google Scholar] [CrossRef]
  45. Porter, Michael E. 2003. The Economic Performance of Regions. Regional Studies 37: 549–78. Available online: https://www.hse.ru/mirror/pubs/share/212158628 (accessed on 30 November 2021). [CrossRef]
  46. Porter, Michael E. 2004. Competitive Strategy: Techniques for Analyzing Industries and Competitors. New York: Free Press. [Google Scholar]
  47. Razminienė, Kristina, Irina Vinogradova-Zinkevič, and Manuela Tvaronavičienė. 2021. Tracing Relationship between Cluster’s Performance and Transition to the Circular Economy. Sustainability 13: 13933. [Google Scholar] [CrossRef]
  48. Sheresheva, Marina Y. 2010. Forms of Inter-Firm Networking. Moscow: SU-HSE Publishing. [Google Scholar]
  49. Sheresheva, Marina Y. 2016. Creation of tourist clusters in Russian regions. Logistika 6: 52–56. [Google Scholar]
  50. Sozinova, Anastasia A., Olga I. Okhrimenko, Ludmila V. Goloshchapova, Eugeny P. Kolpak, Natalia B. Golovanova, and Evgeny A. Tikhomirov. 2017. Industrial and innovation clusters: Development in Russia. International Journal of Applied Business and Economic Research 15: 111–18. Available online: https://www.researchgate.net/profile/Anastasia-Sozinova/publication/318490388_Industrial_and_innovation_clusters_Development_in_Russia/links/5ffc22eb45851553a03650fc/Industrial-and-innovation-clusters-Development-in-Russia.pdf (accessed on 16 February 2022).
  51. SPARK-Interfax. 2021. Interfax Official Site. Available online: https://www.spark-interfax.ru (accessed on 16 November 2021).
  52. Stejskal, Jan. 2011. Analysis of the applicability of selected methods for industrial clusters identifying. International Journal of Systems Applications, Engineering & Development 5: 255–62. [Google Scholar]
  53. Valitova, Lilia A., Elena R. Sharko, and Marina Y. Sheresheva. 2021. Identification of industrial clusters based on the analysis of business relationships: An example of the textile industry. Upravlenets–The Manager 12: 59–74. [Google Scholar] [CrossRef]
  54. Vom Hofe, Rainer, and Saurav Dev Bhatta. 2007. Method for Identifying Local and Domestic Industrial Clusters Using Interregional Commodity Trade Data. Industrial Geographer 4: 1–27. [Google Scholar]
  55. Yim, Deok Soon, Wangdong Kim, and Young-ho Nam. 2020. The Strategic Transformation from Innovation Cluster to Digital Innovation Cluster during and after COVID-19. Asian Journal of Innovation and Policy 9: 164–86. [Google Scholar] [CrossRef]
Figure 1. The approach to identifying clusters based on representing them as a network of interacting firms.
Jrfm 15 00129 g001
Figure 2. Network of firms in the Russian textile industry visualized in NodeXL.
Jrfm 15 00129 g002
Figure 3. The Ivanovo region’s network of enterprises of the textile industry. Enterprises established in the Ivanovo region are marked in dark blue. Enterprises from other regions are in different colors.
Jrfm 15 00129 g003
Publisher’s Note: MDPI stays neutral with regard to jurisdictional claims in published maps and institutional affiliations.

