1. Introduction
Tobacco is grown as a cash crop worldwide and 90 percent of the world’s tobacco is produced by developing countries. Among these developing countries, tobacco is grown in India, Zimbabwe, Pakistan, and Malawi, all of which are low-income food-deficit countries (LIFDCs). These developing countries export most of their tobacco and consume less than 20 percent locally (
Zafeiridou et al. 2018). According to FAO-Statistics, the global tobacco production in 2017 was more than 6.50 million tonnes. Between 2001 and 2016, worldwide tobacco production and per hectare yield increased at annual rates of 0.72 percent and 0.86 percent, respectively, while tobacco cultivated area slightly decreased. Globally, the annual tobacco production increase is lower than population growth, indicating that tobacco availability per capita is declining over time. During this period, yield enhancement was the only source of growth in tobacco production, which compensated for the reduction in planted tobacco area to achieve positive growth in global tobacco production. The United States of America used to be the world’s leading tobacco producer in the 1970s, but it was eventually surpassed by other developing countries such as China, Brazil, India, and Zimbabwe (
FAOSTAT 2018;
Ali 2020). China was the world’s largest tobacco producer in 2018, with 2.24 million tonnes out of a total of 6.09 million tonnes produced, while other major producers included Brazil, India, and the USA. Subsequently, Pakistan emerged as one of the top ten global raw tobacco producers, accounting for 1.75 percent of the world’s annual production (
FAOSTAT 2020).
Pakistan departed from being a net importer of tobacco in 1948 and became self-sufficient in tobacco production in 1969 (
PTC 2017). At the time of independence, the tobacco crop was not grown in the country, so the government imported tobacco to meet tobacco demand in the country. In 1948, the government, on trial basis, started tobacco cultivation in the country. Initially, tobacco (FCV) was cultivated on 20 acres of land, but with the passage of time, tobacco crop cultivation was increased. Before 1968, the quality of produced tobacco was not good, and the government imported high-quality raw tobacco for the requirements of the industry by spending precious foreign exchange reserves. In 1968, the Pakistani government took serious steps to support, improve, and develop the country’s tobacco industry by establishing the Pakistan Tobacco Board (
Ali et al. 2015). The formation of the Pakistan Tobacco Board (PTB) was the first step towards promoting and developing tobacco production and export. Since the establishment of the PTB, the board has been protecting the rights of tobacco growers, buyers, manufacturers of tobacco products, and traders engaged in tobacco processing (
Ali et al. 2015).
The migration of the tobacco market from rich America to poor Asia and Africa in 2016 benefitted Pakistan to some extent, as its share of global production increased from 1.39 percent in 2001 to 1.74 percent in 2016 (
FAOSTAT 2018;
Ali 2020). Despite being one of the world’s major tobacco producers, tobacco remains a minor crop in Pakistan’s agriculture sector, both in terms of area under cultivation and production value. Tobacco crops currently represent only 0.42 percent of the total agricultural product value (
SPDC 2018;
Saleem and Iqbal 2020). In the manufacturing sector and GDP, the cigarette industry is also not a significant contributor. The tobacco industry accounts for 2.2 percent of Pakistan’s large-scale manufacturing sector, four percent of the federal government’s indirect tax revenue, and less than a half percent of its industrial employment (
SPDC 2018).
Khyber Pakhtunkhwa (KP) is predominantly a rural province, with just around 17% of the population living in urban areas. The province’s economic structure reflects that, as agriculture accounts for 30 percent of the provincial GDP. Agriculture is the most important and largest sector of KP’s economy. The majority of the population is dependent on this sector, either directly or indirectly. The agriculture sector accounts for about 24 percent of the province’s gross domestic product (GDP) and employs half of the labor force (
KPBOS 2022). Although tobacco is cultivated in all provinces of the country, the climatic conditions and soil of KP are ideal for this crop, and three-fourths of the tobacco leaf is grown in this province (
PTC 2017). Tobacco is a cash crop in Pakistan, where it was grown on 50,800 hectares in 2020, producing about 113.6 million kilograms. Tobacco growers in KP cultivated tobacco on 28,089 hectares of land in the above-mentioned 50,800 hectares, producing 71.38 million kilograms of tobacco in the province (
PTB 2021;
KPBOS 2021). According to
Shahzad et al. (
2018), KP has achieved global recognition for having the highest production per hectare (3354 kg per hectare) in comparison to the world’s average tobacco production (
FAO 2014).
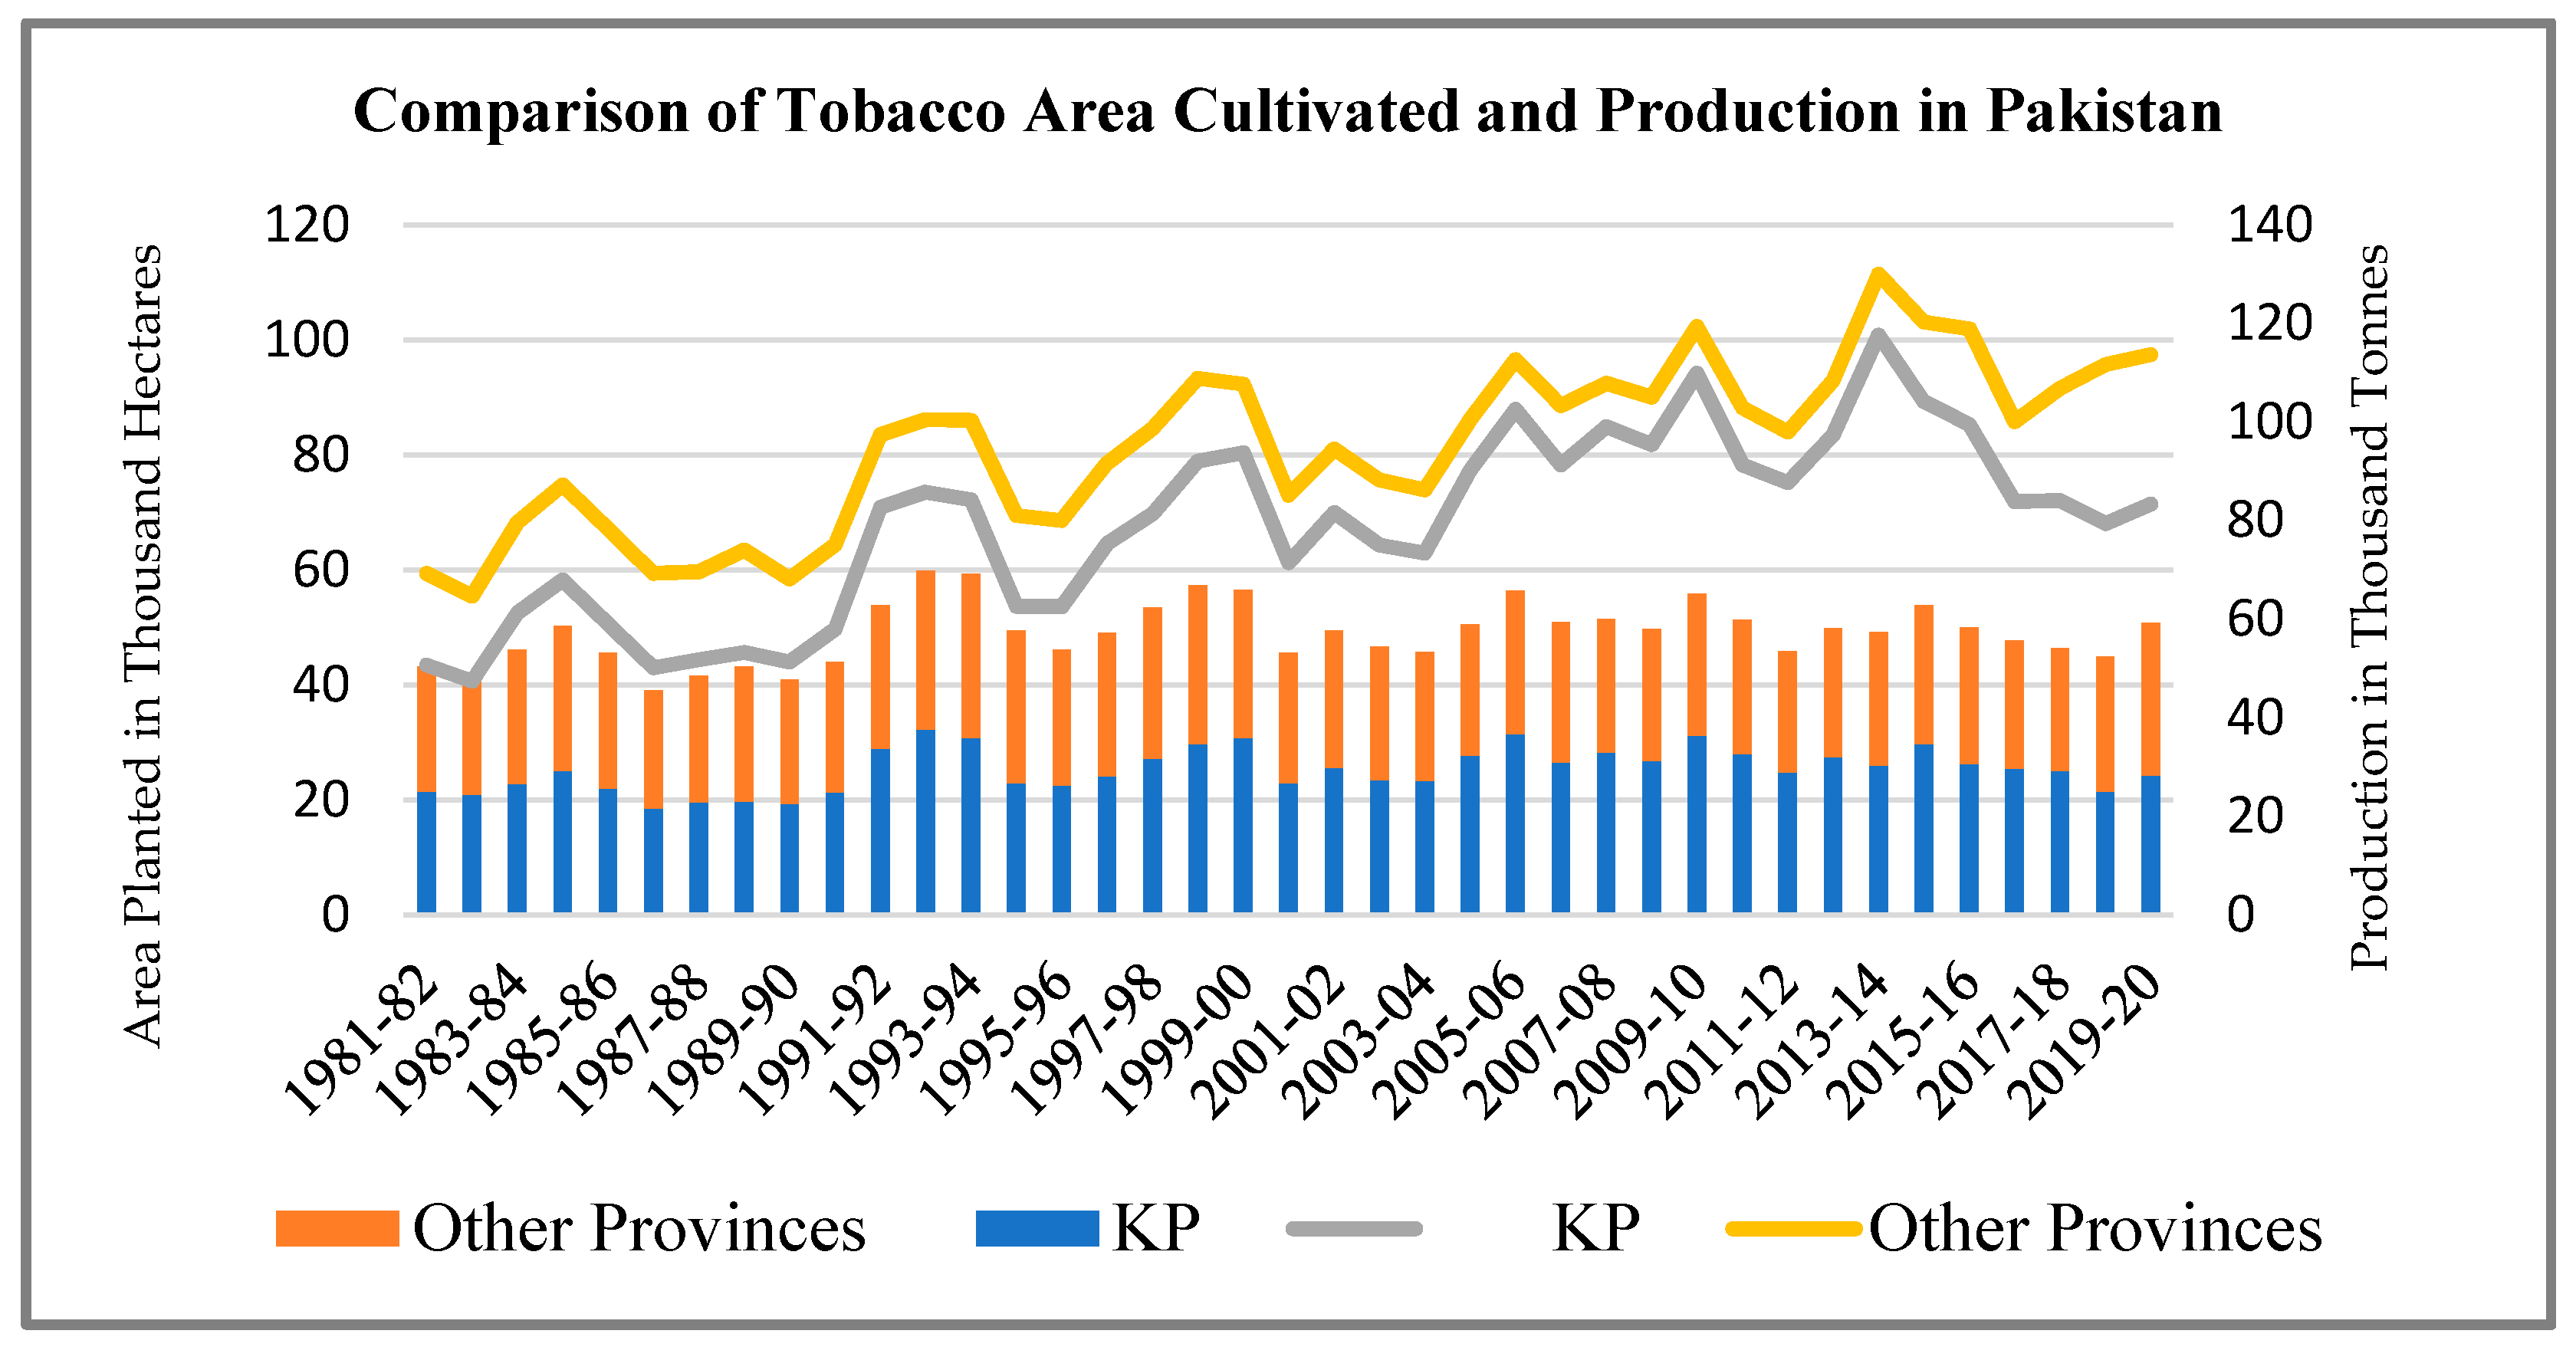
Figure 1 shows the area under cultivation and tobacco production in Pakistan, as well as the proportion of KP in it, to help understand the importance and contribution of KP tobacco production to the country’s overall production. According to the data, the area under tobacco cultivation in Pakistan was 43,134 hectares in 1980–1981 and 50,800 hectares in 2019–2020, indicating that the area under tobacco cultivation expanded over time due to its profitable nature. Similarly, in the above-mentioned data, the share of KP in the area under cultivation was 24,930 hectares, compared to 28,089 hectares in Khyber Pakhtunkhwa. Tobacco production in KP increased from 43,408 tonnes in 1980–1981 to 71,410 tonnes in 2019–2020, owing to higher yields per hectare and improved production techniques in the province. The figure clearly shows that Khyber Pakhtunkhwa consistently produced more than 60 percent of the tobacco produced in the country. In 1980–1981, KP accounted for 62.73 percent of total production, compared to 62.85 percent in 2019–2020, with a high of 78.88 percent in 2009–2010. The share of KP in the total cultivated area remained over 50%. In these years, Pakistan’s highest tobacco production, 129,900 tonnes, was recorded in 2013–2014, while the share of KP was also at its highest at the same time, at 100,800 tonnes. Increased tobacco production can be attributed to improved seed accessibility, research and innovation, and modern equipment. In these years, the average area planted was 29,290 hectares in KP and 49,000 hectares in Pakistan. Similarly, in these years, KP produced 67.84 thousand tonnes of tobacco out of a total produced average quantity of 95.19 thousand tonnes of tobacco in Pakistan. According to
Saleem and Iqbal (
2020), the area under tobacco cultivation in the last two decades has not surpassed 0.25 percent of total arable land in the country.
The assessment of tobacco production costs and supply function would provide policymakers with a baseline for planning purposes, as well as a comparative view of resource utilization in the production and returns from it. The primary purpose of this study is to look at the input demand and output supply, as well as the factors influencing tobacco supply at the farm level in KP. Furthermore, knowing the tobacco supply response to price and non-price incentives is vital for developing appropriate policy and planning strategies for the KP tobacco industry. The present study is the first one to provide empirical evidence of KP farm-level tobacco supply response to price and non-price factors. The information revealed is expected to be extremely beneficial in helping the government formulate tobacco-related policies as well as in educating the public and private researchers and policymakers interested in learning more about the KP tobacco sector.
Researchers have been particularly interested in the analysis of agricultural supply response (
Bond 1983;
Eckstein 1985;
Townsend and Thirtle 1997). The response of farm output to changes in crop prices or, more broadly, to agricultural incentives is known as the “agricultural supply response” (
Mamingi 1996). One of the most successful ways of determining the impacts of policy on agricultural production has traditionally been the study of agricultural supply response (
Townsend and Thirtle 1997). Increasing agricultural productivity to alleviate hunger and poverty in developing countries is the most difficult task they face (
Mano and Nhemachena 2007;
Parry 1978;
Parry 1981;
Youdeowei et al. 1986). Thus, tobacco production has the potential to meet these two objectives (to alleviate hunger and poverty) through increasing farmer income and wealth. To address this challenge, however, it is necessary to first understand the various factors that influence crop productivity (
Ndedzu et al. 2014). The sensitivity of farmers to economic incentives, according to
Nerlove and Bachman (
1960), influences the contribution of agriculture to the economy. They further stated that systematic investigation into supply response estimation is very necessary for the pricing process. Besides price, there are several other factors, such as rainfall, climate, and equipment, which also influence the supply (
Nerlove and Bachman 1960).
In the existing literature, tobacco profitability in Khyber Pakhtunkhwa has been estimated by a few studies (
Qamar et al. 2006;
Rahman et al. 2011;
Ullah et al. 2015;
Nasrullah et al. 2019), but no study has examined farm-level profitability and supply function of tobacco in the province. Similarly, the supply response of tobacco production has only been assessed in a few studies (e.g.,
Namome 2018;
Dean 1966). These studies examined the Malawian tobacco supply response and concluded that farmers responded positively to economic opportunities, notably for cash crops.
Adesimi (
1970) examined how tobacco farmers in Nigeria responded to price incentives and found that tobacco farmers responded positively to price incentives. In his study, Adesimi also mentioned the importance of extension services in increasing tobacco output. The
FAO (
2003) analyzed tobacco production in the majority of tobacco-producing countries, and it was revealed that in China, 40 percent of the changes in tobacco output between 1970 and 1999 could be attributed to the total area cultivated. A study of the Brazilian tobacco industry included in the same compilation reveals that land and labor costs have an impact on tobacco output. According to the findings, the total cultivated land influences tobacco output discrepancies by 0.8 percent.
Likewise,
Leaver (
2004) examined the determinants of tobacco output in Zimbabwe using time series data. The Nerlovian model was used to validate the supply response of tobacco production, and the results show that the current tobacco output and market prices are favorably connected to next season’s tobacco. Rainfall and sales quotas were shown to have a negative impact on tobacco production. Furthermore,
Pfumayaramba (
2011) used time series data from 1980 to 2010 to investigate the link between the tobacco output response to output, tobacco prices, substitute crop prices, and production costs in Zimbabwe. Tobacco output is positively influenced by the tobacco price and quantity, whereas production costs and prices of other crops are negatively influenced by tobacco output. These findings are consistent with
Leaver’s (
2004) findings. A study by
Ndedzu et al. (
2014) analyzed the factors that influenced Zimbabwe’s tobacco output. The study’s findings revealed that acreage is a key variable with a positive and significant impact on tobacco output, but the number of tobacco producers and the price of a substitute crop have a significant negative impact on the country’s tobacco output. The main and important variable, tobacco price, has an insignificant effect on the tobacco output. Similarly, the variable rainfall also has an insignificant coefficient, meaning that it has no effect on the tobacco output in Zimbabwe. Concluding the findings of the preceding studies, none of the studies examined farm-level profitability and supply function.
Ali et al. (
2014) used time series data to examine the acreage response of Flue-Cured Virginia (FCV) tobacco and found that the FCV cultivation area responds positively to its own price, but the magnitude of the elasticity is small, implying that the FCV cultivation area is relatively price inelastic. They also examined the effects of competing crops on FCV tobacco and found that the coefficient of a competing crop area has a negative impact on the area under FCV tobacco. Akin to other developing countries, tobacco plays a vital role in poverty reduction and contributes to rural welfare and development in the rural areas of Mozambique.
Verter and Gota (
2017) examined determinants affecting tobacco production in Mozambique from 1994 to 2014. The results indicated that an area under tobacco cultivation, rainfall, tobacco yields, export of tobacco, and world tobacco prices have a positive impact on the production of tobacco in Mozambique. The study also revealed that the Mozambique government’s monopsony in the tobacco sector had negative implications for the country’s small tobacco growers. They suggested that the government should provide a fair and competitive market for the encouragement of the private sector in tobacco, manufacturing, and other tobacco-related activities in the country (
Verter and Gota 2017).
Shahzad et al. (
2018) examined the determinants affecting tobacco supply in KP using data from 1981 to 2014. They found that, in the short run, tobacco pricing, tobacco cultivated area, and lagged production had a positive and significant effect on tobacco output in KP; however, wheat elasticity, a competing crop in the region, had a negative and significant impact on production. Long-run elasticities for tobacco prices and area under tobacco cultivation effects were found to be positive and statistically significant, whereas the elasticity of wheat prices, on the other hand, was found to be negative and statistically significant, indicating that as wheat prices increase, tobacco output drops. Thus, various studies investigated different aspects of tobacco at the processing and cigarette manufacturing level, but profitability, supply response, and input demand of tobacco farms in Pakistan remain unexplored from various perspectives. Our study fills this gap by examining farm-level profitability, input demand, and output supply using survey data of 140 tobacco farms, which was conducted in Khyber Pakhtunkhwa, Pakistan in 2020.
3. Findings and Discussion
3.1. Farm-Level Cost of Tobacco Production in Khyber Pakhtunkhwa
Table 2 depicts the per hectare cost of tobacco crop (FCV) production in Khyber Pakhtunkhwa. Tobacco is a profitable crop grown by farmers during the Rabi season. Nursery growing is the first and most basic operation of the tobacco crop, and growers do everything they can to grow a healthy nursery for healthy saplings. Tobacco growers in the study region used a variety of seeds, with some using tobacco varieties recommended by tobacco companies and others using local seeds conserved by the farmers. The nursery raising consists of several components, and it was estimated that the nursery raising cost for one hectare of tobacco cultivation in 2020 was PKR 19,473 on average. Land preparation is the second activity after raising the nursery for the crop. Respondents said that for land preparation, they first applied a deep plough, the cost of which was estimated to be PKR 7028. The cost of a rotavator was also estimated, and that was PKR 8068. During the 2020 survey, most farmers reported that they immediately proceeded to ridge making after using the rotavator, which was estimated to cost PKR 1060 in 2020. The total cost of land preparation was estimated to be PKR 21,892, and the cost of farmyard manure (FYM), including transportation, was PKR 28,792. Similarly, the application cost of FYM was also PKR 3541. Similarly, the costs of fertilizers such as DAP, urea, NPK, ammonium nitrate, SSP, and potash were also estimated by the author for the year 2020. The cost of DAP per hectare of tobacco production was PKR 14,489 in 2020, while the cost of urea was estimated to be PKR 3320 and the fertilizer application cost was PKR 4484. The cost of fertilizers is a major element in estimating production costs, and the overall cost of synthetic fertilizers in 2020 was PKR 80,119. The cost of uprooting, transplantation, and gap-filling has also been estimated and found to be PKR 9583 in 2020. Pesticides/insecticides cost was PKR 15,449 in 2020, while their application cost was estimated to be PKR 6681. The total cost of plant protection in the survey year was PKR 22,130.
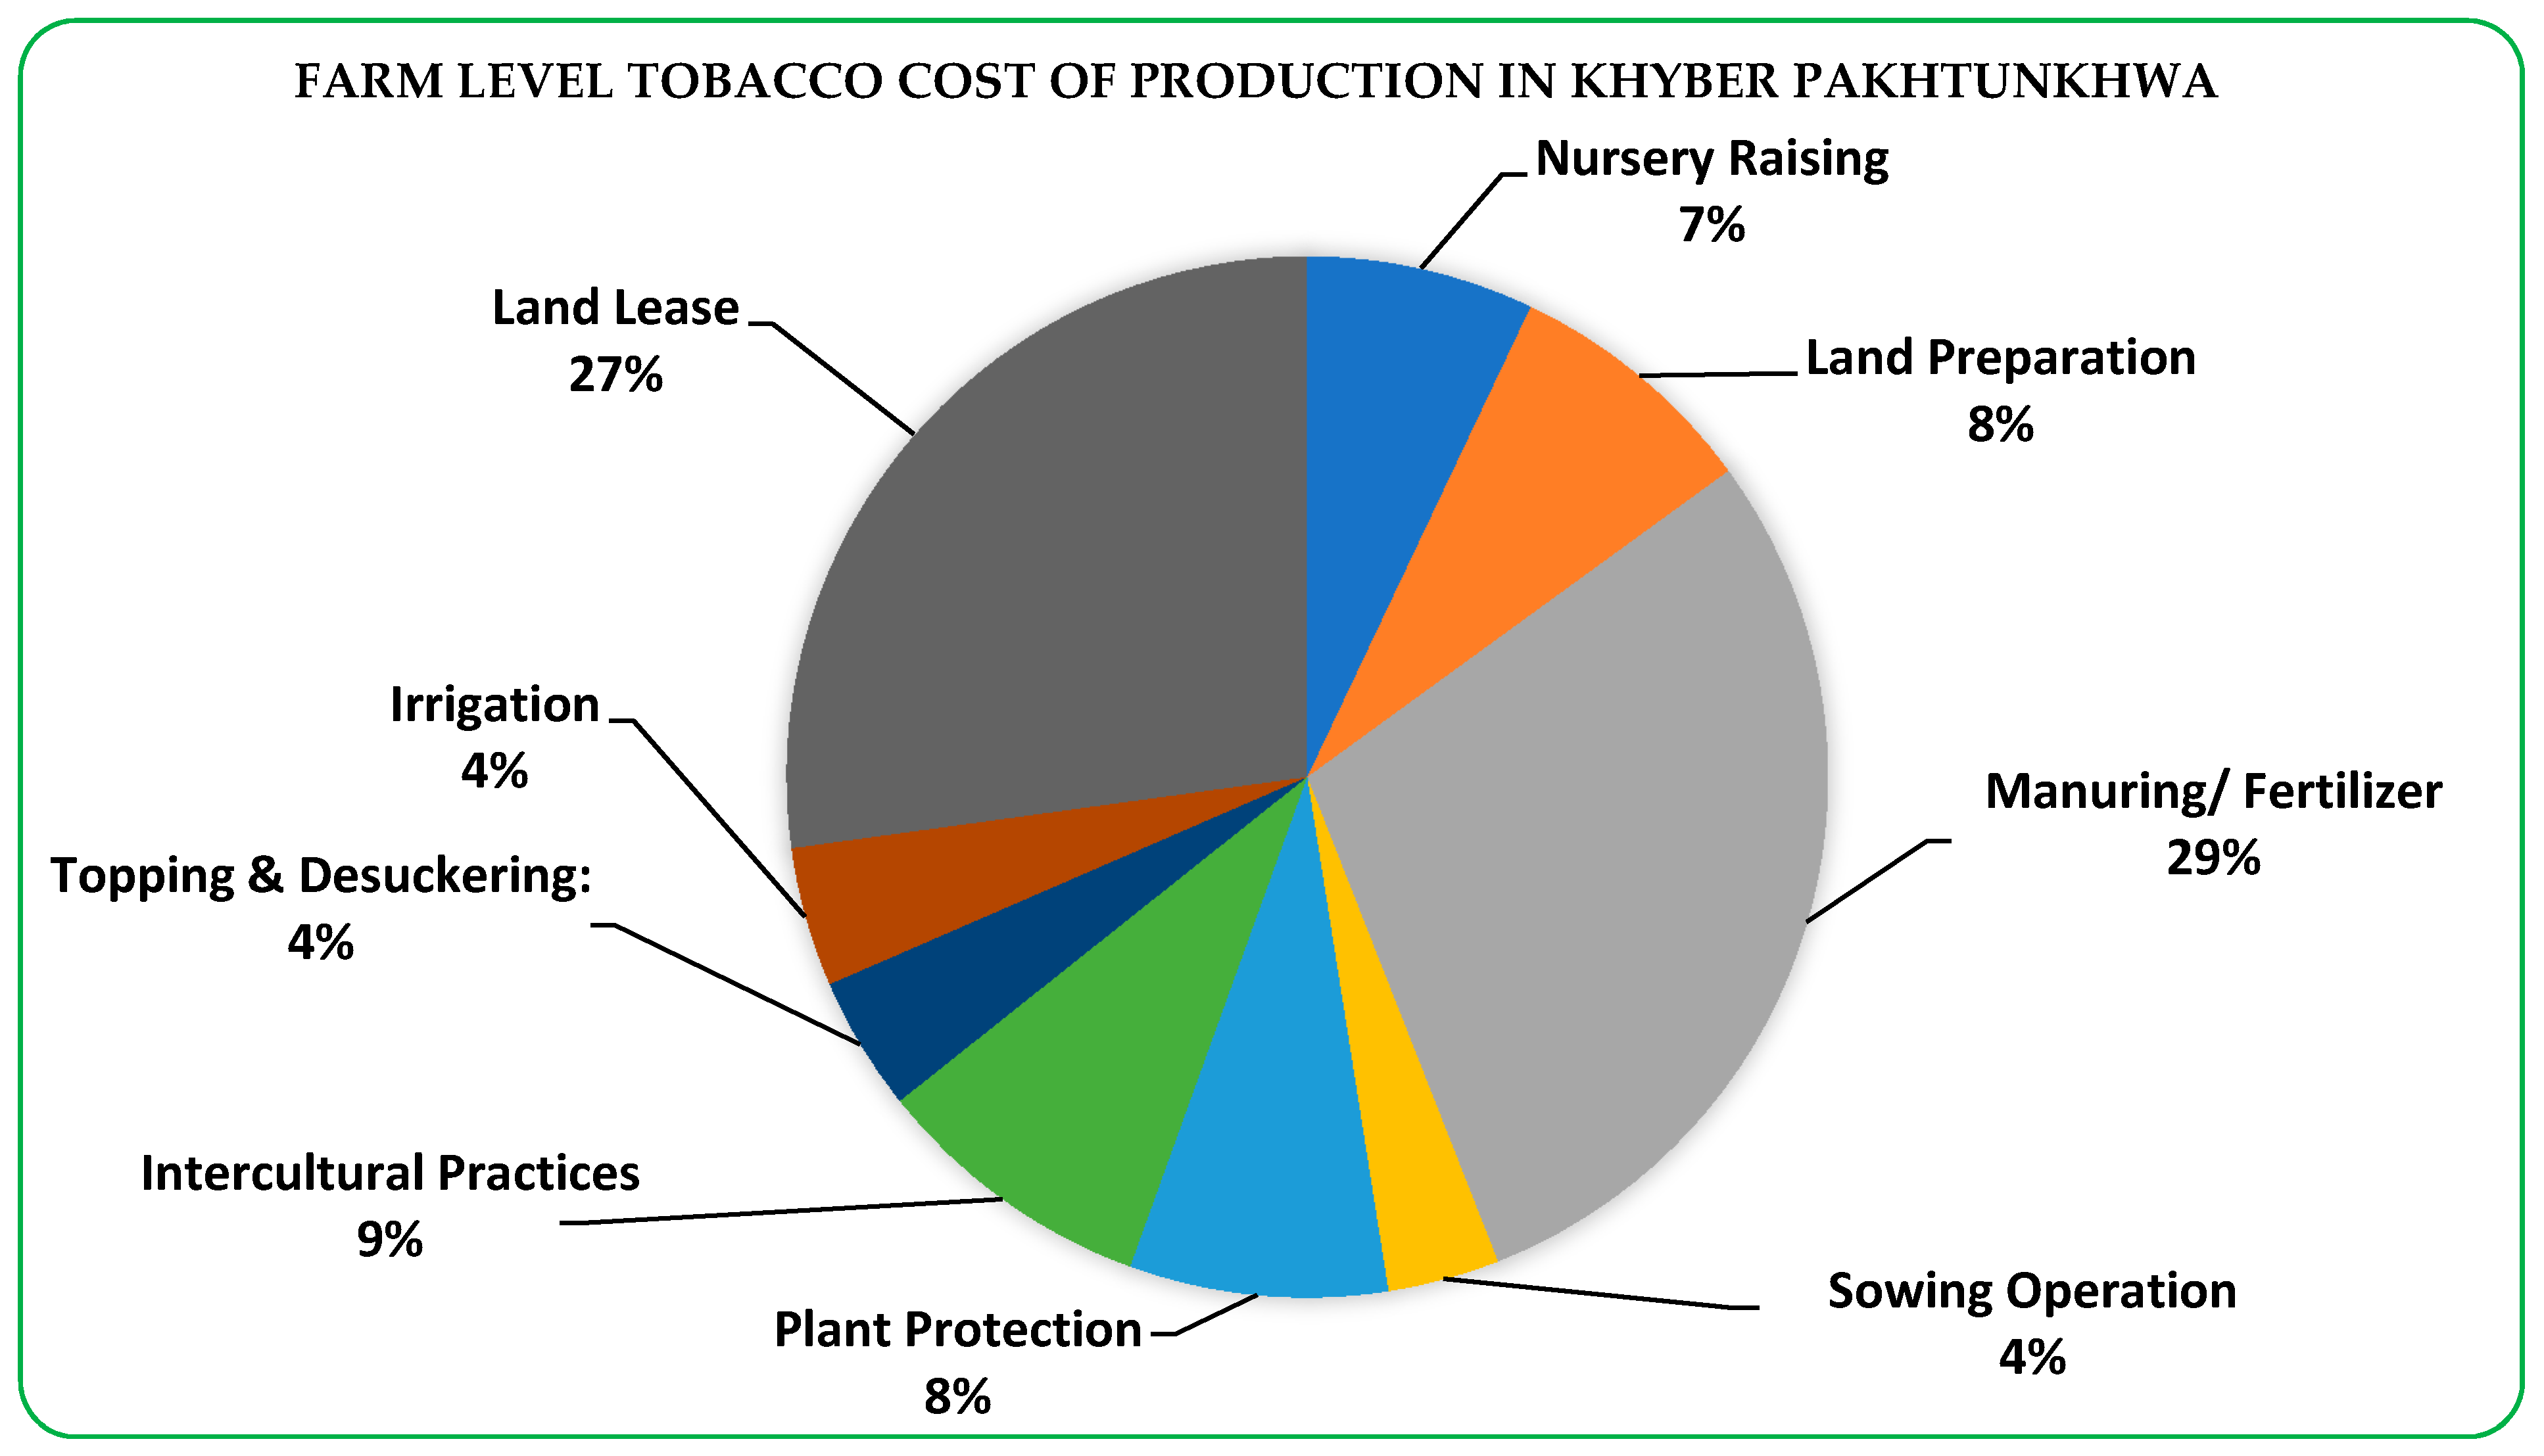
In 2020, the cost of the first manual hoeing was PKR 4259, the second hoeing with seal/bullocks was PKR 6816, and the third and final hoeing was PKR 9027. The cost of earthing-up (bullock/tractor/manual) was PKR 4122 in 2020, while the entire cost of intercultural activities was estimated at PKR 24,225. Topping and de-suckering are other essential and time-consuming jobs in tobacco crop cultivation, with a cost of PKR 7534, while the cost of chemical suckericide was estimated to be PKR 3991 for one hectare of tobacco production. Canal irrigation water prices, known as abyana, are estimated to be PKR 2460 per hectare of land in 2020. The labor cost for tobacco crop irrigation has also been calculated and found to be PKR 8589 in 2020. Farmers clean the water courses at the start of the season to ensure smooth irrigation, and the cost of cleaning watercourses was PKR 902, while the overall cost of irrigation for one hectare of tobacco was PKR 11,952. The cost of a one-hectare land lease, which was a key component of production costs, has also been estimated to be PKR 75,013. Land rent was also included as an opportunity cost for landowners. The land leasing cost, as shown in
Figure 2, appears to be relatively high in percentage terms, accounting for 27 percent of the overall cost of tobacco production. After the cost of farmyard manure and fertilizer, the land lease was the second costliest component of tobacco production in KP.
Iqbal (
1998) stated in his study that land rent is the most important component of the tobacco cost of production, accounting for 30 percent of the overall cost.
Nasrullah et al. (
2019) validated the high cost of land rent by examining the cost and net return of tobacco growers in the district of Mardan, with a total revenue of PKR 405,636 and a total incurred cost of PKR 242,889, with land rent being the costliest component, costing PKR 61,750 per hectare, or 25percent of the overall cost of tobacco production. The high cost of land could be also validated from another study conducted for examining wheat supply response for district Swabi in Khyber Pakhtunkhwa, in which the estimated cost of land lease is 37 percent of the total cost incurred on the per-acre wheat production (
Farhan et al. 2019). The entire cost of producing one hectare of tobacco in the study area for the year 2020 in Khyber Pakhtunkhwa was PKR 275,917.
Furthermore,
Figure 2 of the study provides a brief and thorough view of the entire cost of production, showing the itemized cost in percentage terms and its significance for the readers. The application cost of farmyard manure and chemical fertilizers is the highest cost component of cultivating per hectare tobacco crop production, accounting for 29 percent of the total cost incurred in KP, followed by the land lease cost standing at 27 percent. Tobacco is primarily a labor-intensive crop, and intercultural practices in the study area accounted for nine percent of the total crop production costs in 2020, followed by land preparation and plant protection measures, which accounted for eight percent and eight percent, respectively. Other cost factors in crop production practices that are in descending order are nursery raising (7 percent), sowing operations including transplantation and gap-filling plants (4 percent), topping and de-suckering of the tobacco plant (4 percent), and cost of irrigation (4 percent).
3.2. Farm-Level Tobacco Productivity and Profitability in Khyber Pakhtunkhwa
Profits for cash crops, such as tobacco, are squeezed by global commodity prices while production costs are local (
Ntibiyoboka 2014). In order to determine the gross returns from green leaf tobacco production in KP, a gross margin analysis was performed.
Ntibiyoboka (
2014) also employed the gross margin analysis for tobacco profitability in his study. The gross margin is the difference between the sales earnings of the farmers and the total variable cost of production incurred per hectare.
Table 3 of the analysis depicts farm-level productivity and profitability of tobacco in Khyber Pakhtunkhwa. The average green leaf yield is estimated at 20,259.60 kg per hectare, with a gross margin of PKR 120,616 per hectare, suggesting that tobacco crop production is profitable at the farm level. The variable costs include nursery raising costs, land preparation, farmyard manure, chemical fertilizers, sowing operations including transplantation and gap filling, plant protection, intercultural practices, topping and de-suckering the plants, and irrigation. According to estimates, tobacco production has a gross return of PKR 321,519 per hectare. This indicates that after incurring all the direct costs associated with tobacco production, the total gross revenue was PKR 321,519. Furthermore, the benefit-cost ratio of tobacco crop production at the farm level was calculated in order to determine whether tobacco crop cultivation in KP was viable and to have a clear understanding of the crop’s performance. The benefit-cost ratio of tobacco crop production at the farm level is estimated to be 1.17, indicating that investing in tobacco crops is financially viable and that investing PKR 1 returns PKR 1.17 on average. Tobacco is more profitable at the barn level, therefore the lower net return and BCR are understandable.
3.3. Estimated Elasticities of Output Supply and Input Demand of Tobacco Production
In this study, the profit function was estimated together with seven input demand equations for tobacco crop production at the farm level in Khyber Pakhtunkhwa. The restriction of homogeneity, which is one of the profit function’s regularity properties, was automatically applied to the normalized specification stated in Equation (1). (
Rahman and Parkinson 2007;
Olwande et al. 2009;
Rahman and Kazal 2016). Furthermore, the output share is positive, showing that the property of monotonicity for the profit function model is valid (
Wall and Fisher 1987, as quoted in
Rahman and Kazal 2016). By applying cross-equation equality constraints on the relevant parameters between the profit function and the seven factor demand equations, the symmetry property was verified. When the normalized prices of the variable inputs are considered, the symmetry test fails to reject the restrictions, indicating that the symmetry property holds, and the sample farms maximize profit (
Sidhu and Baanante 1981 cited in
Rahman and Kazal 2016).
The parameter estimates for the trans-log profit function are shown in
Table 4. These estimated parameters of the trans-log profit function are used to calculate the elasticities with respect to variable input demand, output supply, and fixed factors (see
Table 5). It demonstrates that changes in market prices (input or output) have the expected impact on tobacco supply and resource utilization.
Table 5 shows that all of the own-price elasticities have negative signs, are statistically significant, and are consistent with economic theory, with all elasticities falling into the inelastic range except the nitrogen fertilizer. Input demand cross-price elasticities yield a range of outcomes, some of which are complements and others of which are substitutes. Changes in market prices of inputs and outputs, as expected, have a substantial influence on farmers’ resource use and productivity in tobacco crop production. Furthermore, tobacco’s supply response to a price change is positive and consistent with theory. The output elasticity of supply is positive, as expected, at 0.78 percent (inelastic), suggesting that a one percent increase in tobacco prices increases output supply by 0.78 percent. One probable cause of inelastic supply in the province is tobacco growing on a contractual basis. Another factor is that tobacco is the only certain, lucrative cash crop in the surveyed region, and farmers have no choice except to grow tobacco because the majority of farmers rely on it for revenue. According to these estimations, a rise in tobacco prices would encourage farmers to cultivate more tobacco in the future. As a result, an increase in the price of green tobacco leaves would also significantly increase demand for input variables. A one percent increase in tobacco prices would result in 1.06 percent, 1.18 percent, and 1.28 percent increases in demand for nitrogen, phosphorus, and potassium fertilizers, respectively. The elasticity of potassium fertilizer demand in relation to tobacco prices is higher than that of nitrogen and phosphorus demand, indicating that potassium is more important in tobacco production. Similarly, a one percent rise in tobacco price increases the demand for labor, mechanical power, pesticides, and farmyard manure by 1.04, 1.01, 0.57, and 1.01 percent, respectively, at the farm level. When compared to other inputs, the elasticity of pesticide demand with regard to tobacco green leaf price is inelastic and least responsive at 0.57 percent, and one probable explanation is that some farmers sprayed pesticides frequently while others often. Another reason for the inelastic elasticity is that tobacco supply is linked directly to plant diseases and indirectly to pesticide demand; if pests attack more frequently, growers will use and demand more pesticides, and vice versa. In another situation, if the plant is being attacked by pests, farmers will use pesticides regardless of cost. The pest attack on the plant necessitates the pesticides, due to which, it has an elasticity less than one. Changes in market pricing, output, or input in the region have an impact on tobacco supply and farmers’ resource usage for tobacco cultivation, as shown by the findings.
Variable input costs in the study area are having a negative impact on green leaf production in Khyber Pakhtunkhwa. A one percent rise in the price of nitrogen fertilizer would result in a 0.14 percent decrease in tobacco output, whereas a one percent increase in the price of phosphorous fertilizer would result in a 0.16 percent decrease in tobacco output. Furthermore, a one percent increase in the price of potassium fertilizer would lead to a 0.22 percent reduction in tobacco output. It is surprising that the elasticity of tobacco output in relation to nitrogen (fertilizer) prices is smaller than the elasticity of tobacco output in relation to potassium and phosphorus fertilizer prices in absolute terms, indicating the importance of fertilizer potassium and phosphorus in tobacco production. Output supply in response to labor wage rate was (−0.16 inelastic), suggesting that a one percent increase in wage rate decreases output supply by 0.16 percent in the KP. Mechanical power, and farmyard manure input prices have also a negative effect on tobacco output. A one percent increase in the price of mechanical power, and FYM will decrease tobacco output by 0.08 percent, 0.23 percent, respectively. In absolute terms, the elasticity of tobacco supply with respect to mechanical power is smaller than that of tobacco output with respect to farmyard manure pricing, reflecting the importance of farmyard manure in tobacco production. Similarly, in absolute terms, the elasticity of tobacco supply in relation to the labor wage rate is larger than the elasticity of tobacco supply in relation to the machine price, suggesting the significance of labor in tobacco production and indicating that the crop is labor-intensive. Among the traditional fixed factors, land area has a considerable influence on affecting tobacco productivity and input usage. The land, which is an important fixed input in terms of tobacco output response, has an elasticity of 1.24, suggesting that tobacco output would increase by 1.24 percent if the land area under tobacco were to increase by one percent. The respondent’s education is unimportant, yet it has a positive influence on tobacco output, demonstrating and highlighting tobacco dominance among Khyber Pakhtunkhwa farmers regardless of education level.
Similarly, the elasticities of nitrogen, phosphorus, and potassium fertilizers in relation to the land area are positive and significant 1.02, 1.47, and 1.20, indicating that increasing the land area under tobacco cultivation by one percent increases nitrogen, phosphorus, and potassium fertilizer demand by 1.02, 1.47, and 1.20 percent, respectively. Labor demand’s own price elasticity is 0.55 in absolute terms, which is consistent with economic theory showing that labor demand is inelastic to wage rate changes. The land area, as predicted, had an expansionary influence on labor demand with an estimated elasticity greater than unity (1.35). The elasticities of fertilizer nitrogen, phosphorous, and potassium in relation to fixed input land area under cultivation are positive and significant, indicating that demand for these fertilizers increases as area under cultivation increases. Similarly, labor demand elasticity in relation to fixed input area under cultivation is also positive and significant, showing that an increase in the area under tobacco cultivation surges demand for labor in the study area. Labor demand elasticity in respect to mechanical power pricing is −0.25, suggesting that a one percent rise in mechanical power prices results in a 0.25 percent decrease labor demand. Labor demand has a negative and large elasticity in relation to mechanical power, indicating that they are complementary inputs whose combined application will boost tobacco production. This relationship demonstrates that, despite the fact that the majority of farmers farmed large plots for tobacco production, tobacco still requires more labor, indicating that tobacco is a labor-intensive crop. Mechanical power and farmyard manure have a positive and significant relationship with fixed factor land, suggesting that as the area under cultivation increases, so does the need for mechanical power and farmyard manure. Nitrogen demand elasticity in respect to farmyard manure pricing is −0.114, suggesting that a one percent rise in farmyard manure costs results in a 0.114 percent decrease in nitrogen fertilizer demand. The elasticity of farmyard manure (FYM) in relation to wage rate is −0.31, indicating that a one percent rise in the cost of FYM reduces labor demand by 0.31 percent. Similarly, labor demand elasticity is negative −0.17 in relation to farmyard manure price, suggesting that a one percent rise in FYM price reduces labor demand by 0.17 percent. Labor and FYM are complementary inputs, as evidenced by their negative elasticities, and their combined application boosts output in a synergistic way. FYM elasticity in relation to area under cultivation that is land is positive and significant indicating that as area under tobacco cultivation increases the demand for farmyard manure also increases.
3.4. Discussion
This study now briefly summarizes the above-mentioned findings on farm-level profitability, input demand, output supply, and their practical implications. The estimated farm-level tobacco cost of production revealed that the application cost of farmyard manure and chemical fertilizers is the highest cost component, accounting for 29 percent of the total cost, followed by land lease cost, accounting for 27 percent of the total cost. In comparison to the costs of other single components in the analysis, the land lease appears to be quite high. During the survey, it was observed that district Swabi has the highest land leasing rate among the three districts. The previous literature, which stated that land rent is the most important component of the tobacco cost of production, accounting for 30 percent of the entire cost in the KP, might be used to validate the high cost of land rent (
Iqbal 1998). Another study by
Nasrullah et al. (
2019) also confirmed the highest component’s validity and estimated profitability of tobacco producers in Mardan and found that land rent was the most expensive component, accounting for 25 percent of total tobacco production costs.
Farhan et al. (
2019) examined wheat supply response for district Swabi in KP and found that the estimated cost of land leasing is 37 percent of the overall cost incurred on per-acre wheat production. The findings further suggest that farm-level tobacco production is profitable, with a gross margin of PKR 120.62 thousand (net return of PKR 45,602) in KP and a benefit cost ratio of 1.17; however, farmers who completely process tobacco at their barn earn more revenue.
Nasrullah et al. (
2019) examined the cost and net return for tobacco producers in KP’s district of Mardan and found that the net return was PKR 162,746.32 (BCR = 1.67) per hectare, which is higher than farm-level tobacco production. In a similar study,
Hassan et al. (
2015) examined farmer profitability in Bangladesh’s Rangpur district and found that processed tobacco had a benefit-cost ratio of 1.29. Similarly,
Qamar et al. (
2006) and
Ullah et al. (
2015) studied the profitability of tobacco production in Swabi, KP, and found that their net profit for completely processing tobacco was PKR 29,065 (BCR = 1.21) and PKR 81,711 per acre, respectively. The net profit per hectare for the aforementioned studies was estimated, and each had a higher net return than the present farm-level study. As a result, tobacco producers in KP are suggested to process their farm-level tobacco at the barn instead of selling at the field in order to enhance profitability. As predicted, changes in market prices of inputs and outputs are also seen to have a significant impact on farmers’ resource usage and productivity in tobacco crop production. The study examined whether tobacco supply response is positive and significant to price changes, suggesting that a one percent increase in tobacco price increases output supply by 0.78 percent in KP. The elasticity is inelastic, which is likely due to the fact that tobacco is the only definite profitable crop for producers in those areas, and growers have little option but to plant it because the majority of farmers rely on tobacco production for livelihood.
Based on the findings, if the government of KP intends to enhance tobacco production and ensure the majority of households’ livelihoods, tobacco prices should increase. Consequently, an increase in farm-level tobacco pricing would considerably boost demand for input variables, indicating that a one percent increase in tobacco prices would raise demand for nitrogen, phosphorous, and potassium fertilizers by more than one percent. The majority of farmers used NPK, DAP, and some of them specifically used potash and SPP fertilizers for their crops, indicating that farmers in KP prefer fertilizers that include potassium. This is why the elasticity of demand for potassium fertilizer in relation to tobacco pricing was found to be higher than that of nitrogen and phosphorus demand, suggesting the significance of potassium fertilizer in tobacco crop productivity. These results are supported by a number of studies in the literature (
Ullah et al. 2015;
Nasrullah et al. 2019;
Ali 2020). Furthermore, a one percent increase in tobacco prices increases demand for other farm inputs such as labor, mechanical power, pesticides, and farmyard manure by 1.04, 1.01, 0.57, and 1.01 percent, respectively. With an elasticity of 0.57, pesticide demand is inelastic and least responsive to tobacco prices, which might be due to the fact that some farmers sprayed pesticides sparsely while others sprayed regularly. Another rationale is that tobacco production is directly linked to plant diseases and indirectly to pesticide demand; if pests attack more frequently, producers will use and need more pesticides, and vice versa. In another illustration, if a plant is being attacked by pests, growers will use pesticides at any cost. The insect attack on the plant necessitates the use of pesticides, resulting in an elasticity of less than one.
Green leaf production in KP is being affected by high input prices in the study area. A one percent increase in the price of nitrogen, phosphorous, and potassium fertilizers would reduce tobacco production by 0.14, 0.16, and 0.22 percent, respectively. The elasticity of tobacco output with respect to nitrogen (fertilizer) prices is lower in absolute terms than the elasticity of tobacco output in relation to potassium and phosphorus fertilizer prices, suggesting the significance of potassium and phosphorus fertilizer in tobacco production. The consistency of the outcomes may be found by observing that, in absolute terms, the elasticity of tobacco output in relation to nitrogen (fertilizer) prices is lower than the elasticity of tobacco output in relation to potassium and phosphorus fertilizer prices, implying the importance of potassium and phosphorus fertilizer in tobacco production. The elasticity of tobacco supply with respect to mechanical power is smaller than that of tobacco output in response to farmyard manure prices in absolute terms, showing the importance of farmyard manure in tobacco production. Similarly, the elasticity of tobacco supply in response to labor wage rate is larger in absolute terms than the elasticity of tobacco supply in relation to machine prices, implying that labor is important in tobacco production and that the crop is labor-intensive. The elasticity of land, which is a significant fixed input in terms of tobacco production response, is 1.24, indicating that if the land area under tobacco were to rise by one percent, tobacco output would increase by 1.24 percent. The elasticity of labor demand in relation to mechanical power pricing is −0.25, implying that a one percent increase in mechanical power pricing leads to a 0.25 percent decline in labor demand. Labor demand has a strong negative elasticity with respect to mechanical power, indicating that they are complimentary inputs whose joint application will increase tobacco production. This relationship shows that, despite the fact that most farmers cultivated large plots for tobacco production, tobacco still necessitates more labor, indicating that tobacco is a labor-intensive crop. Fixed factor land has a positive and significant relationship with mechanical power and farmyard manure, implying that as the area under cultivation increases, so does the demand for mechanical power and farmyard manure. As indicated by their negative elasticities, labor and FYM are complimentary inputs, and their joint application boosts output in a synergistic way.
4. Conclusions and Policy Options
Tobacco is a major cash crop in Khyber Pakhtunkhwa. The main objective of this study is to investigate the profitability and response of tobacco farmers in KP to price and non-price changes. The results show that tobacco cultivation is not very lucrative at the farm level (BCR = 1.17), with the cultivated land area having a significant impact on production. The average green leaf yield is estimated at 20,260 kg per hectare, with a gross margin of PKR 120.62 thousand per hectare. The most important determinant of tobacco supply and input demand is the tobacco price. According to the estimations, the elasticity of output supply is positive and significant, indicating that a one percent rise in tobacco prices would increase output supply by about 0.78 percent. The province’s contractual base cultivation is one of the possible reasons for the inelastic supply of tobacco. Furthermore, one plausible reason for the inelastic elasticity of tobacco supply is that farmers have almost no choice but to cultivate tobacco because it is the only certain lucrative cash crop in the surveyed region and many farmers’ main source of revenue.
Based on these estimates, an increase in tobacco prices would encourage tobacco growers to cultivate more tobacco in the future. An increase in the price of green tobacco leaves would also significantly increase the demand for input variables. The potassium and phosphorus fertilizer applications have been shown to be critical to the resource allocation in tobacco production. The elasticity of potassium fertilizer demand with respect to output price is greater than that of the nitrogen and phosphorus fertilizer demand, indicating the importance of potassium in tobacco production. Similarly, the demand for labor, mechanical power, pesticides, and farmyard manure in the study area increases when the price of output supply increases. The area under tobacco was found to be an important factor contributing to the supply of tobacco among the fixed factors inputs. Among the fixed factors, land area has a considerable influence in positively affecting tobacco productivity in the province.
The following policy implications emerge from the study’s findings: Given the influence of pricing on output supply, raising tobacco prices at the farm level will improve tobacco supply and input demand, thereby helping farmers, industry, and the economy in KP. Farmers have expressed their concern with the high cost of inputs during the data collection in the survey. As previously indicated in the results, an increase in tobacco prices significantly increases demand for input variables, and variable input prices have a negative impact on tobacco production; therefore, it is suggested that the government should provide inputs to tobacco growers at subsidized prices. Many farmers are cultivating tobacco without a contract and are having difficulty selling it during the harvesting season; therefore, if the government wants to increase tobacco production in the province, contracts should be made accessible to a significant number of farmers. Many respondents said they have grown native Swati seeds in the area, which are not approved globally or by tobacco companies in the country owing to high nicotine levels. It is therefore further recommended that the Pakistan Tobacco Board provide the best variety of seeds to all farmers in the province for free or at subsidized prices in order for them to cultivate approved tobacco varieties.


