Abstract
Metal-conducting polyaniline (PANI)-based nanocomposite materials have attracted attention in various applications due to their synergism of electrical, mechanical, and optical properties of the initial components. Herein, metal-PANI nanocomposites, including silver nanoparticle-polyaniline (AgNP-PANI), zinc oxide nanoparticle-polyaniline (ZnONP-PANI), and silver-zinc oxide nanoparticle-polyaniline (Ag–ZnONP-PANI), were prepared using the two processes. Nanocomposite-based electrode platforms were prepared by depositing AgNPs, ZnONPs, or Ag–ZnONPs on a PANI modified glass carbon electrode (GCE) in the presence of 1-ethyl-3-(3-dimethyl aminopropyl) carbodiimide/N-Hydroxysuccinimide (EDC/NHS, 1:2) as coupling agents. The incorporation of AgNPs, ZnONPs, and Ag–ZnONPs onto PANI was confirmed by UV-Vis spectrophotometry, which showed five absorbance bands at 216 nm, 412 nm, 464 nm, 550 nm, and 831 nm (i.e., transition of π-π*, π-polaron band transition, polaron-π* electronic transition, and AgNPs). The FTIR characteristic signatures of the nanocomposite materials exhibited stretching arising from C–H aromatic, C–O, and C–N stretching mode for benzenoid rings, and =C–H plane bending vibration formed during protonation. The CV voltammograms of the nanocomposite materials showed a quasi-reversible behavior with increased redox current response. Notably, AgNP–PANI–GCE electrode showed the highest conductivity, which was attributed the high conductivity of silver. The increase in peak currents exhibited by the composites shows that AgNPs and ZnONPs improve the electrical properties of PANI, and they could be potential candidates for electrochemical applications.
1. Introduction
Nanomaterials have found more applications compared to their large-scale counterparts due to their distinctive physical, chemical, and biological properties [1,2]. The unique size-dependent properties of nanoparticles have considerably impacted all scopes of human life, making nanotechnology a promising field for various applications [3,4,5]. Their synthesis, design, and manipulation have recently found great attention due to their wide applications in various fields including medicine, sensors, renewable energies, cosmetology, and bio-therapeutic devices [6,7,8]. Nanomaterials, such as quantum dots, zinc oxide nanoparticles (ZnONPs), gold nanoparticles (AuNPs), and AgNPs, offer enzyme-free sensing strategies as electroactive labels for direct signal output [9,10] redox ability [11,12], excellent biocompatibility [13], and electro catalytic activity [14,15,16]. Additional advantages of these nanomaterials are simple preparation methods [16], synthesis over a wide range of sizes and shapes [17], and easy surface conjugation to various ligands [18,19].
Additional applications of ZnONPs and AgNPs include catalysts, optical materials, pigments, cosmetics, biocidal and functional devices [20]. This is attributed to their high-performance with high mechanical strength and thermal stability at room temperature [21]. Of note, ZnONPs and AgNPs have particularly attracted more attention in the field of sensors due to their good electrochemical performance with a relatively sharp peak [22,23,24], mild electrochemical detection conditions [25], low oxidation potential, and easy dissolution of metal ions without poisonous reagents like Br2 [26,27,28,29,30]. For instance, AgNPs have demonstrated good sensing ability for hydrogen peroxide at concentrations as low as 0.9 µM [31], heavy metal ions such as Hg2+ with limit of detection of 25 nM [32,33] and microRNAs in serum samples up to 10−3 fM [34]. ZnONPs have also been used in the sensing and monitoring of nucleic acid hybridization [35] and toxic gases, such as CO [36]. AgNPs and ZnONPs have been widely used as fillers in polymer matrices to enhance their optical, catalytic, electrical, and conductivity properties [37]. For instance, Pavoski et al. (2019) [38] encapsulated AgNPs in silica and used them as antibacterial fillers in ethylene polymerization for potential application in active medicine packages. They exhibited good antibacterial activity towards Staphylococcus aureus with a 25 mm zone of inhibition. ZnONPs were incorporated in rubber, and they improved its mechanical properties including hardness, tensile strength, tear strength, and elongation at break [39]. Their incorporation as fillers in polymers has gained attention since they are environmentally friendly, can easily be synthesized by green methods, and they form strong bonds between the oxide groups on their surface with the polar groups in the polymer matrix [40,41].
Different metal and metal oxide nanoparticles have been incorporated into conducting polymers to form nanocomposites, a special class of materials with unique physical and chemical properties and wide application potential in diverse areas [42]. Conducting polymers such as polypyrroles (PPy), polythiophenes (PT), and polyanilines (PANI) have found widespread use in various applications since they are light weight, easy to process, and are resistant to corrosion [43,44]. They provide an effective immobilization platform with distinctive electron transfer capabilities, and possibilities for signal transduction [45]. Polyaniline (PANI) is an important conducting polymer employed in various applications due to its mechanical flexibility, low cost, good electrical conductivity, and thermal and chemical stability [46,47]. The polymer exhibits two redox couples that facilitate enzyme-polymer charge transfer, and its electrical properties can be controlled by protonation or changing the oxidation state of the polymer [48,49,50]. The functionalization of PANI with components such as metals, metalloids, and inorganic and organic compounds has attracted attention in order to improve and extend its functions [51]. Herein, AgNPs, ZnONPs, and Ag–ZnONPs were incorporated on the glassy carbon electrode that was previously modified by electrosynthesized PANI electrodes to form AgNP–PANI–GCE, ZnONP–PANI–GCE and Ag–ZnONP–PANI–GCE nanocomposites.
2. Materials and Methods
AgNPs, ZnONPs, and Ag–ZnONPs were synthesized as reported in our previous work [52]. Briefly, 20 mL of leaf extract of Bidens pilosa was added to 80 mL of 1 mM silver nitrate and/or zinc nitrate solution, the mixture allowed to stand for 2 h under nitrogen blanket, centrifuged at 14,500 rpm for 10 min, and dried at 60 °C for 8 h. Deionized water (resistivity, 18.2 MΩ.cm), aniline (C6H5NH2, 99.5%), 1-ethyl-3-(3-dimethyl aminopropyl) carbodiimide (EDC, 99%), N-Hydroxysuccinimide (NHS, 98%), ethanol (C2H5OH, 99.98%), and hydrochloric acid (HCl, 37%) were obtained from (Sigma Aldrich, Johannesburg, South Africa).
3. Electrosynthesis of PANI
A single compartment cell with a three-electrode electrochemical system comprising platinum (Pt) wire, glassy carbon electrode (GCE), and Ag/AgCl (3 M NaCl) as counter, working, and reference electrodes was used for all electrochemical studies. Prior to electrosynthesis of PANI, GCE was thoroughly polished with 1.0, 0.3, and 0.05 μm slurries of alumina, followed by sonication of the cleaned electrode using ethanol and de-ionized water. The working solution for the electro-polymerization of PANI film contained 0.1 M aniline, and 1 M hydrochloric acid (HCl). The solution was degassed by bubbling argon gas through it for 7 min before the electro-polymerization was started, and a blanket of the argon gas was then maintained above the solution during the electrodeposition and characterization processes. The PANI film was electrodeposited on a GCE from 1 M HCl containing 0.1531 g of aniline by voltametric sweep between −0.2 V and 1.2 V/SCE, at 50 mV/s for 20 cycles. The PANI modified electrode (PANI|GCE) was washed thoroughly with distilled water to remove the excess of monomer, and characterized in 1 M HCl using CV from −1 V to 1.2 V at varying scan rates.
4. Preparation of AgNP–PANI, ZnONP–PANI and Ag–ZnONP–PANI Composites
10 µL solution containing 10 mM EDC and 20 mM NHS was dropped on the surface of the PANI–GCE modified electrode and retained for 30 min. Subsequently, 10 µL of AgNPs solution was incorporated on the surface of the PANI|GCE modified electrode to form the AgNP–PANI–GCE modified electrode. The AgNP–PANI–GCE modified electrode was allowed to stand at ambient temperatures for 12 h before electro-analysis using CV at scan rates of 5–100 mV/s in 0.1 M HCl solution. The same procedure was followed for ZnONPs and Ag–ZnONPs, and the modified electrodes were denoted as ZnONP–PANI–GCE and Ag–ZnONP–PANI–GCE electrodes, respectively.
5. Characterization of Nanoparticles and Nanocomposites
The Surface Plasmon Resonance (SPR) properties and spectral analysis of the nanoparticles, PANI, AgNP-PANI, ZnONP-PANI and Ag–ZnONP-PANI were analyzed using UV-Visible spectrometer (Shimadzu UV-1700 UV Pharmaspec from Kyoto, Japan) over a range of 200 to 900 nm and Fourier transform infrared (FTIR-JASCO 4100 form Tokyo, Japan). Fourier transform infrared spectrometry (FTIR) was employed to monitor functional groups present in the as-prepared nanomaterials and composite materials (PerkinElmer Spectrum 100, PerkinElmer Incorporated, Shelton, CT, USA). High resolution transmission electron microscopy and high-resolution scanning electron microscopy (SEM) experiments measured the internal structure of the materials as well as the morphological properties using a Tecnai G2 F20X-Twin MAT 200 KV high resolution (HRTEM) equipped with an energy-dispersive X-ray spectroscopy (EDS) detector (manufactured by Field Electron and Ion Company (FEI) Europe, Eindhoven, The Netherlands) and Auriga Scanning Electron Microscope (Carl Zeiss Microscopy GmbH, Jena, Germany).
Small angle X-ray Scattering (SAXS) was performed with a SAXSpace Spectrometer from Anton Paar, Graz, Austria, using 35 µL of non-diluted sample. The results from the SAXS analyses were Fourier-transformed, using the GIFT software, into a pair–distance distribution function (PDDF) by volume and size distribution. Electrochemistry characterization was performed using a CHI 760E electrochemical analyzer (CH Instruments Inc., Shanghai, China). The electrochemical behavior of AgNPs, ZnONPs, Ag–ZnONPs, PANI, AgNP-PANI, ZnONP-PANI, and Ag–ZnONP-PANI composites was investigated on a bare GCE using CV at a scan rate (ν) of 10 mV/s. All of the experiments were carried out in 1 M HCl within a potential window of −1.0 to 1.2 V starting with anodic sweep from −1.0 V.
6. Results and Discussion
6.1. Optical Properties of AgNPs, ZnONPs, and Ag–ZnONPs
The surface plasmon bands for AgNPs (red line) synthesized were at 428 nm, as shown in Figure 1A, which corresponds to the Surface Plasmon band of silver that is around 420–500 nm [53]. ZnONPs (Figure 1A, green line) exhibited a band at 324 nm, while Ag–ZnONPs (Figure 1A, blue line) obtained two bands at 300 nm and a broad band at 428 nm. In both bands for ZnONPs and Ag–ZnONPs, the band corresponding to ZnONPs showed a blue shift as compared to that of bulk ZnO (388 nm) [54]. The blue shift could be attributed to (i) big particle size of aggregation of particles which increase Raleigh scattering, thus causing a decrease in absorbance [55], or (ii) the surrounding medium due to adsorbed compounds from the leaf extract and interparticle interactions [53,56].
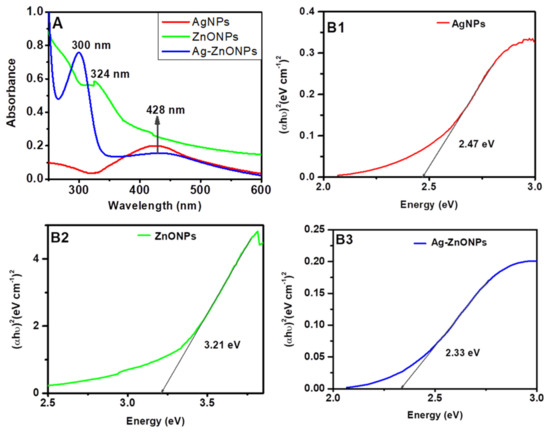
Figure 1.
UV-Vis spectra (A); and Tauc plots (B1–B3) of nanomaterials synthesized with leaf extracts of Bidens pilosa and silver and/or zinc nitrate solutions.
The optical energy band gaps for the nanoparticles were obtained using Tauc plots, as illustrated in Figure 1B1–B3. Graphs of (αhυ)2 against energy (hυ) were plotted and a straight line to (αhυ)2 = 0 axis, known as Tauc plots. The obtained values energy band gaps values were found to be 2.47 eV, 3.21 eV, and 2.33 eV for AgNPs, ZnONPs, Ag–ZnONPs, respectively. These values are in good agreement with the already reported studies: 2.47–2.9 eV [57,58] for AgNPs, and 3.20–3.30 eV [59,60] for ZnONPs.
6.2. Optical Properties of PANI, PANI-AgNPs, PANI-ZnONPs and PANI-Ag–ZnONPs
PANI film exhibited five absorbance bands at 216 nm, 412 nm, 464 nm, 550 nm, and 831 nm, as shown in Figure 2A. The band at 216 nm could correspond to π-π* transitions of the C=C bonds in the benzenoid and quinoid rings, i.e., the transition of an electron from the valance to the conduction band of benzenoid segments, due to the π-electronic configuration of PANI [61]. The band at 412 nm could be attributed to the π-polaron band transition at the same wavelength or to the oxidized dimer of aniline, diphenyl-p-phenylenediamine, which absorbs at 464 nm [61,62]. On the other hand, the band appearing at 550 nm is attributed to the polaron-π* electronic transition, related to the quinoid rings in the PANI as the transition from the emeraldine to the pernigraniline oxidation form occurs [62]. The minor peak at 831 nm, corresponds to n-π* polaronic transitions associated with delocalized proton charge carriers indicative, of the protonated emeraldine salt form of PANI [63]. The UV-Vis spectra for AgNP-PANI and Ag–ZnONP-PANI show similar bands to those of PANI and a minor band at 412 nm that corresponds to AgNPs [64]. From the results, it is clear that modification of PANI with the various nanoparticles increases the absorption of PANI.
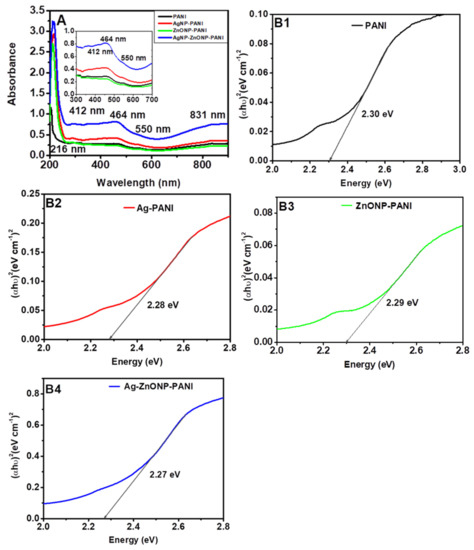
Figure 2.
UV-Vis spectra (A) and Tauc plots (B1–B4) of materials for wavelengths 200–900 nm. (A) (insert) is the UV-Vis spectra for wavelengths 300–700 nm.
Figure 2B1–B4 show the energy band gap energy values of 2.3 eV, 2.28 eV, 2.29 eV, and 2.27 eV associated with PANI (Figure 2B1), AgNP-PANI (Figure 2B2), ZnONP-PANI (Figure 2B3), and Ag–ZnONP-PANI (Figure 2B4), respectively. The obtained values are within the band gap energy range reported in previous studies for PANI (2.51–3.11 eV) [65,66,67], AgNP-PANI (2.07–2.37 eV) [37,65], and ZnONP-PANI (2.1–2.95 eV) [67,68,69]. The incorporation of nanoparticles in PANI increases absorption, which leads to a reduction in the energy band gap due to charge transfer transitions, and hence increase in optical conductivity [68]. This reduction in energy band gap can be attributed to the mobile electrons contained in the nanoparticles, and new excitation energy levels created below the regular band gap due to charge transfer from the nanoparticles to PANI [70]. This could also suggest that nanoparticles can increase the conductivity of PANI, and hence the possibility of using the nanocomposites in electrochemical devices and sensing platforms can be explored.
6.3. Characteristic Features of PANI, AgNP-PANI, ZnONP-PANI, and Ag–ZnONP-PANI
Figure 3 shows FTIR spectra for PANI, AgNP-PANI, ZnONP-PANI, and Ag–ZnONP-PANI. Herein, PANI (Figure 3, black line) exhibited absorption bands at 3537 and 3316 cm−1 for the N–H stretching mode [71], 3052 cm−1 for the C–H stretch aromatic [72], and 1648 cm−1 for the carbonyl stretching vibration of the amino group [73]. The bands at 1323 and 1394 could be attributed to the C–N and C=N stretching [74], 1170 cm−1 for the C–O stretch and C–N stretching mode for the benzenoid ring [75] or vibration of –NH+= structure [76], and 830 cm−1 for the =C–H plane bending vibration which is formed during protonation [77,78]. As inspected carefully, the FTIR characteristic features of AgNP-PANI (Figure 3, red line), ZnONP-PANI (Figure 3, green line), and Ag–ZnONP-PANI (Figure 3, blue line) shows that vibrational modes of PANI are not altered, as they give similar bands at 3097 cm−1 for the C–H stretch aromatic, 1648 cm-1 for the carbonyl stretch, and could also be attributed to existence of benzenoid rings, 1159 cm−1 for the C–O stretch and C–N stretching mode for the benzenoid ring, and 836 cm−1 for the =C–H plane bending vibration which is formed during protonation. The bands corresponding to the N–H stretch disappear in the nanocomposites’ IR bands, indicating formation of the amide bond between PANI and the compounds adsorbed onto the nanoparticles.
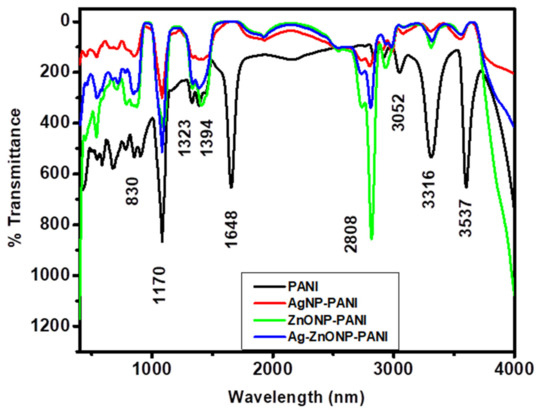
Figure 3.
FTIR spectra of PANI (black line), AgNP-PANI (red line), ZnONP-PANI (green line), and Ag–ZnONP-PANI (blue line) composites.
6.4. Size and Shape of AgNPs, ZnONPs, and Ag–ZnONPs
The size, shape, and d-spacing of nanoparticles were determined by HRTEM, HRSEM, and SAXS. HRTEM showed spherical nanoparticles that were crystalline in nature, with diameters ranging from 10 to 100 nm, as illustrated in Figure 4A–F. The HRSEM images of AgNPs, ZnONPs, and Ag–ZnONPs showed agglomerated spherical bubbles of different sizes, as shown in Figure 4G–I. Interestingly, AgNPs exhibited the largest particle sizes (with an average diameter of 70.4 nm), ZnONPs exhibited the smallest particle size (with two average diameters of 12.9 and 58.3 nm), and Ag–ZnONPs obtained a mixture of small and large particles (with average diameters of 12.9 and 73 nm) obtained using SAXS. It is worth noting that from the mixture of sizes observed for the Ag–ZnONPs from SAXS, a combination of AgNPs and ZnONPs could have been formed instead of the composite. The lattice fringes that were visible in HRTEM indicate good interplanar spacing (d-spacing), and the distance between the fringes represents the crystallinity of the nanoparticles. A first Fourier transform (FFT) was performed on the TEM images at 2 and 10 nm scales using ImageJ software to obtain the d-spacing from lattice fringes. The d-spacing obtained for AgNPs were 0.221 and 0.219 nm, for ZnONPs were 0.226 and 0.227 nm, and for Ag–ZnONPs were 0.217 and 0.225 nm. These values correspond to those reported in literature for AgNPs [79,80] and ZnONPs [81,82].
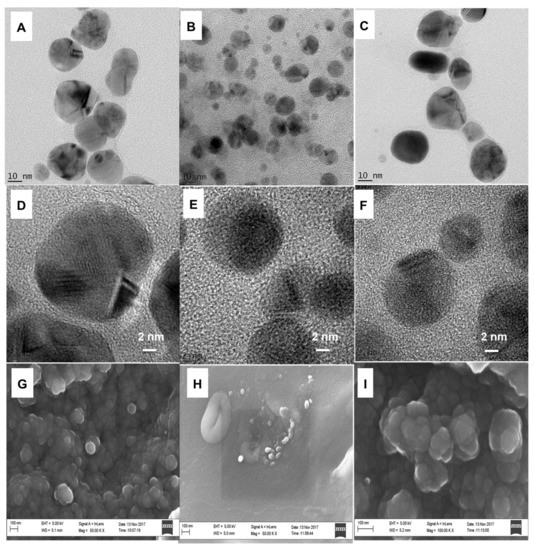
Figure 4.
HRTEM images of (A–C) AgNPs, ZnONPs, and Ag–ZnONPs at 10 nm scale view, (D–F) at 2 nm scale view. HRSEM images of (G–I) AgNPs, ZnONPs, and Ag–ZnONPs at 100 nm scale view.
The band gap energy, d-spacing, and size of the nanoparticles obtained using SAXS, and calculated from TEM were summarized in Table 1. It is evident that the sizes obtained from TEM were in correspondence to the sizes obtained from SAXS.

Table 1.
A summary of the band gap energy, d-spacing and sizes of AgNPs, ZnONPs, and Ag–ZnONPs obtained using TEM and SAXS.
6.5. Internal Structure of AgNPs, ZnONPs, and Ag–ZnONPs
The internal structures of the nanoparticles were validated by SAXS, as demonstrated by the plots of logarithm of intensity vs. scattering vector, and the results obtained were Fourier transformed using GIFT software into a PDDF profiles and distribution of sizes by number and volume, as shown in Figure 5A–C. The sharp increase of intensity at low angles demonstrated by AgNPs could be due to attractive inter-particle interactions that lead to aggregated nanoparticles, as shown in size distribution by intensity and volume in Figure 5B,C [83]. Additionally, the plot of log of intensity vs. scattering vector shows no oscillations for all of the nanoparticles, which implies that the nanoparticles that were formed were of different sizes which conforms to the results reported using HRTEM [83]. The PDDF analysis of AgNPs (Figure 5D, red line) and ZnONPs (Figure 5D, green line) exhibited a spherically shaped characteristic features with maximum radiuses of 70.5 nm and 76.2 nm, respectively. When the AgNPs and ZnONPs were combined to form a composite material, the Ag–ZnONPs (Figure 5D, blue line) exhibited a dumbbell shape, indicating an inhomogeneous mixture of the small ZnONPs and the larger AgNPs which is confirmed by the size distribution by intensity and volume in Figure 5E,F [84,85]. The AgNPs obtained had average particle sizes of approximately 70.4 nm and agglomerated particles appearing at 116.8 nm, while ZnONPs exhibited particle sizes ranging from 12.9 nm to 58.3 nm, and were agglomerated at 106.4 nm. The Ag–ZnONPs demonstrated two distinct sizes at approximately 12.9 nm and 73 nm, which correspond to the established individual sizes of ZnONPs and AgNPs. This could suggest that the Ag–ZnONPs formed were actually a mixture of the two nanoparticles (AgNPs and ZnONPs) and not a composite. This is in line to what was evidenced from the TEM discussed previously. More so, the intensity at around 104 nm for ZnONPs and 116.8 nm for AgNPs disappear in the Ag–ZnONPs mixture, which could suggest that no agglomeration takes place when the two nanoparticles are synthesized simultaneously.
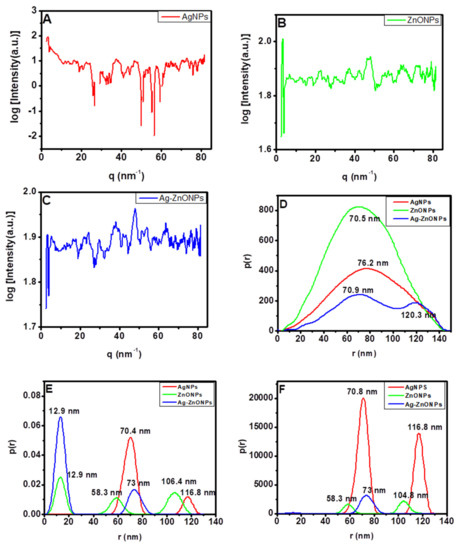
Figure 5.
(A–C) Scattering vector SAXS spectra, (D–F) particle size distribution analysis of SAXS data. Graphs are presented for (D) pair-distance distribution function; (E) number-weighted size distribution; and (F) volume-weighted size distribution: AgNPs (red line), ZnONPs (green line), and Ag–ZnONPs (blue line).
6.6. Electroanalysis of PANI and Composite Materials
Figure 6 shows the CVs recorded during the continuous scan of 40 cycles (scan rate of 50 mV/s) in a potential range of −1 to +1.2 V on the GCE containing 0.1 M aniline. For the first potential sweep, aniline was oxidized, resulting in an anodic current peak, and the product obtained from oxidation of aniline was deposited on the electrode surface to form PANI (a dark green film). As the number of scan cycles increased, the current peak also increased, indicating successive deposition of the PANI layers on the electrode surface.
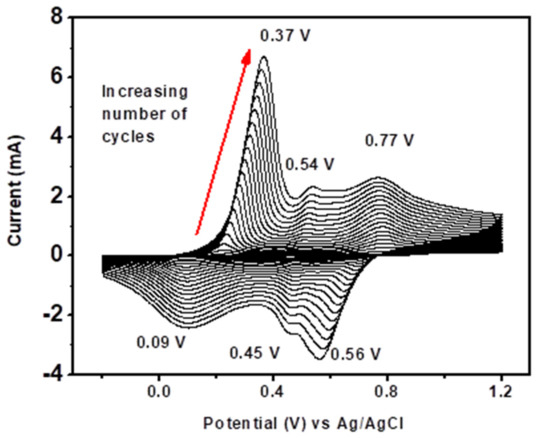
Figure 6.
Cyclic voltammograms for the electrosynthesis of PANI on a GCE in 1 M HCl, at a scan rate of 50 mV/s, for 40 cycles.
The first pair of redox peaks, O1R1 (0.37 V, 0.09 V), was attributed to the interconversion of PANI reduced form, leucoemeraldine, state to the half oxidized emeraldine base state, and vice versa. The pair O3R3 (0.77 V, 0.56 V) was due to oxidation of emeraldine base state to the oxidized pernigraniline state, and vice versa. The O2R2 (0.54 V, 0.45 V) peaks were attributed to either presence of ortho-coupled polymers [86] or the oxidation of segments of PANI chain to benzoquinone and hydroquinone species, whose potentials are very close to one another and tend to disappear after several scans [87,88]. The oxidation peak at O3 exhibited a broad oxidation wave compared to that of O1, which could signify that charge transfer was more difficult for the second oxidation step than the first [85].
Figure 7 contains the CVs of PANI and its nanocomposites performed in 1 M HCl at scan rates of 10, 20, 30, and 50 mV/s. The anodic peak currents increased with an increase in scan rate, which implies that the protonation of PANI chains in HCl as the supporting electrolyte was controlled by the diffusion of H+ [89]. Since the first anodic oxidation peak was attributed to radical cations at the N-position which depends on H+ doping, the slope of the first anodic peak current vs. the square root of scan rate and the Randles–Ševčík equation were used to obtain the diffusion coefficient of H+ in the electrolyte across the PANI–GCE, AgNP–PANI–GCE, ZnONP–PANI–GCE, and Ag–ZnONP–PANI–GCE modified electrodes. The Randles–Ševčík equation is given by (Equation (1)):
where ip is the peak current in A, n = 1 is the number of electrons transferred, F = 96485 C mol−1 is Faraday’s constant, A = 0.071 cm2 is the surface area of the electrode, R = 8.314 J mol−1, K−1 is the gas constant, T = 289.15 K is the temperature, ν is the scan rate in V/s, C is the concentration of the electrolyte in mol cm−3, and Dm is the diffusion coefficient of the ions, i.e., m is H+ or counter ion (Cl−). Using the anodic peaks (a) from Figure 7 for PANI–GCE (Figure 7A), AgNP–PANI–GCE (Figure 7B), ZnONP–PANI–GCE (Figure 7C), and Ag–ZnONP–PANI–GCE (Figure 7D), the slopes for peak current vs. square root of scan rate (Figure 7E) were used to obtain the diffusion coefficients of H+ across the modified electrodes. The diffusion coefficients of H+ across the modified electrodes were obtained to be DH+ = 1.20 × 10⁻⁷, 1.13 × 10⁻⁶, 1.33 × 10⁻⁷, and 6.57 × 10⁻⁸ cm2/s for PANI–GCE, AgNP–PANI–GCE, Ag–ZnONP–PANI–GCE, and ZnONP–PANI–GCE modified electrodes, respectively.
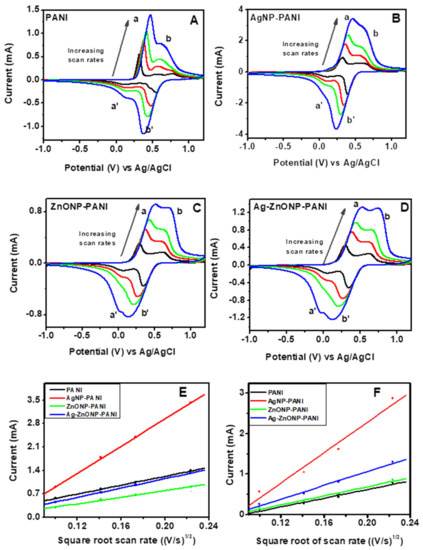
Figure 7.
Scan rate-dependent cyclic voltammograms of (A) PANI, (B) AgNP-PANI, (C) ZnONP-PANI, and (D) AgZnONP-PANI (black, red, green, and blue lines represent scan rates of 10, 20, 30, and 50 mV/s, respectively). Randles–Ševčík plots of the anodic peak currents of peak a ((E): used to calculate DH+) and peak b ((F): used to calculate DCl−).
The increase of the second oxidation peak (i.e., peak b of Figure 7A), which corresponds to the doping process of counterions as they are inserted into the film to neutralize positive charge by H+ protonation during PANI oxidation, indicates that the doping behavior of these supporting electrolytes is controlled consistently by the surface electron transfer process [88]. Using the anodic peaks (b) from Figure 7 for PANI–GCE (Figure 7A), AgNP–PANI–GCE (Figure 7B), ZnONP–PANI–GCE (Figure 7C), and Ag–ZnONP–PANI–GCE (Figure 7D), the slopes for peak current vs. square root of scan rate (Figure 7F) were used to obtain the diffusion coefficients of the counter ion (Cl−) across the modified electrodes. The diffusion coefficient of the counter ions across the modified electrodes were obtained to be DCl− = 7.854 × 10⁻⁸, 9.592 × 10⁻⁷, 1.930 × 10⁻⁷, and 8.764 × 10⁻⁸ cm2/s for PANI–GCE, AgNP–PANI–GCE, Ag–ZnONP–PANI–GCE and ZnONP–PANI–GCE modified electrodes, respectively.
The CVs for AgNPs (red line), ZnONPs (green line), and Ag–ZnONPs (blue line) show that the electron transfer is close to reversible as the anodic peak current are more defined in comparison to the cathodic peak currents (Figure 8A). From the CVs, it is clear that there is electrochemical dissolution (stripping) of nanoparticles on the electrode surface, and reduction in the generated metal ions in the oxidative part of the cycle. However, from the oxidative and reductive peaks, not all the metal ions are redeposited back, as demonstrated by the sharp anodic peaks corresponding to the oxidation of Ag0 to Ag+ at 0.23 V and 0.27 V for AgNP–GCE and Ag–ZnONP–GCE electrodes, respectively, whose subsequent reduction peaks are less intense and broad [90]. This could be attributed to the solubility of charged NPs and their dissolution away from the electrode, or that the rate of diffusion/adsorption of the NPs from solution to the electrode is lower than the scan rate [91,92]. The oxidation peak of AgNPs at 0.89 V could be due to the irreversible oxidation process of phenolic groups present in the stabilizing agents from the leaf extract of Bidens pilosa [93]. The reduction peaks observed for AgNPs, ZnONPs, and Ag–ZnONPs appeared at 0.54 V, −0.81 V, and −0.45 V, respectively.
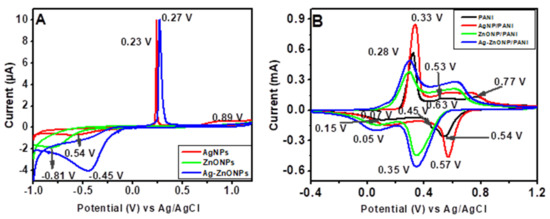
Figure 8.
(A) CVs of AgNP–GCE, ZnONP–GCE and Ag–ZnONP–GCE at a scan rate of 10 mV/s in 1 M HCl. (B) CVs of PANI|GCE, AgNP–PANI–GCE, ZnONP–PANI–GCE, and Ag–ZnONP–PANI–GCE at a scan rate of 10 mV/s in 1 M HCl.
CV voltammograms of the nanocomposites (Figure 8B) showed a quasi-reversible behavior similar to PANI, with increased oxidation and reduction peaks. Modification of PANI–GCE to AgNP–PANI–GCE led to an increase in anodic current (5.7 to 8.5 mA for AgNPs), while modification to ZnONP–PANI–GCE and Ag–ZnONP–PANI–GCE led to lower anodic currents (3.7 mA and 4.9 mA, respectively), as compared to PANI–GCE. This could be attributed to an increased distance due to the aggregation of dopants, yielding a thicker surface than the individual components, and hence resulting in slower electron transfer [94]. However, all the nanocomposites showed an increase in cathodic peak current (−4.6 mA, −4.5 mA, and −5.6 mA for AgNP–PANI–GCE, ZnONP–PANI–GCE, and Ag–ZnONP–PANI–GCE, respectively) as compared to −2.7 mA of PANI–GCE. The onset of oxidation of ZnONP–PANI–GCE and Ag–ZnONP–PANI–GCE occurs at more positive potentials, and their reduction peaks shift towards more negative potentials as compared to PANI–GCE and AgNP–PANI–GCE. This indicates that the oxides produced on the NPs in these nanocomposites are more stable, and are difficult to reduce [95]. This is in line with the CVs obtained for the nanoparticles, which showed that reduction occurred at more negative potentials of −0.61 V, −0.81 V, and −0.45 V for AgNPs, ZnONPs, and Ag–ZnONPs, respectively (Figure 8A). The increase in the peak currents depicted by the nanocomposites could be due to increased electron transfer rates resulting from an increased electroactive area, with the NPs acting as charge carriers along the PANI backbone [96], [97]. Modification of PANI with AgNPs showed the highest improvement in conductivity, which could be attributed to the high conducting properties of silver metal [37]. The peaks due to AgNP–PANI–GCE, ZnONP–PANI–GCE, and Ag–ZnONP–PANI–GCE show a slight anodic shift, which could be attributed to interaction between the nanoparticles and PANI chains and thiol groups adsorbed on the nanoparticle surfaces [98]. The preservation of the quasi-reversible electrode process and the increase in peak currents for the nanocomposites prove that AgNPs, ZnONPs, and Ag–ZnONPs improved the electrochemical properties of PANI–GCE [19]. The high surface area to volume ratio of the nanomaterials and the biocompatibility of PANI make the nanocomposites be good candidates for application in electrochemical devices [99].
To obtain the surface coverage, a slope of anodic peak vs. scan rate was used in the Brown–Anson equation (Equation (2)):
where ip = peak current in A, n = 1 is the number of electrons, F = 96485 C mol−1 is Faraday’s constant, A = 0.071 cm2, Γ is the surface area of the electroactive material in mol cm−2, ν is scan rate in V/s, R = 8.314 J mol−1 K−1 is the gas constant, and T = 298.015 K is the temperature. The peak potential of the Brown–Anson peak remains relatively unchanged with the scan rate, as it represents the presence of surface-bound electroactive thin film on the electrode [100]. This is labelled as peak b in the CVs of Figure 7: for PANI–GCE (Figure 7A), AgNP–PANI–GCE (Figure 7B), ZnONP–PANI–GCE (Figure 7C), and Ag–ZnONP–PANI–GCE (Figure 7D). The Brown–Anson plots are presented in Figure 9, and the slopes were used to calculate Γ using Equation (2). The Γ values for PANI–GCE, AgNP–PANI–GCE, ZnONP–PANI–GCE, and Ag–ZnONP–PANI–GCE are 2.48 × 10⁻⁷, 8.86 × 10⁻⁷, 2.44 × 10⁻⁷, and 3.48 × 10⁻⁷ mol cm−2, respectively.
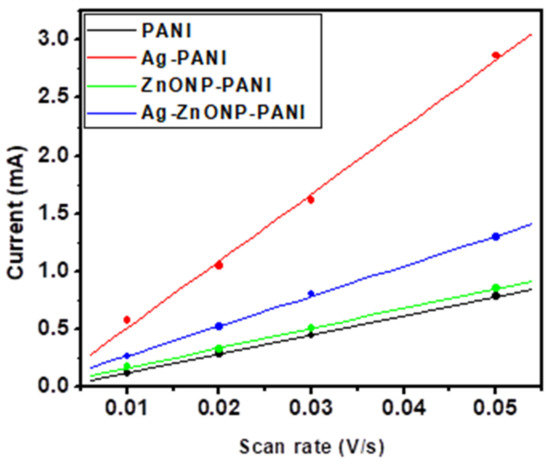
Figure 9.
Brown–Anson plots of the anodic peak currents obtained from Figure 7E.
7. Conclusions
AgNP-PANI, ZnONP-PANI, and Ag–ZnONP-PANI composites were successfully synthesized by two processes. The first process involves electrodeposition of PANI on a GCE, and the second process includes the adsorption of AgNPs, ZnONPs, and Ag–ZnONPs onto the PANI to for AgNP–PANI–GCE, ZnONP–PANI–GCE, and Ag–ZnONP–PANI–GCE via EDC/NHS as the coupling agents. SAXS confirmed the spherical nature of the nanoparticles, with sizes ranging from 0 to 130 nm. UV-Vis spectroscopy and FTIR showed the different electron transitions during electrodeposition of PANI and the different functional groups in the nanoparticle-PANI composites. CV analysis of PANI, AgNP–PANI–GCE, ZnONP–PANI–GCE, and Ag–ZnONP–PANI–GCE proved the conductivity of the composites to be higher than that of pure PANI and the nanoparticles alone. Since these nanoparticles improve the electrical properties of PANI, it suggests that the composites can be suitable for application in electrochemical devices and sensing platforms.
Author Contributions
Conceptualization, I.N.M. and E.I.I.; Methodology, E.I.I., U.F. and H.D.K.; software, E.I.I. and U.F.; validation, I.N.M., U.F. and E.I.I.; formal analysis, H.D.K. and U.F.; investigation, H.D.K.; resources, E.I.I.; writing-original draft preparation, H.D.K.; writing—review and editing, H.D.K., U.F. and E.I.I.; visualization, U.F. and E.I.I.; supervision, I.N.M., U.F. and E.I.I.; project administration, U.F. and E.I.I.; funding acquisition, H.D.K., I.N.M. and E.I.I. All authors have read and agreed to the published version of the manuscript.
Funding
This research was funded by: (i) Deutscher Akademischer Austauschdienst (DAAD) Grant (REF: 57221138) and (ii) Kenya/ South Africa Collaboration Grant (REF: NCST/5/003/2/53) for the project titled, ‘Nanobiosensor Chips for Anti-Tuberculosis’; and (iii) South African National Research Foundation SARChI Chair Grant (REF 85102) for NanoElectrochemistry and Sensor Technology.
Institutional Review Board Statement
Not applicable.
Informed Consent Statement
Not applicable.
Data Availability Statement
The data is available on request to the corresponding author.
Acknowledgments
The study was conducted at the University of the Western Cape Sensor Laboratories (SensorLab), South Africa.
Conflicts of Interest
The authors declare no conflict of interest.
References
- Sharma, V.K.; Yngard, R.A.; Lin, Y. Silver nanoparticles: Green synthesis and their antimicrobial activities. Adv. Colloid Interface Sci. 2009, 145, 83–96. [Google Scholar] [CrossRef] [PubMed]
- Makwana, B.A.; Darjee, S.; Jain, V.K.; Kongor, A.; Sindhav, G.; Rao, M.V. A comparative study: Metal nanoparticles as fluorescent sensors for biomolecules and their biomedical application. Sens. Actuators B Chem. 2017, 246, 686–695. [Google Scholar] [CrossRef]
- Sun, S.; Murray, C.B.; Weller, D.; Folks, L.; Moser, A. Monodisperse FePt Nanoparticles and Ferromagnetic FePt Nanocrystal Superlattices. Science 2000, 287, 1989–1992. [Google Scholar] [CrossRef] [PubMed]
- Sun, S.; Zeng, H. Size-Controlled Synthesis of Magnetite Nanoparticles. J. Am. Chem. Soc. 2002, 124, 8204–8205. [Google Scholar] [CrossRef]
- Hyeon, T. Chemical synthesis of magnetic nanoparticles. Chem. Commun. 2003, 1, 927–934. [Google Scholar]
- De, M.; Ghosh, P.S.; Rotello, V.M. Applications of Nanoparticles in Biology. Adv. Mater. 2008, 20, 4225–4241. [Google Scholar] [CrossRef]
- Lu, A.-H.; Salabas, E.L.; Schüth, F. Magnetic Nanoparticles: Synthesis, Protection, Functionalization, and Application. Angew. Chem. Int. Ed. 2007, 46, 1222–1244. [Google Scholar] [CrossRef]
- Chaudhuri, R.G.; Paria, S. Core/Shell Nanoparticles: Classes, Properties, Synthesis Mechanisms, Characterization, and Applications. Chem. Rev. 2012, 112, 2373–2433. [Google Scholar] [CrossRef]
- Lai, G.; Yan, F.; Wu, J.; Leng, C.; Ju, H. Ultrasensitive Multiplexed Immunoassay with Electrochemical Stripping Analysis of Silver Nanoparticles Catalytically Deposited by Gold Nanoparticles and Enzymatic Reaction. Anal. Chem. 2011, 83, 2726–2732. [Google Scholar] [CrossRef]
- Formisano, N.; Bhalla, N.; Wong, L.C.C.; di Lorenzo, M.; Pula, G.; Estrela, P. Multimodal electrochemical and nanoplasmonic biosensors using ferrocene-crowned nanoparticles for kinase drug discovery applications. Electrochem. Commun. 2015, 57, 70–73. [Google Scholar] [CrossRef]
- Su, L.-C.; Chang, Y.-F.; Chou, C.; Ho, J.A.; Li, Y.-C.; Chou, L.-D.; Lee, C.-C. Binding Kinetics of Biomolecule Interaction at Ultralow Concentrations Based on Gold Nanoparticle Enhancement. Anal. Chem. 2011, 83, 3290–3296. [Google Scholar] [CrossRef] [PubMed]
- Kashefi-Kheyrabadi, L.; Mehrgardi, M.A. Aptamer-conjugated silver nanoparticles for electrochemical detection of adenosine triphosphate. Biosens. Bioelectron. 2012, 37, 94–98. [Google Scholar] [CrossRef] [PubMed]
- Lautner, G.; Plesz, M.; Jágerszki, G.; Fürjes, P.; Gyurcsányi, R.E. Nanoparticle displacement assay with electrochemical nanopore-based sensors. Electrochem. Commun. 2016, 71, 13–17. [Google Scholar] [CrossRef][Green Version]
- Miao, P.; Meng, F.; Wang, B.; Zhu, X.; Tang, Y. Highly sensitive microRNA quantification with zero background signal from silver nanoparticles. Electrochem. Commun. 2015, 51, 89–92. [Google Scholar] [CrossRef]
- Wang, J.; Liu, G.; Wu, H.; Lin, Y. Quantum-Dot-Based Electrochemical Immunoassay for High-Throughput Screening of the Prostate-Specific Antigen. Small 2008, 4, 82–86. [Google Scholar] [CrossRef] [PubMed]
- Chen, P.C.; Mwakwari, S.C.; Oyelere, A.K. Gold nanoparticles: From nanomedicine to nanosensing. Nanotechnol. Sci. Appl. 2008, 1, 45–65. [Google Scholar]
- Panáček, A.; Kvítek, L.; Prucek, R.; Kolář, M.; Večeřová, R.; Pizúrová, N.; Sharma, V.K.; Nevěčná, T.; Zbořil, R. Silver Colloid Nanoparticles: Synthesis, Characterization, and Their Antibacterial Activity. J. Phys. Chem. B 2006, 110, 16248–16253. [Google Scholar] [CrossRef]
- Lismont, M.; Dreesen, L. Comparative study of Ag and Au nanoparticles biosensors based on surface plasmon resonance phenomenon. Mater. Sci. Eng. C 2012, 32, 1437–1442. [Google Scholar] [CrossRef] [PubMed]
- Narang, J.; Chauhan, N.; Jain, P.; Pundir, C.S. Silver nanoparticles/multiwalled carbon nanotube/polyaniline film for amperometric glutathione biosensor. Int. J. Biol. Macromol. 2012, 50, 672–678. [Google Scholar] [CrossRef] [PubMed]
- Hezma, A.M.; Rajeh, A.; Mannaa, M.A. An insight into the effect of zinc oxide nanoparticles on the structural, thermal, mechanical properties and antimicrobial activity of Cs/PVA composite. Colloids Surf. Physicochem. Eng. Asp. 2019, 581, 123821. [Google Scholar] [CrossRef]
- Baghdadi, Y.N.; Youssef, L.; Bouhadir, K.; Harb, M.; Mustapha, S.; Patra, D.; Tehrani-Bagha, A.R. The effects of modified zinc oxide nanoparticles on the mechanical/thermal properties of epoxy resin. J. Appl. Polym. Sci. 2020, 137, 49330. [Google Scholar] [CrossRef]
- Karadeniz, H.; Erdem, A.; Caliskan, A.; Pereira, C.M.; Pereira, E.M.; Ribeiro, J.A. Electrochemical sensing of silver tags labelled DNA immobilized onto disposable graphite electrodes. Electrochem. Commun. 2007, 9, 2167–2173. [Google Scholar] [CrossRef]
- Mehrgardi, M.A.; Ahangar, L.E. Silver nanoparticles as redox reporters for the amplified electrochemical detection of the single base mismatches. Biosens. Bioelectron. 2011, 26, 4308–4313. [Google Scholar] [CrossRef] [PubMed]
- Ivanova, O.S.; Zamborini, F.P. Size-Dependent Electrochemical Oxidation of Silver Nanoparticles. J. Am. Chem. Soc. 2010, 132, 70–72. [Google Scholar] [CrossRef]
- Singh, P.; Parent, K.L.; Buttry, D.A. Electrochemical Solid-State Phase Transformations of Silver Nanoparticles. J. Am. Chem. Soc. 2012, 134, 5610–5617. [Google Scholar] [CrossRef] [PubMed]
- Song, W.; Li, H.; Liang, H.; Qiang, W.; Xu, D. Disposable Electrochemical Aptasensor Array by Using in Situ DNA Hybridization Inducing Silver Nanoparticles Aggregate for Signal Amplification. Anal. Chem. 2014, 86, 2775–2783. [Google Scholar] [CrossRef] [PubMed]
- Jiang, X.; Chen, K.; Han, H. Ultrasensitive electrochemical detection of Bacillus thuringiensis transgenic sequence based on in situ Ag nanoparticles aggregates induced by biotin–streptavidin system. Biosens. Bioelectron. 2011, 28, 464–468. [Google Scholar] [CrossRef]
- Lin, D.; Mei, C.; Liu, A.; Jin, H.; Wang, S.; Wang, J. Cascade signal amplification for electrochemical immunosensing by integrating biobarcode probes, surface-initiated enzymatic polymerization and silver nanoparticle deposition. Biosens. Bioelectron. 2015, 66, 177–183. [Google Scholar] [CrossRef]
- Xia, N.; Wang, X.; Zhou, B.; Wu, Y.; Mao, W.; Liu, L. Electrochemical Detection of Amyloid-β Oligomers Based on the Signal Amplification of a Network of Silver Nanoparticles. ACS Appl. Mater. Interfaces 2016, 8, 19303–19311. [Google Scholar] [CrossRef]
- Hao, N.; Li, H.; Long, Y.; Zhang, L.; Zhao, X.; Xu, D.; Chen, H.-Y. An electrochemical immunosensing method based on silver nanoparticles. J. Electroanal. Chem. 2011, 656, 50–54. [Google Scholar] [CrossRef]
- Vasileva, P.; Donkova, B.; Karadjova, I.; Dushkin, C. Synthesis of starch-stabilized silver nanoparticles and their application as a surface plasmon resonance-based sensor of hydrogen peroxide. Colloids Surf. A Physicochem. Eng. Asp. 2011, 382, 203–210. [Google Scholar] [CrossRef]
- Jeevika, A.; Shankaran, D.R. Functionalized silver nanoparticles probe for visual colorimetric sensing of mercury. Mater. Res. Bull. 2016, 83, 48–55. [Google Scholar] [CrossRef]
- Prosposito, P.; Burratti, L.; Venditti, I. Silver Nanoparticles as Colorimetric Sensors for Water Pollutants. Chemosensors 2020, 8, 2. [Google Scholar] [CrossRef]
- Elhakim, H.K.A.; Azab, S.M.; Fekry, A.M. A novel simple biosensor containing silver nanoparticles/propolis (bee glue) for microRNA let-7a determination. Mater. Sci. Eng. C 2018, 92, 489–495. [Google Scholar] [CrossRef] [PubMed]
- Yumak, T.; Kuralay, F.; Muti, M.; Sinag, A.; Erdem, A.; Abaci, S. Preparation and characterization of zinc oxide nanoparticles and their sensor applications for electrochemical monitoring of nucleic acid hybridization. Colloids Surf. B Biointerfaces 2011, 86, 397–403. [Google Scholar] [CrossRef]
- Narayana, A.; Bhat, S.A.; Fathima, A.; Lokesh, S.V.; Surya, S.G.; Yelamaggad, C.V. Green and low-cost synthesis of zinc oxide nanoparticles and their application in transistor-based carbon monoxide sensing. RSC Adv. 2020, 10, 13532–13542. [Google Scholar] [CrossRef]
- Safenaz, M.R.; Sheikha, M.A.-G. Synthesis and Electrical Properties of Polyaniline Composite with Silver Nanoparticles. Adv. Mater. Phys. Chem. 2012, 2, 75–81. [Google Scholar]
- Pavoski, G.; Baldisserottoa, D.L.S.; Maraschinc, T.; Bruma, L.F.W.; Santosa, C.; Santosa, J.H.Z.; Brandellib, A.; Galland, G.B. Silver nanoparticles encapsulated in silica: Synthesis, characterization and application as antibacterial fillers in the ethylene polymerization. Eur. Polym. J. 2019, 117, 38–54. [Google Scholar] [CrossRef]
- Suntako, R. Influence of Zinc Oxide Nanograins on Properties of Epoxidized Natural Rubber Vulcanizates. Adv. Mater. Res. 2014, 1044–1045, 23–26. [Google Scholar] [CrossRef]
- Aftab, A.; Ismail, A.R.; Khokhar, S.; Ibupoto, Z.H. Novel zinc oxide nanoparticles deposited acrylamide composite used for enhancing the performance of water-based drilling fluids at elevated temperature conditions. J. Pet. Sci. Eng. 2016, 146, 1142–1157. [Google Scholar] [CrossRef]
- Moreira, N.H.; Domıinguez, A.; Frauenheim, T.; da Rosa, A.L. On the stabilization mechanisms of organic functional groups on ZnO surfaces. Phys. Chem. Chem. Phys. 2012, 14, 15445–15451. [Google Scholar] [CrossRef] [PubMed]
- Tang, E.; Cheng, G.; Ma, X. Preparation of nano-ZnO/PMMA composite particles via grafting of the copolymer onto the surface of zinc oxide nanoparticles. Powder Technol. 2006, 161, 209–214. [Google Scholar] [CrossRef]
- Morrin, A.; Ngamna, O.; Killard, A.J.; Moulton, S.E.; Smyth, M.R.; Wallace, G.G. An amperometric enzyme biosensor fabricated from polyaniline nanoparticles. Electroanalysis 2005, 17, 423–430. [Google Scholar] [CrossRef]
- Chen, Y.; Li, Y.; Yip, M.; Tai, N. Electromagnetic interference shielding efficiency of polyaniline composites filled with graphene decorated with metallic nanoparticles. Compos. Sci. Technol. 2013, 80, 80–86. [Google Scholar] [CrossRef]
- Killard, A.J.; Micheli, L.; Grennan, K.; Franek, M.; Kolar, V.; Moscone, D.; Palchetti, I.; Smytha, M.R. Amperometric separation-free immunosensor for real-time environmental monitoring. Anal. Chim. Acta 2001, 427, 173–180. [Google Scholar] [CrossRef][Green Version]
- Lu, X.; Yu, Y.; Chen, L.; Mao, H.; Gao, H.; Wang, J.; Zhang, W.; Wei, Y. Aniline dimer–COOH assisted preparation of well-dispersed polyaniline–Fe3O4 nanoparticles. Nanotechnology 2005, 16, 1660–1665. [Google Scholar] [CrossRef]
- Liu, Z.; Wang, J.; Xie, D.; Chen, G. Polyaniline-Coated Fe3O4 Nanoparticle–Carbon-Nanotube Composite and its Application in Electrochemical Biosensing. Small 2008, 4, 462–466. [Google Scholar] [CrossRef]
- Tian, S.; Liu, J.; Zhu, T.; Knoll, W. Inverse Opals of Polyaniline and Its Copolymers Prepared by Electrochemical Techniques. Chem. Mater. 2004, 16, 4103–4108. [Google Scholar] [CrossRef]
- Chauhan, N.; Narang, J.; Pundir, C.S. Fabrication of multiwalled carbon nanotubes/polyaniline modified Au electrode for ascorbic acid determination. Analyst 2011, 136, 1938–1945. [Google Scholar] [CrossRef]
- Luong, J.H.T.; Male, K.B.; Glennon, J.D. Biosensor technology: Technology push versus market pull. Biotechnol. Adv. 2008, 26, 492–500. [Google Scholar] [CrossRef]
- Ćirić-Marjanović, G. Recent advances in polyaniline composites with metals, metalloids and nonmetals. Synth. Met. 2013, 170, 31–56. [Google Scholar] [CrossRef]
- Kyomuhimbo, H.D.; Michira, I.N.; Mwaura, F.B.; Derese, S.; Feleni, U.; Iwuoha, E.I. Silver–zinc oxide nanocomposite antiseptic from the extract of bidens Pilosa. SN Appl. Sci. 2019, 1, 681. [Google Scholar] [CrossRef]
- Desai, R.; Mankad, V.; Gupta, S.K.; Jha, P.K. Size distribution of silver nanoparticles: UV-visible spectroscopic assessment. Nanosci. Nanotechnol. Lett. 2012, 4, 30–34. [Google Scholar] [CrossRef]
- Bagabas, A.; Alshammari, A.; Aboud, M.F.; Kosslick, H. Room-temperature synthesis of zinc oxide nanoparticles in different media and their application in cyanide photodegradation. Nanoscale Res. Lett. 2013, 8, 516. [Google Scholar] [CrossRef] [PubMed]
- Rani, R.; Kumar, H.; Salar, R.K.; Purewal, S.S. Antibacterial activity of copper oxide nanoparticles against gram negative bacterial strain synthesized by reverse micelle technique. Int. J. Pharm. Res. Dev. 2014, 6, 72–78. [Google Scholar]
- Mankad, V.; Kumar, R.K.; Jha, P.K. Investigation of Blue-Shifted Plasmon Resonance: An Optical Properties Study of Silver Nanoparticles. Nanosci. Nanotechnol. Lett. 2013, 5, 889–894. [Google Scholar] [CrossRef]
- Rafique, M.; Rafique, M.S.; Kalsoom, U.; Afzal, A.; Butt, S.H.; Usman, A. Laser ablation synthesis of silver nanoparticles in water and dependence on laser nature. Opt. Quantum Electron. 2019, 51, 179. [Google Scholar] [CrossRef]
- Thirumagal, N.; Jeyakumari, A.P. Structural, optical and antibacterial properties of green synthesized silver nanoparticles (AgNPs) using justicia adhatoda L. J. Clust. Sci. 2020, 31, 487–497. [Google Scholar] [CrossRef]
- Kumar, S.S.; Venkateswarlu, P.; Rao, V.R.; Rao, G.N. Synthesis, characterization and optical properties of zinc oxide nanoparticles. Int. Nano Lett. 2013, 3, 30. [Google Scholar] [CrossRef]
- Dodoo-Arhin, D.; Asiedu, T.; Agyei-Tuffour, B.; Nyankson, E.; Obada, D.; Mwabora, J.M. Photocatalytic degradation of Rhodamine dyes using zinc oxide nanoparticles. Mater. Today Proc. 2021, 38, 809–815. [Google Scholar] [CrossRef]
- Korent, A.; Soderžnik, K.Ž.; Šturm, S.; Rožman, K.Ž. A correlative study of polyaniline electropolymerization and its electrochromic behavior. J. Electrochem. Soc. 2020, 167, 106504. [Google Scholar] [CrossRef]
- Singh, S.K.; Verma, A.K.; Shukla, R.K. Synthesis and optical studies of pure polyaniline film. Int. J. Curr. Microbiol. App. Sci. 2014, 3, 512–517. [Google Scholar]
- Sidwaba, U.; Ntshongontshi, N.; Feleni, U.; Wilson, L.; Waryo, T.; Iwuoha, E.I. Manganese peroxidase-based electro-oxidation of bisphenol A at hydrogellic polyaniline-titania nanocomposite-modified glassy carbon electrode. Electrocatalysis 2019, 10, 323–331. [Google Scholar] [CrossRef]
- Martínez-Castañón, G.A.; Niño-Martínez, N.; Martínez-Gutierrez, F.; Martínez-Mendoza, J.R.; Ruiz, F. Synthesis and antibacterial activity of silver nanoparticles with different sizes. J. Nanopart. Res. 2008, 10, 1343–1348. [Google Scholar] [CrossRef]
- Gupta, K.; Jana, P.C.; Meikap, A.K. Optical and electrical transport properties of polyaniline–silver nanocomposite. Synth. Met. 2010, 160, 1566–1573. [Google Scholar] [CrossRef]
- Das, M.; Sarkar, D. One-pot synthesis of zinc oxide-polyaniline nanocomposite for fabrication of efficient room temperature ammonia gas sensor. Ceram. Int. 2017, 43, 11123–11131. [Google Scholar] [CrossRef]
- Daikh, S.; Zeggai, F.Z.; Bellil, A.; Benyoucef, A. Chemical polymerization, characterization and electrochemical studies of PANI/ZnO doped with hydrochloric acid and/or zinc chloride: Differences between the synthesized nanocomposites. J. Phys. Chem. Solids. 2018, 121, 78–84. [Google Scholar] [CrossRef]
- Prasanna, A.E.P.; Karpagavinayagam, P.; Kulandaivel, S.; Vedhi, C. Investigation on zinc oxide nanoparticle incorporated polyaniline nanocomposites for solar cell applications. Mater. Today Proc. 2020, 8, 245–252. [Google Scholar]
- Saravanan, R.; Sacari, E.; Gracia, F.; Khan, M.M.; Mosquera, E.; Gupta, V.K. Conducting PANI stimulated ZnO system for visible light photocatalytic degradation of coloured dyes. J. Mol. Liq. 2016, 221, 1029–1033. [Google Scholar] [CrossRef]
- Almasi, M.J.; Sheikholeslami, T.F.; Naghdi, M.R. Band gap study of polyaniline and polyaniline/MWNT nanocomposites with in situ polymerization method. Compos. Part B Eng. 2016, 96, 63–68. [Google Scholar] [CrossRef]
- Shahabuddin, S.; Sarih, N.M.; Mohamad, S.; Ching, J.J. SrTiO3 Nanocube-Doped Polyaniline Nanocomposites with Enhanced Photocatalytic Degradation of Methylene Blue under Visible Light. Polymers 2016, 8, 2. [Google Scholar] [CrossRef]
- Yu, Q.; Xu, J.; Liu, J.; Li, B.; Liu, Y.; Han, Y. Synthesis and properties of PANI/SiO2 organic–inorganic hybrid films. Appl. Surf. Sci. 2012, 263, 532–535. [Google Scholar] [CrossRef]
- Jin, X.; Jiangb, H.; Lic, G.; Fua, B.; Baoa, X.; Wanga, Z.; Hu, Q. Stretchable, conductive PAni-PAAm-GOCS hydrogels with excellent mechanical strength, strain sensitivity and skin affinity. Chem. Eng. J. 2020, 394, 124901. [Google Scholar] [CrossRef]
- Zheng, J.; Ma, X.; He, X.; Gao, M.; Li, G. Praparation, characterizations, and its potential applications of PANi/graphene oxide nanocomposite. Procedia Eng. 2012, 27, 1478–1487. [Google Scholar] [CrossRef]
- Mota, M.L.; Carrillo, A.; Verdugo, A.J.; Olivas, A.; Guerrero, J.M.; de la Cruz, E.C.; Ramírez, N.N. Electrochemical Dopamine Biosensor Based on Poly(3-aminobenzylamine) Layer-by-Layer Self-Assembled Multilayer Thin Film. Molecules 2019, 24, 8. [Google Scholar]
- Geethalakshmi, D.; Muthukumarasamy, N.; Balasundaraprabhu, R. Effect of dopant concentration on the properties of HCl-doped PANI thin films prepared at different temperatures. Optik 2014, 125, 1307–1310. [Google Scholar] [CrossRef]
- Zhu, H.; Peng, S.; Jiang, W. Electrochemical Properties of PANI as Single Electrode of Electrochemical Capacitors in Acid Electrolytes. Sci. World J. 2013, 2013, e940153. [Google Scholar]
- Bilibana, M.P.; Feleni, U.; Williams, A.R.; Iwuoha, E. Impedimetric microcystin-LR aptasensor prepared with sulfonated poly (2, 5-dimethoxyaniline)–silver nanocomposite. Processes 2021, 9, 179. [Google Scholar] [CrossRef]
- Asanithi, P.; Chaiyakun, S.; Limsuwan, P. Growth of silver nanoparticles by DC magnetron sputtering. J. Nanomater. 2012, 2012, 1–8. [Google Scholar] [CrossRef]
- Li, S.; Shen, Y.; Xie, A.; Yu, X.; Qiu, L.; Zhang, L.; Zhang, Q. Green synthesis of silver nanoparticles using Capsicum annuum L. extract. Green Chem. 2007, 9, 852–858. [Google Scholar] [CrossRef]
- Dayakar, T.; Rao, K.V.; Bikshalu, K.; Rajendar, V.; Park, S.-H. Novel synthesis and structural analysis of zinc oxide nanoparticles for the non enzymatic glucose biosensor. Mater. Sci. Eng. C 2017, 75, 1472–1479. [Google Scholar] [CrossRef] [PubMed]
- Atchudan, R.; Edison, T.N.J.I.; Perumal, S.; Karthikeyan, D.; Lee, Y.R. Facile synthesis of zinc oxide nanoparticles decorated graphene oxide composite via simple solvothermal route and their photocatalytic activity on methylene blue degradation. J. Photochem. Photobiol. B Biol. 2016, 162, 500–510. [Google Scholar] [CrossRef]
- Kikhney, A.G. A practical guide to small angle X-ray scattering (SAXS) of flexible and intrinsically disordered proteins. FEBS Lett. 2015, 589, 2570–2577. [Google Scholar] [CrossRef] [PubMed]
- Pacoste, L.C.; Jijana, A.N.; Feleni, U.; Iwuoha, E. Mercaptoalkanoic Acid-Induced Band Gap Attenuation of Copper Selenide Quantum Dot. Chem. Select. 2020, 5, 4994–5005. [Google Scholar] [CrossRef]
- Memela, M.; Feleni, U.; Mdluli, S.; Ramoroka, M.E.; Ekwere, P.; Douman, S.; Iwuoha, E. Electro-photovoltaics of Polymer-stabilized Copper–Indium Selenide Quantum Dot. Electroanalysis 2020, 32, 3086–3097. [Google Scholar] [CrossRef]
- Pruneanu, S.; Veress, E.; Marian, I.; Oniciu, L. Characterization of polyaniline by cyclic voltammetry and UV-Vis absorption spectroscopy. J. Mater. Sci. 1999, 34, 2733–2739. [Google Scholar] [CrossRef]
- Parsa, A.; Mirshafieyan, S.; Shakeri, A.; Amanzadeh-Salout, S. Electrodeposition of Platinum Nanoparticles on Polyaniline Modified Electrode and its Electrocatalytic Activity towards the Oxidation of Methanol. Orient. J. Chem. 2016, 32, 1823–1829. [Google Scholar] [CrossRef]
- Fomo, G.; Waryo, T.T.; Baker, P.; Iwuoha, E.I. Electrochemical Polymerization. Int. J. Electrochem. Sci. 2016, 11, 10347–10361. [Google Scholar] [CrossRef]
- Hassan, H.K.; Atta, N.F.; Galal, A. Electropolymerization of Aniline over Chemically Converted Graphene-Systematic Study and Effect of Dopant. Int. J. Electrochem. Sci. 2012, 7, 11161–11181. [Google Scholar]
- Arul, P.; John, S.A. Silver nanoparticles built-in zinc metal organic framework modified electrode for the selective non-enzymatic determination of H2O2. Electrochim. Acta 2017, 235, 680–689. [Google Scholar] [CrossRef]
- Giovanni, M.; Pumera, M. Size Dependant Electrochemical Behavior of Silver Nanoparticles with Sizes of 10, 20, 40, 80 and 107 nm. Electroanalysis 2012, 24, 615–617. [Google Scholar] [CrossRef]
- Dobre, N.; Golgovici, F.; Anicai, L.; Buda, M. Cyclic Voltammetry of Silver Nanoparticles on Platinum, Gold and Glassy Carbon Electrodes. Rev. Chim. 2014, 65, 578–581. [Google Scholar]
- Filho, M.M.S.L.; Correa, A.A.; Silva, F.D.C.; Carvalho, F.A.O.; Mascaro, L.H.; Oliveira, T.M.B.F. A glassy carbon electrode modified with silver nanoparticles and functionalized multi-walled carbon nanotubes for voltammetric determination of the illicit growth promoter dienestrol in animal urine. Microchim. Acta 2019, 186, 525. [Google Scholar]
- Sathiyanarayanan, S.; Jeyaprabha, C.; Venkatachari, G. Influence of metal cations on the inhibitive effect of polyaniline for iron in 0.5 M H2SO4. Mater. Chem. Phys. 2008, 107, 350–355. [Google Scholar] [CrossRef]
- Bansal, V.; Li, V.; O’Mullane, A.P.; Bhargava, S.K. Shape dependent electrocatalytic behaviour of silver nanoparticles. Cryst. Eng. Comm. 2010, 12, 4280–4286. [Google Scholar] [CrossRef]
- Afzali, M.; Mostafavi, A.; Shamspur, T. Square wave voltammetric determination of anticancer drug flutamide using carbon paste electrode modified by CuO/GO/PANI nanocomposite. Arab. J. Chem. 2020, 13, 3255–3265. [Google Scholar] [CrossRef]
- Sidwaba, U.; Feleni, U.; Makelane, H.; Nxusani, E.; Wilson, L.; Qakala, S.; Rassie, C.; Masikini, M.; Waryo, T.; Ajayi, R.F.; et al. A Novel Polyaniline Nanocomposite with Doping Effects of Poly(Methyl Methacrylate) and TiO2 Nanoparticles. J. Nano Res. 2016, 44, 281–292. [Google Scholar] [CrossRef]
- Feleni, U.; Sidwaba, U.; Ntshongontshi, N.; Wilson, L.; Iwuoha, E. Biocompatible Palladium Telluride Quantum Dot-Amplified Biosensor for HIV Drug. Electrocatalysis 2020, 11, 68–76. [Google Scholar] [CrossRef]
- Santos, V.M.; Ribeiro, R.S.A.; Bosco, A.J.T.; Alhadeff, E.M.; Bojorge, N.I. Characterization and Evaluation of Silver-Nanoparticle-Incorporated in Composite Graphite Aiming at their Application in Biosensors. Braz. J. Chem. Eng. 2017, 34, 647–657. [Google Scholar] [CrossRef]
- Iwuoha, E.I.; de Villaverde, D.S.; Garcia, N.P.; Smyth, M.R.; Pingarron, J.M. Reactivities of organic phase biosensors. 2. The amperometric behaviour of horseradish peroxidase immobilised on a platinum electrode modified with an electrosynthetic polyaniline film. Biosens. Bioelectron. 1997, 12, 749–761. [Google Scholar] [CrossRef]


Publisher’s Note: MDPI stays neutral with regard to jurisdictional claims in published maps and institutional affiliations. |
© 2022 by the authors. Licensee MDPI, Basel, Switzerland. This article is an open access article distributed under the terms and conditions of the Creative Commons Attribution (CC BY) license (https://creativecommons.org/licenses/by/4.0/).