Article

CTC-537E7.3 as a Liver-Specific Biomarker for Hepatocellular Carcinoma: Diagnostic and Prognostic Implications

1
Department of Biochemistry, Kosin University College of Medicine, Seo-gu, Busan 49267, Republic of Korea
2
Department of Gastroenterology, Ajou University School of Medicine, 164 Worldcup-ro, Yeongtong-gu, Suwon 16499, Republic of Korea
3
Department of Biomedical Sciences, Ajou University Graduate School of Medicine, 164 Worldcup-ro, Yeongtong-gu, Suwon 16499, Republic of Korea
*
Author to whom correspondence should be addressed.
These authors contributed equally to this work.
Curr. Issues Mol. Biol. 2025, 47(7), 563; https://doi.org/10.3390/cimb47070563
Submission received: 13 June 2025 / Revised: 10 July 2025 / Accepted: 17 July 2025 / Published: 18 July 2025

Abstract

Hepatocellular carcinoma (HCC) critically lacks reliable biomarkers for early detection. By mining the TCGA_LIHC and two GEO cohorts, we identified the liver-specific long non-coding RNA CTC-537E7.3 as the most consistently down-regulated transcript in tumors. This finding was validated in 97 paired tissues, with CTC-537E7.3 expression lost in 95% of cases (*** p < 0.0001). It demonstrated excellent diagnostic performance in discriminating tumor from non-tumor tissue (AUC = 0.95), which was maintained in early-stage (I/II) disease. Low CTC-537E7.3 expression correlated with shorter overall and disease-free survival and was inversely associated with serum α-fetoprotein (AFP) levels, highlighting its complementary clinical value. Mechanistic investigation revealed a potential competing endogenous RNA (ceRNA) axis. The microRNA miR-190b-5p was highly expressed in tumors and predicted to bind CTC-537E7.3, while its target, PLGLB1, was significantly suppressed. Survival analysis confirmed that concurrent high expression of CTC-537E7.3 and PLGLB1 conferred superior outcomes. These findings establish CTC-537E7.3 as a liver-specific, ceRNA-mediated tumor suppressor with robust diagnostic and prognostic potential. It represents a promising adjunct to existing HCC surveillance strategies, such as ultrasound and AFP measurement, for high-risk populations.

Graphical Abstract

1. Introduction

Hepatocellular carcinoma (HCC), the sixth most frequently diagnosed type of cancer, is the third leading cause of cancer-related mortality worldwide, with approximately 900,000 new cases and 830,000 deaths [1,2]. The risk factors for HCC include chronic hepatitis B or C infection, alcoholic liver disease, and nonalcoholic fatty liver disease (NAFLD) [3]. Owing to the asymptomatic nature of the early stages, most patients present with advanced stages of HCC at the time of diagnosis despite the advancements in surveillance programs. This contributes to a poor 5-year survival rate of <20% [4].
The early and accurate detection of HCC remains a pivotal challenge in clinical practice. Alpha-fetoprotein (AFP) and proteins induced by vitamin K absence II (PIVKA-II) are the primary serum biomarkers used for HCC surveillance at present; however, the sensitivity (62–65%) and specificity (approximately 87%) of AFP are often insufficient for the detection of early-stage HCC. Furthermore, AFP levels may be elevated in patients with non-malignant liver conditions [5]. The sensitivity and specificity of PIVKA-II are approximately 71% and 90% [5], respectively; nevertheless, it may fail to detect a subset of tumors. Moreover, the lens culinaris agglutinin-reactive fraction of AFP (AFP-L3) has emerged as a guideline-endorsed refinement that increases HCC specificity when used alongside total AFP and PIVKA-II, yet its stand-alone sensitivity—especially for early tumors—remains modest and its global adoption uneven [6,7]. The limitations of these biomarkers underscore the necessity of developing novel diagnostic tools for the early detection and risk stratification of HCC.
Long non-coding RNAs (lncRNAs), defined as RNA transcripts exceeding 200 nucleotides without protein-coding potential, are promising candidates that could serve as cancer biomarkers [8,9]. The roles of lncRNAs encompass a broad spectrum of regulatory functions, including epigenetic remodeling, modulation of transcription factor activity, and microRNA sequestration [10,11,12,13]. Beyond their functional versatility, lncRNAs possess the following intrinsic properties that favor clinical translation: (i) tightly regulated, tissue- and cell-type-specific transcription driven by epigenetic programs; (ii) complex secondary/tertiary structures that confer resistance to ribonuclease degradation; and (iii) selective packaging into extracellular vesicles, enabling stable and non-invasive detection in biofluids such as serum, plasma, and urine [8,14,15,16]. These advantages are already reflected in the clinic; for example, the prostate-specific lncRNA PCA3 received FDA approval in 2012 for urine-based testing [17] and, in bladder cancer, UCA1 has achieved >90% sensitivity and >95% specificity in prospective studies and is currently undergoing multicenter validation [18]. Furthermore, a multicenter study showed that serum extracellular-vesicle-derived LINC00853 discriminated all-stage HCC from non-HCC liver disease with an AUC of 0.93 (95% CI, 0.887–0.966) and outperformed AFP in early (mUICC stage I) tumors, achieving 94% sensitivity and 90% specificity versus 9% and 73% for AFP; notably, LINC00853 remained positive in 97% of AFP-negative early HCC cases [19]. The specificity and functional relevance of lncRNA-based biomarkers have prompted extensive research on these biomarkers to improve the diagnosis and prognosis of multiple types of cancer.
The present study focuses on a novel liver-specific lncRNA, CTC-537E7.3, which was significantly downregulated in HCC across multiple transcriptomic datasets. The diagnostic and prognostic potential of CTC-537E7.3 was further validated through quantitative real-time polymerase chain reaction (qRT-PCR) analysis of 97 paired HCC and adjacent non-tumor (NT) tissues that examined its correlations with clinicopathological parameters and patient outcomes. Moreover, a dedicated competitive endogenous RNAs (ceRNAs) analysis suggested that CTC-537E7.3 may act as a molecular sponge for the tumor-suppressive miR-190b-5p, thereby relieving post-transcriptional repression of the oncogenic effector PLGLB1. The present study reveals that CTC-537E7.3 is a clinically relevant biomarker with high specificity for liver tissue that could serve as a potential adjunct to AFP in facilitating the early detection and risk stratification of HCC.

2. Materials and Methods

2.1. Expression and Prognostic Analysis in Public Omics Datasets

Transcriptomic data obtained from three independent datasets, The Cancer Genome Atlas-Liver Hepatocellular Carcinoma (TCGA_LIHC), Gene Expression Omnibus (GEO) series GSE77314 [20], and series GSE124535 [21], are used in the present study. The lncRNAs extracted from these datasets were filtered through differential expression analysis (*** p < 0.001) of the NT and tumor (T) samples. Prior to this test, a biologically driven expression filter was applied—only lncRNAs with log2(TPM + 1) > 1 (≈TPM > 1) in ≥70% of NT samples and log2(TPM + 1) < 1 in ≥70% of T samples were retained. TPM ≈ 1 is widely accepted as the lower bound for reliable detection and corresponds to roughly one transcript per cell; using this threshold enriches for genes that are robustly expressed in normal liver yet effectively silenced in HCC, thereby minimizing artefactual fold changes from transcripts with uniformly low counts. The 10 most downregulated lncRNAs across all datasets were identified for further analyses.
The TCGA_LIHC dataset was used to further validate the expression levels in the NT vs. T samples. Kaplan–Meier survival analysis was performed to evaluate the prognostic relevance. The duration between the diagnosis of HCC and death from any cause was defined as overall survival (OS). The duration between curative treatment and recurrence of disease was defined as disease-free survival (DFS). The duration between the diagnosis of HCC and death caused by HCC, excluding deaths from other causes, was defined as disease-specific survival (DSS). The duration between the diagnosis of HCC and disease progression or recurrence was defined as progression-free survival (PFS). Two complementary analyses were conducted to determine the liver-specific expression of CTC-537E7.3. Transcriptomic data from the Genotype-Tissue Expression (GTEx) project (https://www.gtexportal.org/home/, accessed on 9 July 2025) were retrieved to compare the expression across a wide range of normal tissues. Subsequently, pan-cancer expression data across 23 different types of cancer were obtained from the Genomic Data Commons (GDC) hub of UCSC Xena (https://xena.ucsc.edu/, accessed on 9 July 2025) to examine the levels in the T and NT tissues [22].

2.2. qRT-PCR

QIAzol Reagent (Qiagen, Hilden, Germany) was used in accordance with the manufacturer’s instructions to extract total RNA from the frozen tissue samples. Subsequently, 5× PrimeScript™ RT Master Mix (Takara Bio, Shiga, Japan) was used to synthesize cDNA from 500 ng of total RNA under the following conditions: 37 °C for 15 min, 85 °C for 5 s, and 4 °C. AmfiSure qGreen Q-PCR Master Mix (GenDEPOT, Barker, TX, USA) was used to conduct qRT-PCR on a CFX Connect Real-Time PCR Detection System (Bio-Rad Laboratories, Hercules, CA, USA). The expression levels were normalized to those of HMBS as internal control. The amplification CTC-537E7.3 primer sequences were 5′-GGG AGG AAC CCG TTT GGA TT-3′ (forward) and 5′-GAC CTT CCC AGG ACC TCA AC-3′ (reverse). The HMBS primer sequences were 5′-ACGGCTCAGATAGCATACAAGAG-3′ (forward) and 5′-GTTACGAGCAGTGATGCCTACC-3′ (reverse). PCR was conducted under the following conditions: 95 °C for 2 min; 40 cycles at 95 °C for 15 s, 62 °C for 34 s, and 72 °C for 30 s; followed by a dissociation stage at 95 °C for 10 s, 65 °C for 5 s, and 95 °C for 5 s. The relative expression was determined using the relative standard curve method (2−ΔΔCt). All experiments were performed at least in triplicate.

2.3. Clinical Sample Collection

Ninety-seven paired HCC and corresponding NT liver tissue samples were obtained from the Biobank of Ajou University Hospital (Suwon, Republic of Korea) to validate the expression patterns of CTC-537E7.3 observed from public omics data. qRT-PCR analysis was conducted as described previously. Comprehensive demographic and clinical data, including age, sex, etiology of liver disease, body mass index (BMI), platelet count, serum albumin levels, total bilirubin levels, international normalized ratio (INR), creatinine levels, sodium levels, aspartate aminotransferase (AST) levels, alanine aminotransferase (ALT) levels, AFP levels, PIVKA-II levels, hemoglobin levels, glucose levels, total cholesterol levels, and the presence of ascites, were recorded. Tumor staging was performed in accordance with the Pathological Union for International Cancer Control (pUICC) classification system (Table 1).

2.4. miRNA Expression Profiling and ceRNA Network Construction

Raw mature-miRNA read counts for TCGA_LIHC were downloaded from the GDC using the TCGAbiolinks pipeline (v2.30.1) [23,24]. Counts were filtered to retain miRNAs expressed at ≥1 count per million (CPM) in ≥30% of samples, then TMM-normalized and transformed to log2-CPM with the edgeR package (v4.2). Differential expression between non-tumor (NT) and tumor (T) tissues were assessed with limma-voom (v3.58); miRNAs with |log2 FC| ≥ 0.5 and FDR < 0.05 were considered significantly deregulated.
For ceRNA screening, Pearson correlation coefficients (r) were calculated between CTC-537E7.3 and each miRNA across matched mRNA- and miRNA-seq tumor samples. Candidate oncogenic miRNAs were defined as follows: (i) overexpressed in tumors and (ii) inversely correlated with CTC-537E7.3. Putative mRNA targets of each candidate miRNA were retrieved from miRDB (https://mirdb.org/, accessed on 9 July 2025) with a target score ≥ 70 [25]. Predicted targets were filtered to keep transcripts that were as follows: (i) downregulated in tumors and (ii) positively correlated with CTC-537E7.3 while showing a negative correlation with the cognate miRNA.

2.5. Statistical Analysis

All data are presented as mean ± standard deviation (SD). Inter-group differences were assessed using an unpaired Student’s t-test (GraphPad Software, version 10.0; San Diego, CA, USA). Kaplan–Meier survival curves were generated for OS, DFS, DSS, and PFS. Statistical significance was determined using the log-rank test. MedCalc (MedCalc Software, version 22.018; Ostend, Belgium), which provided AUC, 95% confidence interval (CIs), sensitivity, and specificity, was used to conduct receiver operating characteristic (ROC) curve analyses. Statistical significance was set at * p < 0.05. All experiments were performed at least in triplicate.

3. Results

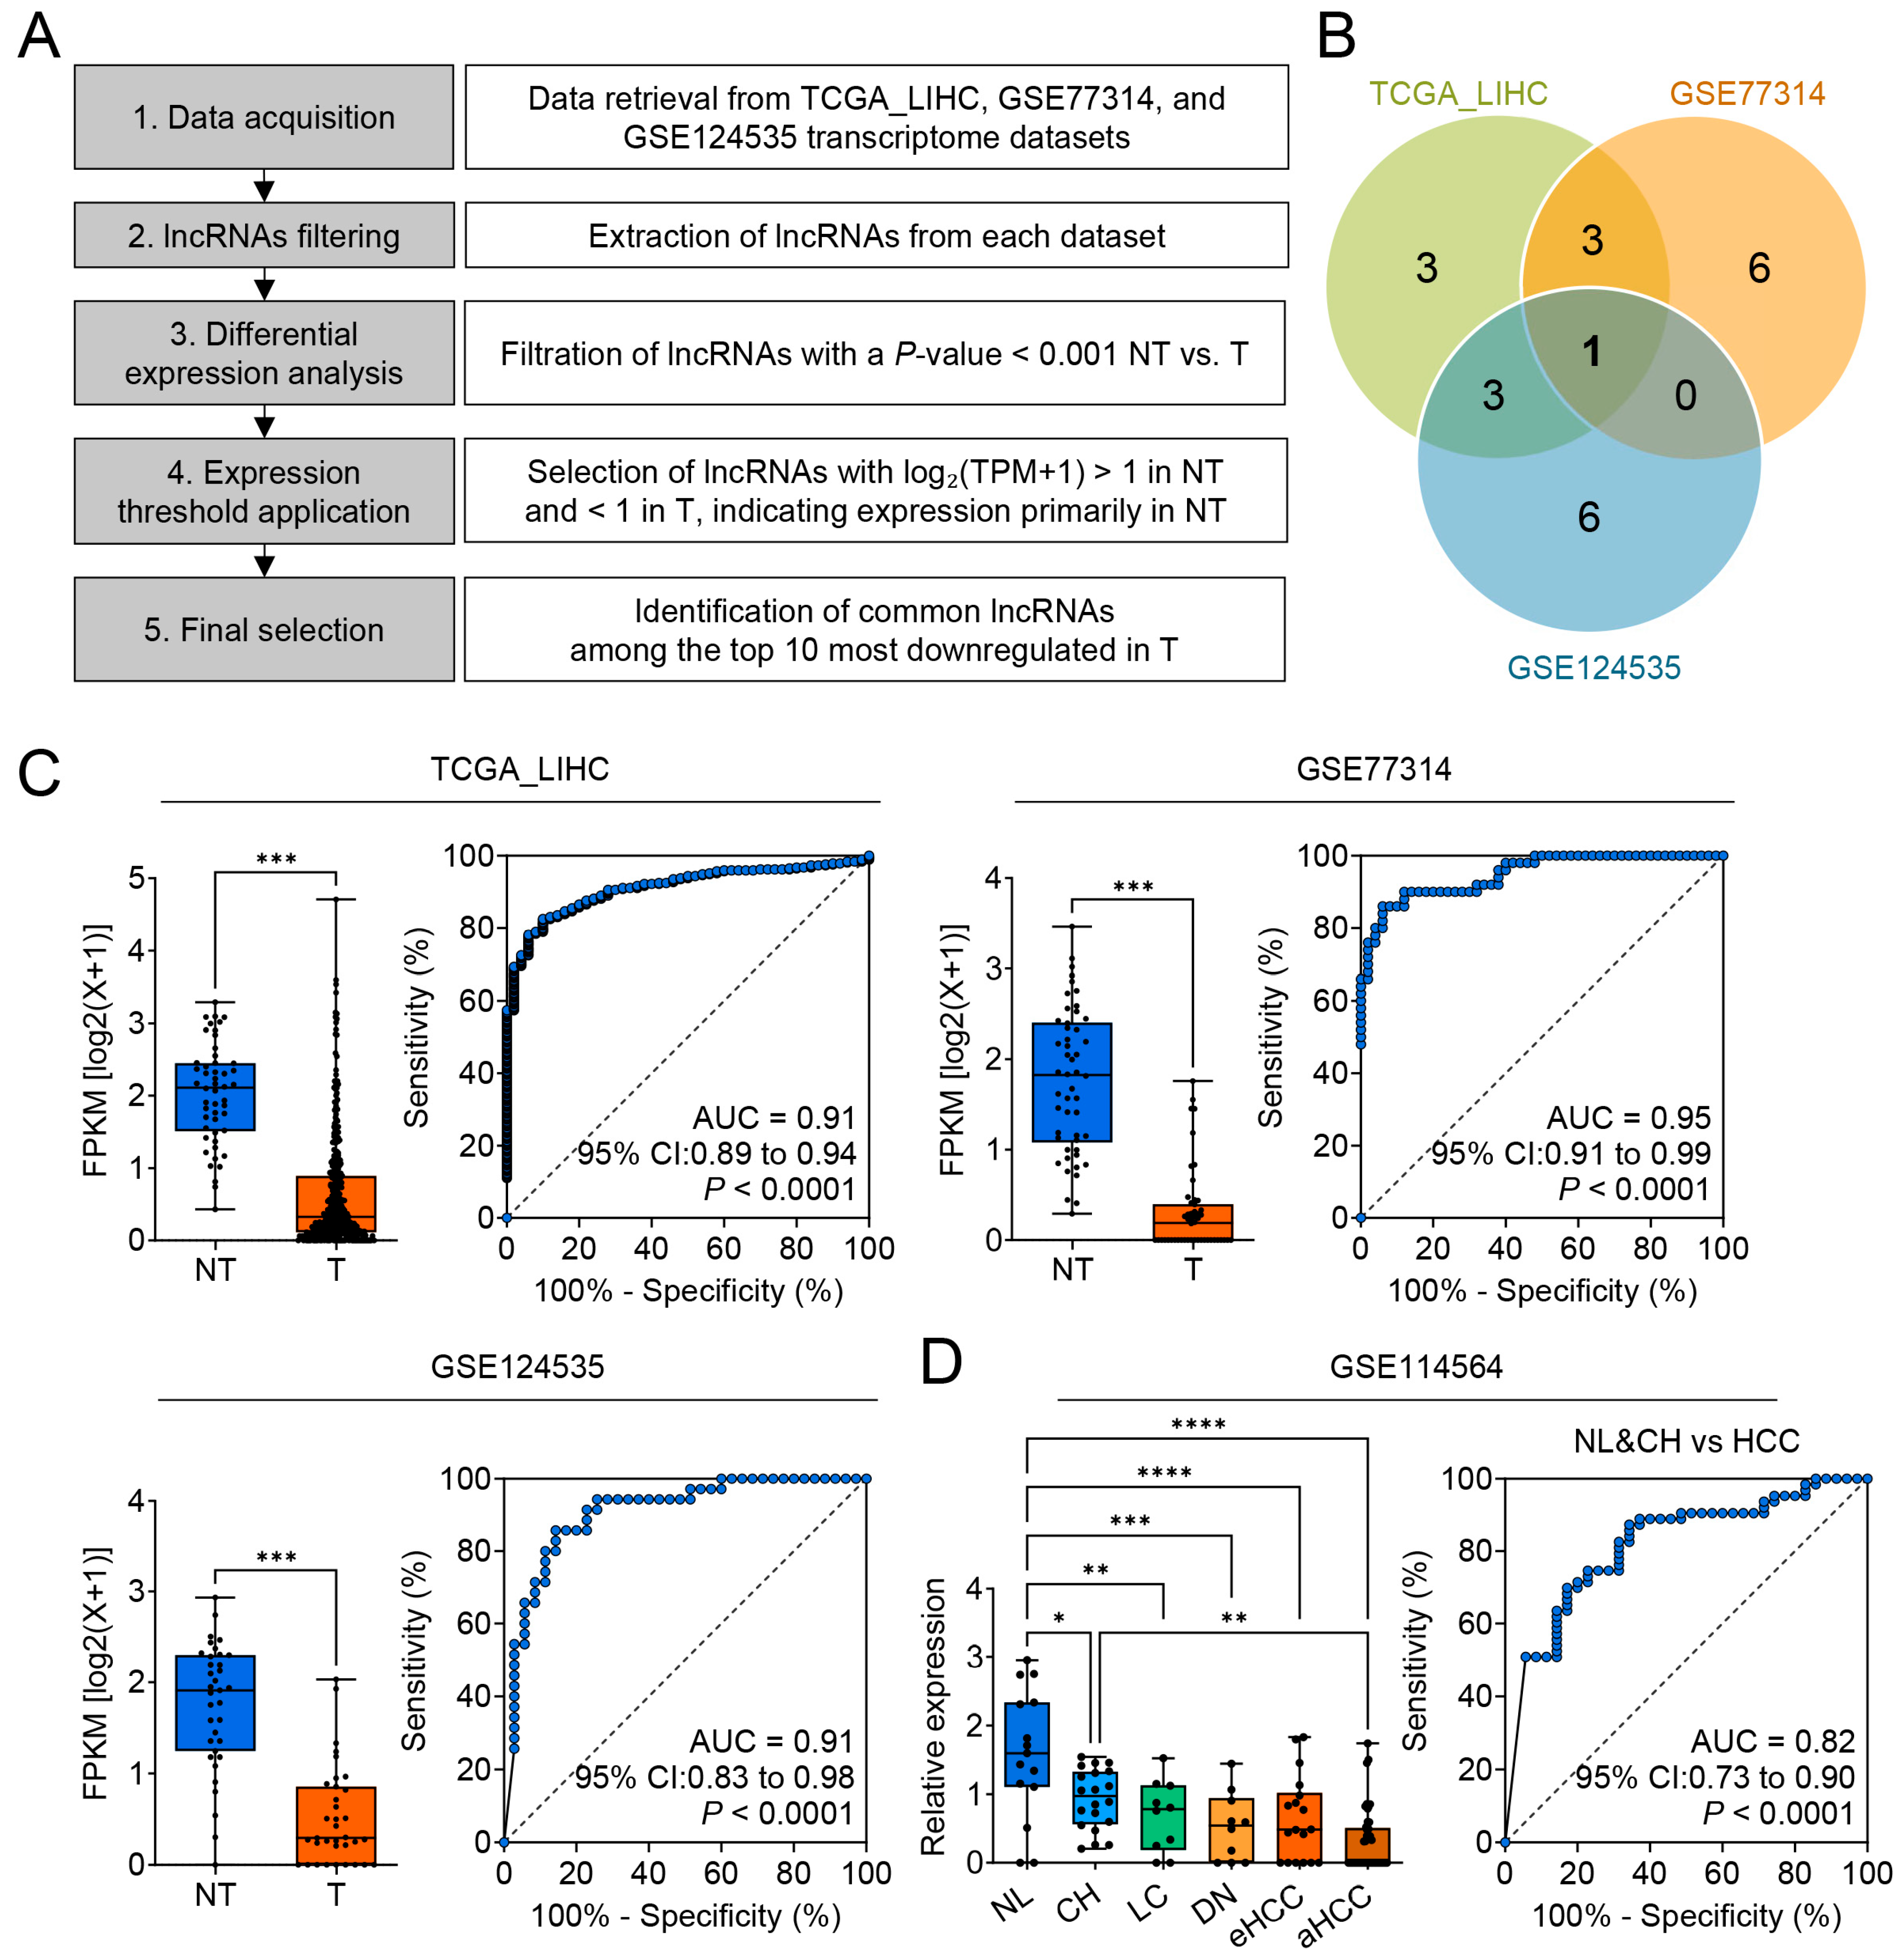
3.1. Identification of CTC-537E7.3 as a Potential Diagnostic Biomarker for Liver Cancer

Transcriptomic data from TCGA-LIHC and two GEO cohorts (GSE77314, GSE124535) were analyzed with a two-stage filter. First, lncRNAs significantly downregulated in tumors versus matched normal tissue (p < 0.001) were selected. Second, candidates had to show log2(TPM + 1) > 1 in normal tissue but <1 in tumors, enriching for transcripts robustly expressed in healthy liver yet effectively silenced in HCC (Figure 1A). Among the ten most down-regulated lncRNAs in each dataset, only CTC-537E7.3 was common to all three (Figure 1B; Table 2), underscoring its consistent loss during hepatocarcinogenesis. Consistent with this two-stage selection, we next validated CTC-537E7.3 expression across all three cohorts. CTC-537E7.3 expression in the T tissues was significantly lower than that in the NT tissues across the three datasets (TCGA_LIHC, GSE77314, and GSE124535) (Figure 1C, left bar plots for each dataset). Notably, the expression level was maintained above the threshold (fragments per kilobase per million [FPKM] log2 > 1) in the NT tissues but below the threshold (FPKM log2 < 1) in the T tissues, underscoring tumor-specific downregulation. This pattern of further reduction from a relatively low basal level suggests that CTC-537E7.3 may play a tumor-suppressive role.
ROC curve analysis conducted to evaluate the diagnostic potential of CTC-537E7.3 revealed that CTC-537E7.3 exhibited high discriminatory power in distinguishing tumor tissues from normal tissues, yielding AUC values of 0.91 (95% CI: 0.89–0.94, *** p < 0.0001), 0.95 (95% CI: 0.91–0.99, *** p < 0.0001), and 0.91 (95% CI: 0.83–0.98, *** p < 0.0001) in TCGA_LIHC, GSE77314, and GSE124535, respectively (Figure 1C, right ROC curve plots for each dataset). The association between CTC-537E7.3 expression and the progression of liver disease in different stages of liver disease, including normal liver (NL), chronic hepatitis (CH), liver cirrhosis (LC), dysplastic nodules (DN), early HCC (eHCC), and advanced HCC (aHCC), was further assessed using the GSE114564 dataset (Figure 1D, left bar plot). This analysis revealed that CTC-537E7.3 expression was significantly reduced as disease severity increased. However, CTC-537E7.3 expression in CH did not differ significantly from that in NL. These findings indicate that its downregulation was more specifically linked to malignant transformation.
CTC-537E7.3 could effectively distinguish noncancerous liver diseases (NL and CH) from HCC, achieving an AUC of 0.82 (95% CI: 0.73–0.90, *** p < 0.0001) in the ROC analysis (Figure 1D, right). Additionally, to test whether pre-existing cirrhosis attenuates this diagnostic performance, we analyzed an independent cohort (GSE104310) in which NT and HCC specimens are explicitly stratified by cirrhosis status. CTC-537E7.3 remained significantly lower in HCC than in NT both for non-cirrhotic livers (AUC = 0.90, *** p = 0.003) and cirrhotic livers (AUC = 1.00, * p = 0.02) (Supplementary Figure S1A,B).
These findings suggest its potential utility in the early detection and precise disease stratification of HCC, further suggesting that CTC-537E7.3 may act as a valuable biomarker for monitoring the progression of benign or precancerous liver conditions to overt malignancy.

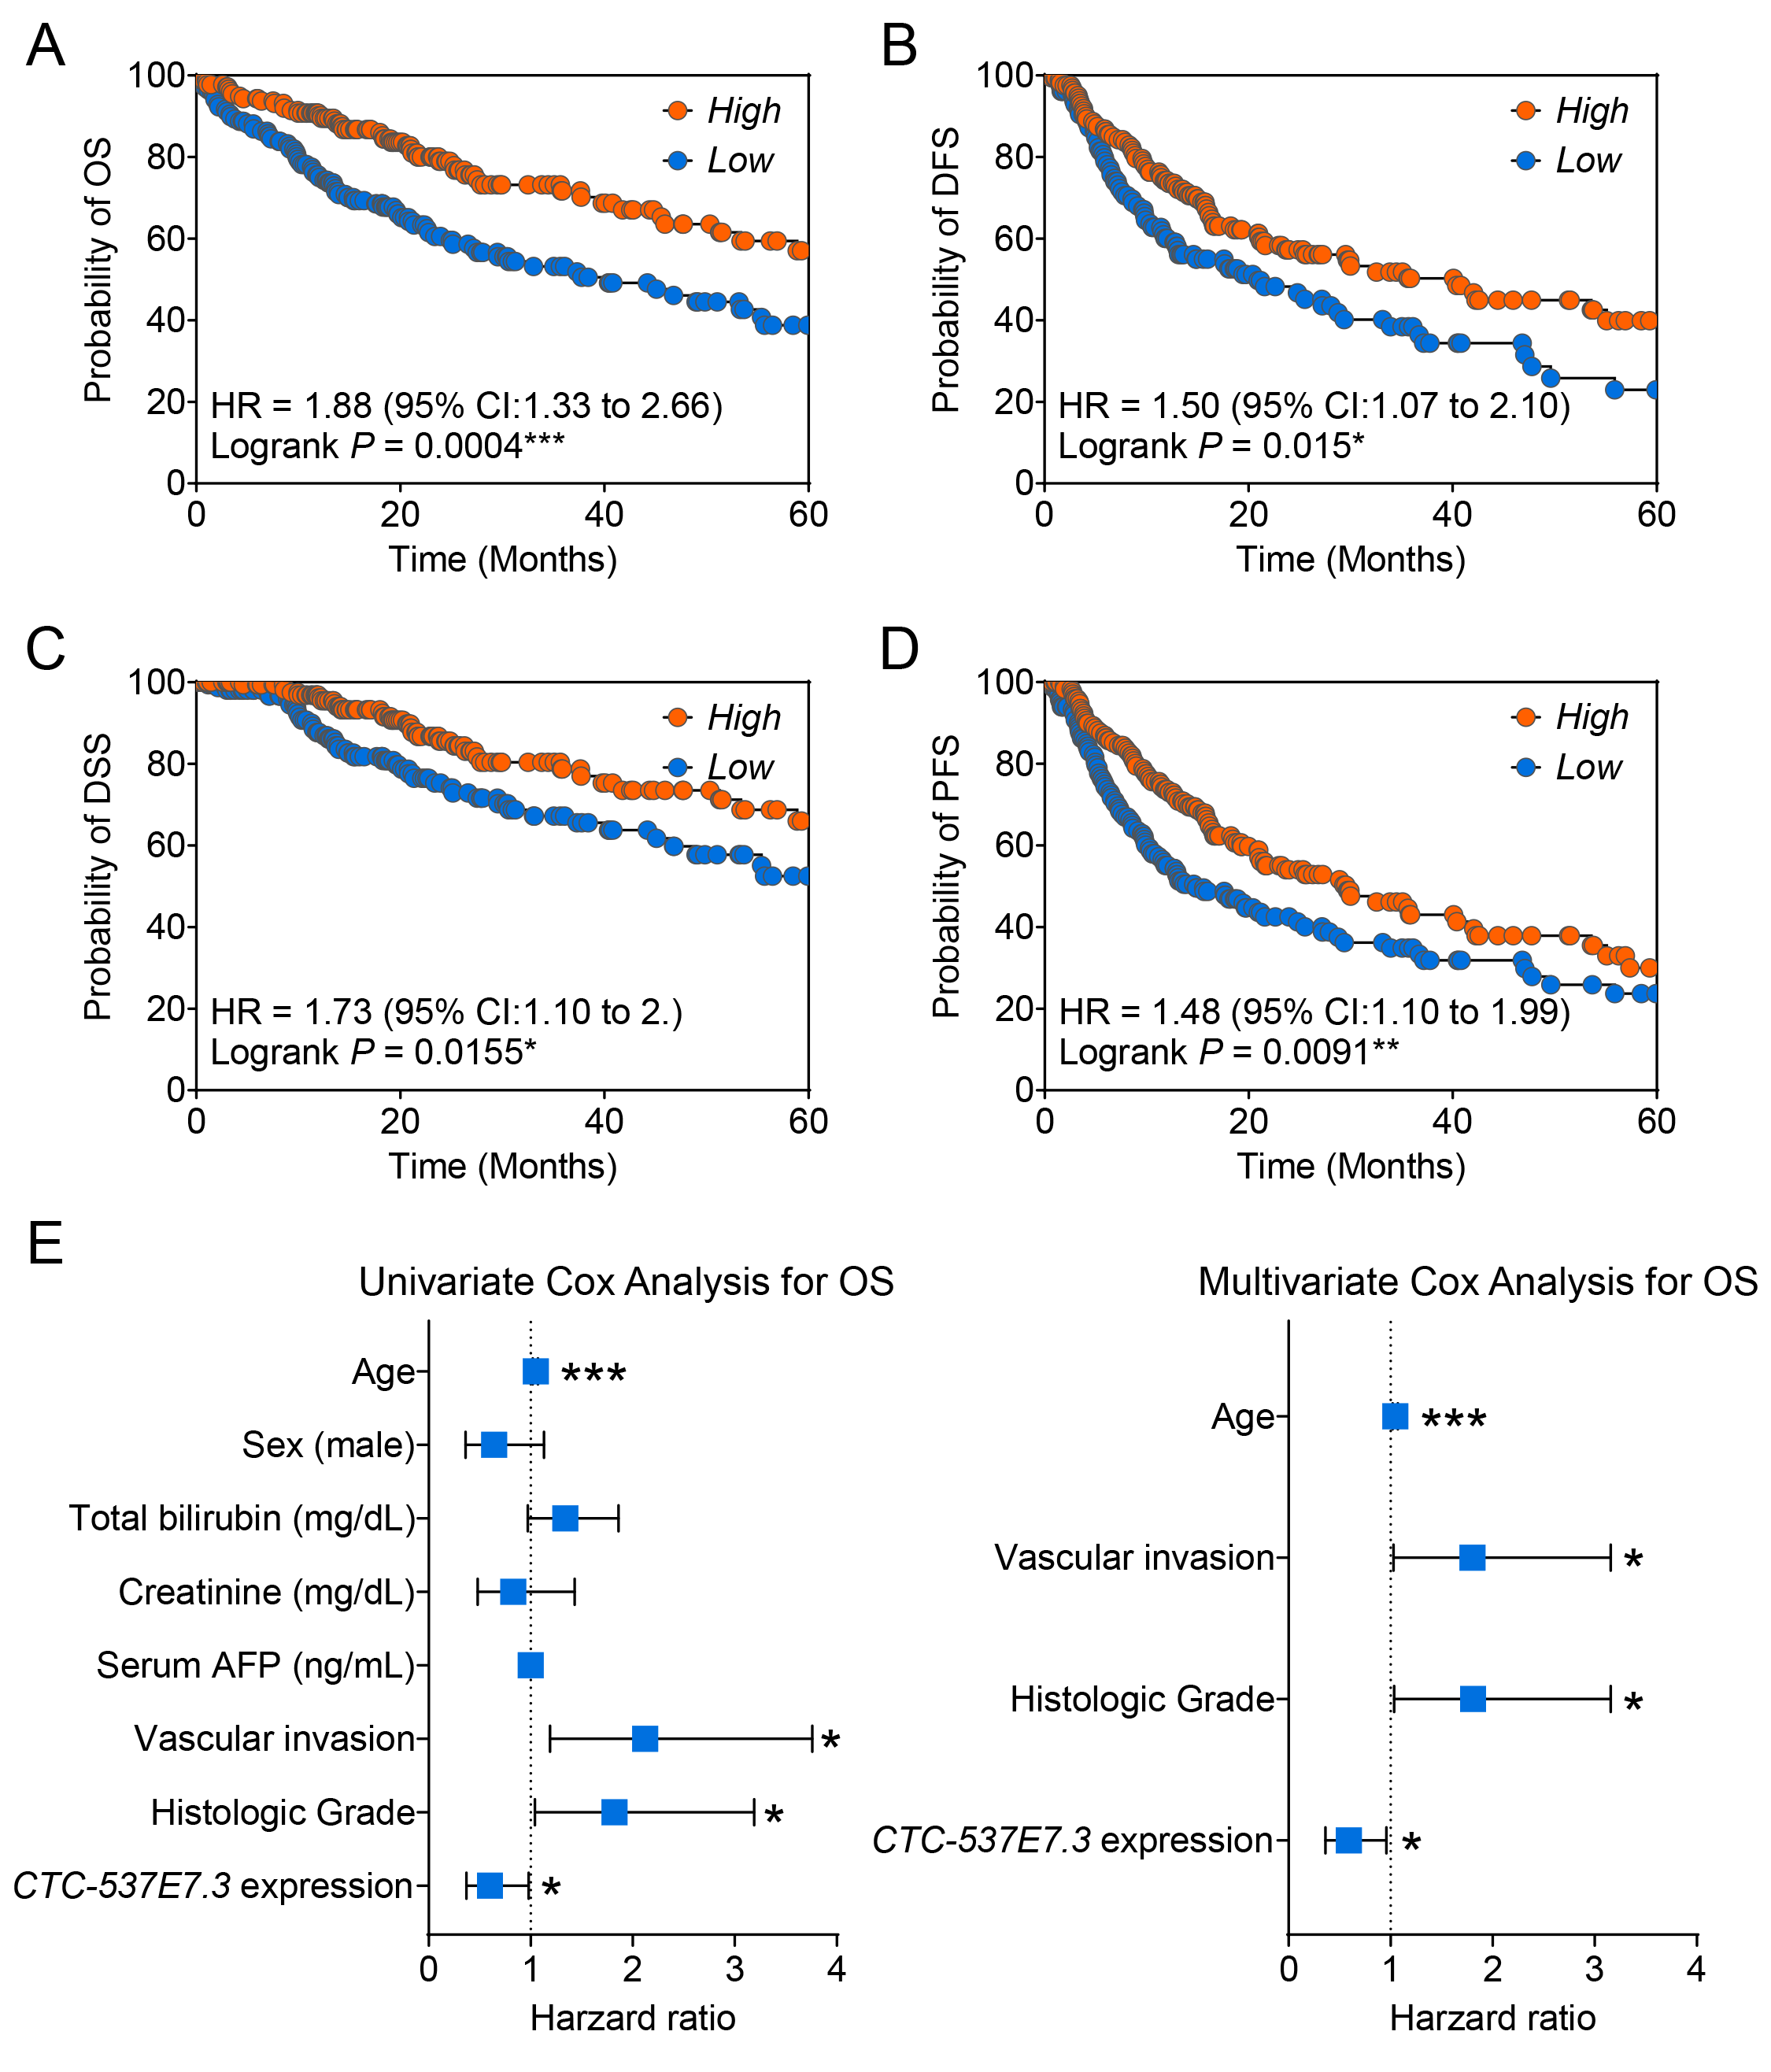
3.2. Prognostic Relevance of CTC-537E7.3 in Patients with HCC

Kaplan–Meier survival analyses were conducted using the TCGA_LIHC cohort to evaluate the correlation between CTC-537E7.3 expression and patient outcomes. The median expression levels were used to stratify the patients into high- and low-expression groups. Notably, low CTC-537E7.3 expression exhibited a significant association with poor outcomes across multiple endpoints. A marked reduction in the OS was observed in the low-expression group (hazard ratio [HR] = 1.88, p = 0.0004; Figure 2A), indicating a higher risk of death among patients with diminished CTC-537E7.3 levels. The DFS in this group was also shorter (HR = 1.50, * p = 0.015; Figure 2B), indicating an increased likelihood of early recurrence. Furthermore, low CTC-537E7.3 expression was also associated with poorer DSS (HR = 1.73, * p = 0.0155; Figure 2C) and PFS (HR = 1.48, ** p = 0.0091; Figure 2D), underscoring its potential as a broad indicator of tumor aggressiveness.
To determine whether the prognostic effect of CTC-537E7.3 is independent of major clinicopathological factors, we next performed comprehensive Cox regression modeling in the TCGA-LIHC cohort (n = 188). Univariate analysis confirmed that low CTC-537E7.3 expression was associated with shorter OS, DFS, and PFS. Similar trends were observed for DFS (adjusted HR = 0.76, p = 0.082) and PFS (adjusted HR = 0.75, p = 0.062), whereas an effect on DSS did not reach statistical significance (Supplementary Table S1). Importantly, after adjustment for vascular invasion, histologic grade, age, and other covariates, CTC-537E7.3 remained an independent protective factor for OS (multivariate HR = 0.59, 95% CI 0.36–0.96, * p = 0.033) (Figure 2E).
Although propensity-score matching was considered, including multiple clinical variables markedly reduced the evaluable sample size and statistical power; the full-cohort multivariate approach thus provides a more robust and clinically representative assessment. Collectively, these analyses reinforce CTC-537E7.3 as an independent, favorable prognostic biomarker in HCC, even after accounting for established risk factors.

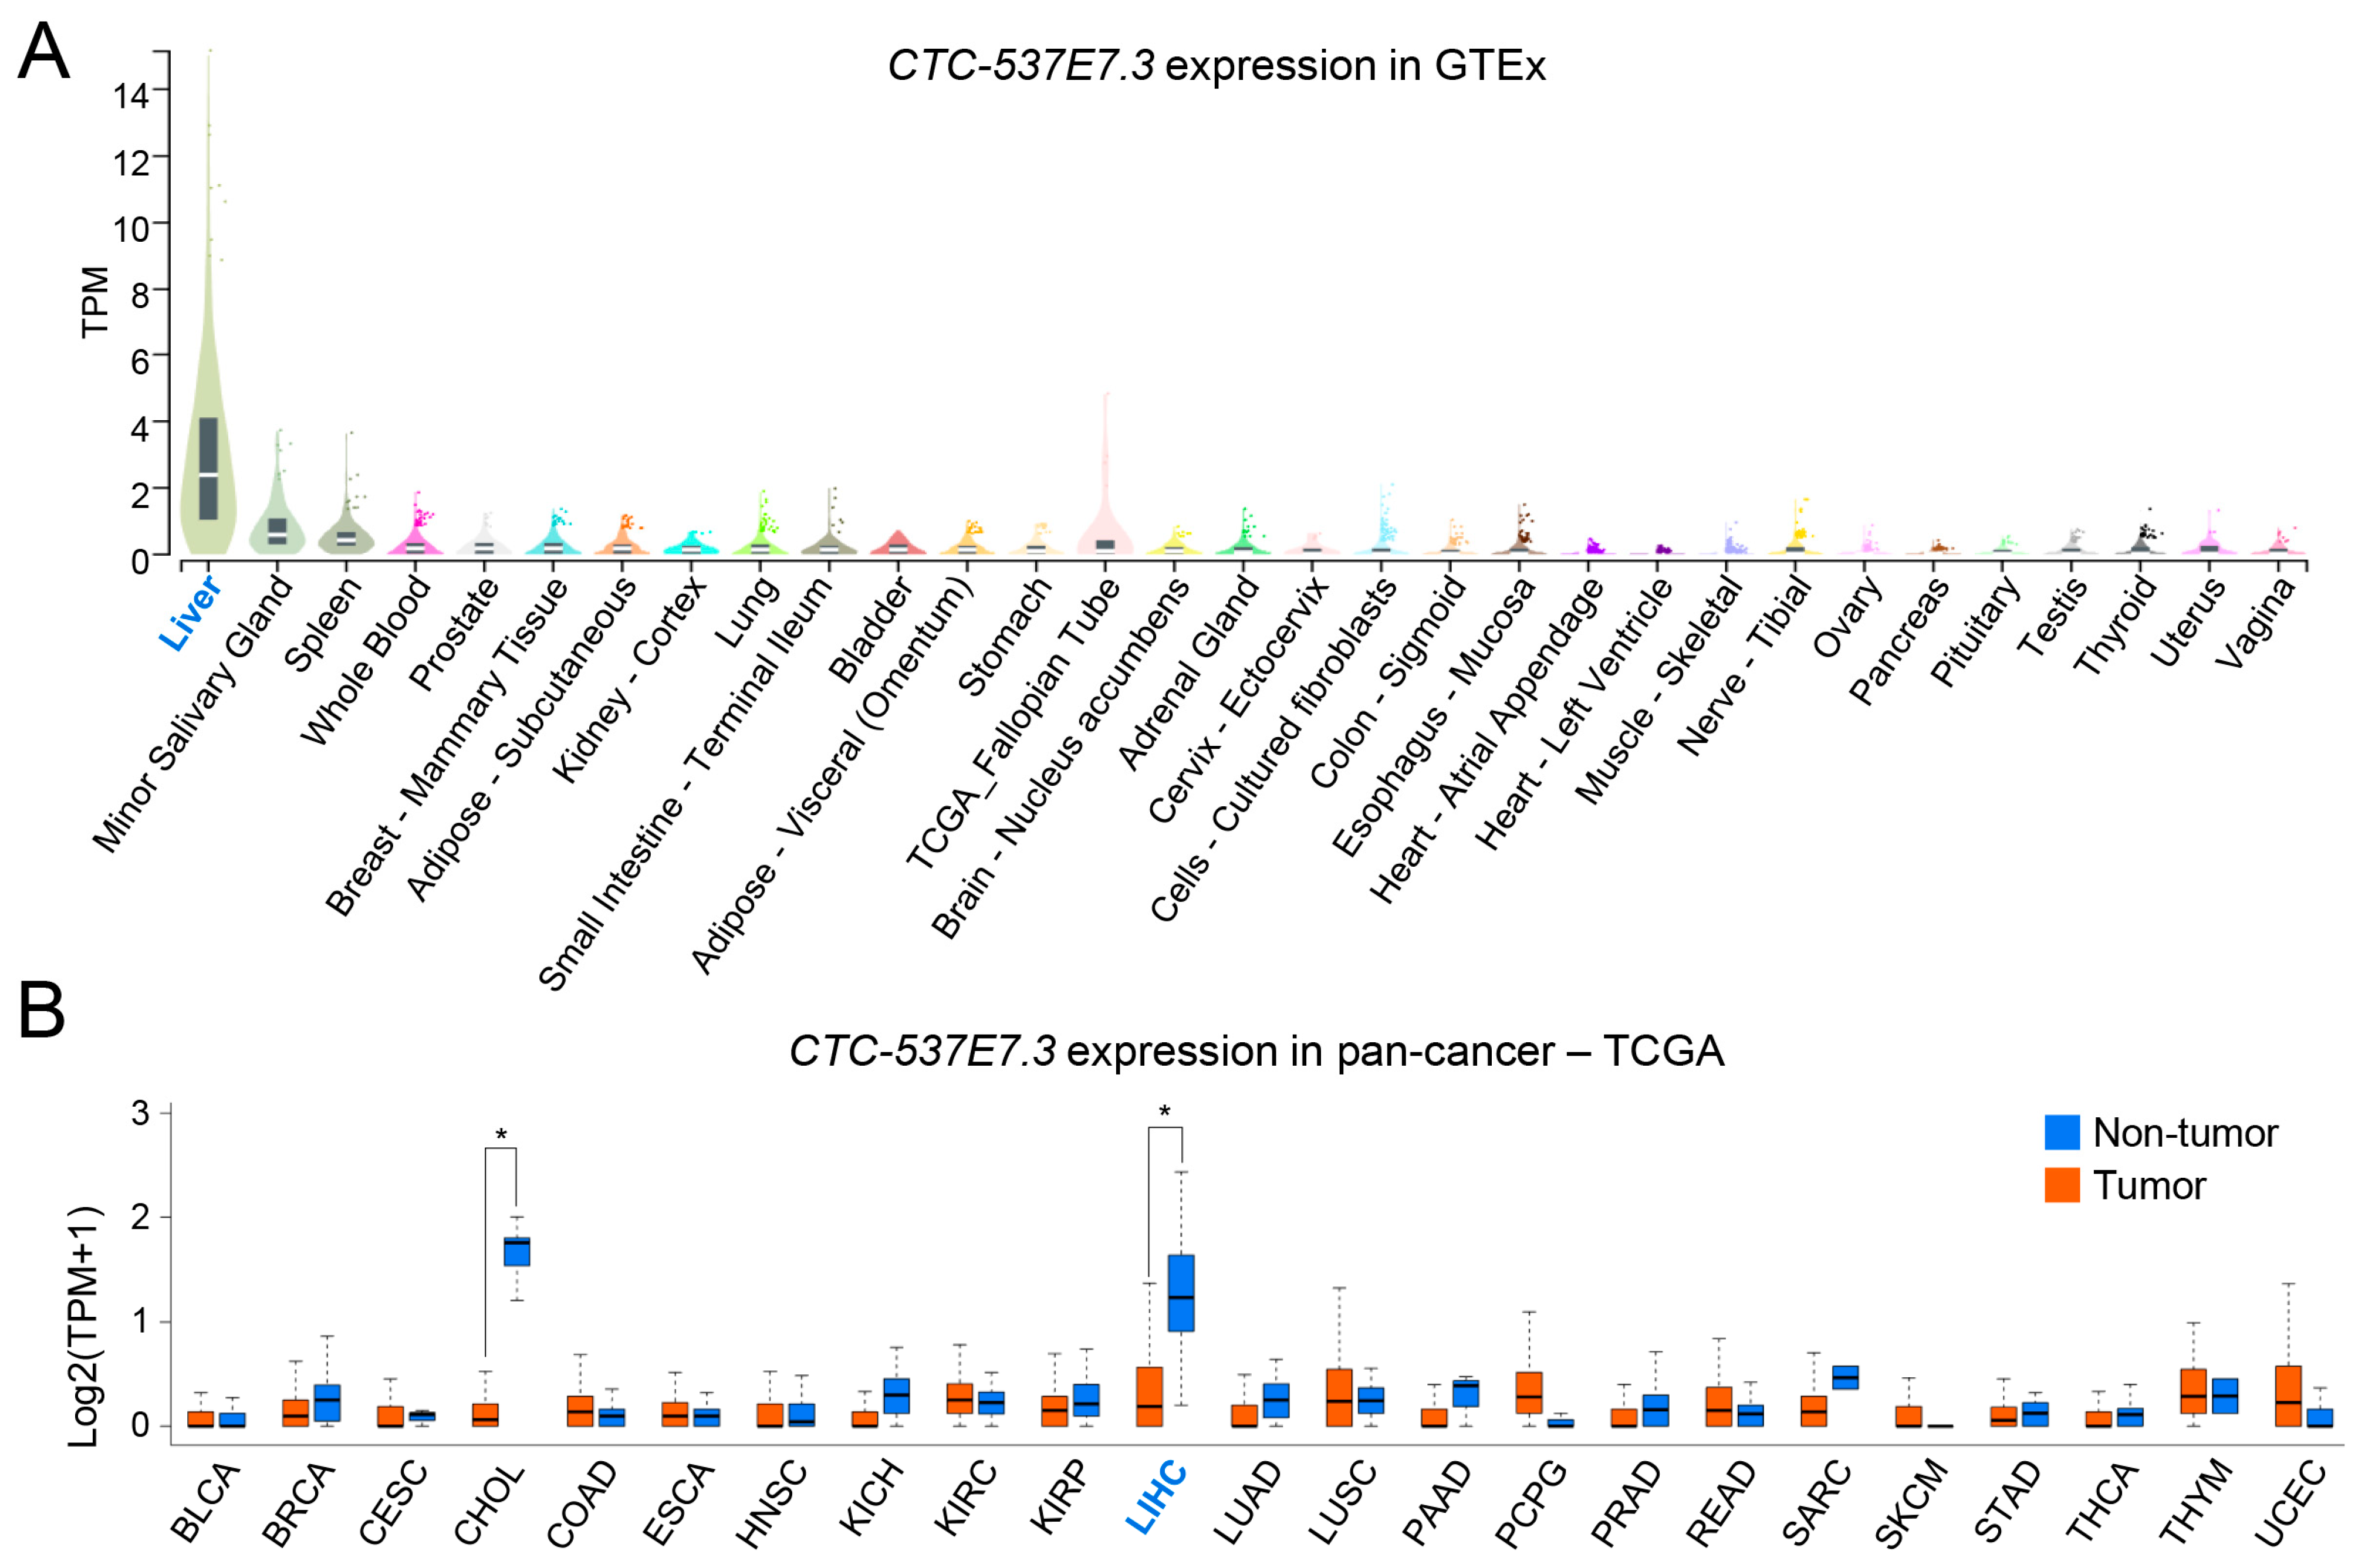
3.3. Tissue Specificity of CTC-537E7.3 in Liver and Cancer Contexts

Several lncRNAs, even those with relatively low basal expression, exhibit distinct tissue-specific patterns [26]. Therefore, data from the GTEx project were analyzed to determine whether CTC-537E7.3 exhibits a similar trend. Notably, the CTC-537E7.3 expression in the liver was elevated; in contrast, its expression was minimal or undetectable in other organs (Figure 3A). This pronounced specificity indicates that CTC-537E7.3 is predominantly associated with the liver under physiological conditions. A pan-cancer analysis was conducted using TCGA data from 23 types of cancer. Consistent with the GTEx findings, CTC-537E7.3 expression in LIHC and cholangiocarcinoma (CHOL) was significantly downregulated compared with that in their respective NT counterparts (Figure 3B). Notably, CTC-537E7.3 expression was negligible in the T and adjacent NT tissues in other types of malignancies. Collectively, these results underscore the strong liver specificity of CTC-537E7.3, emphasizing its potential value as a biomarker for the detection of liver cancer, given the marked difference in its expression in LIHC and CHOL compared with that in the NT liver tissues.

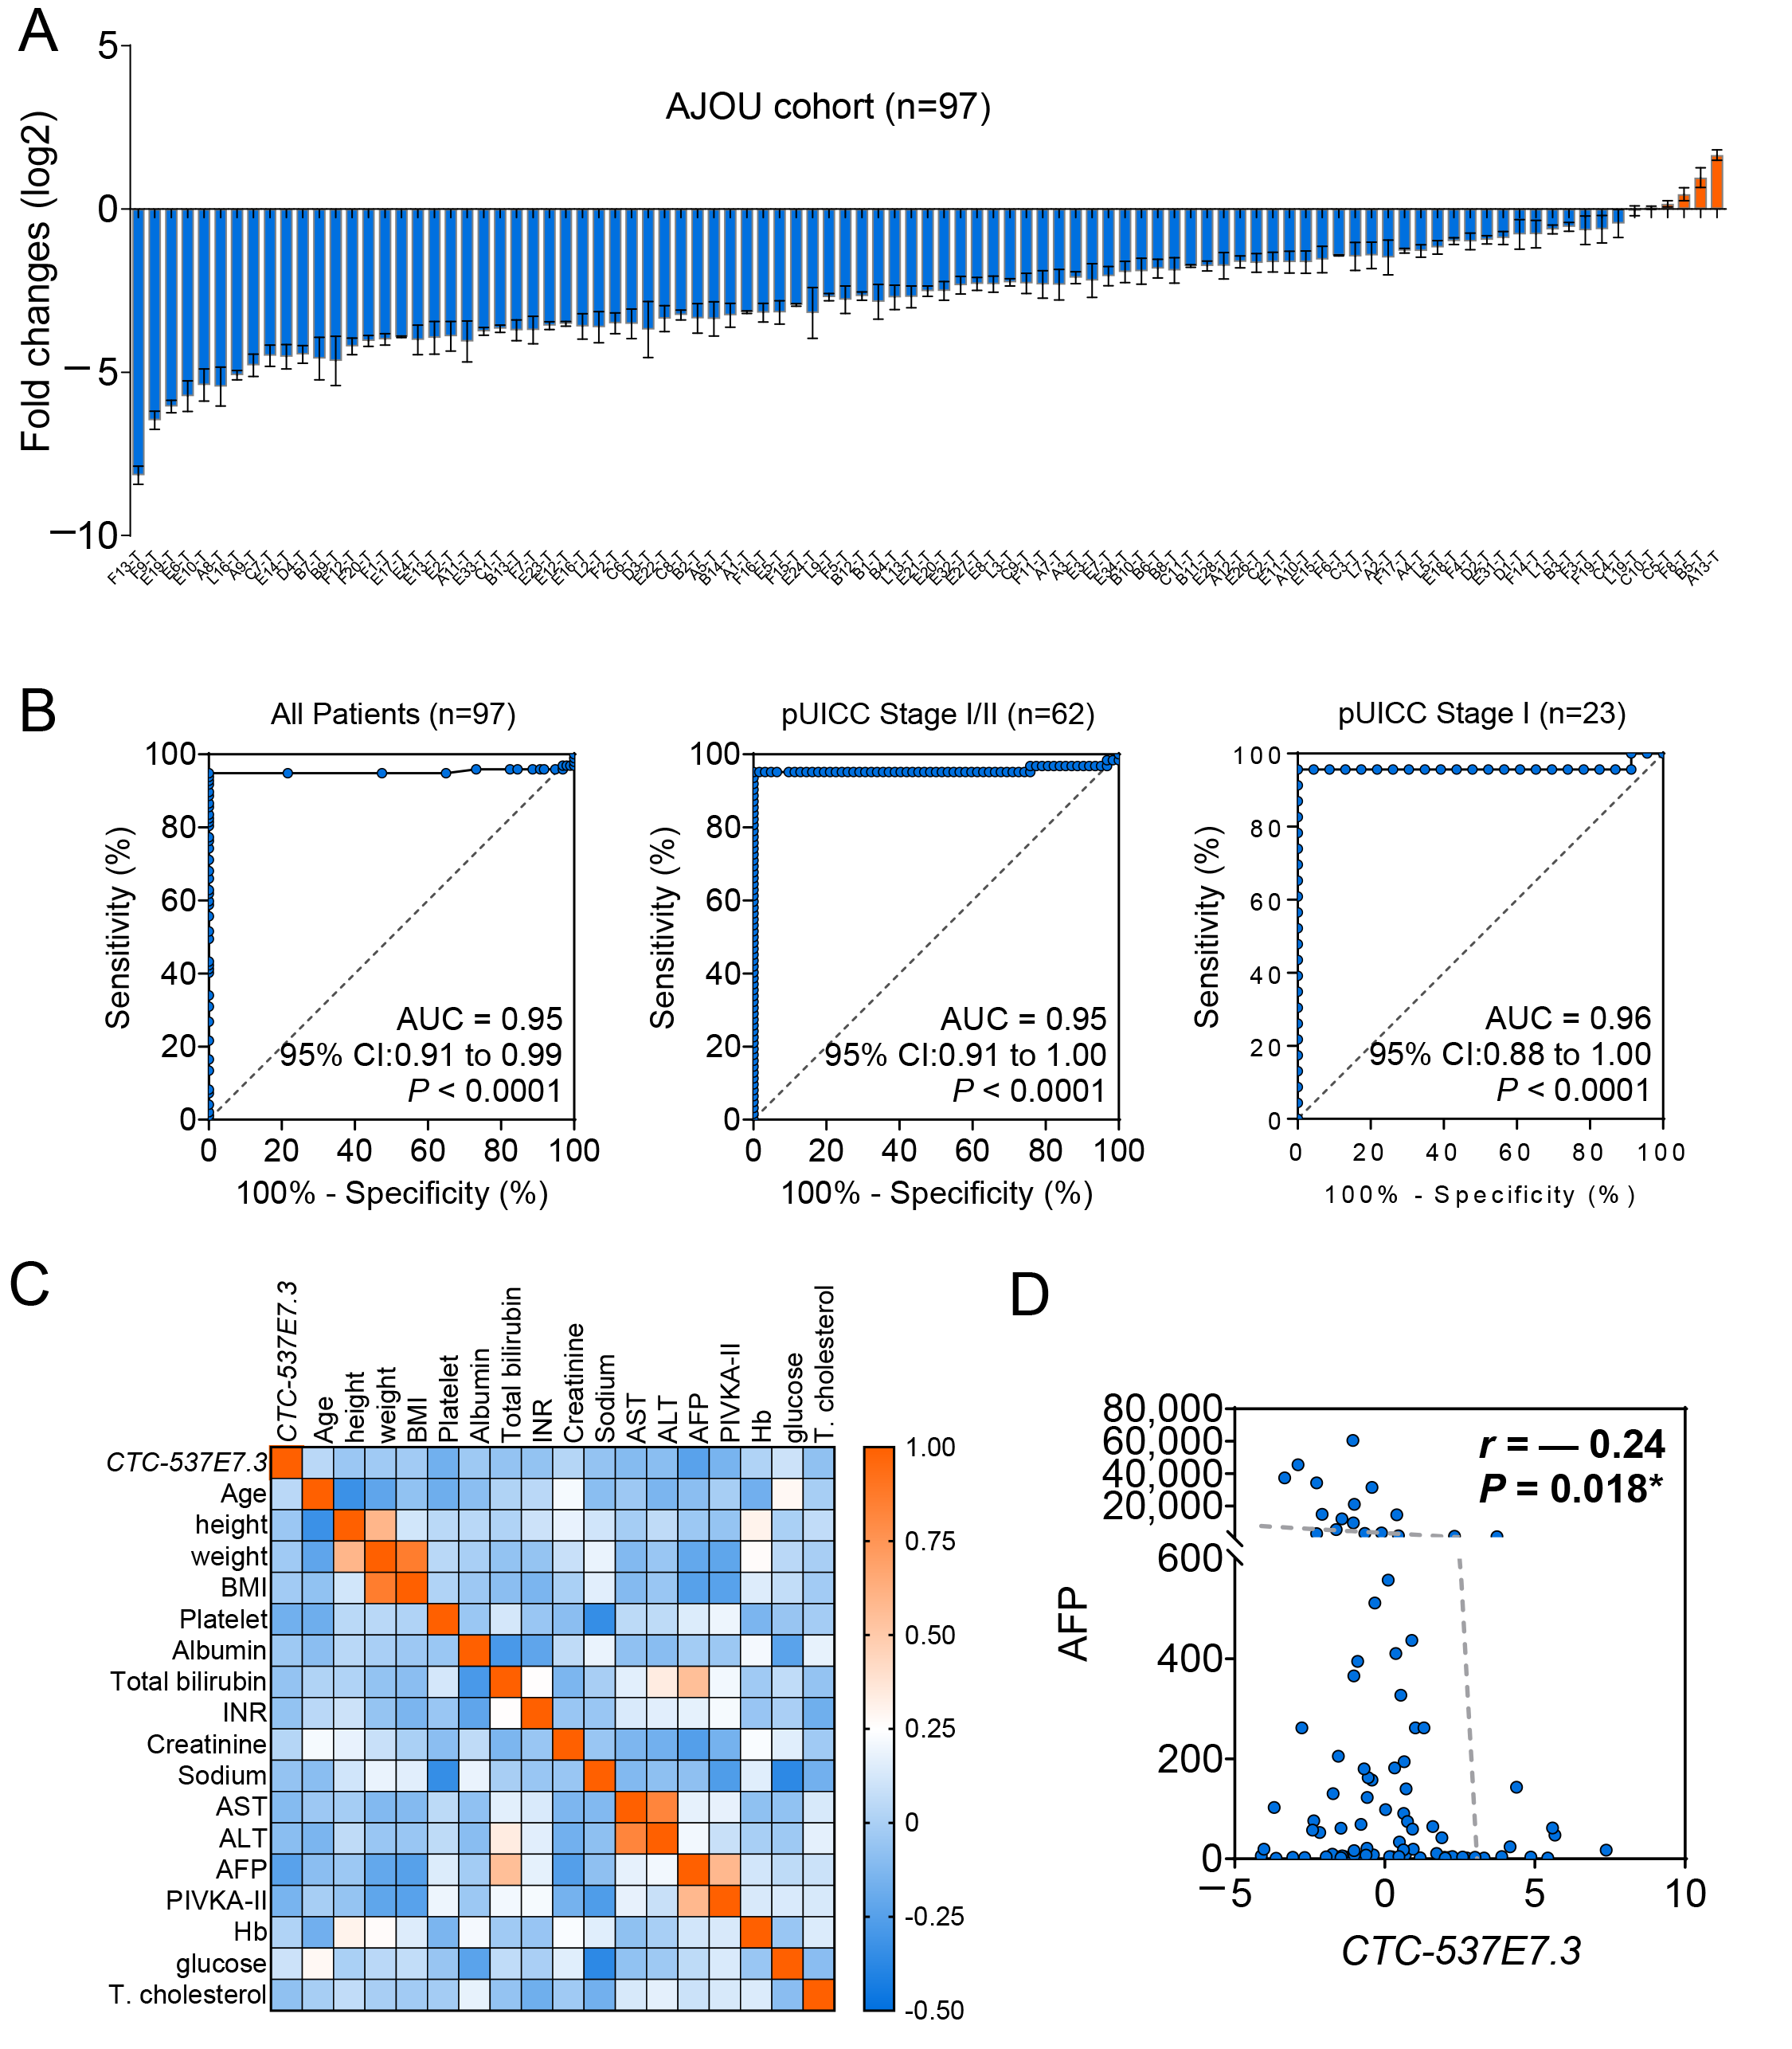
3.4. Validation of CTC-537E7.3 as a Diagnostic Biomarker in Patients with HCC

Given the pronounced tissue specificity and consistent downregulation in HCC, the diagnostic utility of CTC-537E7.3 was evaluated in a clinical cohort. qRT-PCR analysis was conducted using 97 matched pairs of T and NT liver tissue samples. A significant reduction in CTC-537E7.3 expression was observed in 91 of the 97 cases (95%) (*** p <0.0001), confirming its recurrent loss in T tissues (Figure 4A). ROC curve analysis conducted to further assess the diagnostic performance of CTC-537E7.3 demonstrated its strong ability to distinguish HCC from NT tissues, yielding an AUC of 0.95 (95% CI: 0.91–0.99, *** p < 0.0001). Notably, CTC-537E7.3 retained this diagnostic power even for the detection of early-stage HCC, achieving AUCs of 0.95 (95% CI: 0.91–1.00, *** p < 0.0001) and 0.96 (95% CI: 0.88–1.00, *** p < 0.0001) in patients with pUICC stage I/II disease (n = 62) and those with pUICC stage I disease (n = 23), respectively (Figure 4B). These findings are consistent with those of previous ROC analyses conducted using the TCGA_LIHC, GSE77314, and GSE124535 datasets, reinforcing the robustness of CTC-537E7.3 as a diagnostic biomarker across independent cohorts. A correlation heatmap analysis was conducted to examine the association between CTC-537E7.3 expression and various clinical parameters to determine its clinical relevance (Figure 4C). The heatmap revealed a general trend of negative correlation, with the darker blue shading indicating a stronger negative association. Notably, CTC-537E7.3 expression exhibited a statistically significant correlation with serum AFP levels only (r = −0.24, * p = 0.018). The levels of AFP, a widely used biomarker for HCC, increase in response to liver damage and are particularly elevated in patients with HCC. However, given the limitations of AFP as a stand-alone diagnostic marker, the findings of the present study suggest that CTC-537E7.3 may serve as a complementary biomarker to enhance the accuracy of the diagnosis of HCC and improve patient stratification (Figure 4D). The combination of CTC-537E7.3 and AFP may represent an improved strategy for the detection of early-stage HCC and more precise disease classification.

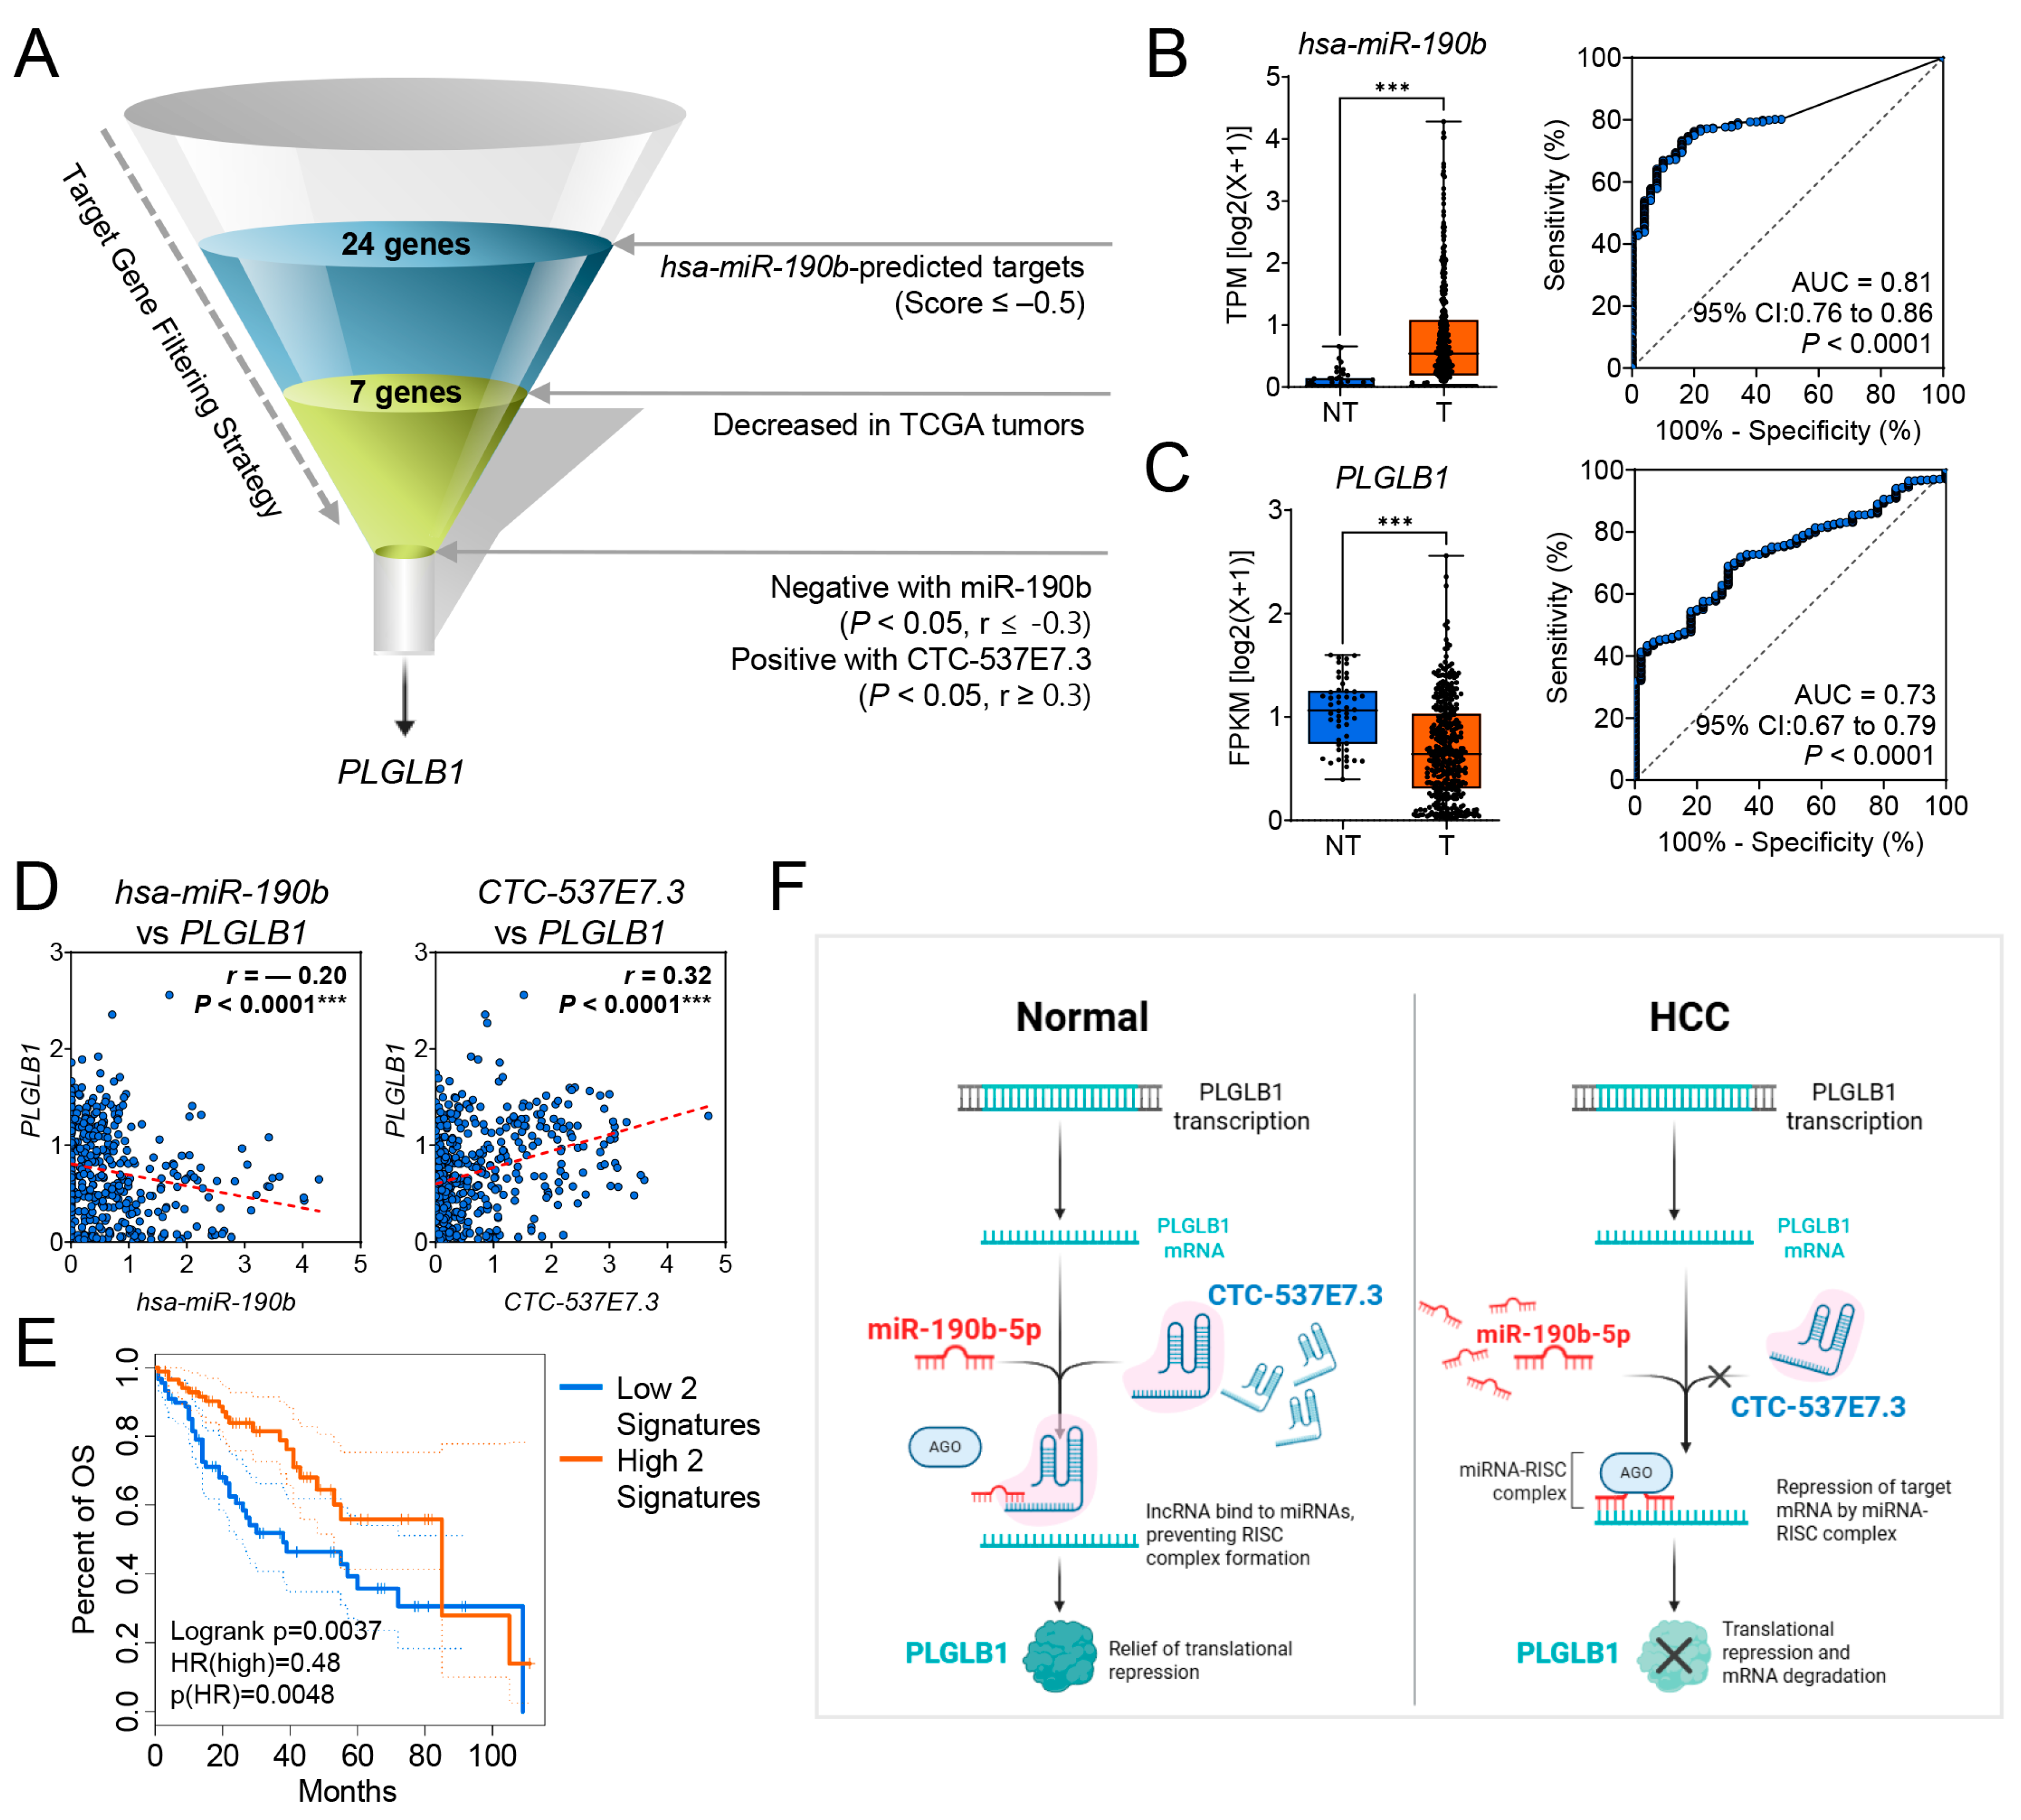
3.5. CTC-537E7.3 Acts as a ceRNA That Relieves miR-190b-5p-Mediated Repression of PLGLB1 in HCC

lncRNAs are well known to regulate gene expression by sequestering miRNAs within ceRNA networks [27]. To select the most biologically relevant miRNA interactor for CTC-537E7.3, we first extracted the top 10 miRNAs with the highest target scores from miRDB and cross-referenced their expression in the TCGA-LIHC cohort using the ENCORI Pan-Cancer platform (Figure 5A; Supplementary Table S2). Among these candidates, only miR-190b-5p was significantly over-expressed in tumor versus normal liver (fold change = 8.36, FDR = 1.4 × 10⁻⁹), thereby meeting both in silico affinity and in vivo dysregulation criteria.
Having established miR-190b-5p as the prime candidate, we next evaluated its downstream network components. In HCC, miR-190b-5p was the most abundantly expressed miRNA predicted to bind CTC-537E7.3 (*** p < 0.0001; Figure 5B, left), whereas its top anti-correlated mRNA target, PLGLB1, was markedly down-regulated (*** p < 0.0001; Figure 5C, left; Supplementary Table S3). ROC curves showed good diagnostic accuracy for both miR-190b-5p (AUC ≈ 0.81) and PLGLB1 (AUC ≈ 0.73) (Figure 5B,C, right panels). Pair-wise Pearson correlation analysis revealed a strong inverse correlation between miR-190b-5p and PLGLB1 (r = −0.20, *** p < 0.0001) and a positive correlation between CTC-537E7.3 and PLGLB1 (r = 0.32, *** p < 0.0001; Figure 5D). Collectively, these observations reinforce the notion that CTC-537E7.3 and PLGLB1 constitute a miR-190b-5p–mediated ceRNA pair that reciprocally modulates each other’s expression. Kaplan–Meier analysis stratified patients into a Low-2 signature (concurrent low expression of both CTC-537E7.3 and PLGLB1) and a High-2 signature (concurrent high expression of both transcripts). The High-2 group experienced significantly better overall survival than the Low-2 group (HR = 0.48, 95% CI 0.29–0.80; log-rank *** p = 0.0048; Figure 5E; Supplementary Figure S2), underscoring their combined prognostic value.
Collectively, these observations support a mechanistic model in which abundant CTC-537E7.3 in normal hepatocytes binds miR-190b-5p, preventing RISC assembly on PLGLB1 transcripts and permitting translation. In HCC, reduced CTC-537E7.3 releases miR-190b-5p, enhancing RISC-mediated repression and degradation of PLGLB1 (Figure 5F).

4. Discussion

lncRNAs, often exceeding 200 nucleotides and lacking coding capacity, have emerged as pivotal regulators in the field of oncology, reflecting a consensus shift that recognizes these transcripts as active participants in gene regulation rather than merely transcriptional noise [8,28]. The majority of lncRNAs comprise intricate secondary and tertiary structures that enable the formation of ribonucleoprotein complexes that modulate transcription, translation, and epigenetic landscapes [29].
Several studies have identified multiple dysregulated lncRNAs with oncogenic or tumor-suppressive functions that contribute to tumor progression in patients with liver cancer. TUC339, a liver-specific lncRNA notable for its enrichment in extracellular vesicles (EVs), has demonstrated the selective packaging and secretion of lncRNAs to influence macrophage polarization and distant metastatic niches [30]. These findings underscore the broad potential of lncRNAs to serve as diagnostic and prognostic biomarkers given their tissue specificity and stability in biofluids [31]. Although AFP often fails to detect early-stage HCC [32], EV lncRNAs outperform or complement traditional markers.
The present study focuses on CTC-537E7.3, an intergenic lncRNA located on chromosome 5q13.1 that has received little attention prior to high-throughput analyses indicating its aberrant expression in HCC. The present study demonstrates the downregulation of CTC-537E7.3 in T tissue samples across independent cohorts and its strong correlation with adverse clinicopathological features. Furthermore, the present study demonstrates that CTC-537E7.3 may serve as an effective biomarker for distinguishing HCC from NT liver tissue. In our biopsy cohort, qRT-PCR quantification of CTC-537E7.3 achieved an AUC > 0.95—even in stage I disease—surpassing the routinely used histological markers HepPar-1, arginase-1, and glypican-3 [33,34]. Importantly, the transcript’s performance remained robust when combined with these classical markers, suggesting that CTC-537E7.3 can complement rather than replace histological assessment while providing fully quantitative, highly reproducible read-outs.
Further clinical evaluation revealed associations with poorer patient outcomes, indicating that CTC-537E7.3 could distinguish individuals at a higher risk of disease progression, thereby serving as a prognostic marker. These findings established patterns observed in other tumor-suppressive lncRNAs, underscoring that CTC-537E7.3 may help regulate key oncogenic pathways in the liver. Additionally, our ceRNA analysis indicates that CTC-537E7.3 acts as a sponge for the oncogenic miR-190b-5p, thereby leading to repression of PLGLB1; perturbation of this axis may enhance PLGLB1 expression and drive tumor progression.
Advances in the field of lncRNA-based diagnostics, particularly for HCC, have emphasized the feasibility of incorporating new biomarkers alongside existing standards, such as AFP. For instance, lncRNA assays can facilitate early detection of HCC in at-risk populations or refine risk stratification after curative treatment [35,36]. Establishing standardized protocols for measuring CTC-537E7.3 in routine practice may facilitate the integration of lncRNA profiles into current surveillance strategies.
From a translational standpoint, the tumor-specific downregulation and predictive capacity of CTC-537E7.3 could potentially aid in disease monitoring and stratification of patients for surveillance, especially if future work identifies a robust detection platform for clinical application. Collectively, the findings of the present study indicate that CTC-537E7.3 may serve as a potentially meaningful biomarker for HCC and underscore the broader concept that lncRNAs, by virtue of their tissue specificity and regulatory capacity, may elucidate tumor biology and enhance diagnostic strategies.

5. Conclusions

In summary, the present study reveals that CTC-537E7.3 is a promising liver-specific lncRNA biomarker that may aid in the early detection and prognostication of HCC. The downregulation of CTC-537E7.3 in tumor tissues, coupled with its strong discriminatory power in differentiating HCC from NT liver samples, underscores its diagnostic utility. Our results also revealed a putative CTC-537E7.3/miR-190b-5p/PLGLB1 ceRNA circuit, which may contribute to tumor progression in HCC. The significant association observed between low CTC-537E7.3 expression and poor survival outcomes highlights its prognostic value. Future studies must be conducted in the future to clarify the underlying mechanisms and validate the clinical applicability of CTC-537E7.3. Nevertheless, CTC-537E7.3 broadens the spectrum of lncRNA-based approaches, offering a tangible step toward more precise management of HCC.

Supplementary Materials

The following supporting information can be downloaded at: https://www.mdpi.com/article/10.3390/cimb47070563/s1.

Author Contributions

H.S.K.: Bioinformatics analysis, manuscript writing, financial support; S.H.J.: experiments, bioinformatics analysis, manuscript writing; G.O.B.: experiments; M.G.Y.: data assembly; J.S.: data assembly; J.E.H.: data assembly, data acquisition; S.S.K.: data assembly, financial support; J.Y.C.: financial support; and J.W.E.: project administration, data assembly, manuscript writing, bioinformatics analysis, supervision, editing, and financial support. All authors have read and agreed to the published version of the manuscript.

Funding

This work was supported by grants from the Korea Health Technology R&D Project through the Korea Health Industry Development Institute, funded by the Ministry of Health and Welfare, Republic of Korea (HR21C1003); the Bio and Medical Technology Development Program of the National Research Foundation of Korea (NRF) (RS-2022-NR070489 and RS-2023-00210847); the Basic Science Research Program through the National Research Foundation of Korea (NRF), funded by the Ministry of Education (RS-2024-00361613); and the Commercialization Promotion Agency for R&D Outcomes (COMPA), funded by the Ministry of Science and ICT (RS-2024-00422549).

Institutional Review Board Statement

All experiments were performed in accordance with the Declaration of Helsinki, and the study was approved by the Institutional Review Board of Ajou University Hospital (AJOUIRB-KSP-2019-417 on 7 November 2019, AJOUIRB-EX-2022-389 on 4 October 2022 and AJOUIRB-EX-2024-332 on 8 July 2024).

Informed Consent Statement

Human biospecimens used in this study were obtained from the Ajou Human Bio-Resource Bank, and their use was approved by the IRB of Ajou University Hospital with a waiver of informed consent in accordance with institutional and ethical guidelines.

Data Availability Statement

The data supporting the findings of this study are available from the corresponding author upon reasonable request.

Acknowledgments

The biospecimens and data used in this study were provided by the Biobank of the Ajou University Hospital, a member of the Korea Biobank Network. We would also like to thank all the members of MOAGEN (Daejeon, South Korea) for their assistance and guidance with the bioinformatics analysis. ChatGPT (version 3o) was used for error checking and language refinement during the preparation of the manuscript.

Conflicts of Interest

The authors declare no conflicts of interest. The funders had no role in the design of the study, in the collection, analyses, or interpretation of data, in the writing of the manuscript, or in the decision to publish the results.

References

  1. Vogel, A.; Meyer, T.; Sapisochin, G.; Salem, R.; Saborowski, A. Hepatocellular carcinoma. Lancet 2022, 400, 1345–1362. [Google Scholar] [CrossRef] [PubMed]
  2. Bray, F.; Laversanne, M.; Sung, H.; Ferlay, J.; Siegel, R.L.; Soerjomataram, I.; Jemal, A. Global cancer statistics 2022: GLOBOCAN estimates of incidence and mortality worldwide for 36 cancers in 185 countries. CA Cancer J. Clin. 2024, 74, 229–263. [Google Scholar] [CrossRef] [PubMed]
  3. Huang, D.Q.; Mathurin, P.; Cortez-Pinto, H.; Loomba, R. Global epidemiology of alcohol-associated cirrhosis and HCC: Trends, projections and risk factors. Nat. Rev. Gastroenterol. Hepatol. 2023, 20, 37–49. [Google Scholar] [CrossRef] [PubMed]
  4. Samant, H.; Amiri, H.S.; Zibari, G.B. Addressing the worldwide hepatocellular carcinoma: Epidemiology, prevention and management. J. Gastrointest. Oncol. 2021, 12, S361–S373. [Google Scholar] [CrossRef] [PubMed]
  5. Kobeissy, A.; Merza, N.; Al-Hillan, A.; Boujemaa, S.; Ahmed, Z.; Nawras, M.; Albaaj, M.; Dahiya, D.S.; Alastal, Y.; Hassan, M. Protein Induced by Vitamin K Absence or Antagonist-II Versus Alpha-Fetoprotein in the Diagnosis of Hepatocellular Carcinoma: A Systematic Review with Meta-Analysis. J. Clin. Med. Res. 2023, 15, 343–359. [Google Scholar] [CrossRef] [PubMed]
  6. Kudo, M. Urgent Global Need for PIVKA-II and AFP-L3 Measurements for Surveillance and Management of Hepatocellular Carcinoma. Liver Cancer 2024, 13, 113–118. [Google Scholar] [CrossRef] [PubMed]
  7. Norman, J.S.; Li, P.J.; Kotwani, P.; Shui, A.M.; Yao, F.; Mehta, N. AFP-L3 and DCP strongly predict early hepatocellular carcinoma recurrence after liver transplantation. J. Hepatol. 2023, 79, 1469–1477. [Google Scholar] [CrossRef] [PubMed]
  8. Mattick, J.S.; Amaral, P.P.; Carninci, P.; Carpenter, S.; Chang, H.Y.; Chen, L.L.; Chen, R.; Dean, C.; Dinger, M.E.; Fitzgerald, K.A.; et al. Long non-coding RNAs: Definitions, functions, challenges and recommendations. Nat. Rev. Mol. Cell Biol. 2023, 24, 430–447. [Google Scholar] [CrossRef] [PubMed]
  9. Yarmishyn, A.A.; Kurochkin, I.V. Long noncoding RNAs: A potential novel class of cancer biomarkers. Front. Genet. 2015, 6, 145. [Google Scholar] [CrossRef] [PubMed]
  10. Gupta, R.A.; Shah, N.; Wang, K.C.; Kim, J.; Horlings, H.M.; Wong, D.J.; Tsai, M.C.; Hung, T.; Argani, P.; Rinn, J.L.; et al. Long non-coding RNA HOTAIR reprograms chromatin state to promote cancer metastasis. Nature 2010, 464, 1071–1076. [Google Scholar] [CrossRef] [PubMed]
  11. Rinn, J.L.; Kertesz, M.; Wang, J.K.; Squazzo, S.L.; Xu, X.; Brugmann, S.A.; Goodnough, L.H.; Helms, J.A.; Farnham, P.J.; Segal, E.; et al. Functional demarcation of active and silent chromatin domains in human HOX loci by noncoding RNAs. Cell 2007, 129, 1311–1323. [Google Scholar] [CrossRef] [PubMed]
  12. Feng, J.; Bi, C.; Clark, B.S.; Mady, R.; Shah, P.; Kohtz, J.D. The Evf-2 noncoding RNA is transcribed from the Dlx-5/6 ultraconserved region and functions as a Dlx-2 transcriptional coactivator. Genes Dev. 2006, 20, 1470–1484. [Google Scholar] [CrossRef] [PubMed]
  13. Zhang, X.; Zhou, Y.; Chen, S.; Li, W.; Chen, W.; Gu, W. LncRNA MACC1-AS1 sponges multiple miRNAs and RNA-binding protein PTBP1. Oncogenesis 2019, 8, 73. [Google Scholar] [CrossRef] [PubMed]
  14. Mouhou, E.; Genty, F.; El M’selmi, W.; Chouali, H.; Zagury, J.F.; Le Clerc, S.; Proudhon, C.; Noirel, J. High tissue specificity of lncRNAs maximises the prediction of tissue of origin of circulating DNA. Sci. Rep. 2025, 15, 12941. [Google Scholar] [CrossRef] [PubMed]
  15. Samuels, M.; Jones, W.; Towler, B.; Turner, C.; Robinson, S.; Giamas, G. The role of non-coding RNAs in extracellular vesicles in breast cancer and their diagnostic implications. Oncogene 2023, 42, 3017–3034. [Google Scholar] [CrossRef] [PubMed]
  16. Du, L.; Duan, W.; Jiang, X.; Zhao, L.; Li, J.; Wang, R.; Yan, S.; Xie, Y.; Yan, K.; Wang, Q.; et al. Cell-free lncRNA expression signatures in urine serve as novel non-invasive biomarkers for diagnosis and recurrence prediction of bladder cancer. J. Cell Mol. Med. 2018, 22, 2838–2845. [Google Scholar] [CrossRef] [PubMed]
  17. Lemos, A.E.G.; Matos, A.D.R.; Ferreira, L.B.; Gimba, E.R.P. The long non-coding RNA PCA3: An update of its functions and clinical applications as a biomarker in prostate cancer. Oncotarget 2019, 10, 6589–6603. [Google Scholar] [CrossRef] [PubMed]
  18. He, S.; Xu, J.; Chen, M.; Li, J.; Li, S.; Ye, J. A meta-analysis of UCA1 accuracy in the detection of bladder cancer. Expert Rev. Anticancer. Ther. 2024, 24, 447–455. [Google Scholar] [CrossRef] [PubMed]
  19. Kim, S.S.; Baek, G.O.; Ahn, H.R.; Sung, S.; Seo, C.W.; Cho, H.J.; Nam, S.W.; Cheong, J.Y.; Eun, J.W. Serum small extracellular vesicle-derived LINC00853 as a novel diagnostic marker for early hepatocellular carcinoma. Mol. Oncol. 2020, 14, 2646–2659. [Google Scholar] [CrossRef] [PubMed]
  20. Liu, G.; Hou, G.; Li, L.; Li, Y.; Zhou, W.; Liu, L. Potential diagnostic and prognostic marker dimethylglycine dehydrogenase (DMGDH) suppresses hepatocellular carcinoma metastasis in vitro and in vivo. Oncotarget 2016, 7, 32607–32616. [Google Scholar] [CrossRef] [PubMed]
  21. Jiang, Y.; Sun, A.; Zhao, Y.; Ying, W.; Sun, H.; Yang, X.; Xing, B.; Sun, W.; Ren, L.; Hu, B.; et al. Proteomics identifies new therapeutic targets of early-stage hepatocellular carcinoma. Nature 2019, 567, 257–261. [Google Scholar] [CrossRef] [PubMed]
  22. Goldman, M.J.; Craft, B.; Hastie, M.; Repecka, K.; McDade, F.; Kamath, A.; Banerjee, A.; Luo, Y.; Rogers, D.; Brooks, A.N.; et al. Visualizing and interpreting cancer genomics data via the Xena platform. Nat. Biotechnol. 2020, 38, 675–678. [Google Scholar] [CrossRef] [PubMed]
  23. Colaprico, A.; Silva, T.C.; Olsen, C.; Garofano, L.; Cava, C.; Garolini, D.; Sabedot, T.S.; Malta, T.M.; Pagnotta, S.M.; Castiglioni, I.; et al. TCGAbiolinks: An R/Bioconductor package for integrative analysis of TCGA data. Nucleic Acids Res. 2016, 44, e71. [Google Scholar] [CrossRef] [PubMed]
  24. Mounir, M.; Lucchetta, M.; Silva, T.C.; Olsen, C.; Bontempi, G.; Chen, X.; Noushmehr, H.; Colaprico, A.; Papaleo, E. New functionalities in the TCGAbiolinks package for the study and integration of cancer data from GDC and GTEx. PLoS Comput. Biol. 2019, 15, e1006701. [Google Scholar] [CrossRef] [PubMed]
  25. Chen, Y.; Wang, X. miRDB: An online database for prediction of functional microRNA targets. Nucleic Acids Res. 2020, 48, D127–D131. [Google Scholar] [CrossRef] [PubMed]
  26. Tang, Z.; Wu, Y.; Yang, Y.; Yang, Y.T.; Wang, Z.; Yuan, J.; Yang, Y.; Hua, C.; Fan, X.; Niu, G.; et al. Comprehensive analysis of long non-coding RNAs highlights their spatio-temporal expression patterns and evolutional conservation in Sus scrofa. Sci. Rep. 2017, 7, 43166. [Google Scholar] [CrossRef] [PubMed]
  27. Poliseno, L.; Salmena, L.; Zhang, J.; Carver, B.; Haveman, W.J.; Pandolfi, P.P. A coding-independent function of gene and pseudogene mRNAs regulates tumour biology. Nature 2010, 465, 1033–1038. [Google Scholar] [CrossRef] [PubMed]
  28. Chen, L.L.; Kim, V.N. Small and long non-coding RNAs: Past, present, and future. Cell 2024, 187, 6451–6485. [Google Scholar] [CrossRef] [PubMed]
  29. Tauber, H.; Huttelmaier, S.; Kohn, M. POLIII-derived non-coding RNAs acting as scaffolds and decoys. J. Mol. Cell Biol. 2019, 11, 880–885. [Google Scholar] [CrossRef] [PubMed]
  30. Li, X.; Lei, Y.; Wu, M.; Li, N. Regulation of Macrophage Activation and Polarization by HCC-Derived Exosomal lncRNA TUC339. Int. J. Mol. Sci. 2018, 19, 2958. [Google Scholar] [CrossRef] [PubMed]
  31. Lin, Y.; Zhao, W.; Pu, R.; Lv, Z.; Xie, H.; Li, Y.; Zhang, Z. Long non-coding RNAs as diagnostic and prognostic biomarkers for colorectal cancer (Review). Oncol. Lett. 2024, 28, 486. [Google Scholar] [CrossRef] [PubMed]
  32. Qiao, S.S.; Cui, Z.Q.; Gong, L.; Han, H.; Chen, P.C.; Guo, L.M.; Yu, X.; Wei, Y.H.; Ha, S.A.; Kim, J.W.; et al. Simultaneous measurements of serum AFP, GPC-3 and HCCR for diagnosing hepatocellular carcinoma. Hepatogastroenterology 2011, 58, 1718–1724. [Google Scholar] [CrossRef] [PubMed]
  33. Deng, M.; Luo, R.; Chen, L.; Wang, H.; Huang, W.; Song, Q.; Jiang, D.; Xu, L.; Su, J.; Xu, C.; et al. CPZ: A Highly Sensitive Diagnostic Biomarker for the Differentiation Between Hepatocellular Carcinoma and Intrahepatic Cholangiocarcinoma, Particularly in Poorly Differentiated Hepatocellular Carcinoma. Am. J. Surg. Pathol. 2025, 49, 711–729. [Google Scholar] [CrossRef] [PubMed]
  34. Jiang, D.; Zhang, Y.; Wang, Y.; Xu, F.; Liang, J.; Wang, W. Diagnostic accuracy and prognostic significance of Glypican-3 in hepatocellular carcinoma: A systematic review and meta-analysis. Front. Oncol. 2022, 12, 1012418. [Google Scholar] [CrossRef] [PubMed]
  35. Song, J.Y.; Li, X.P.; Qin, X.J.; Zhang, J.D.; Zhao, J.Y.; Wang, R. A fourteen-lncRNA risk score system for prognostic prediction of patients with non-small cell lung cancer. Cancer Biomark. 2020, 29, 493–508. [Google Scholar] [CrossRef] [PubMed]
  36. Huang, R.; Zhou, L.; Chi, Y.; Wu, H.; Shi, L. LncRNA profile study reveals a seven-lncRNA signature predicts the prognosis of patients with colorectal cancer. Biomark. Res. 2020, 8, 8. [Google Scholar] [CrossRef] [PubMed]
Figure 1. Integrative Analysis of Differentially Expressed lncRNAs in HCC Across Multiple Datasets. (A) Flow diagram detailing the methodology used to identify differentially expressed lncRNAs in HCC. (B) Venn diagram illustrating the overlap of significantly differentially expressed lncRNAs across the TCGA_LIHC, GSE77314, and GSE124535 datasets. (C) Box plots (left bar plot of the each dataset) showing the expression levels of CTC-537E7.3 in tumor (T) and non-tumor (NT) liver tissues across TCGA_LIHC, GSE77314, and GSE124535 datasets, demonstrating its significantly downregulation in HCC compared to NT. Receiver operating characteristic (ROC) curves (right ROC curve plot of the each dataset) demonstrate the diagnostic performance of CTC-537E7.3 in distinguishing HCC from non-tumor liver tissues, presenting area under the curve (AUC) values, 95% confidence intervals (CIs), and statistical significance (p-values). (D) Expression levels of CTC-537E7.3 across different stages of liver disease and cancer progression, including normal liver (NL), chronic hepatitis (CH), liver cirrhosis (LC), dysplastic nodules (DN), early HCC (eHCC), and advanced HCC (aHCC), based on the GSE114564 dataset (left panel). The Y-axis represents the expression levels of CTC-537E7.3, while the X-axis denotes different sample groups. Statistical significance between groups is indicated by asterisks (* p < 0.05, ** p < 0.01, *** p < 0.001, **** p < 0.0001).
Cimb 47 00563 g001
Figure 2. Kaplan–Meier survival analyses illustrating the prognostic significance of CTC-537E7.3 expression in HCC patients based on the TCGA_LIHC dataset. (A) Overall survival (OS), (B) disease-free survival (DFS), (C) disease-specific survival (DSS), and (D) progression-free survival (PFS) analyses. Patients were stratified into high- and low-expression groups based on median CTC-537E7.3 expression levels (orange: high expression, blue: low expression). (E) Forest plot summarizing the HRs and 95% CIs obtained from univariate and multivariate Cox proportional-hazards models for overall survival in the TCGA-LIHC cohort. Hazard ratios (HRs), 95% confidence intervals (CIs), and log-rank p-values are presented. Statistically significant differences were determined using the log-rank test (* p < 0.05, ** p < 0.01, *** p < 0.001).
Cimb 47 00563 g002
Figure 3. CTC-537E7.3 Expression in Normal and Cancerous Tissues. (A) CTC-537E7.3 expression across various normal human tissues from the GTEx dataset. The Y-axis represents log2(TPM + 1). (B) Pan-cancer analysis of CTC-537E7.3 expression across 23 cancer types using TCGA data. Significant differences in expression between tumor (tumor, red box) and normal adjacent tissues (non-tumor, blue box) are highlighted for hepatocellular carcinoma (LIHC) and cholangiocarcinoma (CHOL). BLCA, bladder urothelial carcinoma; BRCA, breast invasive carcinoma; CESC, cervical squamous cell carcinoma and endocervical adenocarcinoma; COAD, colon adenocarcinoma; ESCA, esophageal carcinoma; HNSC, head and neck squamous cell carcinoma; KICH, kidney chromophobe; KIRC, kidney renal clear cell carcinoma; KIRP, kidney renal papillary cell carcinoma; LUAD, lung adenocarcinoma; LUSC, lung squamous cell carcinoma; PAAD, pancreatic adenocarcinoma; PCPG, pheochromocytoma and paraganglioma; PRAD, prostate adenocarcinoma; READ, rectum adenocarcinoma; SARC, sarcoma; SKCM, skin cutaneous melanoma; STAD, stomach adenocarcinoma; THCA, thyroid carcinoma; THYM, thymoma; UCEC, uterine corpus endometrial carcinoma. * p < 0.05.
Cimb 47 00563 g003
Figure 4. CTC-537E7.3 Expression and Diagnostic Potential in HCC Patients. (A) qRT-PCR analysis of CTC-537E7.3 expression in paired tumor (T) and adjacent non-tumor (NT) tissues from 97 HCC patients. The X-axis represents each patient’s unique ID and the X-axis indicates the log2 fold change. (B) Receiver operating characteristic (ROC) curves assessing the diagnostic performance of CTC-537E7.3 in distinguishing HCC from non-tumor tissues across all patients (n = 97), early-stage HCC patients (pUICC I/II, n = 62), and stage I HCC patients (pUICC I, n = 23). Area under the curve (AUC) values, 95% confidence intervals (CIs), and P-values are provided. (C) Correlation analysis between CTC-537E7.3 expression and clinical parameters, including AFP levels. (D) Spearman correlation analysis between CTC-537E7.3 expression and serum AFP levels in HCC patients (n = 97). The correlation coefficient (r) and p-value are indicated. Statistical significance was defined as * p < 0.05.
Cimb 47 00563 g004
Figure 5. The CTC-537E7.3–miR-190b-5p–PLGLB1 ceRNA Axis in HCC. (A) Funnel diagram illustrating the step-wise screening strategy used to identify key components of the ceRNA axis. The process filtered miR-190b-5p targets from miRDB, selected for genes with tumor-specific downregulation, and identified PLGLB1 as the single gene showing an inverse correlation with miR-190b-5p and a positive correlation with CTC-537E7.3 in the TCGA_LIHC dataset. (B) Box plot (left) comparing miR-190b-5p expression in non-tumor (NT) and tumor (T) liver tissues, and a receiver operating characteristic (ROC) curve (right) demonstrating its diagnostic performance. (C) Box plot (left) showing PLGLB1 expression in NT versus T tissues, with a corresponding ROC curve (right) illustrating its diagnostic accuracy. For both (B,C), area under the curve (AUC), 95% confidence intervals (CIs), and p-values are provided. (D) Pearson correlation analysis showing the inverse relationship between miR-190b-5p and PLGLB1 (left), and the positive relationship between CTC-537E7.3 and PLGLB1 (right). Correlation coefficients (r) and p-values are indicated. (E) Kaplan–Meier overall survival analysis based on combined expression signatures. Patients were stratified into a concordant low-expression group (concurrent low expression of both CTC-537E7.3 and PLGLB1) and a concordant high-expression group (concurrent high expression of both transcripts). Hazard ratio (HR), 95% CI, and the log-rank p-value are presented. (F) Schematic model of the proposed mechanism. In normal hepatocytes (left), CTC-537E7.3 sponges miR-190b-5p, allowing PLGLB1 translation. In HCC (right), reduced CTC-537E7.3 levels lead to increased miR-190b-5p activity, resulting in the repression and degradation of PLGLB1. Statistical significance between groups is indicated by asterisks (*** p < 0.001).
Cimb 47 00563 g005
Table 1. Clinicopathological characteristic of the patients in Ajou hospital cohort.
VariablesHCC (n = 97)
Age (years), mean ± SD55.7 ± 10.0
Male sex, n (%)74 (76.3%)
Etiology, n (%) 
HBV90 (92.8%)
HCV4 (4.1%)
Alcohol2 (2.1%)
HCV + Alcohol1 (1%)
Cirrhosis, n (%)54 (65.1)
Ascites, n (%)16 (16.3)
BMI24.2 (387)
Platelet, ×109/L179.1 (70.1)
Albumin (g/dL), mean ± SD4.4 (0.7)
Total bilirubin (mg/dL), mean ± SD0.8 (0.9)
INR, mean ± SD1.1 (0.1)
Creatinine (mg/dL)0.9 (0.3)
Sodium, mmol/L115.7 (52.3)
AST, U/L54.3 (105.3)
ALT, U/L42.5 (61.1)
AFP (ng/mL), mean ± SD94.9 (144.8)
PIVKA-II, mAU/mL8925.3 (19,566.8)
Hemoglobin, g/dL14.4 (1.6)
Glucose, mg/dL122.3 (53.6)
Total Cholesterol, mg/dL173.7 (40.4)
pUICC stage, n (%) 
pI24 (24.7)
pII38 (39.2)
pIII24 (24.7)
pIVA7 (7.2)
pIVB3 (3.1)
BCLC stage, n (%) 
024 (24.7)
A53 (54.6)
B8 (8.2)
C9 (9.3)
D2 (2.1)
Vascular invasion, n (%)47 (56)
Metastasis, n (%)22 (22.7)
Recurrence, n (%)38 (39.2)
OS (months), mean ± SD46.0 (24.5)
HCC: hepatocellular carcinoma, SD: standard deviation, HBV: hepatitis B virus, HCV: hepatitis C virus, BMI: body mass index, INR: international normalized ratio, AST: aspartate aminotransferase, ALT: alanine aminotransferase, AFP: alpha-fetoprotein, PIVKA-II: protein induced by vitamin K absence-II, pUICC: pathological union for international cancer control, BCLC: Barcelona clinic liver cancer, OS: overall survival, mAU/mL: milli-arbitrary units per milliliter.
Table 2. The expression of top 10 lncRNAs in HCC Across TCGA and GEO Cohorts.
DatasetRankGene SymbolGene IDp-ValueFold Change (log2)Normal
Expression
Tumor
Expression
TCGA_LIHC1RP11-6B4.1ENSG00000243694.22.86 × 1052−1.7492.6660.917
TCGA_LIHC2CTC-537E7.3ENSG00000248884.12.98 × 1020−1.4022.0280.626
TCGA_LIHC3RP11-789C1.1ENSG00000250266.12.59 × 1011−1.1481.4030.254
TCGA_LIHC4RP11-252E2.2ENSG00000261058.15.17 × 1018−0.9811.4550.474
TCGA_LIHC5RP11-172E9.2ENSG00000230058.14.83 × 108−0.8811.0740.193
TCGA_LIHC6RP11-434D9.1ENSG00000249364.41.87 × 1010−0.8691.6130.744
TCGA_LIHC7RP11-119D9.1ENSG00000251637.53.45 × 1016−0.7771.6930.916
TCGA_LIHC8RP11-513G11.3ENSG00000238097.15.94 × 1015−0.7411.7330.992
TCGA_LIHC9FLJ22763ENSG00000241224.53.59 × 1017−0.6811.1920.511
TCGA_LIHC10RP11-327J17.2ENSG00000259359.11.16 × 1011−0.6391.350.71
GSE773141LINC01093ENSG00000249173.53.08 × 1045−4.6975.2320.535
GSE773142RP11-6B4.1ENSG00000243694.23.14 × 1023−3.0233.8710.848
GSE773143RP11-434D9.1ENSG00000249364.53.74 × 1022−2.5943.5941
GSE773144FLJ22763ENSG00000241224.61.87 × 1022−2.3793.0610.682
GSE773145AC016768.1ENSG00000232451.12.16 × 1022−1.5862.3550.769
GSE773146RP4-568C11.4ENSG00000274173.12.46 × 1017−1.5162.1090.593
GSE773147RP11-439C15.4ENSG00000253764.11.02 × 1022−1.491.6790.19
GSE773148RP11-153K11.3ENSG00000233590.11.99 × 1012−1.4671.9790.512
GSE773149CTC-537E7.3ENSG00000248884.15.63 × 1018−1.4561.7620.306
GSE7731410RP11-789C1.2ENSG00000251061.21.60 × 1014−1.4391.5060.066
GSE1245351RP11-789C1.1ENSG000002502664.30 × 109−1.2321.5550.322
GSE1245352CTC-537E7.3ENSG000002488841.05 × 1011−1.2281.7450.517
GSE1245353RP11-290F20.3ENSG000002243971.09 × 109−1.0962.0340.939
GSE1245354CTC-297N7.9ENSG000002640162.19 × 1010−0.9861.9470.961
GSE1245355RP11-327J17.2ENSG000002593599.98 × 109−0.9781.6930.715
GSE1245356CTB-167B5.2ENSG000002648685.36 × 1010−0.8731.6010.728
GSE1245357RP11-252E2.2ENSG000002610581.71 × 107−0.8221.3440.522
GSE1245358RP11-557H15.4ENSG000002323109.63 × 107−0.7741.4130.639
GSE1245359RP11-863P13.2ENSG000002618163.03 × 105−0.7221.0680.347
GSE12453510RP11-88H9.2ENSG000002314374.12 × 107−0.6361.1350.498
Disclaimer/Publisher’s Note: The statements, opinions and data contained in all publications are solely those of the individual author(s) and contributor(s) and not of MDPI and/or the editor(s). MDPI and/or the editor(s) disclaim responsibility for any injury to people or property resulting from any ideas, methods, instructions or products referred to in the content.

