Article

Effects of rpl1001 Gene Deletion on Cell Division of Fission Yeast and Its Molecular Mechanism

1
Key Laboratory of Southwest China Wildlife Resources Conservation (Ministry of Education), College of Life Science, China West Normal University, Nanchong 637009, China
2
College of Environmental Science and Engineering, China West Normal University, Nanchong 637009, China
*
Authors to whom correspondence should be addressed.
These authors contributed equally to this work.
Curr. Issues Mol. Biol. 2024, 46(3), 2576-2597; https://doi.org/10.3390/cimb46030164
Submission received: 11 January 2024 / Revised: 27 February 2024 / Accepted: 12 March 2024 / Published: 18 March 2024
(This article belongs to the Section Molecular Microbiology)

Abstract

:
The rpl1001 gene encodes 60S ribosomal protein L10, which is involved in intracellular protein synthesis and cell growth. However, it is not yet known whether it is involved in the regulation of cell mitosis dynamics. This study focuses on the growth, spore production, cell morphology, the dynamics of microtubules, chromosomes, actin, myosin, and mitochondria of fission yeast (Schizosaccharomyces pombe) to investigate the impact of rpl1001 deletion on cell mitosis. RNA-Seq and bioinformatics analyses were also used to reveal key genes, such as hsp16, mfm1 and isp3, and proteasome pathways. The results showed that rpl1001 deletion resulted in slow cell growth, abnormal spore production, altered cell morphology, and abnormal microtubule number and length during interphase. The cell dynamics of the rpl1001Δ strain showed that the formation of a monopolar spindle leads to abnormal chromosome segregation with increased rate of spindle elongation in anaphase of mitosis, decreased total time of division, prolonged formation time of actin and myosin loops, and increased expression of mitochondrial proteins. Analysis of the RNA-Seq sequencing results showed that the proteasome pathway, up-regulation of isp3, and down-regulation of mfm1 and mfm2 in the rpl1001Δ strain were the main factors underpinning the increased number of spore production. Also, in the rpl1001Δ strain, down-regulation of dis1 caused the abnormal microtubule and chromosome dynamics, and down-regulation of hsp16 and pgk1 were the key genes affecting the delay of actin ring and myosin ring formation. This study reveals the effect and molecular mechanism of rpl1001 gene deletion on cell division, which provides the scientific basis for further clarifying the function of the Rpl1001 protein in cell division.

1. Introduction

Ribosomal proteins are not only associated with protein translation in the cytoplasm but are also involved in other cellular processes. In yeast, loss of ribosomal protein L32-2 (Rpl32) causes a decrease in ribosome levels, triggering mutual recognition of mating proteins on the cell surface, affecting the MAPK pheromone response pathway, and regulating the process of sexual reproduction [1]. The 60S ribosomal protein L22 (Rpl22) is a key regulator of the transcription factor Ime1 and regulates the cellular transition from mitosis to meiosis [2]. Ribosomal protein S3 (Rps3) localizes to the spindle, binds to the spindle throughout mitosis, participates in microtubule polymerization and spindle formation, and influences mitosis [3]. The activation of ribosomal protein S6 (Rps6) is mediated via its phosphorylation by ribosomal protein S6 kinase (S6K) to form p-RpS6. It participates in the complex 1 (mTORC1) pathway, which regulates the stabilization of actin cytoskeletal organization in yeast and is involved in cell growth and cell cycle processes [4,5].
In fission yeast, the rpl1001 gene encodes 60S ribosomal protein L10, a member of the L10e protein family (Figure 1). Within the ribosome, the Rpl1001 protein is located at the center of the topological connectivity of many functional regions in the large subunit, close to the GTPase center and the sarcin-ricin loop, and is almost completely covered by the small subunits in the 80S ribosome [6]. From yeast to humans, Rpl1001 is the main controller of ribosome structure and function, affecting key steps such as ribosome assembly and protein synthesis [7]. In the nucleolus of budding yeast, Rpl1001 is involved in the processing of pre-mRNA molecules [8], and in the cytoplasm, Rpl1001 participates in the ligation of the 40S and 60S ribosomal subunits [9]. In fission yeast, the deletion of rpl1001 resulted in decreased cell growth in the media containing xylose or galactose as the carbon source and lysine, proline, or serine as the nitrogen sources, respectively, and increased sensitivity to cadmium, lithium, lithium chloride, magnesium chloride, methyl methanesulfonate, sodium dodecyl sulfate, tunicamycin, valproic acid, bleomycin, and vanadate [10]. In the absence of a nitrogen source, the cell cycle of rpl1001Δ cells arrests [11]. The rpl1001 gene deficiency is closely linked to disease in humans. Rpl1001 is a zinc-binding regulatory protein which interacts with oncogenic transcription factor c-Jun, and inactivation of the Rpl1001 protein leads to nephroblastoma [12]. Missense mutations in rpl1001 lead to translation defects, causing systemic central nervous system defects which affect brain formation [13]. Rpl1001 is also involved in the fine-tuning mechanism of synaptic plasticity, which is one of the central processes that are impaired in autism, and mutations in rpl1001 gene usually lead to autism [14].
Cell division is essential to the survival of all organisms, and the process involves many structures working together, including the cytoskeleton, chromosomes, and mitochondria [15]. Schizosaccharomyces pombe (S. pombe) has a relatively simple and clear genetic system, a typical eukaryotic cell cycle, and a conserved division mechanism, making it a model organism suited for the study of cell division processes [16]. There is no information currently available on whether the rpl1001 deletion affects mitotic kinetics and sexual reproduction. In our study, the S. pombe was used as the research model to investigate the effect of rpl1001 gene deletion on the growth, spore production, and cell morphology and on the dynamics of microtubules, chromosomes, actin, myosin, and mitochondria. RNA-Seq and bioinformatics analyses were also used to reveal the key genes and pathways, which could provide a scientific foundation for further understanding the role of the Rpl1001 protein in cell division.

2. Materials and Methods

2.1. Experimental Strains

All strains used for the study are listed in Table 1.

2.2. Cell Growth Analysis

The PT287 and 2599-1 strains were cultured in YE5S solid medium at 25 °C for 48 h to reach the active state. The strains were transferred to YE5S liquid medium at 25 °C till the OD595 (optical density) reached 0.5~0.8, then the strains were diluted to OD595 = 0.1, and the OD595 values were measured continuously every 2 h for 12 h.

2.3. Spore Production Analysis

The h+ and h- strains were inoculated with YE5S solid medium and cultured at 25 °C for activation, and then the activated h+ and h- strains were mixed onto EMM-N medium at 25 °C for cultivating spores. After 48 h, the strains were picked for microscopic examination, and the spores produced were observed and counted. The total amount of cells evaluated in each group was 1500 [17].

2.4. Construction of Fluorescent Protein Tags

The rpl1001Δ (h+ and h-) strain and the wild-type (h+ and h-) strain with fluorescent protein marker were cultured to the activated state, and the activated h+ and h- strains were mixed onto EMM-N medium in 25 °C to cultivate spore production. After 48 h, yeast cells were subjected to snail enzyme (Shanghai Yuanye Bio-Technology Co., Ltd., Shanghai, China) treatment, the spores were removed and coated in YE5S solid medium for culture. The target strains were selected through resistance medium, nutrient-deficient medium, and microscopy.

2.5. Microscopy and Data Analysis

Live cell imaging was performed with a Leica TCS-SP8 (Leica Microsystems Ltd., Wetzlar, Germany) confocal microscope at 25 °C. In order to obtain high-quality images, the parameters during laser confocal imaging were set as follows: green fluorescence excitation wavelength was 488 nm, emission wavelength reception range of 491–549 nm, red fluorescence excitation wavelength was 552 nm, emission wavelength reception range of 583–635 nm, pixels of 512 × 512 μm, 7 optical sections of 1 µm distance, and an exposure time of 400 ms, which was acquired at 90 or 120 s intervals across a total time of 120 min. The program ImageJ was used to process the pictures. The software SPSS 17 was used for data analysis in the rpl1001Δ and wild-type strains. * p < 0.05 denotes a significant difference, ** p < 0.01 denotes a highly significant difference. The GraphPad Prism 8 (GraphPad Software Inc., La Jolla, CA, USA) was used to produce all of the box plot.

2.6. Bioinformatics Analysis

The 2599-1 and PT287 strains were cultured and shaken at 25 °C until they reached the logarithmic phase of cell division, then the strains were collected and frozen, and sent to Beijing Novogene Co., Ltd. (Beijing, China) for the extraction of RNA and quality testing. Agarose gel electrophoresis was used to analyze the degree of degradation of the RNA and the contamination status. NanoDrop (Thermo Fisher Scientific Inc., Waltham, MA, USA) was used to test the purity of the RNA. Qubit2.0 Fluorometer (Thermo Fisher Scientific Inc., Waltham, MA, USA) was used to accurately quantify the concentration of RNA. Agilent 2100 bioanalyzer (Agilent Technologies Inc., Santa Clara, CA, USA) was used to accurately detect the integrity of RNA. After the samples were tested and qualified, the cDNA library was constructed, and sequencing was performed after the library was qualified. Total RNA sequencing of the wild-type and rpl1001Δ strains was performed to obtain raw reads. Splice and low-quality data were removed to obtain clean reads, which were accurately compared with the reference genome by Hisat2 v2.0.5 software [18]. Quantitative analysis of gene expression was performed by the Feature Counts and Stringtie (1.3.3b) software [19,20], differential significance analysis of gene expression of the samples was performed by the DESeq2 (1.20.0) and EdgeR (3.22.5) software [21]. GO and KEEG pathway enrichment of differential genes were performed by the Cluster Profile (3.4.4) software [22]. The obtained transcriptome sequence was uploaded into NCBI with the access number PRJNA1046258.

2.7. Quantitative Real-Time PCR

Total RNA from logarithmic growth phase of yeast cell culture was extracted, reverse-transcribed to cDNA, and subjected to Quantitative Real-Time PCR (qRT-PCR) using the act1 gene as the reference gene to detect the gene expression level. The primers used are listed in Table 2.

3. Results

3.1. Changes of Cell Growth and Spore Production in the rpl1001Δ Strain

The findings of cell proliferation showed that between 0 and 4 h, there was nearly no variation in the rates of proliferation between the wild-type and rpl1001Δ strains. However, after 4 h, the wild-type strain entered the logarithmic growth phase, while the rpl1001Δ strain showed obvious slow growth. At 12 h, the OD595 (optical density) of the wild-type strain was 0.7 and that of the rpl1001Δ strain was only 0.2, which was statistically significant (Figure 2A). The findings above showed that the rpl1001Δ strain became slower in growth.
A comparison of the number of spores generated by the wild-type and rpl1001Δ strains revealed that the former produced four spores at a rate of 99.2% and the latter at 95.5%. These differences were statistically significant. Additionally, 2.3% of the rpl1001Δ strains were found to produce eight spores (Figure 2B,C). The findings indicated an abnormal number of spore production in the rpl1001Δ strain, which tended to produce more than four spores.

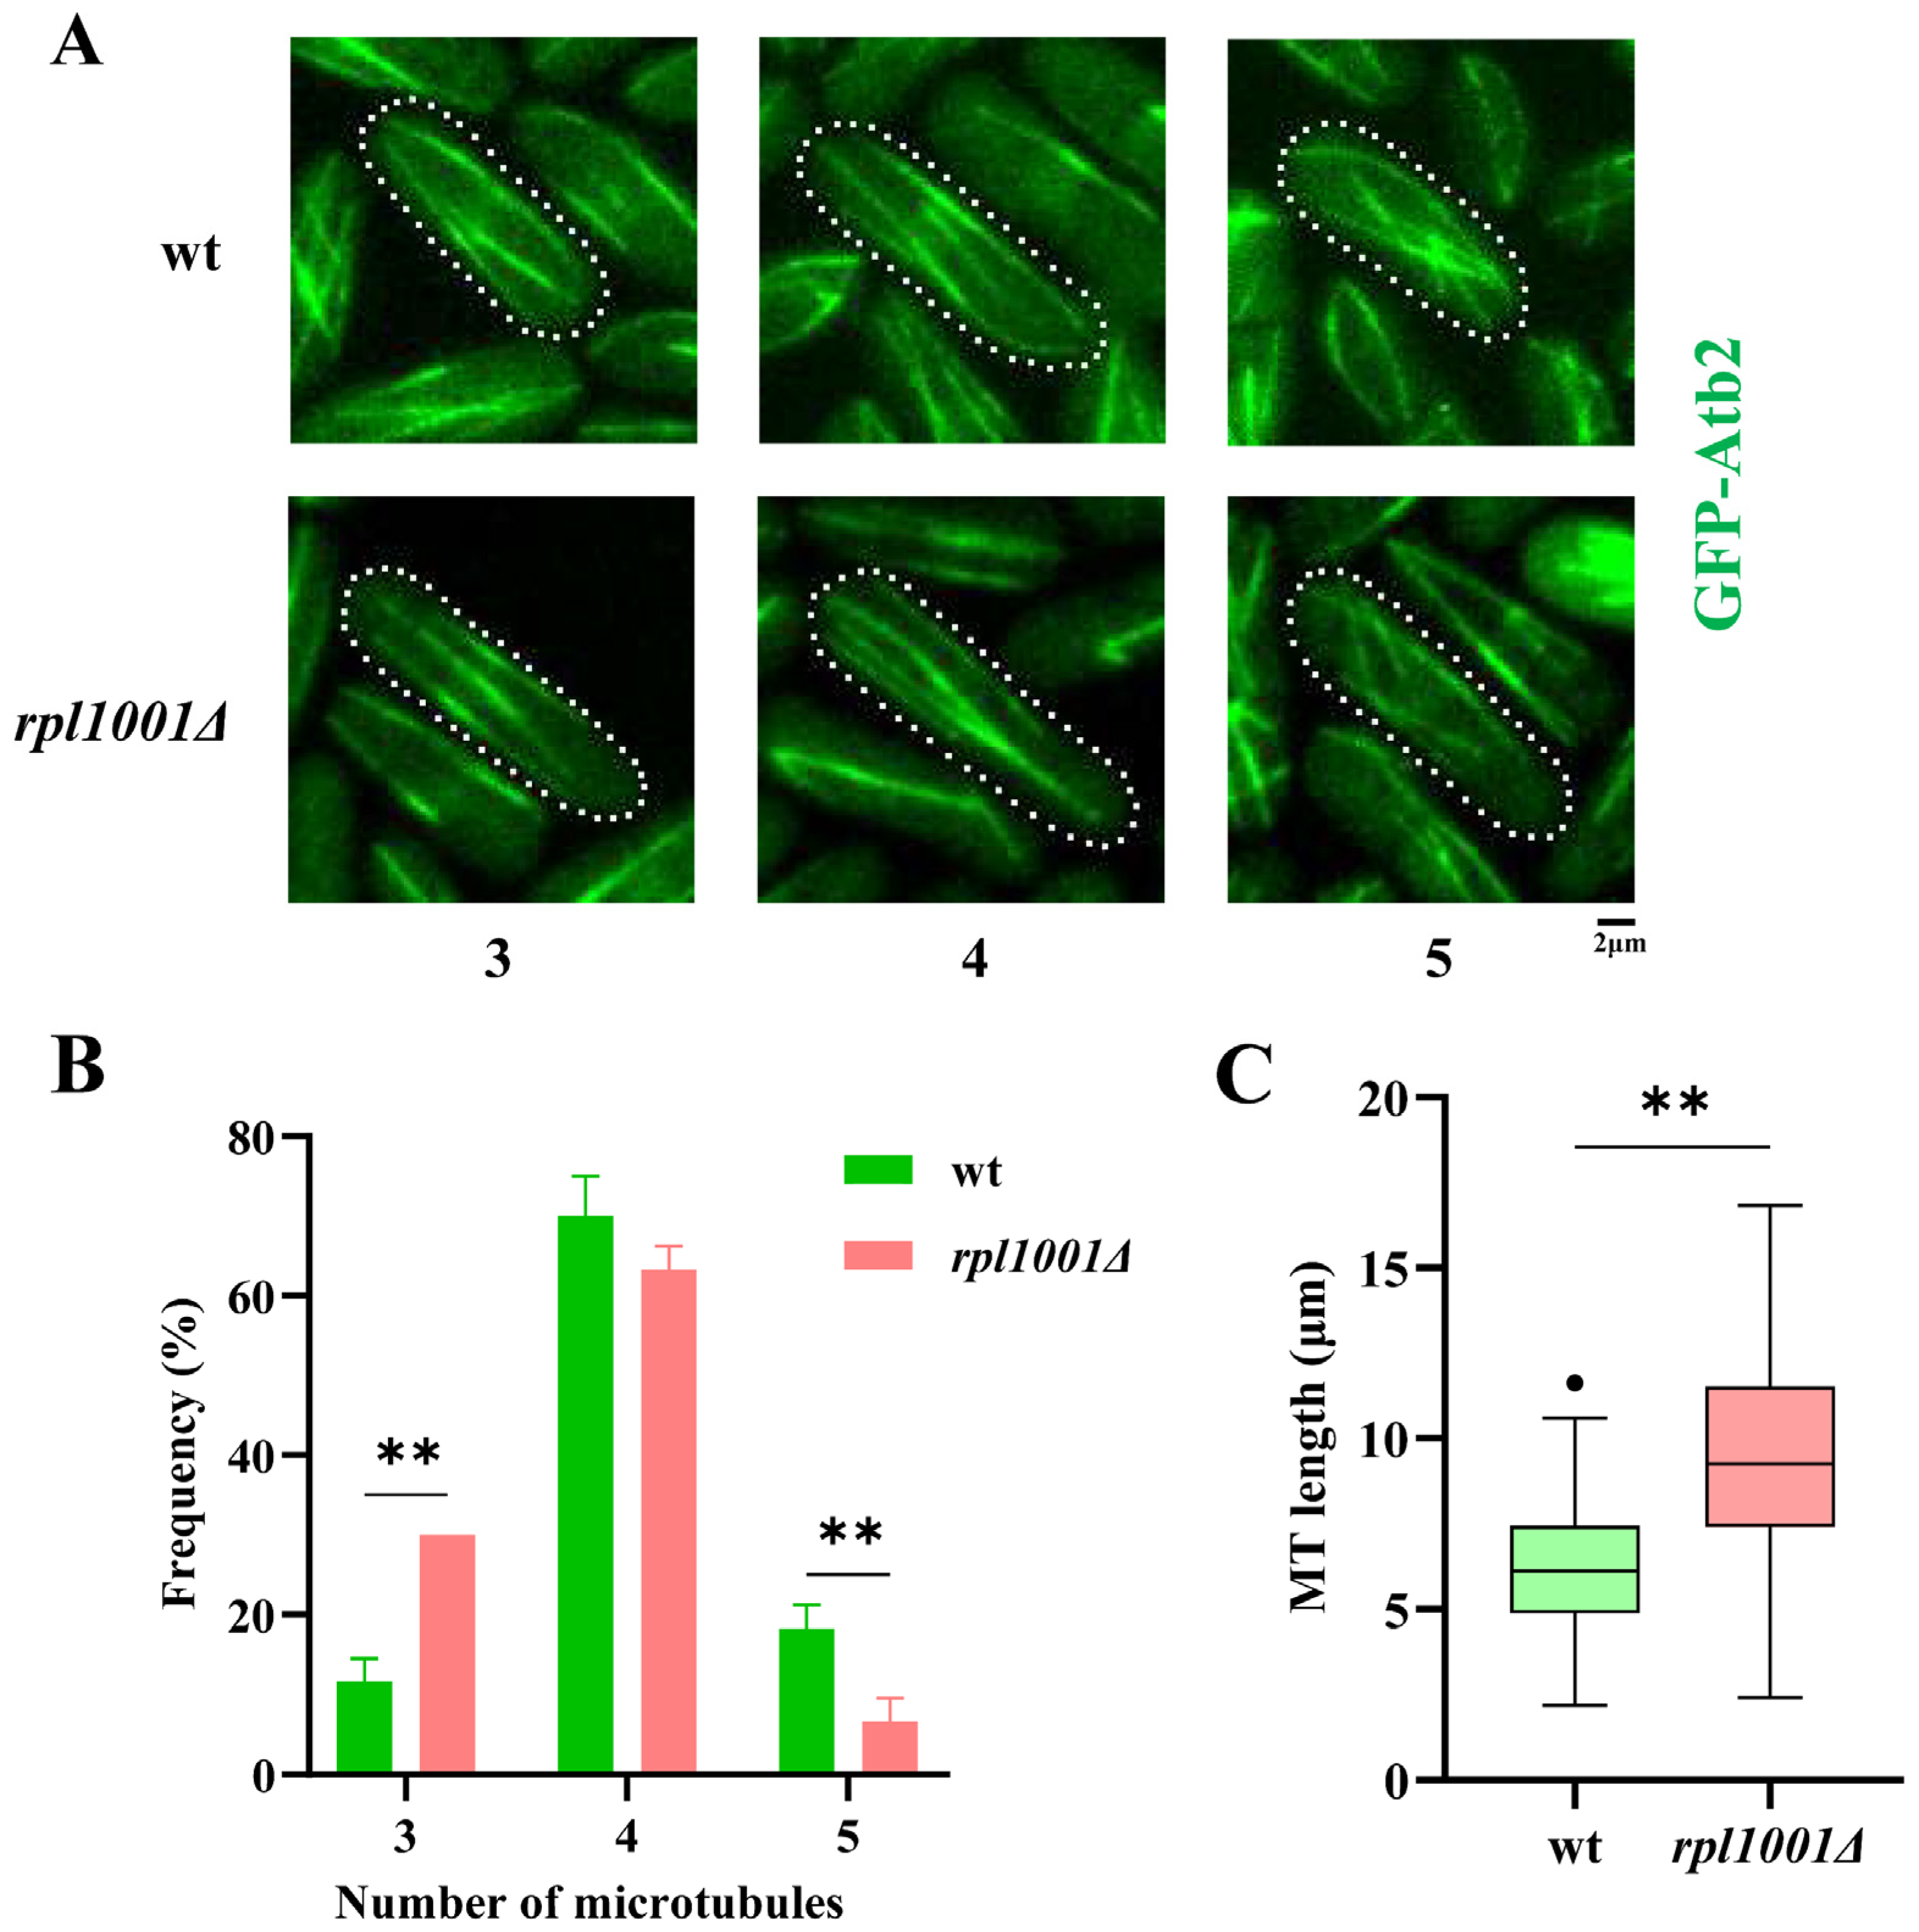
3.2. Microtubule Alterations in the rpl1001Δ Strain during Interphase

Analysis of microtubules (MTs) showed that the proportions of MT number in the wild-type and rpl1001Δ strains having 3, 4 and 5 MTs were 11.7 ± 2.9%, 70.0 ± 5.0%, 18.3 ± 2.9% and 30.0 ± 10.0%, 63.3 ± 2.9%, 6.7 ± 2.9%, respectively (Figure 3A). The number of cells with 3 and 5 MTs varied significantly between the rpl1001Δ and wild-type strains (Figure 3B). The average length of MTs of the rpl1001Δ strain was 9.3 ± 3.0 μm, which was significantly different from the wild-type (Figure 3C). In summary, the number of MTs decreased and the length increased in the rpl1001Δ strain during the interphase.

3.3. Changes in Chromosome and Spindle in the rpl1001Δ Strain during Mitosis

During mitosis, MTs assemble into spindles in anaphase to help chromosomes segregate correctly. The results showed that 10.0% of cells of the rpl1001Δ strain had defects of chromosome fragmentation and uneven segregation (Figure 4A). Statistics on the spindle architecture revealed that 81.7 ± 2.9% of the wild-type strain spindles formed a bar, 10.0% formed a dot, and 8.3% formed a monopolar body with a transient protrusion of MT bundles. While in the rpl1001Δ strain, no dot spindle formation was found and the proportion of bar and monopolar spindle formation were 71.7 ± 2.9% and 28.3 ± 2.9%, respectively, indicating that the bipolar spindle was significantly reduced in the rpl1001Δ strain, and unipolar spindle was significantly increased (Figure 4B,D). The mode of spindle depolymerization was also measured, and the proportion of cells in which the spindle of the wild-type strain broke in the linear-type, arch-type, and S-type were 21.7 ± 7.6%, 66.7 ± 2.9%, and 11.7 ± 5.8%, respectively. The rpl1001Δ strain spindle had no S-type breaks, and the proportions of cells with the linear-type and arch-type breaks were 81.7 ± 2.9% and 18.3 ± 2.9%, respectively, which indicated that the rpl1001Δ strain had a highly significant increase in linear-type breaks (Figure 4C,E). In conclusion, the spindle formation and breakage pattern processes were abnormal in the rpl1001Δ strain.
The results of spindle dynamics showed that the total time from the forming of spindles to breakage in the wild-type and rpl1001Δ strains were 30.2 ± 2.5 and 27.8 ± 4.7 min, respectively. There was no difference in the final spindle lengths, which were 12.3 ± 0.7 and 12.2 ± 1.1 μm in the wild-type and rpl1001Δ strains, respectively (Figure 4F–H). The above results suggested that rpl1001 gene deletion shortens the elongation time of the spindle but did not affect the final length of the spindle.
Further statistics on the kinetics of the spindle at different phases of mitosis showed that the times of spindle elongation at prophase, metaphase, and anaphase in the wild-type and rpl1001Δ strains were 4.3 ± 1.2, 9.8 ± 1.9, 16.1 ± 1.8 and 4.8 ± 1.7, 8.6 ± 3.6, 14.5 ± 3.4 min, respectively, and the spindle elongation rates at prophase and metaphase of the wild-type and rpl1001Δ strains were 0.3 ± 0.1, 0.1 ± 0.1 and 0.2 ± 0.1, 0.1 ± 0.1 μm/min, respectively. There were no significant difference between these two groups (Figure 4I,J). However, at anaphase, the spindle elongation rates of the wild-type and rpl1001Δ strains were 0.6 ± 0.1 and 0.8 ± 0.1 μm/min, respectively, showing significant differences (Figure 4J). These findings demonstrated that during anaphase, the elongation rate of the spindle was accelerated in the rpl1001Δ strain.

3.4. Changes of Cell Morphology in the rpl1001Δ Strain

The cell lengths at the spindle formation during prophase-metaphase, metaphase-anaphase, anaphase-telophase transitions and telophase of the wild-type strains were 12.8 ± 1.2, 13.0 ± 1.2, 13.1 ± 1.2, 13.3 ± 1.3, and 7.0 ± 0.8 μm, respectively, and those in the rpl1001Δ strains were 14.1 ± 1.4, 14.2 ± 1.4,14.3 ± 1.4, 14.3 ± 1.5, and 9.0 ± 0.6 μm, respectively (Figure 5A,B). The cell length of the rpl1001Δ strain was significantly different compared to the metaphase-anaphase transition, and the cell length of the rpl1001Δ strain was significantly increased at all other periods.
The cell breadth in each period of the wild-type strains was 3.5 ± 0.2, 3.5 ± 0.2, 3.5 ± 0.2, 3.5 ± 0.3, and 3.5 ± 0.2 μm, respectively, while for the rpl1001Δ strains they were 4.0 ± 0.3, 4.0 ± 0.3, 4.0 ± 0.3, 4.1 ± 0.3, and 3.9 ± 0.3 μm (Figure 5C), indicating that the rpl1001Δ strain also exhibited a highly significant increase in cell breadth in each period. In summary, the rpl1001Δ cells become longer and wider in all phases of mitosis, and the overall volume of the cells also increased.

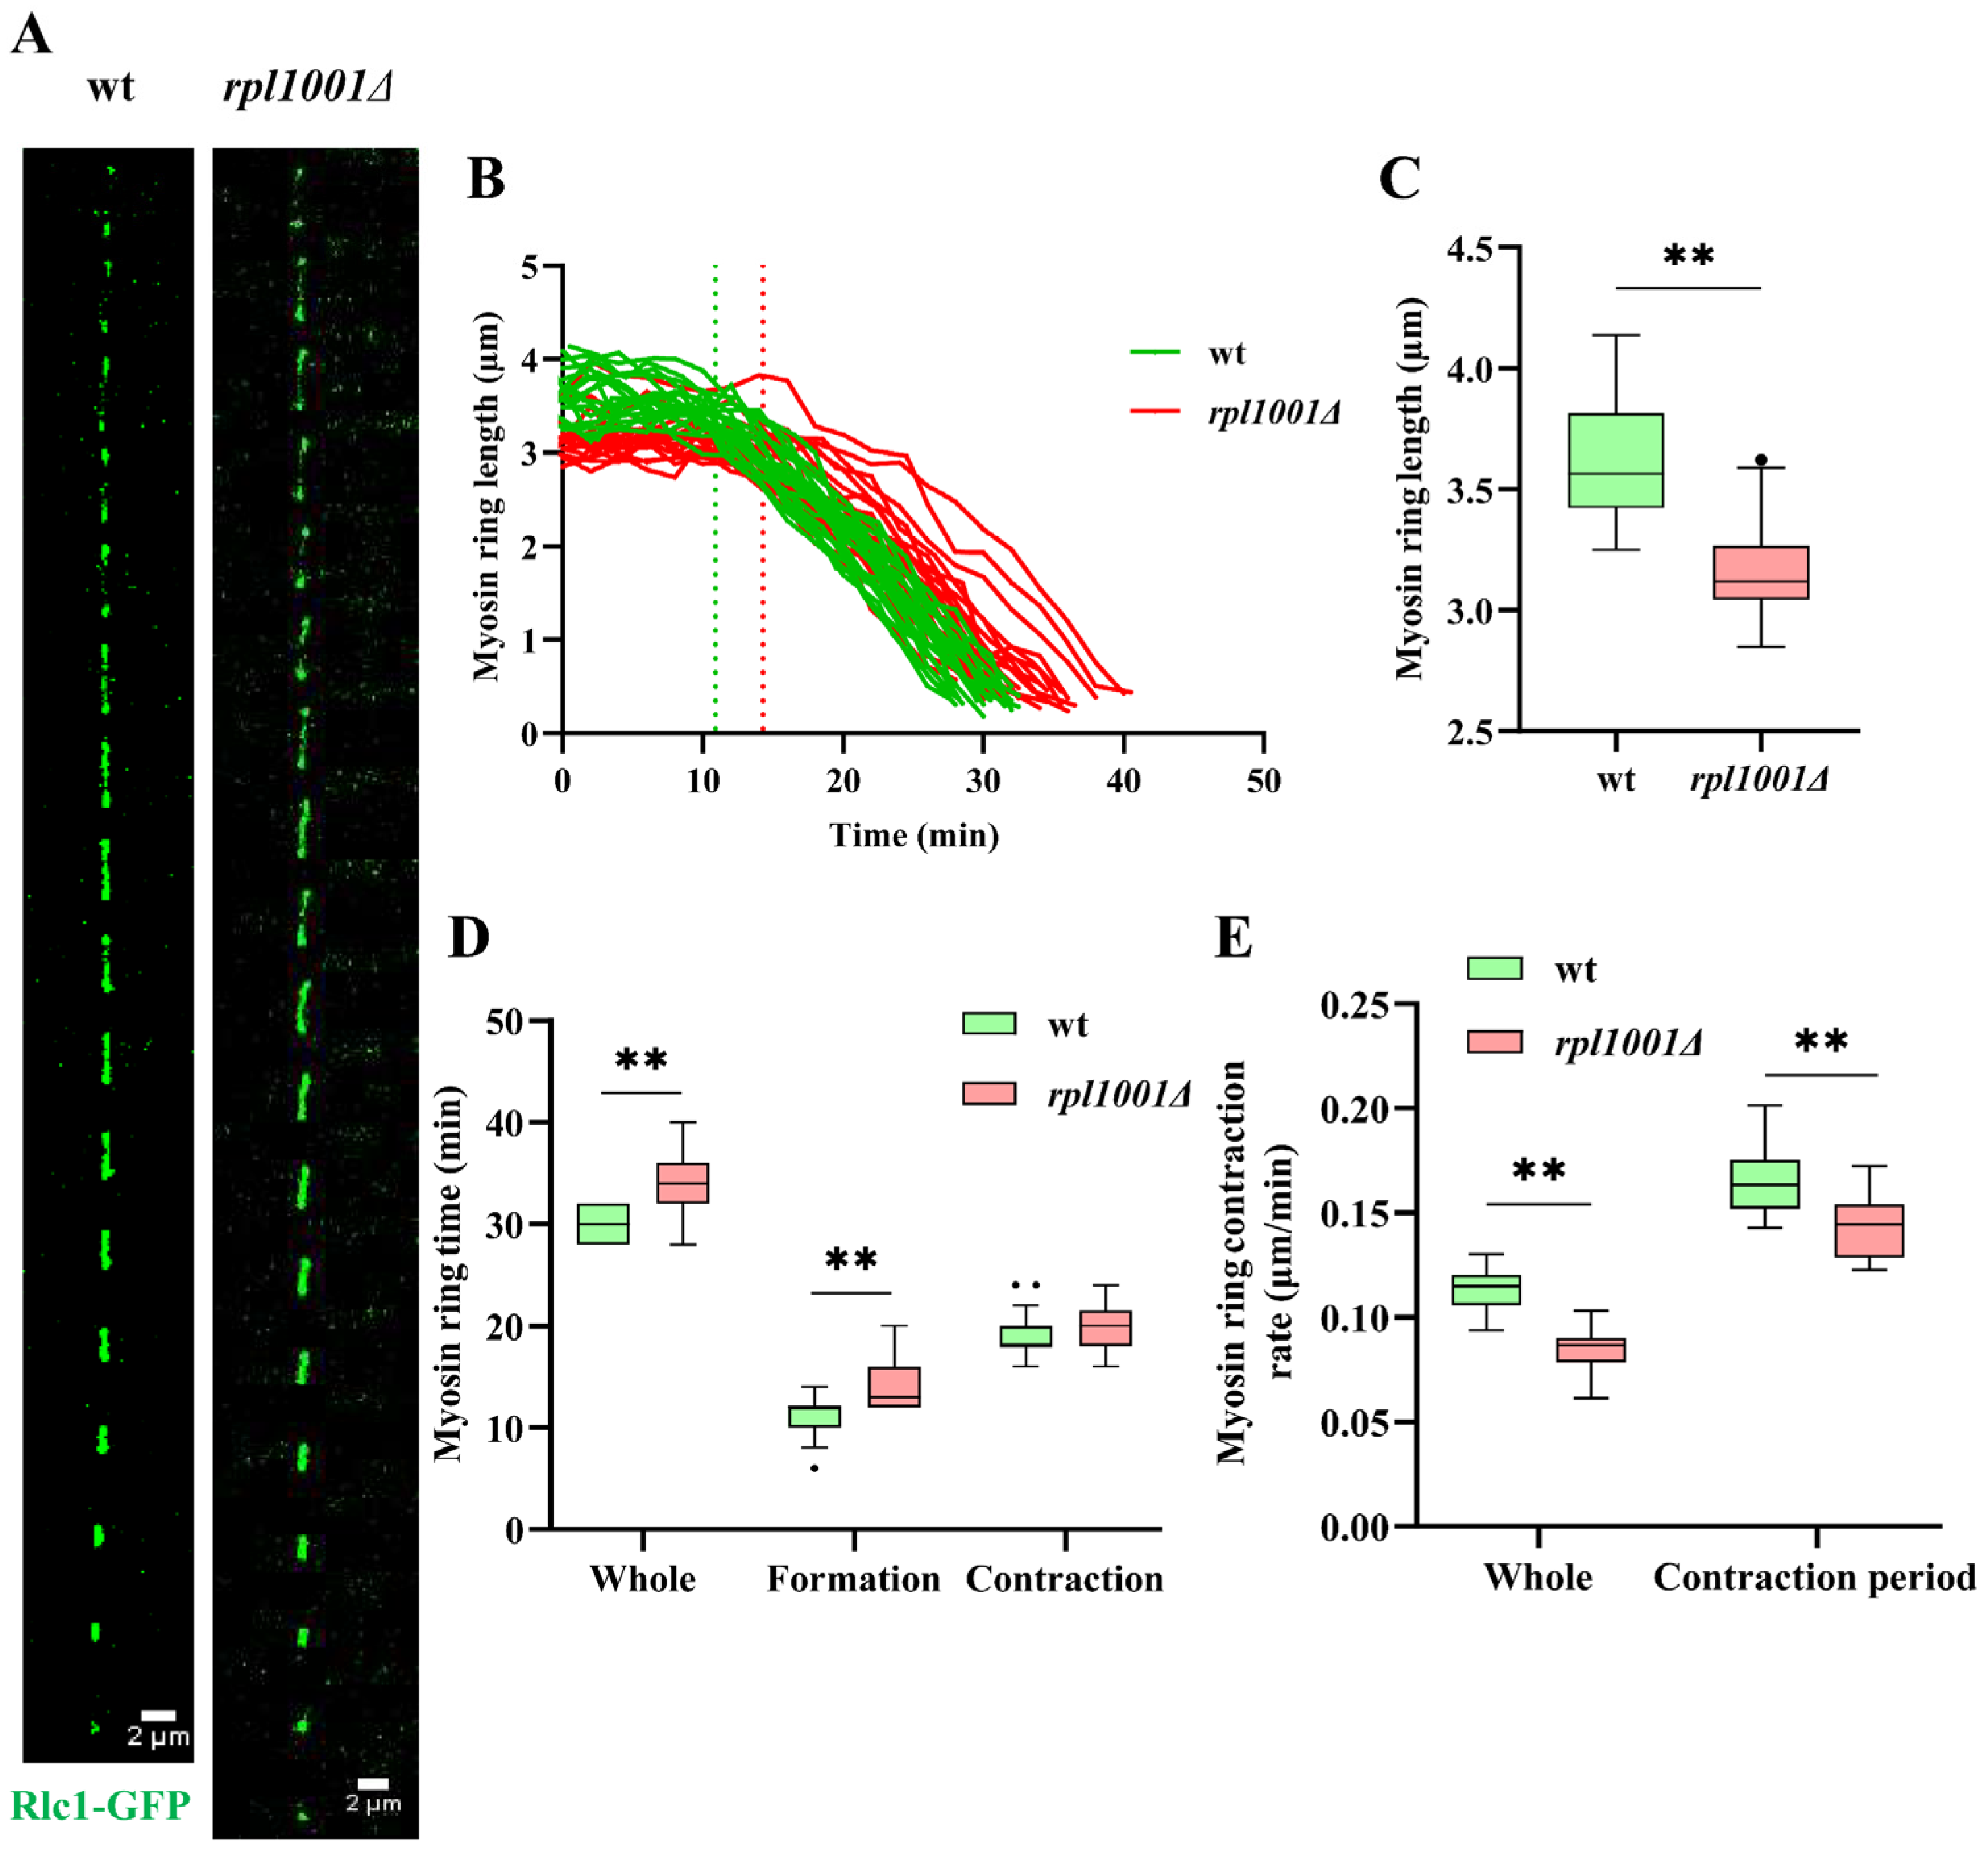
3.5. Changes of the Actin and Myosin Ring in the rpl1001Δ Strain during Mitosis

During mitosis, myosin-II and F-actin assemble into shrunken rings along the cell equatorial plate to aid cell division. Time-lapse imaging of cells showed that actin and myosin gradually aggregated during anaphase of mitosis to form a contractile ring, which began to contract and finally degraded upon completion of its assembly (Figure 6A and Figure 7A). The length of the actin ring was 3.7 ± 0.3 and 3.6 ± 0.4 μm for the wild-type and rpl1001Δ strains, respectively, the total time from actin ring formation to disappearance was 29.6 ± 3.1 and 31.9 ± 5.6 min, respectively, and the total contraction rate of the actin ring was 0.1 μm/min for both, with no significant differences between both groups. Further statistics on the actin ring assembly process revealed that the actin ring assembly times of the wild-type and the rpl1001Δ strains were 12.9 ± 2.7 and 15.4 ± 2.5 min, respectively, with significant differences. But upon entering the contraction phase, the contraction times of the wild-type and rpl1001Δ strains were 16.8 ± 3.2 and 16.5 ± 4.6 min, respectively, and the contraction rates were 0.2 μm/min for both (Figure 6B–E), which were not significantly different. The above results suggested that the rpl1001 gene deletion prolongs actin ring assembly.
Statistical analysis of the myosin rings showed that the lengths of the myosin rings were 3.6 ± 0.3 and 3.2 ± 0.2 μm in the wild-type and rpl1001Δ strains, respectively, the total times for myosin ring formation to disappearance were 30.1 ± 1.7 and 34.0 ± 3.2 min, respectively, which were all significantly different. The total contraction rate of the myosin ring of the rpl1001Δ strain was also found to significantly slow down. Further statistics on the myosin ring assembly process revealed that the myosin ring assembly times were 10.9 ± 2.1 and 14.2 ± 2.6 min for the wild-type and rpl1001Δ strains, respectively, and also significantly different. Upon entering the contraction phase, the myosin rings contraction times of the wild-type and rpl1001Δ strains were 19.2 ± 2.4 and 19.8 ± 2.4 min, and the contraction rates were 0.2 and 0.1 μm/min, respectively (Figure 7B–E). The contraction time was not significantly different in the rpl1001Δ strain compared to the wild-type, but the rate of contraction was significantly lower. The above results indicated that the rpl1001 gene deletion resulted in a shorter total length of myosin ring, a decrease in the rate of contraction, and an increase in the duration of its presence.

3.6. Mitochondrial Changes in the rpl1001Δ Strain

Mitochondria play the role of energy factories in the cell, and they regulate the process of cell division through their fission and fusion. The statistical results of mitochondria fluorescence intensity showed that they were 2081.3 ± 644.7 and 2829.2 ± 735.4 a.u. in the wild-type and rpl1001Δ strains, respectively, which were significantly different (Figure 8A,B), indicating that rpl1001 gene deletion could increase the mitochondrial content.
As the cell undergoes division, the mitochondria split into the daughter cells. Statistics on the fluorescence intensity of subcellular mitochondria revealed that the average fluorescence intensity of subcells with more mitochondria in the wild-type strain was 1188.9 ± 455.2 a.u., and that of subcells with fewer mitochondria was 1047.5 ± 399.9 a.u.; and the average fluorescence intensities in the rpl1001Δ strain was 1766.0 ± 592.8 and 1542.3 ± 518.4 a.u., respectively (Figure 8C,D). The fluorescence intensity of both daughter cells showed a highly significant difference among the wild-type and the rpl1001Δ strains, suggesting that the rpl1001 gene deletion also increased the mitochondrial content of daughter cells, but had no effect on the proportion of mitochondria distributed among the daughter cells during mitosis.

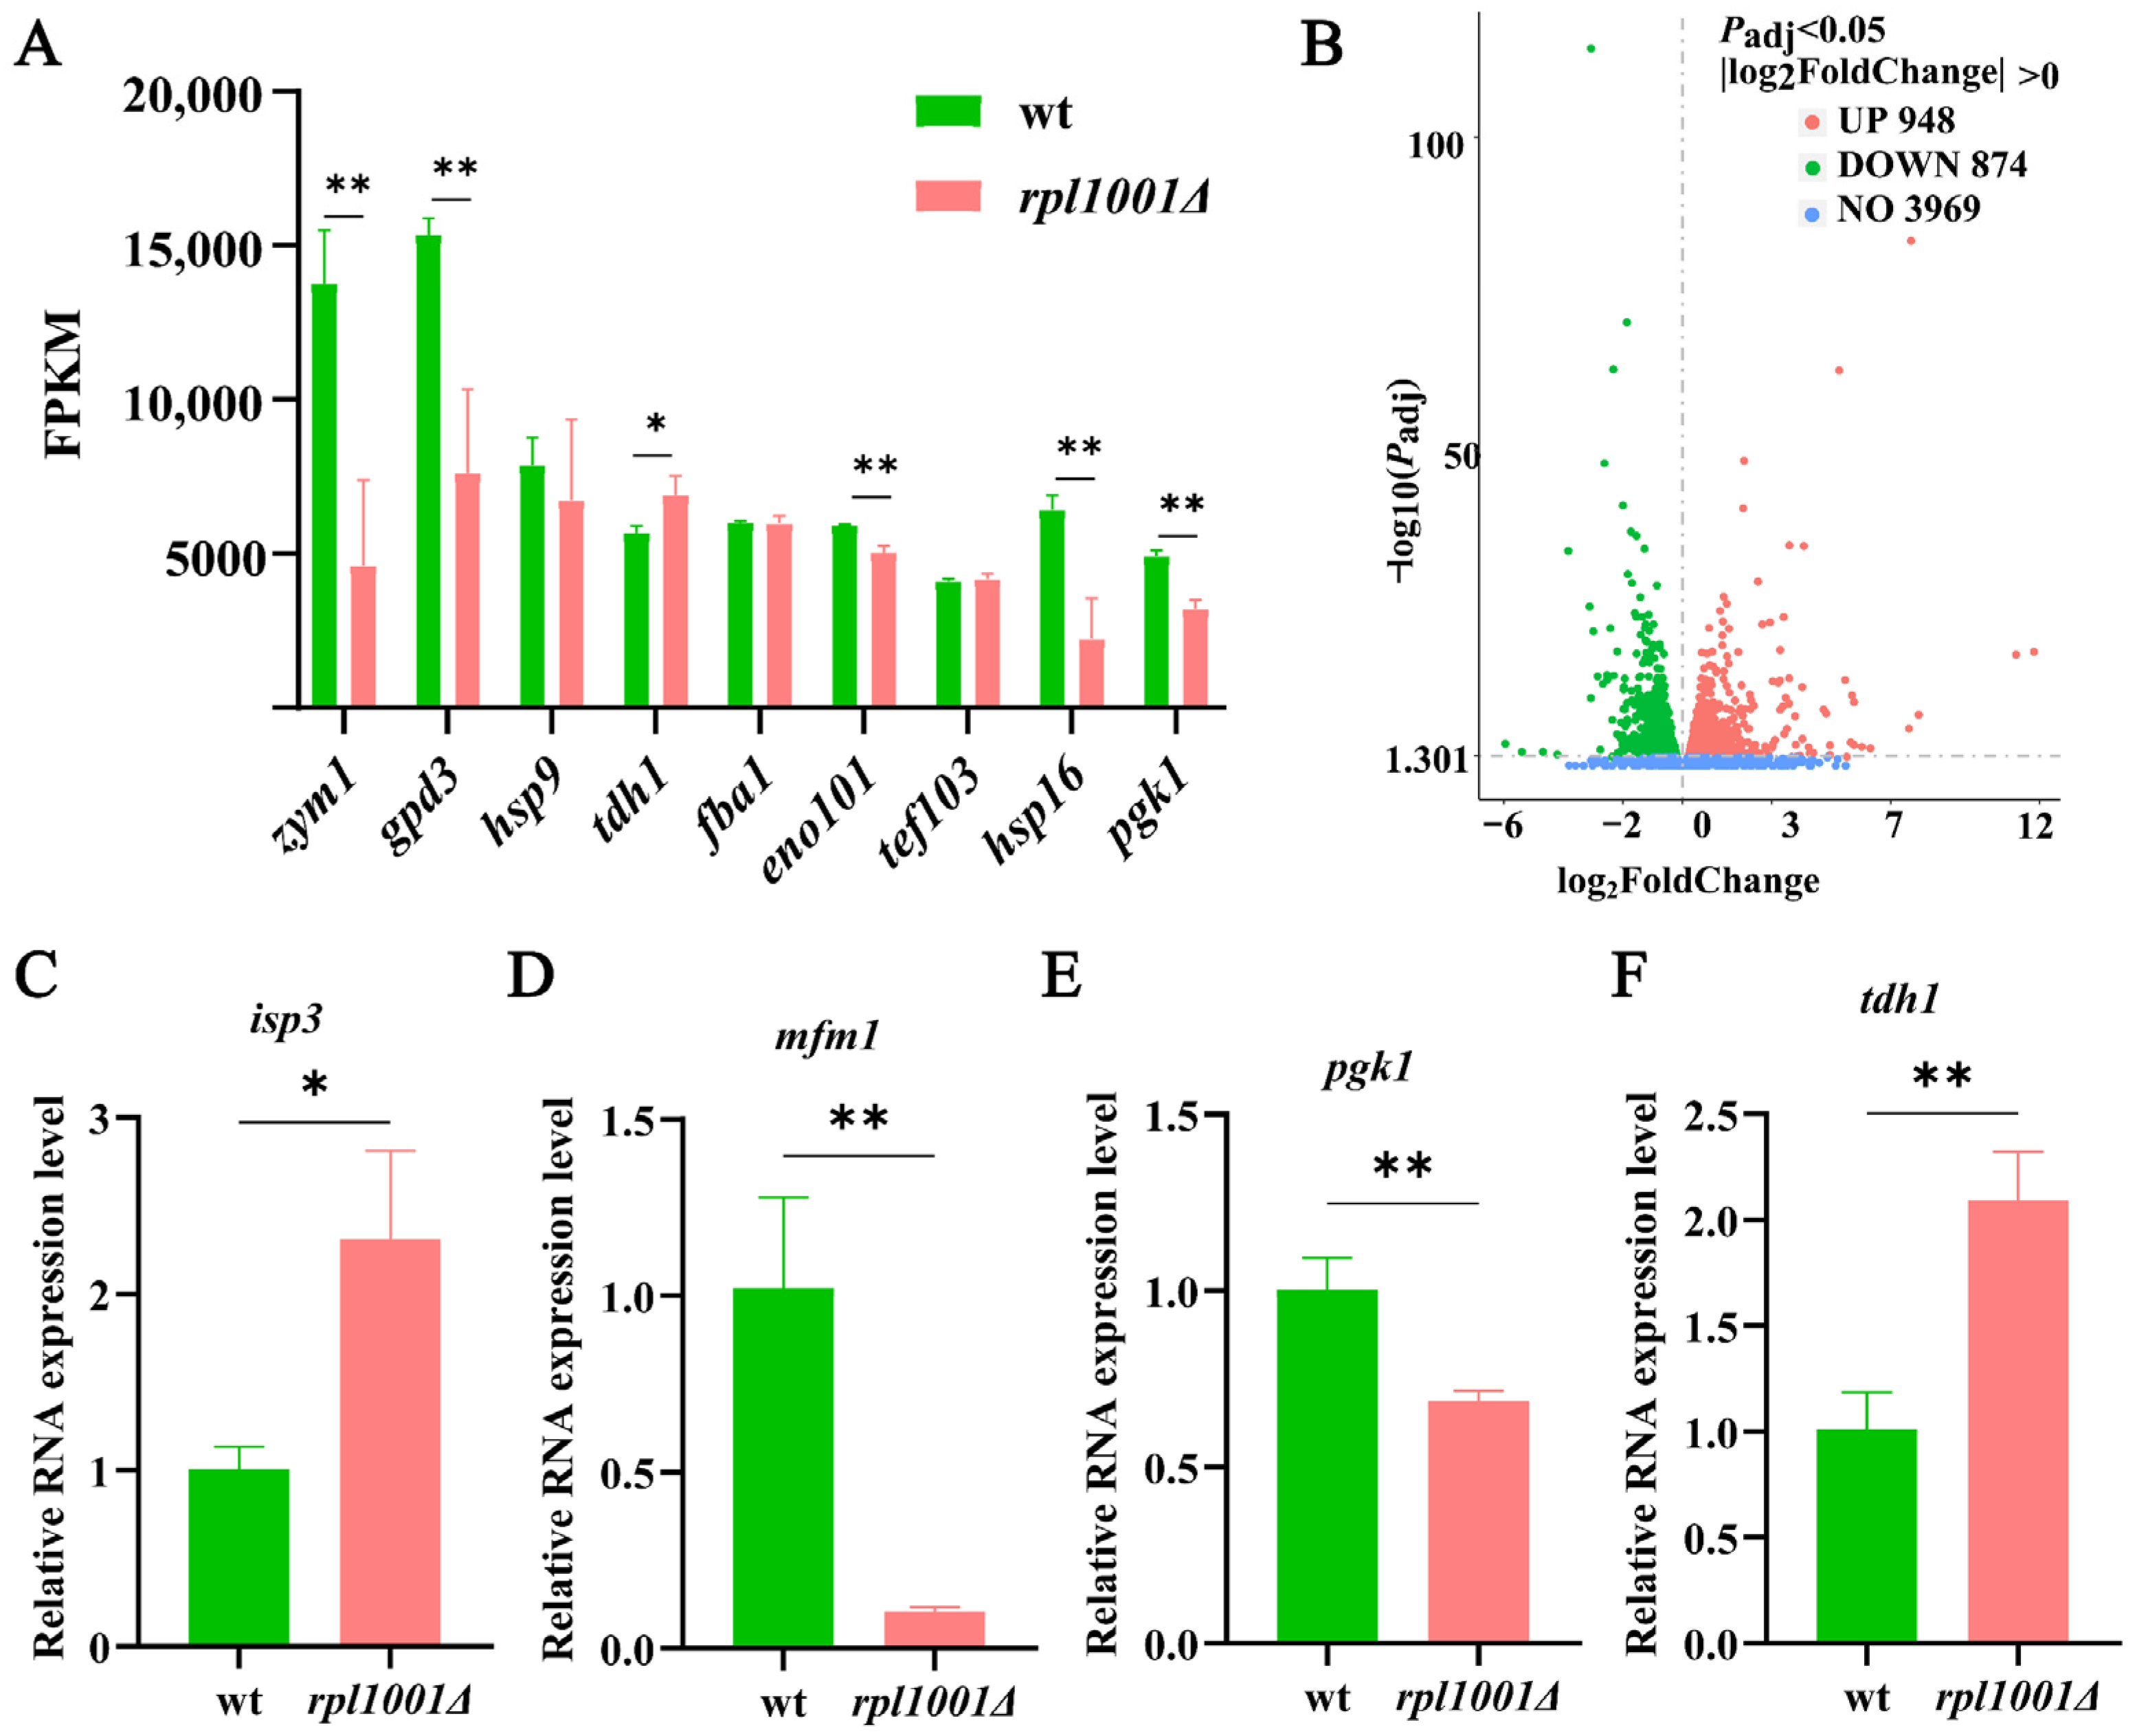
3.7. Analysis of Highly Expressed Genes and Differentially Expressed Genes

The transcriptome sequencing analysis of the wild-type and rpl1001Δ strains was performed, and their gene expression levels were quantified after quality control analysis (Table S1). FPKM > 4000 means extremely highly expressed genes, FPKM > 60 means highly expressed genes, FPKM > 1 means expressed genes, and FPKM < 1 means lowly expressed genes or non-expressed genes. The investigations revealed that the wild-type strain had 4951 expressed genes and 1967 high-level expressed genes, while the rpl1001Δ strain had 5039 expressed genes and 1959 high-level expressed genes (Table 3, Figure 9A).
Among the genes that the rpl1001Δ and wild-type strains both express to extremely high levels, tdh1 encodes glyceraldehyde-3-phosphate dehydrogenase, Tdh1, which physically binds to response regulators (Mcs4) and stress-responsive MAPKKKs, and are involved in the positive regulation of the MAPK pathway. Through phosphorylation, the MAPK pathway delivers signaling molecules that regulate biological processes including cell growth, division, and differentiation [23]. The FPKM value of tdh1 was upregulated in the rpl1001Δ strain, indicating that the cellular phosphorylation of MAPK signaling pathway was compensated. The zym1 gene encodes a metallothionein, Zym1, and deficiency of Zym1 leads to abnormal chromosome segregation in meiosis and abnormal spore formation [24,25]. The FPKM of the zym1 gene was greatly reduced in the rpl1001Δ strain, which is consistent with the abnormal spore production number in this study.
Further investigation showed that only the wild-type strain appeared to express hsp16 and pgk1 at extremely high levels. The hsp16 gene encodes the heat shock protein, Hsp16, a Hsp family protein that regulates cell cycle checkpoints under stress [26]. The pgk1 gene encodes phosphoglycerate kinase, Pgk1, affecting mitotic cell cycle progression [27]. The FPKM values of hsp16 and pgk1 were greatly reduced in the rpl1001Δ strain, indicating abnormal cell cycle progression, which is consistent with the statistics of abnormal cell division in the rpl1001Δ strain.
The differentially expressed genes (DEGs) were analyzed in the rpl1001Δ and wild-type strains, and Padj < 0.05 and |log2FoldChange| > 0 were set as the screening criteria. The results showed that compared to the wild-type, there were 1822 differentially expressed genes in the rpl1001Δ strain, including 874 downregulated genes and 948 upregulated genes (Figure 9B).
Among the up-regulated genes (Table 4), mat2-Pi gene encodes the protein that is involved in activating the mitotic to meiotic cycle switch by binding DNA transcription factors with a specific structure [28]. Meanwhile, ftm4 encodes for the sub-telomeric 5Tm protein family, Ftm4, and Tf2-13 encodes for the retrotransposable element/transposon Tf2-type. During amino acid starvation in cells, the expression levels of ftm4 and Tf2-13 genes are upregulated to regulate nucleic acid levels [29]. The protein expressed by isp3 is a structural component of the spore wall and is resistant to nutrient-deficient environments [30]. In the rpl1001Δ strain, mat2-Pi, Tf2-13, ftm4, and isp3 gene expression was upregulated, suggesting that the deletion of rpl1001 increased intracellular RNA levels to initiate a transcriptional program to resist environmental change when cells are in a similarly nutrient-deficient environment.
Among the down-regulated genes (Table 5), mfm1 and mfm2 encode the M-factor precursor, which is involved in cell-cell signaling and regulates the MAPK cascade response in sporulation [31]. The pcm2 gene encodes protein-l-isoaspartate o-methyltransferase Pcm2, which affects spore formation [24]. The dis1 gene encodes TOG/XMAP215 microtubule plus end tracking polymerase, Dis1, involved in microtubule formation, depolymerization, shortening, and elongation [32]. Down-regulated expression of mfm1, mfm2, pcm2, and dis1 genes by 3.1, 2.5, 2.3, and 2.0 fold, respectively, occurred in the rpl1001Δ strain. The results suggest that the deletion of rpl1001 hindered the formation and contraction of cellular MTs, and led to abnormal division of spore nucleus in meiotic process, which affected the production of spores. This was consistent with the phenotype of microtubule abnormalities and a significant increase in spore numbers in the rpl1001Δ strain.

3.8. Differentially Expressed Gene Validation by qRT-PCR

According to the differential gene expression analysis and using act1 as the reference gene, the key genes isp3, mfm1, pgk1, and tdh1 were screened for qRT-PCR validation (Figure 9C–F). The results showed that isp3 and tdh1 were up-regulated and mfm1 and pgk1 were down-regulated in both RNA-seq and qRT-PCR. The expression trends of the above key genes after rpl1001 deletion were consistent with the RNA-Seq results, indicating that the results of the transcriptome experiments were reliable.

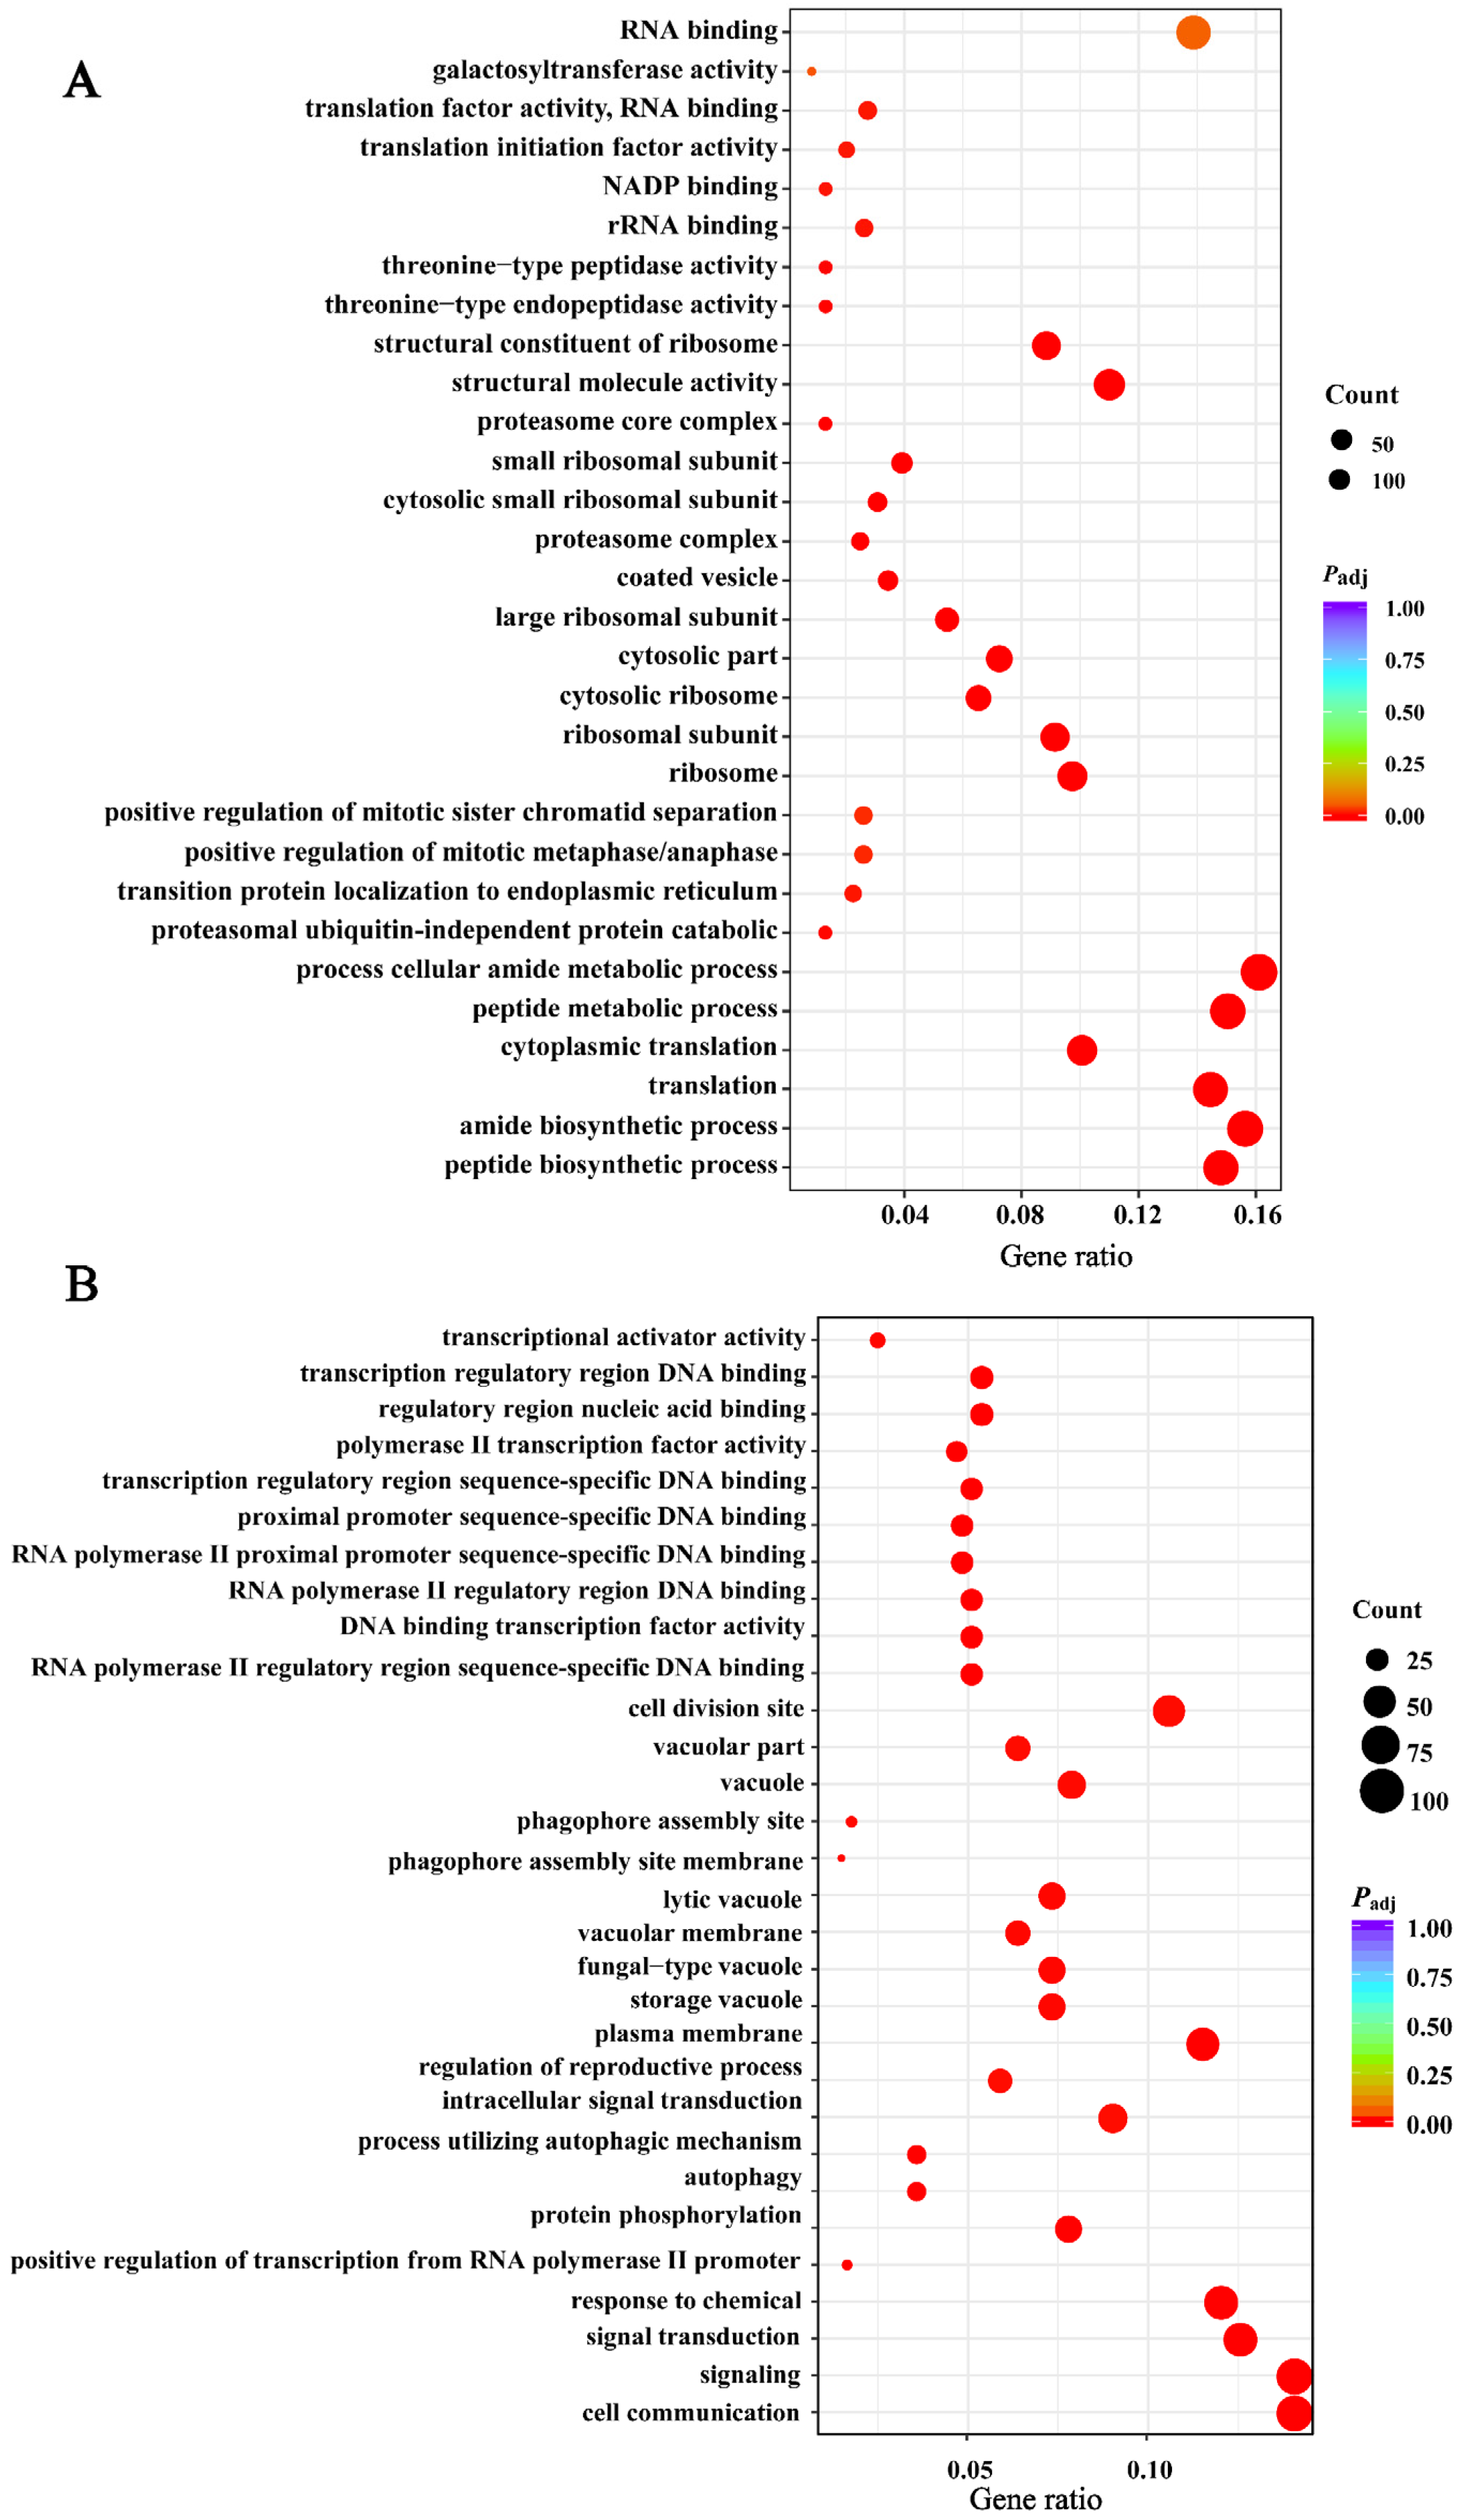
3.9. Analysis of Differential Genes for GO and KEGG Enrichment

The differential genes were enriched to 196 GO clades in the rpl1001Δ strain, including 41 molecular functions, 97 biological processes, and 58 cellular components, compared with the wild-type strain. Listed in descending order of Padj value, the top 10 up-regulated and down-regulated genes were analyzed in terms of their biological functions. The results showed that up-regulated genes were mainly enriched in peptide and amide synthesis and proteasome-mediated non-ubiquitin-dependent proteolytic metabolism in biological processes. In cellular components, up-regulated genes were mainly enriched in the ribosomal region. In molecular functions, up-regulated genes were mainly enriched in molecular structural activities and ribosomal structures (Figure 10A). Moreover, downregulated differential genes were enriched in cellular communication and autophagy processes, cytoplasmic membrane regions in cellular components, and transcriptional protein functions in molecular functions (Figure 10B). The GO enrichment results indicated that the ribosome biogenesis process of the rpl1001Δ strain was affected, that the intracellular protein formation and degradation process was destabilized, and the well-ordered order of the cell division process was disrupted.
KEGG enrichment analysis of differential gene results showed 549 differential genes were enriched in 80 pathways in the rpl1001Δ strain compared to the wild-type strain. The top 10 pathways of both up-regulated genes and down-regulated genes were taken and analyzed by Padj value (Figure 11A,B). Up-regulated genes were mainly concentrated in pathways like proteasome, ribosome and DNA replication, while down-regulated genes were enriched in pathways such as autophagy and glycolysis.
The proteasome is essential for protein and amino acid homeostasis, which controls the cell cycle, cytoskeleton, DNA replication, meiosis, or transcription [33]. In the proteasome pathway, 21 up-regulated genes were enriched (Figure 11A). In this pathway, the major genes whose expression was upregulated included rpn5, rpn8, rpn11, rpn12, and rpt4.
The regulatory subunit of the 19S proteasome is composed of proteins encoded by rpn5, rpn8, rpn11, rpn12, and rpt4 genes, which belong to the Rpn family (Figure 11C). The deficiency of Rpn5 causes accumulation of polyubiquitinated proteins, exacerbates growth defects in proteasome mutants, and leads to abnormal cell mitosis [34]. The Rpn8 protein is localized to the spindle intermediate region through the importin alpha family nuclear import signal receptor adaptor, Imp1. Rpn8 possesses metallopeptidase activity and participates in the rapid degradation of proteins assembled in the spindle’s intermediate region at the end of mitosis for efficient mitotic spindle disassembly [35]. During mitosis and meiosis, Rpn11 protein accumulates mainly at the periphery of the nucleus, and during spore formation, it diffuses from the periphery of the nucleus to the cytoplasm and regulates spore development [36]. The Rpn12 protein regulates the degradation of ubiquitin conjugates and the deficiency of this protein will hinder the degradation of cell cycle regulators, leading to the stagnation of the transition from metaphase to anaphase while affecting the normal progress of the cell cycle [37]. The rpt4 gene encodes 19S proteasome base subcomplex ATPase subunit Rpt4, which binds and hydrolyzes ATP to provide energy for meiosis. In the rpt4Δ strain, the mating efficiency and the formation of spores were decreased [25]. The abnormal expression of proteasome pathway genes suggested that cell division was affected in the rpl1001Δ strain, which was consistent with the abnormalities in sporulation and mitosis in the rpl1001Δ strain, and also consistent with the results of the GO enrichment analysis (Figure 10).

4. Discussion

The modification of the spindle polar body (SPB), assembly of forespore membrane (FSM), and formation of spore wall regulate spore formation in fission yeast [38]. The spore wall structure protein, Isp3, accumulates in the cytoplasm of the forespore and is then exported to the forespore membrane to form the outermost layer of the spore wall [30]. The anaphase-promoting complex/cyclosome (APC/C) activator, Fzr1, is a key factor in the termination of meiosis and is also involved in promoting the coordination of spore wall formation, such that more than four spores will be produced in Fzr1-deficient strains [39]. The microtubule plus-end binding protein, Mal3, belongs to the EB1 family. A Mal3 deficiency affects meiosis and spore formation, and mal3Δ strains appear to produce more than four (up to eight) spores [40]. The mating pheromone M-factor precursor is formed by the mfm1 and mfm2 genes. The pheromone is recognized by sexually opposite, specific receptors on the surface of mating cells and stimulates heterotrimeric G proteins associated with the receptors, which in turn activates the MAPK signaling pathway and regulates spore formation [41]. Proteasomal activity is necessary for meiotic nuclear division [42]. During meiosis, proteasomes are dispersed on the nucleus and interact with the mitotic and meiotic cohesin loader subunit, Pds5, which regulates meiotic chromosome spindle length and influences chromosome segregation [43]. In this study, isp3 gene expression was up-regulated and mfm1 and mfm2 gene expression was down-regulated in the rpl1001Δ strain, and KEGG enrichment analysis uncovered that 21 up-regulated genes in the proteasome pathway were significantly enriched. These key genes and pathways act in concert to regulate spore formation in meiosis, leading to a significant increase in the number of spores and the production of eight spores in the rpl1001Δ strain.
Upon entering division, microtubules, microtubule-associated proteins (MAPs), motor proteins, and other regulatory proteins form a dynamically structured bipolar spindle, which effectively captures sister chromatids. The microtubule-associated proteins organize the spindle microtubules into antiparallel microtubule overlap zones. Kinesin generates the force that separates the bipolar spindle, and the separation of the bipolar spindle in turn leads to the proper segregation of chromosomes [44,45]. Mitotic centromere-SPB clustering protein, Csi1, recruits the Alp7p-Alp14p protein complex into SPB and promotes bipolar spindle formation. After csi1 gene deletion, the cells appeared to have a monopolar spindle, causing chromosome segregation defects [46]. The SPB cell cycle signalling scaffold, Cut12, is localized in the SPB throughout the cell cycle. Monopolar spindles formed in the cut12 mutant, which led to failed chromosome segregation, and fatal cytokinesis [47]. Dis1, a protein member of the XMAP215/TOG family, is localized to mitoplasts during cytokinesis and is dependent on phosphorylation by cyclin-dependent protein kinase (Cdc2). During mitosis, Dis1 targets the kinesin-8 family plus-end directed microtubule motor, Klp5, to the centromere and participates in chromosome separation [48,49,50]. In this study, it was found that after the rpl1001Δ strain entered mitosis, the formation of bipolar spindles decreased significantly, while the proportion of monopolar spindles increased. It was also found that dis1 gene expression was down-regulated in the rpl1001Δ strain. The result indicates that the spindle was unable to generate a balanced force to push itself to segregate correctly, and the attachment process of the spindle-targeted centromere is blocked, which leads to the phenotype of uneven chromosome segregation.
Myosin II and F-actin assemble into contractile rings along the equatorial plate of the cell, and myosin undergoes ATP hydrolysis to promote the movement of actin and drive the contraction of the ring to achieve cell division [51]. During mitosis, ATP consumption is required for the formation of both actin and myosin rings [52]. When phosphorylation of myosin II regulatory light chain, Rlc1, was inhibited, myosin II heavy chain (Myo2) activity was also reduced, resulting in a significant prolongation of myosin ring assembly [53]. The paxillin-like protein, Pxl1, is a component of the myosin ring, and in the absence of Pxl1, the contraction rate of the myosin ring is significantly slower [54]. Alpha-actinin (Ain1) has molecular articulator activity, which maintains the actin cytoskeleton and participates in the assembly of actin filament bundles. In the absence of Ain1 protein, the formation of the actin ring was delayed and the formation time of theactin ring was increased [55]. Heat shock protein, Hsp16, is a related protein that stabilize the contractile ring structure composed of myosin-II and F-actin [56]. In this study, it was found that the deletion of rpl1001 gene caused the down-regulation of hsp16 and pgk1 gene expression which indicates that the structural stability of the actin-myosin ring was affected and the phosphorylation of intracellular phosphoglycerate and glycolysis were blocked, consistent with the phenotype of the prolonged assembly time of the actin and myosin rings.

5. Conclusions

This study revealed that the deletion of the rpl1001 gene caused slow cell growth, increased cell volume, elicited an abnormal number of spores, distorted microtubule dynamics, unevenly affected chromosome separation, delayed formation of actin-myosin contraction ring, and increased mitochondrial content in fission yeast cells. Analysis of the RNA-Seq sequencing results showed that the proteasome pathway, upregulation of isp3, and downregulation of mfm1 and mfm2 in the rpl1001Δ strain were the main factors underlying the increased number of spores. Down-regulation of dis1 caused the abnormal microtubule and chromosome dynamics, and down-regulation of hsp16 and pgk1 were the key genes affecting the delay of actin ring and myosin ring formation. The transcriptome data were reliable and the expression pattern of key differentially regulated genes after rpl1001 deletion was consistent with the RNA-Seq results. Altogether, the results revealed the cell cycle changes and molecular mechanisms of the rpl1001Δ strain, which shed light on the function on the Rpl1001 protein during cell division.

Supplementary Materials

The following supporting information can be downloaded at: https://www.mdpi.com/article/10.3390/cimb46030164/s1, Table S1: Statistics of the transcriptome sequencing quality analysis of the wt and rpl1001Δ strains.

Author Contributions

Y.H. conceived and designed the experiments of the present study. W.Y., R.Y. and M.L. performed the experiments. W.Y., R.Y. and K.L. analyzed the data. W.Y., R.Y., Y.H. and X.D. drafted the manuscript and revised it critically. All authors have read and agreed to the published version of the manuscript.

Funding

This research was funded by the Sichuan Province Science and Technology Support Project, grant number 2022NZZJ0003, 22ZYZFSF0009, 2022NSFSC0107 and 23ZHSF0082, and the Dazhou city-school cooperation project, grant number 2021-S05.

Institutional Review Board Statement

Not applicable.

Informed Consent Statement

Not applicable.

Data Availability Statement

Publicly available datasets were analyzed in this study.

Acknowledgments

We are grateful for the yeast strains donated by Phong Tran, Department of Cell and Developmental Biology, University of Pennsylvania.

Conflicts of Interest

The authors declare no conflicts of interest.

References

  1. Li, R.; Li, X.; Sun, L.; Chen, F.; Liu, Z.; Gu, Y.; Gong, X.; Liu, Z.; Wei, H.; Huang, Y.; et al. Reduction of ribosome level triggers flocculation of fission yeast cells. Eukaryot. Cell 2013, 12, 450–459. [Google Scholar] [CrossRef]
  2. Kim, S.J.; Strich, R. Rpl22 is required for IME1 mRNA translation and meiotic induction in S. cerevisiae. Cell Div. 2016, 11, 10. [Google Scholar] [CrossRef]
  3. Jang, C.Y.; Kim, H.D.; Zhang, X.; Chang, J.S.; Kim, J. Ribosomal protein S3 localizes on the mitotic spindle and functions as a microtubule associated protein in mitosis. Biochem. Biophys. Res. Commun. 2012, 429, 57–62. [Google Scholar] [CrossRef]
  4. Aronova, S.; Wedaman, K.; Anderson, S.; Yates, J., 3rd; Powers, T. Probing the membrane environment of the TOR kinases reveals functional interactions between TORC1, actin, and membrane trafficking in Saccharomyces cerevisiae. Mol. Biol. Cell 2007, 18, 2779–2794. [Google Scholar] [CrossRef]
  5. Mok, K.W.; Mruk, D.D.; Silvestrini, B.; Cheng, C.Y. rpS6 Regulates blood-testis barrier dynamics by affecting F-actin organization and protein recruitment. Endocrinology 2012, 153, 5036–5048. [Google Scholar] [CrossRef]
  6. Spahn, C.M.; Beckmann, R.; Eswar, N.; Penczek, P.A.; Sali, A.; Blobel, G.; Frank, J. Structure of the 80S ribosome from Saccharomyces cerevisiae--tRNA-ribosome and subunit-subunit interactions. Cell 2001, 107, 373–386. [Google Scholar] [CrossRef] [PubMed]
  7. Pollutri, D.; Penzo, M. Ribosomal Protein L10: From Function to Dysfunction. Cells 2020, 9, 2503. [Google Scholar] [CrossRef] [PubMed]
  8. Zuk, D.; Belk, J.P.; Jacobson, A. Temperature-sensitive mutations in the Saccharomyces cerevisiae MRT4, GRC5, SLA2 and THS1 genes result in defects in mRNA turnover. Genetics 1999, 153, 35–47. [Google Scholar] [CrossRef] [PubMed]
  9. Eisinger, D.P.; Dick, F.A.; Trumpower, B.L. Qsr1p, a 60S ribosomal subunit protein, is required for joining of 40S and 60S subunits. Mol. Cell. Biol. 1997, 17, 5136–5145. [Google Scholar] [CrossRef] [PubMed]
  10. Rodríguez-López, M.; Bordin, N.; Lees, J.; Scholes, H.; Hassan, S.; Saintain, Q.; Kamrad, S.; Orengo, C.; Bähler, J. Broad functional profiling of fission yeast proteins using phenomics and machine learning. eLife 2023, 12, RP88229. [Google Scholar] [CrossRef]
  11. Sajiki, K.; Tahara, Y.; Uehara, L.; Sasaki, T.; Pluskal, T.; Yanagida, M. Genetic regulation of mitotic competence in G(0) quiescent cells. Sci. Adv. 2018, 4, eaat5685. [Google Scholar] [CrossRef]
  12. Chan, Y.L.; Diaz, J.J.; Denoroy, L.; Madjar, J.J.; Wool, I.G. The primary structure of rat ribosomal protein L10: Relationship to a Jun-binding protein and to a putative Wilms’ tumor suppressor. Biochem. Biophys. Res. Commun. 1996, 225, 952–956. [Google Scholar] [CrossRef]
  13. Brooks, S.S.; Wall, A.L.; Golzio, C.; Reid, D.W.; Kondyles, A.; Willer, J.R.; Botti, C.; Nicchitta, C.V.; Katsanis, N.; Davis, E.E. A novel ribosomopathy caused by dysfunction of RPL10 disrupts neurodevelopment and causes X-linked microcephaly in humans. Genetics 2014, 198, 723–733. [Google Scholar] [CrossRef]
  14. Chiocchetti, A.; Pakalapati, G.; Duketis, E.; Wiemann, S.; Poustka, A.; Poustka, F.; Klauck, S.M. Mutation and expression analyses of the ribosomal protein gene RPL10 in an extended German sample of patients with autism spectrum disorder. Am. J. Med. Genet. Part A 2011, 155a, 1472–1475. [Google Scholar] [CrossRef]
  15. Rincon, S.A.; Paoletti, A. Molecular control of fission yeast cytokinesis. Semin. Cell Dev. Biol. 2016, 53, 28–38. [Google Scholar] [CrossRef]
  16. Hayles, J.; Nurse, P. Introduction to Fission Yeast as a Model System. Cold Spring Harb. Protoc. 2018, 2018, pdb-top079749. [Google Scholar] [CrossRef]
  17. Hales, K.G.; Fuller, M.T. Developmentally regulated mitochondrial fusion mediated by a conserved, novel, predicted GTPase. Cell 1997, 90, 121–129. [Google Scholar] [CrossRef]
  18. Kim, D.; Paggi, J.M.; Park, C.; Bennett, C.; Salzberg, S.L. Graph-based genome alignment and genotyping with HISAT2 and HISAT-genotype. Nat. Biotechnol. 2019, 37, 907–915. [Google Scholar] [CrossRef]
  19. Liao, Y.; Smyth, G.K.; Shi, W. featureCounts: An efficient general purpose program for assigning sequence reads to genomic features. Bioinformatics 2014, 30, 923–930. [Google Scholar] [CrossRef]
  20. Pertea, M.; Pertea, G.M.; Antonescu, C.M.; Chang, T.C.; Mendell, J.T.; Salzberg, S.L. StringTie enables improved reconstruction of a transcriptome from RNA-seq reads. Nat. Biotechnol. 2015, 33, 290–295. [Google Scholar] [CrossRef]
  21. Liu, S.; Wang, Z.; Zhu, R.; Wang, F.; Cheng, Y.; Liu, Y. Three Differential Expression Analysis Methods for RNA Sequencing: Limma, EdgeR, DESeq2. J. Vis. Exp. JoVE 2021, 18, e62528. [Google Scholar] [CrossRef]
  22. Yu, G.; Wang, L.G.; Han, Y.; He, Q.Y. clusterProfiler: An R package for comparing biological themes among gene clusters. Omics J. Integr. Biol. 2012, 16, 284–287. [Google Scholar] [CrossRef] [PubMed]
  23. Morigasaki, S.; Shimada, K.; Ikner, A.; Yanagida, M.; Shiozaki, K. Glycolytic enzyme GAPDH promotes peroxide stress signaling through multistep phosphorelay to a MAPK cascade. Mol. Cell 2008, 30, 108–113. [Google Scholar] [CrossRef] [PubMed]
  24. Blyth, J.; Makrantoni, V.; Barton, R.E.; Spanos, C.; Rappsilber, J.; Marston, A.L. Genes Important for Schizosaccharomyces pombe Meiosis Identified Through a Functional Genomics Screen. Genetics 2018, 208, 589–603. [Google Scholar] [CrossRef] [PubMed]
  25. Dudin, O.; Merlini, L.; Bendezú, F.O.; Groux, R.; Vincenzetti, V.; Martin, S.G. A systematic screen for morphological abnormalities during fission yeast sexual reproduction identifies a mechanism of actin aster formation for cell fusion. PLoS Genet. 2017, 13, e1006721. [Google Scholar] [CrossRef] [PubMed]
  26. Ahn, J.; Won, M.; Choi, J.H.; Kyun, M.L.; Cho, H.S.; Park, H.M.; Kang, C.M.; Chung, K.S. Small heat-shock protein Hsp9 has dual functions in stress adaptation and stress-induced G2-M checkpoint regulation via Cdc25 inactivation in Schizosaccharomyces pombe. Biochem. Biophys. Res. Commun. 2012, 417, 613–618. [Google Scholar] [CrossRef] [PubMed]
  27. Hayles, J.; Wood, V.; Jeffery, L.; Hoe, K.L.; Kim, D.U.; Park, H.O.; Salas-Pino, S.; Heichinger, C.; Nurse, P. A genome-wide resource of cell cycle and cell shape genes of fission yeast. Open Biol. 2013, 3, 130053. [Google Scholar] [CrossRef] [PubMed]
  28. Vještica, A.; Merlini, L.; Nkosi, P.J.; Martin, S.G. Gamete fusion triggers bipartite transcription factor assembly to block re-fertilization. Nature 2018, 560, 397–400. [Google Scholar] [CrossRef]
  29. Duncan, C.D.S.; Rodríguez-López, M.; Ruis, P.; Bähler, J.; Mata, J. General amino acid control in fission yeast is regulated by a nonconserved transcription factor, with functions analogous to Gcn4/Atf4. Proc. Natl. Acad. Sci. USA 2018, 115, E1829–E1838. [Google Scholar] [CrossRef]
  30. Fukunishi, K.; Miyakubi, K.; Hatanaka, M.; Otsuru, N.; Hirata, A.; Shimoda, C.; Nakamura, T. The fission yeast spore is coated by a proteinaceous surface layer comprising mainly Isp3. Mol. Biol. Cell 2014, 25, 1549–1559. [Google Scholar] [CrossRef]
  31. Kjaerulff, S.; Davey, J.; Nielsen, O. Analysis of the structural genes encoding M-factor in the fission yeast Schizosaccharomyces pombe: Identification of a third gene, mfm3. Mol. Cell. Biol. 1994, 14, 3895–3905. [Google Scholar] [CrossRef]
  32. Murase, Y.; Yamagishi, M.; Okada, N.; Toya, M.; Yajima, J.; Hamada, T.; Sato, M. Fission yeast Dis1 is an unconventional TOG/XMAP215 that induces microtubule catastrophe to drive chromosome pulling. Commun. Biol. 2022, 5, 1298. [Google Scholar] [CrossRef]
  33. Marshall, R.S.; Vierstra, R.D. Dynamic Regulation of the 26S Proteasome: From Synthesis to Degradation. Front. Mol. Biosci. 2019, 6, 40. [Google Scholar] [CrossRef]
  34. Yen, H.C.; Espiritu, C.; Chang, E.C. Rpn5 is a conserved proteasome subunit and required for proper proteasome localization and assembly. J. Biol. Chem. 2003, 278, 30669–30676. [Google Scholar] [CrossRef]
  35. Lucena, R.; Dephoure, N.; Gygi, S.P.; Kellogg, D.R.; Tallada, V.A.; Daga, R.R.; Jimenez, J. Nucleocytoplasmic transport in the midzone membrane domain controls yeast mitotic spindle disassembly. J. Cell Biol. 2015, 209, 387–402. [Google Scholar] [CrossRef]
  36. Yang, H.J.; Asakawa, H.; Ohtsuki, C.; Haraguchi, T.; Hiraoka, Y. Transient Breakage of the Nucleocytoplasmic Barrier Controls Spore Maturation via Mobilizing the Proteasome Subunit Rpn11 in the Fission Yeast Schizosaccharomyces pombe. J. Fungi 2020, 6, 242. [Google Scholar] [CrossRef]
  37. Seeger, M.; Gordon, C.; Ferrell, K.; Dubiel, W. Characteristics of 26 S proteases from fission yeast mutants, which arrest in mitosis. J. Mol. Biol. 1996, 263, 423–431. [Google Scholar] [CrossRef] [PubMed]
  38. Itadani, A.; Nakamura, T.; Hirata, A.; Shimoda, C. Schizosaccharomyces pombe calmodulin, Cam1, plays a crucial role in sporulation by recruiting and stabilizing the spindle pole body components responsible for assembly of the forespore membrane. Eukaryot. Cell 2010, 9, 1925–1935. [Google Scholar] [CrossRef] [PubMed]
  39. Aoi, Y.; Arai, K.; Miyamoto, M.; Katsuta, Y.; Yamashita, A.; Sato, M.; Yamamoto, M. Cuf2 boosts the transcription of APC/C activator Fzr1 to terminate the meiotic division cycle. EMBO Rep. 2013, 14, 553–560. [Google Scholar] [CrossRef] [PubMed]
  40. Yamashita, A.; Fujita, Y.; Yamamoto, M. Proper microtubule structure is vital for timely progression through meiosis in fission yeast. PLoS ONE 2013, 8, e65082. [Google Scholar] [CrossRef] [PubMed]
  41. Merlini, L.; Dudin, O.; Martin, S.G. Mate and fuse: How yeast cells do it. Open Biol. 2013, 3, 130008. [Google Scholar] [CrossRef] [PubMed]
  42. Wen, F.P.; Guo, Y.S.; Hu, Y.; Liu, W.X.; Wang, Q.; Wang, Y.T.; Yu, H.Y.; Tang, C.M.; Yang, J.; Zhou, T.; et al. Distinct temporal requirements for autophagy and the proteasome in yeast meiosis. Autophagy 2016, 12, 671–688. [Google Scholar] [CrossRef] [PubMed]
  43. Yang, X.; Song, M.; Wang, Y.; Tan, T.; Tian, Z.; Zhai, B.; Yang, X.; Tan, Y.; Cao, Y.; Dai, S.; et al. The ubiquitin-proteasome system regulates meiotic chromosome organization. Proc. Natl. Acad. Sci. USA 2022, 119, e2106902119. [Google Scholar] [CrossRef] [PubMed]
  44. Tanenbaum, M.E.; Medema, R.H. Mechanisms of centrosome separation and bipolar spindle assembly. Dev. Cell 2010, 19, 797–806. [Google Scholar] [CrossRef] [PubMed]
  45. Walczak, C.E.; Heald, R. Mechanisms of mitotic spindle assembly and function. Int. Rev. Cytol. 2008, 265, 111–158. [Google Scholar] [CrossRef] [PubMed]
  46. Zheng, F.; Li, T.; Jin, D.Y.; Syrovatkina, V.; Scheffler, K.; Tran, P.T.; Fu, C. Csi1p recruits alp7p/TACC to the spindle pole bodies for bipolar spindle formation. Mol. Biol. Cell 2014, 25, 2750–2760. [Google Scholar] [CrossRef] [PubMed]
  47. Bridge, A.J.; Morphew, M.; Bartlett, R.; Hagan, I.M. The fission yeast SPB component Cut12 links bipolar spindle formation to mitotic control. Genes Dev. 1998, 12, 927–942. [Google Scholar] [CrossRef]
  48. Aoki, K.; Nakaseko, Y.; Kinoshita, K.; Goshima, G.; Yanagida, M. CDC2 phosphorylation of the fission yeast dis1 ensures accurate chromosome segregation. Curr. Biol. 2006, 16, 1627–1635. [Google Scholar] [CrossRef]
  49. Garcia, M.A.; Vardy, L.; Koonrugsa, N.; Toda, T. Fission yeast ch-TOG/XMAP215 homologue Alp14 connects mitotic spindles with the kinetochore and is a component of the Mad2-dependent spindle checkpoint. EMBO J. 2001, 20, 3389–3401. [Google Scholar] [CrossRef]
  50. Garcia, M.A.; Koonrugsa, N.; Toda, T. Spindle-kinetochore attachment requires the combined action of Kin I-like Klp5/6 and Alp14/Dis1-MAPs in fission yeast. EMBO J. 2002, 21, 6015–6024. [Google Scholar] [CrossRef]
  51. East, D.A.; Mulvihill, D.P. Regulation and function of the fission yeast myosins. J. Cell Sci. 2011, 124, 1383–1390. [Google Scholar] [CrossRef] [PubMed]
  52. Deng, J.; Walther, A. ATP-Responsive and ATP-Fueled Self-Assembling Systems and Materials. Adv. Mater. 2020, 32, e2002629. [Google Scholar] [CrossRef] [PubMed]
  53. Sladewski, T.E.; Previs, M.J.; Lord, M. Regulation of fission yeast myosin-II function and contractile ring dynamics by regulatory light-chain and heavy-chain phosphorylation. Mol. Biol. Cell 2009, 20, 3941–3952. [Google Scholar] [CrossRef] [PubMed]
  54. Ge, W.; Balasubramanian, M.K. Pxl1p, a paxillin-related protein, stabilizes the actomyosin ring during cytokinesis in fission yeast. Mol. Biol. Cell 2008, 19, 1680–1692. [Google Scholar] [CrossRef]
  55. Laporte, D.; Ojkic, N.; Vavylonis, D.; Wu, J.Q. α-Actinin and fimbrin cooperate with myosin II to organize actomyosin bundles during contractile-ring assembly. Mol. Biol. Cell 2012, 23, 3094–3110. [Google Scholar] [CrossRef]
  56. Pivovarova, A.V.; Mikhailova, V.V.; Chernik, I.S.; Chebotareva, N.A.; Levitsky, D.I.; Gusev, N.B. Effects of small heat shock proteins on the thermal denaturation and aggregation of F-actin. Biochem. Biophys. Res. Commun. 2005, 331, 1548–1553. [Google Scholar] [CrossRef]
Figure 1. The rpl1001 gene location and the Rpl1001 protein structure. (A) Location of the rpl1001 gene. The figure is derived from the PomBase (https://www.pombase.org/, accessed on 28 November 2023). (B) Predicted structure of the Rpl1001 protein. (C) PDB structure of the Rpl1001 protein. The blue part shows the predicted structure of the Rpl1001 protein (PDB ID: 8EUI).
Cimb 46 00164 g001
Figure 2. Changes of cell growth and spore production in the rpl1001Δ strain. (A) Growth curves of the wt and rpl1001Δ strains (n = 3). (B) Spore morphology in the wt and rpl1001Δ strains, scale bar: 2 μm. (C) Spore number analysis in the wt and rpl1001Δ strains (n = 1500). OD, optical density. * p < 0.05, ** p < 0.01.
Cimb 46 00164 g002
Figure 3. Changes in microtubules in the rpl1001Δ strain during interphase. (A) Morphological images of MTs in the wt and rpl1001Δ strains, white dotted lines indicate cell outlines. (B) Analysis of MT number in the wt and rpl1001Δ strains (n = 60). (C) Analysis of MT length in the wt and rpl1001Δ strains (n = 80), the black dot indicates outlier. GFP-Atb2, green fluorescent protein-tubulin α2. ** p < 0.01.
Cimb 46 00164 g003
Figure 4. Changes of chromosome and spindle in the rpl1001Δ strain during mitosis. (A) Time-lapse images of chromosome and spindle in the wt and rpl1001Δ strains during whole mitosis. Each frame corresponded to a 90 s interval, rpl1001Δ (a) showed chromosome fragmentation and uneven segregation, rpl1001Δ (b) showed normal chromosomal segregation. (B) Formation type of spindle morphology in the wt and rpl1001Δ strains; 0 min indicates complete disintegration of interphase MTs. (C) Morphology of the wt and rpl1001Δ strains spindle breakage types, white dotted lines indicate cell outlines. (D) Spindle formation mode statistics in the wt and rpl1001Δ strains (n = 60). (E) Spindle breakage mode statistics in the wt and rpl1001Δ strains (n = 60). (F) Spindle elongation curve in the wt and rpl1001Δ strains during mitosis (n = 20), dotted lines indicate transition from prophase to metaphase, short linear lines indicate transition from metaphase to anaphase. (G) The total time from formation to breakage of the spindle in the wt and rpl1001Δ strains (n = 20). (H) Final length of spindle in the wt and rpl1001Δ strains (n = 20). (I) Spindle elongation time of the wt and rpl1001Δ strains (n = 20). (J) Spindle elongation rate in the wt and rpl1001Δ strains (n = 20). The black dots indicate outliers. GFP-Atb2, green fluorescent protein-tubulin α2; Hht1-RFP, histone H3-red fluorescent protein. * p < 0.05, ** p < 0.01.
Cimb 46 00164 g004
Figure 5. Changes of cell morphology in the rpl1001Δ strain. (A) Cell morphology of different phases in the wt and rpl1001Δ strains during mitosis. (B) Cell length of different phases in the wt and rpl1001Δ strains during mitosis (n = 20), the black dot indicates outlier. (C) Cell breadth of different phases in the wt and rpl1001Δ strains during mitosis (n = 20). GFP-Atb2, green fluorescent protein-tubulin α2; Hht1-RFP, histone H3-red fluorescent protein. * p < 0.05, ** p < 0.01.
Cimb 46 00164 g005
Figure 6. Changes in the actin ring in the rpl1001Δ strain during mitosis. (A) Time-lapse images of the actin ring in the wt and rpl1001Δ strains during whole mitosis. Each frame corresponds to a 90 s interval. (B) Actin ring dynamics curve in the wt and rpl1001Δ strains during cell mitosis (n = 30), dotted lines indicate transition from formation to the contraction period of actin ring. (C) Actin ring length of the wt and rpl1001Δ strains during mitosis (n = 30). (D) Actin ring formation and contraction time of the wt and rpl1001Δ strains during mitosis (n = 30). (E) Actin ring contraction rate of the wt and rpl1001Δ strains (n = 30). The black dots indicate outliers. Pact1-LifeAct-mGFP, actin-LifeAct-mutant green fluorescent protein. ** p < 0.01.
Cimb 46 00164 g006
Figure 7. Changes of myosin ring in the rpl1001Δ strain during mitosis. (A) Time-lapse images of myosin ring in the wt and rpl1001Δ strains during whole mitosis. Each frame corresponded to 120 s interval. (B) Myosin ring dynamics curve in the wt and rpl1001Δ strains during cell mitosis (n = 20), dotted lines indicate transition from formation to the contraction period of myosin ring. (C) Myosin ring length in the wt and rpl1001Δ strains during mitosis (n = 20). (D) Myosin ring formation and contraction time of the wt and rpl1001Δ strains (n = 20). (E) Myosin ring contraction rate of the wt and rpl1001Δ strains (n = 20). The black dots indicate outliers. Rlc1-GFP, myosin II regulatory light chain-green fluorescent protein. ** p < 0.01.
Cimb 46 00164 g007
Figure 8. Mitochondrial changes in the rpl1001Δ strain. (A) Morphological images of mitochondria in the wt and rpl1001Δ strains. (B) Mitochondrial fluorescence intensity of the wt and rpl1001Δ strains (n = 60). (C) Mitochondrial fluorescence intensity of daughter cells in the wt and rpl1001Δ strains (n = 60). (D) Ratio of mitochondrial fluorescence intensity of daughter cells in the wt and rpl1001Δ strains (n = 60). Mitochondrial fluorescence intensity ratio in daughter cells represents the ratio of the higher mitochondrial fluorescence intensity value to the lower mitochondrial fluorescence intensity value in the two daughter cells obtained after cell division. The black dots indicate outliers. Cox4-GFP, cytochrome coxidase 4-green fluorescent protein. ** p < 0.01.
Cimb 46 00164 g008
Figure 9. Analysis of highly expressed genes and differentially expressed genes, and qRT-PCR verification of key differentially expressed genes. (A) Differential analysis of highly expressed genes in the wt and rpl1001Δ strains. (B) Volcano plot of differently expressed genes in the wt and rpl1001Δ strains. (CF) Relative mRNA expression of isp3, mfm1, pgk1, and tdh1 measured by qRT-PCR in the wt and rpl1001Δ strains. * p < 0.05, ** p < 0.01.
Cimb 46 00164 g009
Figure 10. The GO enrichment results of differentially expressed genes in the wt and rpl1001Δ strains. (A) GO enrichment results for up-regulated differential genes. (B) GO enrichment results for down-regulated differential genes.
Cimb 46 00164 g010
Figure 11. The KEGG enrichment results of differentially expressed genes in the wt and rpl1001Δ strains. (A) KEGG enrichment results for upregulated differential genes. (B) KEGG enrichment results for downregulated differential genes. (C) Schematic of the process of proteasome lid assembly and the process of proteasome regulation.
Cimb 46 00164 g011
Table 1. List of experimental strains.
StrainsGenotypesSource
PT286h- wt ade6-210 leu1-32 ura4-D18Lab. Trans 1
PT287h+ wt ade6-210 leu1-32 ura4-D18Lab. Trans
PT4436h- Hht1-RFP-KanR GFP-Atb2-KanR ade6-210 leu1-32 ura4-D18Lab. Trans
PT3850h+ Pact1-LifeAct-mGFP::leu1Lab. Trans
PT2006h- Rlc1-GFP::ura4 leu1-32Lab. Trans
YL18h- mCherry-Atb2-HygR Cox4-GFP::leu2 ade6-210 leu1-32 ura4-D18This study
2599-1h+ rpl1001Δ::kanRThis study
2599-2h- rpl1001Δ::kanRThis study
2599-3h? rpl1001Δ::kanR Hht1-RFP-KanR GFP-Atb2-KanR ade6-210 leu1-32 ura4-D18This study
2599-4h? rpl1001Δ:: kanR Pact1-LifeAct-mGFP::leu1This study
2599-5h? rpl1001Δ:: kanR Rlc1-GFP::ura4This study
2599-6h? rpl1001Δ:: kanR mCherry-Atb2-HygR Cox4-GFP::leu2 ade6-210 leu1-32 ura4-D18This study
1 Laboratory of Associate Professor Phong Tran.
Table 2. Primer sequences used for qRT-PCR.
GeneForward Primer (5′→3′)Reverse Primer (5′→3′)
isp3TTT GGT GAT GGT GAC TGC GAGAG TGG ATC AGG GCA GGT TC
mfm1TG GAC TCA ATG GCT AAC TCC GA ACG TAG GCA AGA AAA GTG GC
pgk1C TTG AAG CCT GTT GCT GCT GTC CTC GAT GTG GAA ACG CAA
tdh1TC GTC AAG CTC GTC TCT TGGG CAT TGC CTT TAA GCA CCC A
act1CCC AAA TCC AAC CGT GAG AAGCC AGA GTC CAA GAC GAT ACC AGT G
Table 3. Highly expressed genes in the wt and rpl1001Δ strains.
GeneFPKM (wt)FPKM (rpl1001Δ)Description
zym113,760.94601.6Metallothionein, Zym1
gpd315,353.56102.4Glyceraldehyde 3-phosphate dehydrogenase, Gpd3
hsp97879.57169.7Heat shock protein, Hsp9
fba16012.56445.7Fructose-bisphosphate aldolase, Fba1
tdh15679.26817.2Glyceraldehyde-3-phosphate dehydrogenase, Tdh1
eno1015927.25517.0Enolase
tef1034107.54608.1Translation elongation factor EF-1 alpha Ef1a-c
hsp166429.33209.0Heat shock protein, Hsp16
pgk14919.32722.2Phosphoglycerate kinase, Pgk1
Table 4. Upregulated DEGs in the wt and rpl1001Δ strains.
Genelog2 Fold ChangePadjDescription
mat2-Pc11.81.3 × 10−18Silenced P-specific polypeptide Pc
Tf2-137.91.4 × 10−8Retrotransposable element/transposon Tf2-type
mat2-Pi7.62.2 × 10−6Silenced P-specific polypeptide Pi
aim275.87.4 × 10−4ER membrane protein complex subunit Aim27
pdc1025.81.4 × 10−10Pyruvate decarboxylase
str35.71.2 × 10−11Siderophore-iron transporter Str3
ftm45.31.6 × 10−63S. pombe specific 5Tm protein family
shu14.72.0 × 10−9Heme import protein Shu1
isp34.05.4 × 10−13Schizosaccharomyces pombe specific protein Isp3
fmp403.84.3 × 10−2UPF0061 family mitochondrial protein
Table 5. Downregulated DEGs in the wt and rpl1001Δ strains.
Genelog2 Fold ChangePadjDescription
mat3-Mc−6.06.8 × 10−5Mating-type m-specific HMG-box transcription factor Mc at silenced MAT3 locus
mfm1−3.13.3 × 10−28M-factor precursor Mfm1
mfm2−2.59.2 × 10−17M-factor precursor Mfm2
mam1−2.41.5 × 10−24M-factor transmembrane transporter Mam1
mel1−2.44.7 × 10−9Alpha-galactosidase, melibiase
pcm2−2.37.8 × 10−67Protein-L-isoaspartate O-methyltransferase Pcm2
ftm7−2.22.7 × 10−3S. pombe specific 5Tm protein family
hry1−2.14.6 × 10−6HHE domain cation binding protein
arg4−2.11.4 × 10−3Arginine specific carbamoyl-phosphate synthase Arg4
dis1−2.08.2 × 10−45TOG/XMAP14 microtubule-associated protein Dis1
Disclaimer/Publisher’s Note: The statements, opinions and data contained in all publications are solely those of the individual author(s) and contributor(s) and not of MDPI and/or the editor(s). MDPI and/or the editor(s) disclaim responsibility for any injury to people or property resulting from any ideas, methods, instructions or products referred to in the content.

