Abstract
Digestive system cancer and COVID-19 significantly affect the digestive system, but the mechanism of interaction between COVID-19 and the digestive system cancers has not been fully elucidated. We downloaded the gene expression of COVID-19 and seven digestive system cancers (oral, esophageal, gastric, colorectal, hepatocellular, bile duct, pancreatic) from GEO and identified hub differentially expressed genes. Multiple verifications, diagnostic efficacy, prognostic analysis, functional enrichment and related transcription factors of hub genes were explored. We identified 23 common DEGs for subsequent analysis. CytoHubba identified nine hub genes (CCNA2, CCNB1, CDKN3, ECT2, KIF14, KIF20A, KIF4A, NEK2, TTK). TCGA and GEO data validated the expression and excellent diagnostic and prognostic ability of hub genes. Functional analysis revealed that the processes of cell division and the cell cycle were essential in COVID-19 and digestive system cancers. Furthermore, six related transcription factors (E2F1, E2F3, E2F4, MYC, TP53, YBX1) were involved in hub gene regulation. Via in vitro experiments, CCNA2, CCNB1, and MYC expression was verified in 25 colorectal cancer tissue pairs. Our study revealed the key biomarks and common pathogenesis of digestive system cancers and COVID-19. These may provide new ideas for further mechanistic research.
1. Introduction
With lifestyle changes, digestive system cancer incidence and mortality are increasing gradually worldwide, where digestive system cancers significantly harm human health [1]. Statistically, digestive system cancer incidence comprises ~30% of cancer cases worldwide and ~40% of deaths related to cancer worldwide [2]. The most recent US data stated that approximately 348,840 new digestive system cancer cases and 172,010 new digestive system cancer deaths may occur in the US in 2023 [3].
While different digestive system cancers demonstrate apparent heterogeneity, their occurrence and development are closely related to the human immune system, digestive tract microorganisms, and dietary habits [4,5]. These findings suggested that there may be common developmental mechanisms and biological links among digestive system cancers. Research statistics [6,7] determined that the common digestive system cancers are oral cancer (OC) [8], esophageal cancer (ESC) [9], gastric cancer (GC) [10], colorectal cancer (CRC) [11], hepatocellular cancer (HCC) [12], bile duct carcinoma (BDC) [13], and pancreatic cancer (PC) [14]. The underlying molecular regulatory mechanisms shared by these seven digestive system cancers must be explored further.
Since the first case of pneumonia of unknown cause was reported in December 2019, severe acute respiratory syndrome coronavirus 2 (SARS-CoV-2) has spread rapidly worldwide, posing a significant threat to human health. Severe COVID-19 might also be accompanied by various complications, such as pneumonia, acute respiratory distress syndrome, and sepsis [15], which might be related to the immune dysfunction and cytokine storm caused by COVID-19 [16,17]. Simultaneously, many studies reported that many patients infected with the SARS-CoV-2 also have gastrointestinal symptoms, which include anorexia, nausea, vomiting, diarrhea, and abdominal pain. These patients face a greater chance of developing severe disease, and they might face a worse outcome and higher risk of death [18]. Further investigations determined that the novel coronavirus mainly acts on ACE2 receptor-positive cells, where ACE2 receptor expression is highest in intestinal cells, including the small intestine, colon, and duodenum. Compared with the lung, the digestive organs have higher ACE2 expression levels [19]. These findings indicated that in addition to intestinal inflammation caused by the systemic inflammatory response due to SARS-CoV-2, the virus may also directly affect the digestive system by attacking intestinal cells [20].
A 2023 study noted that COVID-19 infection can also lead to long-term coronavirus sequelae. This debilitating post-infection multisystem disease impairs the ability to perform daily activities [21]. The gastrointestinal tract is also one of the main sites affected by the long-term sequelae of COVID-19, and the acute-phase immune system disorder will persist in the sequelae phase [22,23]. At the same time, COVID-19 sequelae can affect the survival of patients with cancer and cancer treatment continuity [24,25].
The above evidence indicated that the digestive system is one of the main sites of the novel coronavirus infection. Considering the long-term immune system effects of the novel coronavirus, digestive diseases, specifically digestive system cancers, might be closely related to the novel coronavirus [26]. Therefore, their potential common molecular action mechanism warrants further discussion.
Therefore, the study objective was to ascertain common hub genes between seven digestive system cancers and SARS-CoV-2 infection through multi-dimensional analysis and explore their molecular action mechanisms. We also analyzed the diagnostic, prognostic, transcription factors, and co-expressed genes of hub genes. Then, the expression trend of these hub genes was verified in several gene data sets. The common hub genes of the seven digestive system cancers and COVID-19 may provide new insights into the biological mechanisms of these eight diseases.
2. Materials and Methods
2.1. Data Source
GSE30784 (OC), GSE44021 (ESC), GSE29272 (GC), GSE106582 (CRC), GSE102079 (HCC), GSE26566 (BDC), and GSE62165 (PC) were used as the training sets. We downloaded these datasets from the database of Gene Expression Omnibus (GEO) [27] (http://www.ncbi.nlm.nih.gov/geo, accessed on 1 December 2022).
The first batch of test sets came from TCGA TPM (transcripts per million) and was analyzed with Xiantao online tools (https://www.xiantaozi.com/, accessed on 1 December 2022). As very little normal tissue matches pancreatic cancer, TCGA+GTEX was used instead. The Cancer Genome Atlas (TCGA) data of the Xiantao online tools were updated in August 2022.
GSE37991 (OC), GSE96668 (ESC+GC), GSE66229 (GC), GSE44076 (CRC), GSE112790 (HCC), GSE60979 (BDC+PC), and GSE15471 (PC) were used as the second batch of test sets. The GEO datasets were converted and annotated by Perl or R software.
2.2. Identification of Differentially Expressed Genes (DEGs)
We obtained the DEGs in the datasets of GEO by the R packages limma or DESeq2. Only the genes with adjusted p < 0.05 and |logFC| ≥ 0.585 were identified as DEGs. The R packages VennDiagram and plotrix were used to obtain the intersecting upregulated or downregulated DEGs of the eight diseases, which were identified as common DEGs.
2.3. Gene Ontology (GO), Kyoto Encyclopedia of Genes and Genomes (KEGG), and Protein–Protein Interaction (PPI) Network Construction of Common DEGs
The enrichment of the common DEGs were analyzed with KEGG and GO using the R package clusterProfiler to identify the functions, biological pathways, and cell location [28,29,30]. p < 0.05 was considered a significant result. The enrichment analysis results were visualized with the R packages enrichplot and ggplot2.
STRING is a Global Biodata Coalition and ELIXIR Core Data Resource. It is utilized to determine the relationship between genes or proteins of interest [31] (STRING: https://cn.string-db.org,version 11.5, accessed on 13 March 2023). Interactions with a combined score >0.4 were considered statistically significant. The PPI network was visualized with Cytoscape 3.9.1.
2.4. Selection and Analysis of Hub Genes
The hub genes were identified using the Cytoscape cytoHubba plug-in. Here, we used common algorithms of degree to evaluate and select nine hub genes. Subsequently, we constructed a network of the co-expression of these nine hub genes using GeneMANIA (http://www.genemania.org/, accessed on 21 February 2023). GeneMANIA finds other genes that are related to a set of input genes. These genes have association data, including protein and genetic interactions, pathways, co-expression, co-localization, and protein domain similarity. Finally, the KEGG and GO analyses of the hub genes were conducted.
2.5. Validation of Hub Genes in TCGA and GEO Datasets of Seven Cancers
The expression and diagnostic receiver operating characteristic (ROC) of nine hub genes were verified in TCGA datasets (first batch of test sets). Then, the area under the ROC curves (AUC) was calculated to represent the diagnostic value of the expression level. These analyses were conducted through the Xiantao online ROC curves. The expression of the nine hub genes was also verified in another seven GEO datasets (second batch of test sets). p < 0.05 was considered significant.
2.6. Hub Gene Blood Expression and Diagnostic Value in HCC and COVID-19
The expression levels of four GEO datasets were assessed through the R packages limma or DESeq2. The differential expression of these hub genes was examined between normal and HCC (GSE114564), hepatitis and HCC (GSE114564), and normal and COVID-19 in GSE171110 and GSE152418. The independent diagnostic efficiency of the nine hub genes was presented in the aforementioned datasets. The ROC diagnostic model efficiency of the hub genes in blood was also determined.
2.7. Hub Gene Prognostic Value in OC, HCC, and PC
To examine the correlation between the nine hub genes and prognosis, we used Kaplan–Meier to assess the overall survival (OS) between high- and low-expression groups in OC, PC, and HCC. The analyses were performed on Xiantao online tools (auto select best truncation value).
2.8. Transcription Factors Predicting Hub Genes and Verification in TCGA
Transcriptional Regulatory Relationships Unraveled by Sentence-based Text (TRRUST) mining (https://www.grnpedia.org/trrust/, accessed on 21 February 2023) is a database for predicting transcriptional regulatory networks containing the target genes corresponding to transcription factors and the inter-transcription factor regulatory relationships [32].
The transcription factors that regulate the hub genes were obtained through the TRRUST database, and an adjusted p < 0.05 was considered significant. Subsequently, we verified the expression levels of these transcription factors in TCGA datasets of the seven cancers on the Xiantao online tool.
2.9. qRT-PCR
CRC tissues and corresponding adjacent colorectal tissues were obtained from the First Affiliated Hospital of Guangxi Medical University between April 2022 and September 2022. A total of 25 pairs of tissues were analyzed. The patients from whom the tissues were obtained underwent surgery at our hospital. All patients provided their written informed consent before tissue collection. The study was approved by the First Affiliated Hospital of Guangxi Medical University ethics committee.
Inclusion criteria: 1. Age older than 18 years old; 2. Patients diagnosed with colorectal cancer for the first time and undergoing surgical resection; 3. The postoperative pathological specimen was diagnosed as colorectal adenocarcinoma by two pathologists. Exclusion criteria; 1. Patients who refused to participate in this study; 2. Patients with postoperative pathological diagnosis of non adenocarcinoma.
All samples were stored at −80 °C until use. Total RNA was extracted with TRIzol (No. B511321; Sangon Biotech, Shanghai, China). Complementary DNA (cDNA) was synthesized by a SweScript RT II First Strand cDNA Synthesis Kit (No. G3333, Servicebio, Wuhan, China). Gene expression was measured using 2× Universal Blue SYBR Green qPCR Master Mix (No. G3326, Servicebio). Relative gene expression was normalized through GAPDH and calculated by the comparative threshold cycle (2−ΔΔCt) method.
The following primer sequences were used: GAPDH, forward: GGAAGCTTGTCATCAATGGAAATC and reverse: TGATGACCCTTTTGGCTCCC; CCNA2, forward: AGTAAGACTGGCATCCAAGAAGT and reverse: GGTTTGCTCTCTGGTTTTACTCT. CCNB1, forward: AATAAGGCGAAGATCAACATGGC and reverse: TTTGTTACCAATGTCCCCAAGAG. MYC, forward: GTCAAGAGGCGAACACACAAC and reverse: TTGGACGGACAGGATGTATGC.
2.10. Statistical Analysis
The statistical analysis was performed using R 4.2.3. p < 0.05 was considered statistically significant.
3. Results
3.1. Identification of Common DEGs in Training Sets of Seven Cancers and COVID-19
Figure 1 depicts the main steps of the study. Table 1 presents the basic information of the eight training datasets. After standardizing the GEO dataset gene expression, we identified the DEGs (3359 in GSE30784, 1994 in GSE44021, 875 in GSE29272, 1597 in GSE106582, 2029 in GSE102079, 7214 in GSE26566, 4942 in GSE62165, 6262 in GSE171110) and obtained 23 common DEGs (Figure 2A,B) (22 upregulated genes and 1 downregulated gene) between the seven digestive system cancers and COVID-19 (Table 2).
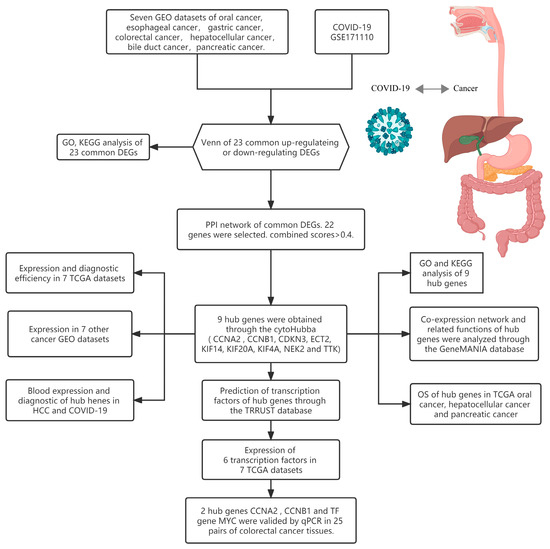
Figure 1.
Research design flow chart.

Table 1.
Basic information on seven cancers and COVID-19.
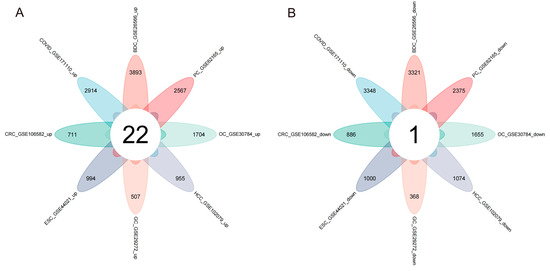
Figure 2.
Venn diagram of upregulated and downregulated common DEGs in the eight diseases. (A) Twenty-two overlapping upregulated DEGs. (B) One overlapping downregulated DEG.
Table 2.
Common downregulated and upregulated genes.
3.2. GO, KEGG, and PPI Network of Common DEGs
The biological functions and pathways among the 23 common DEGs were analyzed with the KEGG pathway and GO analyses (Figure 3A,B). GO analysis demonstrated that the genes were enriched in many biological processes (nuclear division, organelle fission, nuclear chromosome segregation) and molecular functions (microtubule binding, tubulin binding, microtubule motor activity). KEGG analysis demonstrated enrichment for cell cycle, Relaxin signaling pathway, human papillomavirus infection, hepatitis B, viral carcinogenesis, human T-cell leukemia virus 1 infection, and other pathways. These findings suggested that cell cycle, genetic material changes, and virus might be essential in the seven cancers and COVID-19.
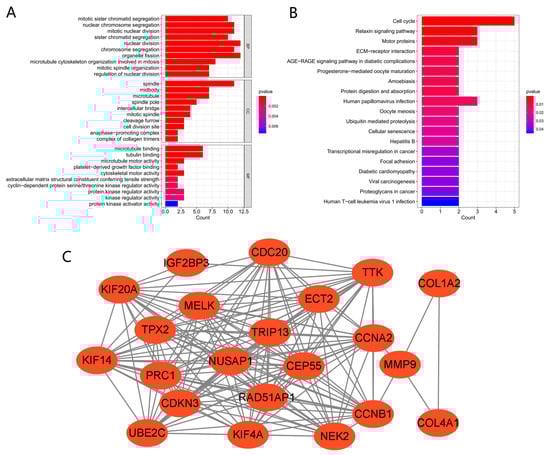
Figure 3.
GO, KEGG, and PPI network of common DEGs. (A,B) KEGG and GO pathway enrichment analysis results. p < 0.05 was considered significant. (C) PPI network. Red indicates upregulated genes.
A PPI network of the shared DEGs with combined scores >0.4 was constructed using Cytoscape, where the result contained 22 nodes and 161 interaction pairs (Figure 3C). These PPI network genes were all upregulated in the seven cancers and COVID-19.
3.3. Establishment, GeneMANIA, GO, and KEGG Analysis of Hub Genes
CytoHubba identified nine common hub genes (CCNA2, CCNB1, CDKN3, ECT2, KIF14, KIF20A, KIF4A, NEK2, TTK) (Figure 4A). These nine genes were all upregulated in the seven cancers and COVID-19. We analyzed the co-expression networks and related functions of these genes based on the GeneMANIA database. These genes yielded a complex PPI network with 83.18% co-expression, 7.48% shared protein domains, 4.71% predicted, 2.65% co-localization, and 1.99% physical interactions (Figure 4B).
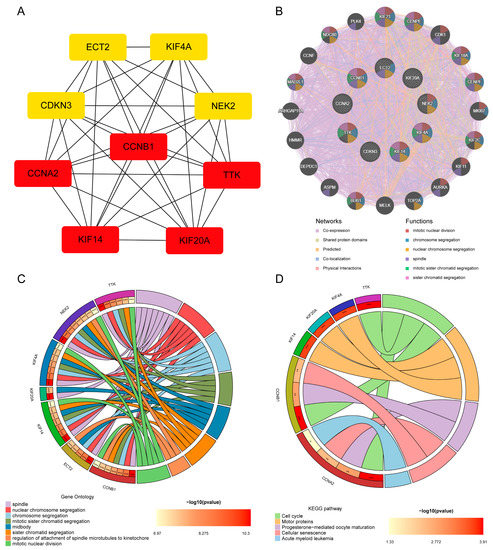
Figure 4.
Hub gene analysis. (A) Network of PPI of the top nine hub genes from cytoHubba. (B) Hub genes and their co-expression genes were analyzed via GeneMANIA. (C,D) Analysis by GO and KEGG of hub gene enrichment. (* p < 0.05; ** p < 0.01; *** p < 0.001).
GO examination demonstrated that these genes are primarily involved in the spindle, nuclear chromosome segregation, chromosome segregation, mitotic sister chromatid segregation, midbody, sister chromatid segregation, regulation of attachment of spindle microtubules to the kinetochore, and mitotic nuclear division (Figure 4C). Furthermore, KEGG pathway analysis demonstrated that they are mainly involved in the cell cycle, motor proteins, progesterone-mediated oocyte maturation, cellular senescence, and acute myeloid leukemia (Figure 4D). These results re-emphasize the importance of cell cycle and genetic material changes in the seven cancers and COVID-19.
3.4. Hub Gene Expression Validation and Diagnostic Efficiency in TCGA Datasets
To verify the reliability of the levels of expression of these hub genes, we examined their levels of expression in seven digestive system cancers from TCGA datasets. Table 3 depicts the basic data information of the seven TCGA datasets. In comparison with normal tissues, the hub genes were all significantly upregulated in cancer (Figure 5A–G). The AUC demonstrated that the nine hub genes had excellent diagnostic efficiency in the seven digestive system cancers (AUC: OC ≥ 0.914, ESC ≥ 0.923, GC ≥ 0.913, CRC ≥ 0.888, HCC ≥ 0.947, BDC ≥ 0.994, PC ≥ 0.984, Figure 5H–N).
Table 3.
Basic information of the seven TCGA datasets.
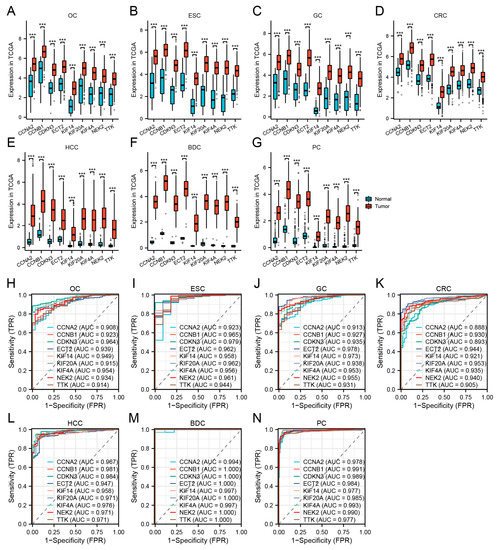
Figure 5.
Validation of hub genes in TCGA. (A–G) Hub gene expression levels of OC (A), ESC (B), GC (C), CRC (D), HCC (E), BDC (F), and PC (G) in TCGA cohorts. (H–N) Diagnostic AUCs in seven TCGA cohorts. (*** p < 0.001).
3.5. Secondary Validation of Hub Gene Expression in Seven Cancer GEO Datasets
The nine hub genes were validated again in GSE37991 (OC), GSE96668 (ESC+GC), GSE66229 (GC), GSE44076 (CRC), GSE112790 (HCC), GSE60979 (BDC+PC), and GSE15471 (PC). Table 4 lists the basic data information of the seven cancer test sets. Similarly, the high expression of hub genes was confirmed in the seven digestive system cancers (Figure 6A–G).
Table 4.
Basic information of seven cancer GEO datasets.
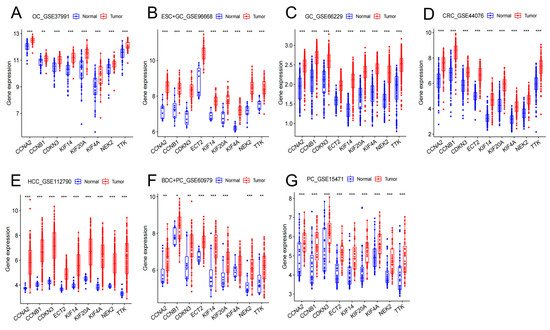
Figure 6.
Hub gene expression levels in GSE37991 (A), GSE96668 (B), GSE66229 (C), GSE44076 (D), GSE112790 (E), GSE60979 (F), GSE15471 (G). (* p < 0.05; ** p < 0.01; *** p < 0.001).
3.6. Blood Diagnostic Value of Hub Genes in HCC and COVID-19
Three datasets were used for verification to evaluate the value of the nine hub genes in blood. Table 5 presents the basic data of the blood datasets. The nine hub genes in the blood of patients with HCC exhibited the same upregulating trend as that of the samples between healthy people and those with hepatitis (Figure 7A,D). Blood testing was able to distinguish HCC from healthy people or those with hepatitis (AUC ≥ 0.940, Figure 7B,E).
Table 5.
Basic data of blood GEO datasets.
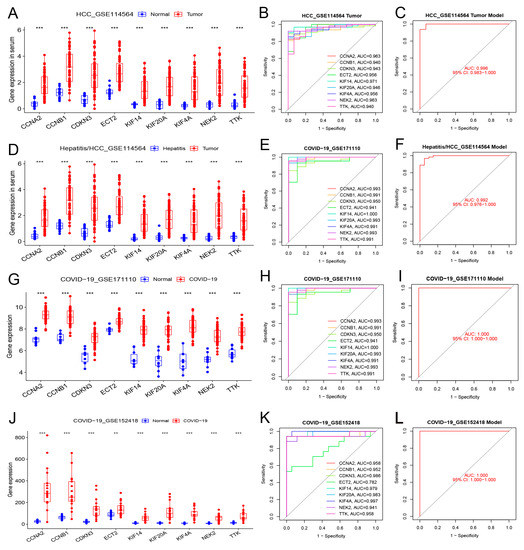
Figure 7.
Differential expression, independent diagnostic efficiency, and receiver operating characteristic (ROC) diagnostic model efficiency of hub genes in the blood of patients with HCC and COVID-19. (A–C) Differential expression, diagnostic efficiency, and ROC diagnostic model between normal tissue and HCC (GSE114564). (D–F) Differential expression, diagnostic efficiency, and ROC diagnostic model between hepatitis and HCC (GSE114564). (G–I) Differential expression, diagnostic efficiency, and ROC diagnostic model between normal tissue and severe COVID-19 (GSE171110). (J–L) Differential expression, diagnostic efficiency, and ROC diagnostic model between normal tissue and COVID-19 (GSE152418). (** p < 0.01; *** p < 0.001).
In two COVID-19 datasets, the nine hub genes were significantly upregulated in COVID-19 patients (Figure 7G,J). These hub genes demonstrated excellent diagnostic value for severe COVID-19 (AUC ≥ 0.941, GSE171110, Figure 7H). The genes also demonstrated high diagnostic values for different severities of COVID-19 (AUC ≥ 0.782, GSE152418, Figure 7K). The model composed of these nine hub genes demonstrated excellent diagnostic value for HCC and COVID-19 (AUC ≥ 0.992; Figure 7C,F,I,L).
3.7. Hub Gene Prognostic Value in OC, HCC, and PC
The Kaplan–Meier plots of the nine hub genes demonstrated that higher expression levels indicated poorer OS in TCGA OC, HCC, and PC (Figure 8A–C). These results demonstrated that the hub genes CCNA2, CCNB1, CDKN3, ECT2, KIF14, KIF20A, KIF4A, NEK2, and TTK could predict OS in the OC, HCC, and PC cohorts. This finding further confirmed the value of the nine hub genes.
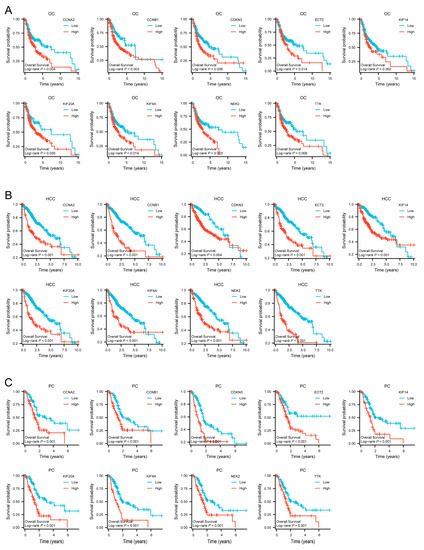
Figure 8.
Survival curves of CCNA2, CCNB1, CDKN3, ECT2, KIF14, KIF20A, KIF4A, NEK2 and TTK in TCGA cohorts. (A) Survival curves of hub genes in OC. (B) Survival curves of hub genes in HCC. (C) Survival curves of hub genes in PC.
3.8. Prediction of Transcription Factors and Verification in TCGA Cohorts
Based on the TRRUST database, we determined that the transcription factors E2F1, E2F3, E2F4, MYC, TP53, and YBX1 might regulate the expression of the nine hub genes (Table 6 and Figure 9A). Verification revealed that the six transcription factors were almost upregulated in TCGA tumor samples of the seven cancers (Figure 9B,C). As the core regulated gene, CCNB1 was regulated by the six transcription factors simultaneously.
Table 6.
Regulatory relationship between transcription factors and hub genes.
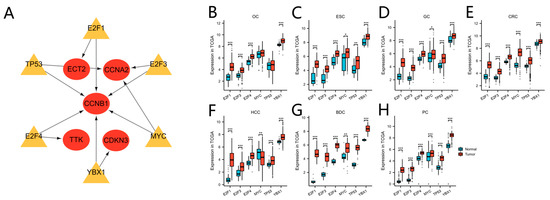
Figure 9.
Transcription factor regulation of hub genes and transcription factor expression level in TCGA. (A) The regulatory network between the transcription factors and hub genes. Yellow indicates transcription factors, red indicates the hub genes. (B–H) The transcription factor expression levels between tumor and normal tissue in TCGA OC (B), ESC (C), GC (D), CRC (E), HCC (F), BDC (G), and PC (H) cohorts. (* p < 0.05; ** p < 0.01; *** p < 0.001).
3.9. qPCR Validation in Paired Colorectal Tissues
Two hub genes (CCNA2, CCNB1) and a transcription factor gene (MYC) were validated by qPCR in 25 pairs of CRC and adjacent normal colorectal tissues. The expression of the three genes was analyzed with the Wilcoxon signed rank test. The results demonstrated that CCNA2, CCNB1, and MYC expression was significantly elevated in CRC tissues compared to the paired normal tissues (p < 0.05) (Figure 10).
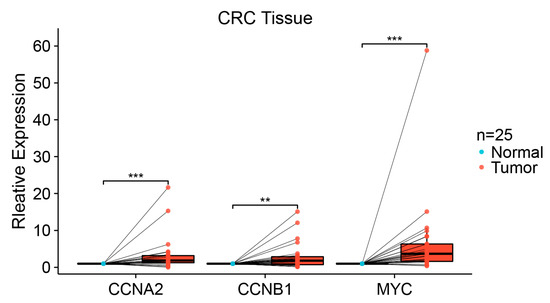
Figure 10.
qPCR expression level of CCNA2, CCNB1, and MYC in 25 pairs of colorectal tissues. Each dot represents the expression of normal or CRC sample. (** p < 0.01; *** p < 0.001).
4. Discussion
As a whole continuous organ, the digestive system greatly influences the human body. Food interacts with the digestive organs as it moves from the mouth to the body. Various factors cause cancer, including diet, infection, immunity, environment, and genetic mutations. In this study, we explored the common hub genes of COVID-19 and seven digestive cancers and analyzed the gene function and interaction in depth. Our analysis results show that there may indeed be a potential common molecular mechanism between COVID-19 and digestive system cancer. Considering the affinity of COVID-19 to the digestive system, this indicates that the imbalance in gene expression caused by COVID-19 infection may have a certain impact on the incidence rate of digestive system cancer, which requires further research.
In this study, we identified 23 DEGs as co-regulatory genes of seven digestive cancers and COVID-19. Among these DEGs, nine genes (CCNA2, CCNB1, CDKN3, ECT2, KIF14, KIF20A, KIF4A, NEK2, TTK) were identified as hub genes. We determined that six transcription factors (E2F1, E2F3, E2F4, MYC, TP53, YBX1) participated in the transcriptional regulation of hub genes. The hub gene expression trend was highly consistent in the seven digestive system cancers and COVID-19 in the GEO and TCGA gene expression profiles, and there was high expression of most of the genes in the eight diseases. Due to the special reasons for bile duct and esophageal cancer surgery, it is difficult to obtain more normal samples. When there are fewer normal samples, this will have a certain impact on the accuracy of AUC. We included TCGA and multiple GEO for analysis, hoping to minimize the impact of errors as much as possible. Most of the diagnostic efficacies AUCs of the nine hub genes were >0.9, which was closely related to the OC, HCC, and PC prognoses. In HCC in particular, the hub genes exhibited excellent diagnostic value in the blood and tissues, and could also predict the OS of patients with HCC. In vitro, the CCNA2, CCNB1, and MYC expression trends were consistent with the bioinformatics analysis results, and the gene expression level differences were statistically significant.
Analyses of functional enrichment and pathways aid in an understanding of the essential hub gene biological processes and mechanisms in the human body. The analysis of KEGG pathway enrichment demonstrated that the hub genes were closely related to the cell cycle, motor proteins, progesterone-mediated oocyte maturation, cellular senescence, and acute myeloid leukemia. SARS-CoV-2 infection promoted the generation of multiple cytokines, the shutdown of mitotic kinases, and affected cell division and led to cell cycle arrest [33]. In addition, SARS-CoV-2 can induce cell senescence like other viruses and exacerbate the senescence-associated secretory phenotype (SASP), which is composed of pro-inflammatory factors, extracellular matrix degradation factors, complement activators, and pro-coagulation factors secreted by aging cells [34].
Analysis of the enrichment of GO demonstrated that hub the genes were mainly located in the intracellular chromatin and microtubules, participated in biological processes, e.g., chromosome separation and microtubule composition, and were also linked to the activity of intracellular microtubule movement, motion-related proteins, and protein kinase regulation. Microtubules are composed of tubulin and exist in the cytoplasm. They are closely related to cell movement, signal transduction, and cell division, and participate in the formation of spindles, grana, centrioles. Motor proteins, microtubules, and other tubulin and actin structures are vital to cancer cell proliferation and invasion [35]. Even et al. demonstrated that interfering with microtubule formation promoted CRC onset and CRC cell migration by disrupting apical cell polarity, epithelial formation, proliferation, apoptosis, mitotic spindle dynamics, and cell cycle progression [36]. Protein kinases are critical regulators of phosphorylation-based signal transduction and share structurally similar catalytic domains critical to protein binding and phosphorylation. Humans have >500 protein kinases and >12 targets have been established for anticancer drugs. These kinases are typically subdivided into tyrosine, serine/threonine, or both [37]. Via the inhibition by drugs of protein kinase activity in CRC cells, Qi et al. reported that protein kinase-inhibited cancer cells had decreased migration activity, destroyed cytoskeleton, increased apoptosis, and inhibited growth [38].
In the cytoHubba analysis, a redder color and more connections with other genes indicated that the core role of a gene was more prominent. Among the hub genes, CCNB1, CCNA2, KIF14, TTK, and KIF20A were most closely associated with other genes, and were possibly the most critical regulatory genes. CCNB1 encodes regulatory proteins involved in mitosis and is required for the proper control of G2/M cell cycle transition. Inhibiting CCNB1 expression in cancer cells inhibited cancer cell proliferation and induced cell cycle arrest and apoptosis in CRC and gastric cancer [39,40]. CCNB1 was also closely related to ESC clinical prognosis [41]. CCNA2 is involved in regulating the cell cycle by binding to cyclin-dependent kinases that promote G1/S and G2/M transitions. CCNA2 was closely related to OC prognosis [42]. In mice, CCNA2 deficiency increased DNA damage in colon mucosal epithelial cells, caused inflammation and increased cell proliferation and developmental abnormalities that increased colon cancer incidence [43]. In patients with liver cancer, the activation of CCNA2 promoted liver cancer cell aggressiveness, where the patients also had worse prognosis [44]. The KIF14 gene is a microtubulomokinin-driven protein-3 superfamily member involved in many biological processes. High KIF14 expression was related to the GC stage and metastasis, where higher KIF14 expression was related to stronger GC cell proliferation, invasion, and migration ability, and a lower survival rate in patients [45]. In ESC, downregulating KIF14 inhibited esophageal squamous cell carcinoma cell proliferation, invasion, migration, and angiogenesis [46]. The TTK gene encodes a bi-specific protein kinase that can phosphorylate tyrosine, serine, and threonine. Failure to degrade this protein kinase leads to mitotic spindle abnormalities and tumorigenesis. The TTK protein is commonly overexpressed in PC, and the loss of the TTK gene inhibited cancer cell proliferation and transformation growth, where TTK was crucial in preventing PC cell death [47]. The protein encoded by KIF20A has protein kinase binding activity and regulates microbundle formation, midbody shedding, and cell division. KIF20A is related to the specific immune response of cholangiocarcinoma [48]. In liver cancer, deleting KIF20A expression inhibited HCC cell proliferation and enhanced HCC cell chemical sensitivity to cisplatin and sorafenib [49].
The transcription initiation process in eukaryotes often requires the assistance of various protein factors. Transcription factors and RNA polymerase Ⅱ form a transcription initiation complex and participate in the transcription initiation process together. In our study, the transcription factors E2F1, E2F3, E2F4, MYC, TP53, and YBX1 participated in the hub gene transcriptional regulation. E2F1, E2F3, and E2F4 are all transcription factor E2F family members, which are critical in controlling tumor-suppressor protein production and the cell cycle and are also targeted by small-DNA tumor virus transformation proteins. In vitro, different E2F1 levels exert other effects on cell fate: low E2F1 levels promote cell cycle progression, moderate E2F1 levels lead to cell cycle arrest, and high E2F1 levels lead to apoptosis [50]. The E2F family transcription factors are essential in GC pathogenesis [51]. In CRC, the combination of E2F1 and NCAPD3 promotes glycolysis, inhibits the tricarboxylic acid cycle, and participates in reprogramming glucose metabolism in CRC cells [52]. In HCC, the E2F4 expression level was positively correlated with tumor size, and E2F4 overexpression significantly enhances HCC cell proliferation, migration, and invasion [53]. In ESC, E2F3 overexpression induces RACGAP1 expression, thereby enhancing the cancer-promoting effect of RACGAP1 [54]. MYC is a transcription factor that activates or inhibits the transcription of target genes by regulating cell growth, apoptosis, differentiation, and metabolism through networks between proteins. Smoking and alcohol use cause genetic mutations in the proto-oncogene, MYC, which promotes oral cancer [55]. Furthermore, MYC can induce HMGA1 and TRIP13 transcription by bile duct cancer cells to enhance bile duct cancer cell migration, proliferation, invasion, dryness, and epithelial–mesenchymal transition (EMT) [56]. Tumor protein p53 (TP53) is a tumor-suppressor. The activation of wild-type TP53 leads to cell cycle arrest, DNA repair, and cell death. TP53 inhibited SLC7A11 transcription and promoted ferroptosis in PC cells [57]. In addition, TP53 mutations are the most common mutation in HCC, affecting HCC progression and prognosis [58], and the same effect was observed in cholangiocarcinoma [59]. YBX1 encodes proteins as both DNA- and RNA-binding proteins, participates in transcription and translation regulation and other processes, and is vital in microRNA processing. In CRC, targeting YBX1 phosphorylation might inhibit NF-κB activity in cancer, thereby regulating CRC cell growth [60]. Furthermore, GC development is inhibited after YBX1 is inhibited by the upstream circFAT1 (e2) [61].
5. Conclusions
Through multi-dimensional bioinformatics analysis and tumor tissue validation via in vitro experiments, we identified nine hub regulatory genes that participate in the pathogenesis of seven digestive system cancers and COVID-19. We explored the protein interactions between the genes and the regulatory role of transcription factors, providing novel insights for diagnosing and treating digestive system cancers and COVID-19. However, our study has some limitations, mainly regarding bioinformatics’ analysis. In vitro experiments were conducted to analyze gene expression differences. The interaction between the genes requires further study to clarify their mutual regulatory effects.
Author Contributions
Conceptualization, Z.X., S.Z. and Y.Y.; methodology, Z.X., S.Z., Y.Y., W.L., W.H. and Y.L.; Writing—original draft, Z.X. and Y.Y.; Writing—review and editing, Z.X., S.Z. and Y.Y.; supervision, S.Z.; funding acquisition, S.Z. All authors have read and agreed to the published version of the manuscript.
Funding
This research was funded by National Natural Science Foundation of China, grant number 81860334.
Institutional Review Board Statement
The study was conducted in accordance with the Declaration of Helsinki, and approved by the First Affiliated Hospital of Guangxi Medical University Ethical Review Committee (2023-E165-01).
Informed Consent Statement
Informed consent was obtained from all subjects involved in the study.
Data Availability Statement
The data that support the results of current study are available on TCGA, GEO and other databases. The datasets used and/or analyzed during the current study are available from the corresponding author on reasonable request.
Acknowledgments
We would like to express our gratitude to all the participants of the study. We acknowledge TCGA, GEO, and all the databases we used in the paper for providing the platform and contributors for uploading their meaningful data sets.
Conflicts of Interest
The authors declare no conflict of interest.
References
- Lu, L.; Mullins, C.S.; Schafmayer, C.; Zeißig, S.; Linnebacher, M. A global assessment of recent trends in gastrointestinal cancer and lifestyle-associated risk factors. Cancer Commun. 2021, 41, 1137–1151. [Google Scholar] [CrossRef]
- Sung, H.; Ferlay, J.; Siegel, R.L.; Laversanne, M.; Soerjomataram, I.; Jemal, A.; Bray, F. Global Cancer Statistics 2020: GLOBOCAN Estimates of Incidence and Mortality Worldwide for 36 Cancers in 185 Countries. CA Cancer J. Clin. 2021, 71, 209–249. [Google Scholar] [CrossRef] [PubMed]
- Siegel, R.L.; Miller, K.D.; Wagle, N.S.; Jemal, A. Cancer statistics. CA Cancer J. Clin. 2023, 73, 17–48. [Google Scholar] [CrossRef] [PubMed]
- Tong, Y.; Gao, H.; Qi, Q.; Liu, X.; Li, J.; Gao, J.; Li, P.; Wang, Y.; Du, L.; Wang, C. High fat diet, gut microbiome and gastrointestinal cancer. Theranostics 2021, 11, 5889–5910. [Google Scholar] [CrossRef]
- Abdeljaoued, S.; Arfa, S.; Kroemer, M.; Ben Khelil, M.; Vienot, A.; Heyd, B.; Loyon, R.; Doussot, A.; Borg, C. Tissue-resident memory T cells in gastrointestinal cancer immunology and immunotherapy: Ready for prime time? J. Immunother. Cancer 2022, 10, e003472. [Google Scholar] [CrossRef] [PubMed]
- Wang, Y.; Cao, Y.; Lebwohl, B.; Song, M.; Sun, Q.; Green, P.H.; Giovannucci, E.L.; Willett, W.C.; Chan, A.T. Gluten Intake and Risk of Digestive System Cancers in 3 Large Prospective Cohort Studies. Clin. Gastroenterol. Hepatol. 2022, 20, 1986–1996. [Google Scholar] [CrossRef] [PubMed]
- Keum, N.; Bao, Y.; Smith-Warner, S.A.; Orav, J.; Wu, K.; Fuchs, C.S.; Giovannucci, E.L. Association of Physical Activity by Type and Intensity With Digestive System Cancer Risk. JAMA Oncol. 2016, 2, 1146–1153. [Google Scholar] [CrossRef] [PubMed]
- O’Grady, I.; Anderson, A.; O’Sullivan, J. The interplay of the oral microbiome and alcohol consumption in oral squamous cell carcinomas. Oral Oncol. 2020, 110, 105011. [Google Scholar] [CrossRef]
- Zhang, Y. Epidemiology of esophageal cancer. World J. Gastroenterol. 2013, 19, 5598–5606. [Google Scholar] [CrossRef]
- Machlowska, J.; Baj, J.; Sitarz, M.; Maciejewski, R.; Sitarz, R. Gastric Cancer: Epidemiology, Risk Factors, Classification, Genomic Characteristics and Treatment Strategies. Int. J. Mol. Sci. 2020, 21, 4012. [Google Scholar] [CrossRef]
- Pulverer, W.; Kruusmaa, K.; Schönthaler, S.; Huber, J.; Bitenc, M.; Bachleitner-Hofmann, T.; Bhangu, J.S.; Oehler, R.; Egger, G.; Weinhäusel, A. Multiplexed DNA Methylation Analysis in Colorectal Cancer Using Liquid Biopsy and Its Diagnostic and Predictive Value. Curr. Issues Mol. Biol. 2021, 43, 1419–1435. [Google Scholar] [CrossRef]
- Tian, C.; Wang, Z.; Huang, L.; Liu, Y.; Wu, K.; Li, Z.; Bin Han, B.; Jiao, D.; Han, X.; Zhao, Y. One-step fabrication of lidocaine/CalliSpheres® composites for painless transcatheter arterial embolization. J. Transl. Med. 2022, 20, 463. [Google Scholar] [CrossRef] [PubMed]
- Yogo, A.; Masui, T.; Takaishi, S.; Masuo, K.; Chen, R.; Kasai, Y.; Nagai, K.; Anazawa, T.; Watanabe, S.; Sakamoto, S.; et al. Inhibition of dopamine receptor D1 signaling promotes human bile duct cancer progression via WNT signaling. Cancer Sci. 2022, 114, 1324–1336. [Google Scholar] [CrossRef] [PubMed]
- Gentiluomo, M.; Canzian, F.; Nicolini, A.; Gemignani, F.; Landi, S.; Campa, D. Germline genetic variability in pancreatic cancer risk and prognosis. Semin. Cancer Biol. 2022, 79, 105–131. [Google Scholar] [CrossRef]
- Merad, M.; Blish, C.A.; Sallusto, F.; Iwasaki, A. The immunology and immunopathology of COVID-19. Science 2022, 375, 1122–1127. [Google Scholar] [CrossRef] [PubMed]
- Bakouny, Z.; Hawley, J.E.; Choueiri, T.K.; Peters, S.; Rini, B.I.; Warner, J.L.; Painter, C.A. COVID-19 and Cancer: Current Challenges and Perspectives. Cancer Cell 2020, 38, 629–646. [Google Scholar] [CrossRef]
- Starikova, E.A.; Rubinstein, A.A.; Mammedova, J.T.; Isakov, D.V.; Kudryavtsev, I.V. Regulated Arginine Metabolism in Immunopathogenesis of a Wide Range of Diseases: Is There a Way to Pass between Scylla and Charybdis? Curr. Issues Mol. Biol. 2023, 45, 3525–3551. [Google Scholar] [CrossRef]
- Cao, T.-T.; Zhang, G.-Q.; Pellegrini, E.; Zhao, Q.; Li, J.; Luo, L.-J.; Pan, H.-Q. COVID-19 and its effects on the digestive system. World J. Gastroenterol. 2021, 27, 3502–3515. [Google Scholar] [CrossRef]
- Zhang, J.; Garrett, S.; Sun, J. Gastrointestinal symptoms, pathophysiology, and treatment in COVID-19. Genes Dis. 2021, 8, 385–400. [Google Scholar] [CrossRef]
- Szpulak, A.; Garlak, U.; Ćwirko, H.; Witkowska, B.; Rombel-Bryzek, A.; Witkowska, D. SARS-CoV-2 and its impact on the cardiovascular and digestive systems—The interplay between new virus variants and human cells. Comput. Struct. Biotechnol. J. 2023, 21, 1022–1029. [Google Scholar] [CrossRef]
- Lancet, T. Long COVID: 3 years in. Lancet 2023, 401, 795. [Google Scholar] [CrossRef] [PubMed]
- Mehandru, S.; Merad, M. Pathological sequelae of long-haul COVID. Nat. Immunol. 2022, 23, 194–202. [Google Scholar] [CrossRef] [PubMed]
- Gedda, M.R.; Danaher, P.; Shao, L.; Ongkeko, M.; Chen, L.; Dinh, A.; Sall, M.T.; Reddy, O.L.; Bailey, C.; Wahba, A.; et al. Longitudinal transcriptional analysis of peripheral blood leukocytes in COVID-19 convalescent donors. J. Transl. Med. 2022, 20, 587. [Google Scholar] [CrossRef] [PubMed]
- Cortellini, A.; Tabernero, J.; Mukherjee, U.; Salazar, R.; Sureda, A.; Maluquer, C.; Ferrante, D.; Bower, M.; Sharkey, R.; Mirallas, O.; et al. SARS-CoV-2 omicron (B.1.1.529)-related COVID-19 sequelae in vaccinated and unvaccinated patients with cancer: Results from the OnCovid registry. Lancet Oncol. 2023, 24, 335–346. [Google Scholar] [CrossRef]
- Min, Y.; Liu, Z.; Huang, R.; Li, R.; Jin, J.; Wei, Z.; He, L.; Pei, Y.; Li, N.; Su, Y.; et al. Survival outcomes following treatment delays among patients with early-stage female cancers: A nationwide study. J. Transl. Med. 2022, 20, 560. [Google Scholar] [CrossRef]
- Zhang, Y.; Song, J.; Zhang, Y.; Li, T.; Peng, J.; Zhou, H.; Zong, Z. Emerging Role of Neutrophil Extracellular Traps in Gastrointestinal Tumors: A Narrative Review. Int. J. Mol. Sci. 2022, 24, 334. [Google Scholar] [CrossRef]
- Barrett, T.; Wilhite, S.E.; Ledoux, P.; Evangelista, C.; Kim, I.F.; Tomashevsky, M.; Marshall, K.A.; Phillippy, K.H.; Sherman, P.M.; Holko, M.; et al. NCBI GEO: Archive for functional genomics data sets—Update. Nucleic Acids Res. 2013, 41, D991–D995. [Google Scholar] [CrossRef]
- Kanehisa, M.; Goto, S. KEGG: Kyoto Encyclopedia of Genes and Genomes. Nucleic Acids Res. 2000, 28, 27–30. [Google Scholar] [CrossRef]
- Kanehisa, M. Toward understanding the origin and evolution of cellular organisms. Protein Sci. 2019, 28, 1947–1951. [Google Scholar] [CrossRef] [PubMed]
- Kanehisa, M.; Furumichi, M.; Sato, Y.; Kawashima, M.; Ishiguro-Watanabe, M. KEGG for taxonomy-based analysis of pathways and genomes. Nucleic Acids Res. 2023, 51, D587–D592. [Google Scholar] [CrossRef] [PubMed]
- Szklarczyk, D.; Kirsch, R.; Koutrouli, M.; Nastou, K.; Mehryary, F.; Hachilif, R.; Gable, A.L.; Fang, T.; Doncheva, N.T.; Pyysalo, S.; et al. The STRING database in 2023: Protein–protein association networks and functional enrichment analyses for any sequenced genome of interest. Nucleic Acids Res. 2023, 51, D638–D646. [Google Scholar] [CrossRef] [PubMed]
- Han, H.; Cho, J.-W.; Lee, S.-Y.; Yun, A.; Kim, H.; Bae, D.; Yang, S.; Kim, C.Y.; Lee, M.; Kim, E.; et al. TRRUST v2: An expanded reference database of human and mouse transcriptional regulatory interactions. Nucleic Acids Res. 2018, 46, D380–D386. [Google Scholar] [CrossRef]
- Bouhaddou, M.; Memon, D.; Meyer, B.; White, K.M.; Rezelj, V.V.; Marrero, M.C.; Polacco, B.J.; Melnyk, J.E.; Ulferts, S.; Kaake, R.M.; et al. The Global Phosphorylation Landscape of SARS-CoV-2 Infection. Cell 2020, 182, 685–712. [Google Scholar] [CrossRef] [PubMed]
- Schmitt, C.A.; Tchkonia, T.; Niedernhofer, L.J.; Robbins, P.D.; Kirkland, J.L.; Lee, S. COVID-19 and cellular senescence. Nat. Rev. Immunol. 2022, 23, 251–263. [Google Scholar] [CrossRef] [PubMed]
- Ibrahim, I.H.; Balah, A.; Hassan, A.G.A.E.; El-Aziz, H.G.A. Role of motor proteins in human cancers. Saudi J. Biol. Sci. 2022, 29, 103436. [Google Scholar] [CrossRef] [PubMed]
- Even, I.; Reidenbach, S.; Schlechter, T.; Berns, N.; Herold, R.; Roth, W.; Krunic, D.; Riechmann, V.; Hofmann, I. DLIC1, but not DLIC2, is upregulated in colon cancer and this contributes to proliferative overgrowth and migratory characteristics of cancer cells. FEBS J. 2019, 286, 803–820. [Google Scholar] [CrossRef]
- Miller, C.J.; Turk, B.E. Homing in: Mechanisms of Substrate Targeting by Protein Kinases. Trends Biochem. Sci. 2018, 43, 380–394. [Google Scholar] [CrossRef]
- Qi, L.; Zhang, Y.; Song, F.; Han, Y.; Ding, Y. A newly identified small molecular compound acts as a protein kinase inhibitor to suppress metastasis of colorectal cancer. Bioorg. Chem. 2021, 107, 104625. [Google Scholar] [CrossRef]
- Yi, Y.-C.; Liang, R.; Chen, X.-Y.; Fan, H.-N.; Chen, M.; Zhang, J.; Zhu, J.-S. Dihydroartemisinin Suppresses the Tumorigenesis and Cycle Progression of Colorectal Cancer by Targeting CDK1/CCNB1/PLK1 Signaling. Front. Oncol. 2021, 11, 768879. [Google Scholar] [CrossRef]
- Chen, E.-B.; Qin, X.; Peng, K.; Li, Q.; Tang, C.; Wei, Y.-C.; Yu, S.; Gan, L.; Liu, T.-S. HnRNPR-CCNB1/CENPF axis contributes to gastric cancer proliferation and metastasis. Aging 2019, 11, 7473–7491. [Google Scholar] [CrossRef]
- Wu, R.; Zhuang, H.; Mei, Y.-K.; Sun, J.-Y.; Dong, T.; Zhao, L.-L.; Fan, Z.-N.; Liu, L. Systematic identification of key functional modules and genes in esophageal cancer. Cancer Cell Int. 2021, 21, 134. [Google Scholar] [CrossRef] [PubMed]
- Kumari, P.; Kumar, S.; Sethy, M.; Bhue, S.; Mohanta, B.K.; Dixit, A. Identification of therapeutically potential targets and their ligands for the treatment of OSCC. Front. Oncol. 2022, 12, 910494. [Google Scholar] [CrossRef] [PubMed]
- Guo, Y.; Gabola, M.; Lattanzio, R.; Paul, C.; Pinet, V.; Tang, R.; Turali, H.; Bremond, J.; Longobardi, C.; Maurizy, C.; et al. Cyclin A2 maintains colon homeostasis and is a prognostic factor in colorectal cancer. J. Clin. Investig. 2021, 131, e131517. [Google Scholar] [CrossRef]
- Bayard, Q.; Meunier, L.; Peneau, C.; Renault, V.; Shinde, J.; Nault, J.-C.; Mami, I.; Couchy, G.; Amaddeo, G.; Tubacher, E.; et al. Cyclin A2/E1 activation defines a hepatocellular carcinoma subclass with a rearrangement signature of replication stress. Nat. Commun. 2018, 9, 5235. [Google Scholar] [CrossRef]
- Yang, Z.; Li, C.; Yan, C.; Li, J.; Yan, M.; Liu, B.; Zhu, Z.; Wu, Y.; Gu, Q. KIF14 promotes tumor progression and metastasis and is an independent predictor of poor prognosis in human gastric cancer. Biochim. et Biophys. Acta (BBA) Mol. Basis Dis. 2019, 1865, 181–192. [Google Scholar] [CrossRef]
- Zhao, Q.; Chen, S.; Chen, L. LETM1 (leucine zipper-EF-hand-containing transmembrane protein 1) silence reduces the proliferation, invasion, migration and angiogenesis in esophageal squamous cell carcinoma via KIF14 (kinesin family member 14). Bioengineered 2021, 12, 7656–7665. [Google Scholar] [CrossRef] [PubMed]
- Stratford, J.K.; Yan, F.; Hill, R.A.; Major, M.B.; Graves, L.M.; Der, C.J.; Yeh, J.J. Genetic and pharmacological inhibition of TTK impairs pancreatic cancer cell line growth by inducing lethal chromosomal instability. PLoS ONE 2017, 12, e0174863. [Google Scholar] [CrossRef]
- Kida, A.; Mizukoshi, E.; Tamai, T.; Terashima, T.; Kitahara, M.; Arai, K.; Yamashita, T.; Fushimi, K.; Honda, M.; Kaneko, S. Immune responses against tumour-associated antigen-derived cytotoxic T lymphocyte epitopes in cholangiocarcinoma patients. Liver Int. 2018, 38, 2040–2050. [Google Scholar] [CrossRef]
- Wu, C.; Qi, X.; Qiu, Z.; Deng, G.; Zhong, L. Low expression of KIF20A suppresses cell proliferation, promotes chemosensitivity and is associated with better prognosis in HCC. Aging 2021, 13, 22148–22163. [Google Scholar] [CrossRef]
- Shats, I.; Deng, M.; Davidovich, A.; Zhang, C.; Kwon, J.S.; Manandhar, D.; Gordân, R.; Yao, G.; You, L. Expression level is a key determinant of E2F1-mediated cell fate. Cell Death Differ. 2017, 24, 626–637. [Google Scholar] [CrossRef]
- Wu, T.; Wu, L. The Role and Clinical Implications of the Retinoblastoma (RB)-E2F Pathway in Gastric Cancer. Front. Oncol. 2021, 11, 655630. [Google Scholar] [CrossRef]
- Jing, Z.; Liu, Q.; He, X.; Jia, Z.; Xu, Z.; Yang, B.; Liu, P. NCAPD3 enhances Warburg effect through c-myc and E2F1 and promotes the occurrence and progression of colorectal cancer. J. Exp. Clin. Cancer Res. 2022, 41, 198. [Google Scholar] [CrossRef] [PubMed]
- Liu, J.; Xia, L.; Wang, S.; Cai, X.; Wu, X.; Zou, C.; Shan, B.; Luo, M.; Wang, D. E2F4 Promotes the Proliferation of Hepatocellular Carcinoma Cells through Upregulation of CDCA3. J. Cancer 2021, 12, 5173–5180. [Google Scholar] [CrossRef]
- Zhao, W.; Wang, M.; Wang, C.; Liu, Y.; Liu, H.; Luo, S. RACGAP1 is transcriptionally regulated by E2F3, and its depletion leads to mitotic catastrophe in esophageal squamous cell carcinoma. Ann. Transl. Med. 2020, 8, 950. [Google Scholar] [CrossRef] [PubMed]
- Ali, J.; Sabiha, B.; Jan, H.U.; Haider, S.A.; Khan, A.A.; Ali, S.S. Genetic etiology of oral cancer. Oral Oncol. 2017, 70, 23–28. [Google Scholar] [CrossRef]
- Li, Z.; Liu, J.; Chen, T.; Sun, R.; Liu, Z.; Qiu, B.; Xu, Y.; Zhang, Z. HMGA1-TRIP13 axis promotes stemness and epithelial mesenchymal transition of perihilar cholangiocarcinoma in a positive feedback loop dependent on c-Myc. J. Exp. Clin. Cancer Res. 2021, 40, 86. [Google Scholar] [CrossRef] [PubMed]
- Chen, X.; Zeh, H.J.; Kang, R.; Kroemer, G.; Tang, D. Cell death in pancreatic cancer: From pathogenesis to therapy. Nat. Rev. Gastroenterol. Hepatol. 2021, 18, 804–823. [Google Scholar] [CrossRef]
- Long, J.; Wang, A.; Bai, Y.; Lin, J.; Yang, X.; Wang, D.; Yang, X.; Jiang, Y.; Zhao, H. Development and validation of a TP53-associated immune prognostic model for hepatocellular carcinoma. Ebiomedicine 2019, 42, 363–374. [Google Scholar] [CrossRef]
- Kendall, T.; Verheij, J.; Gaudio, E.; Evert, M.; Guido, M.; Goeppert, B.; Carpino, G. Anatomical, histomorphological and molecular classification of cholangiocarcinoma. Liver Int. 2019, 39 (Suppl. S1), 7–18. [Google Scholar] [CrossRef]
- Martin, M.; Hua, L.; Wang, B.; Wei, H.; Prabhu, L.; Hartley, A.-V.; Jiang, G.; Liu, Y.; Lu, T. Novel Serine 176 Phosphorylation of YBX1 Activates NF-κB in Colon Cancer. J. Biol. Chem. 2017, 292, 3433–3444. [Google Scholar] [CrossRef]
- Fang, J.; Hong, H.; Xue, X.; Zhu, X.; Jiang, L.; Qin, M.; Liang, H.; Gao, L. A novel circular RNA, circFAT1(e2), inhibits gastric cancer progression by targeting miR-548g in the cytoplasm and interacting with YBX1 in the nucleus. Cancer Lett. 2019, 442, 222–232. [Google Scholar] [CrossRef] [PubMed]
Disclaimer/Publisher’s Note: The statements, opinions and data contained in all publications are solely those of the individual author(s) and contributor(s) and not of MDPI and/or the editor(s). MDPI and/or the editor(s) disclaim responsibility for any injury to people or property resulting from any ideas, methods, instructions or products referred to in the content. |
© 2023 by the authors. Licensee MDPI, Basel, Switzerland. This article is an open access article distributed under the terms and conditions of the Creative Commons Attribution (CC BY) license (https://creativecommons.org/licenses/by/4.0/).