

Mapping and Functional Analysis of QTL for Kernel Number per Row in Tropical and Temperate–Tropical Introgression Lines of Maize (Zea mays L.)
 ,
,
Abstract
1. Introduction
2. Materials and Methods
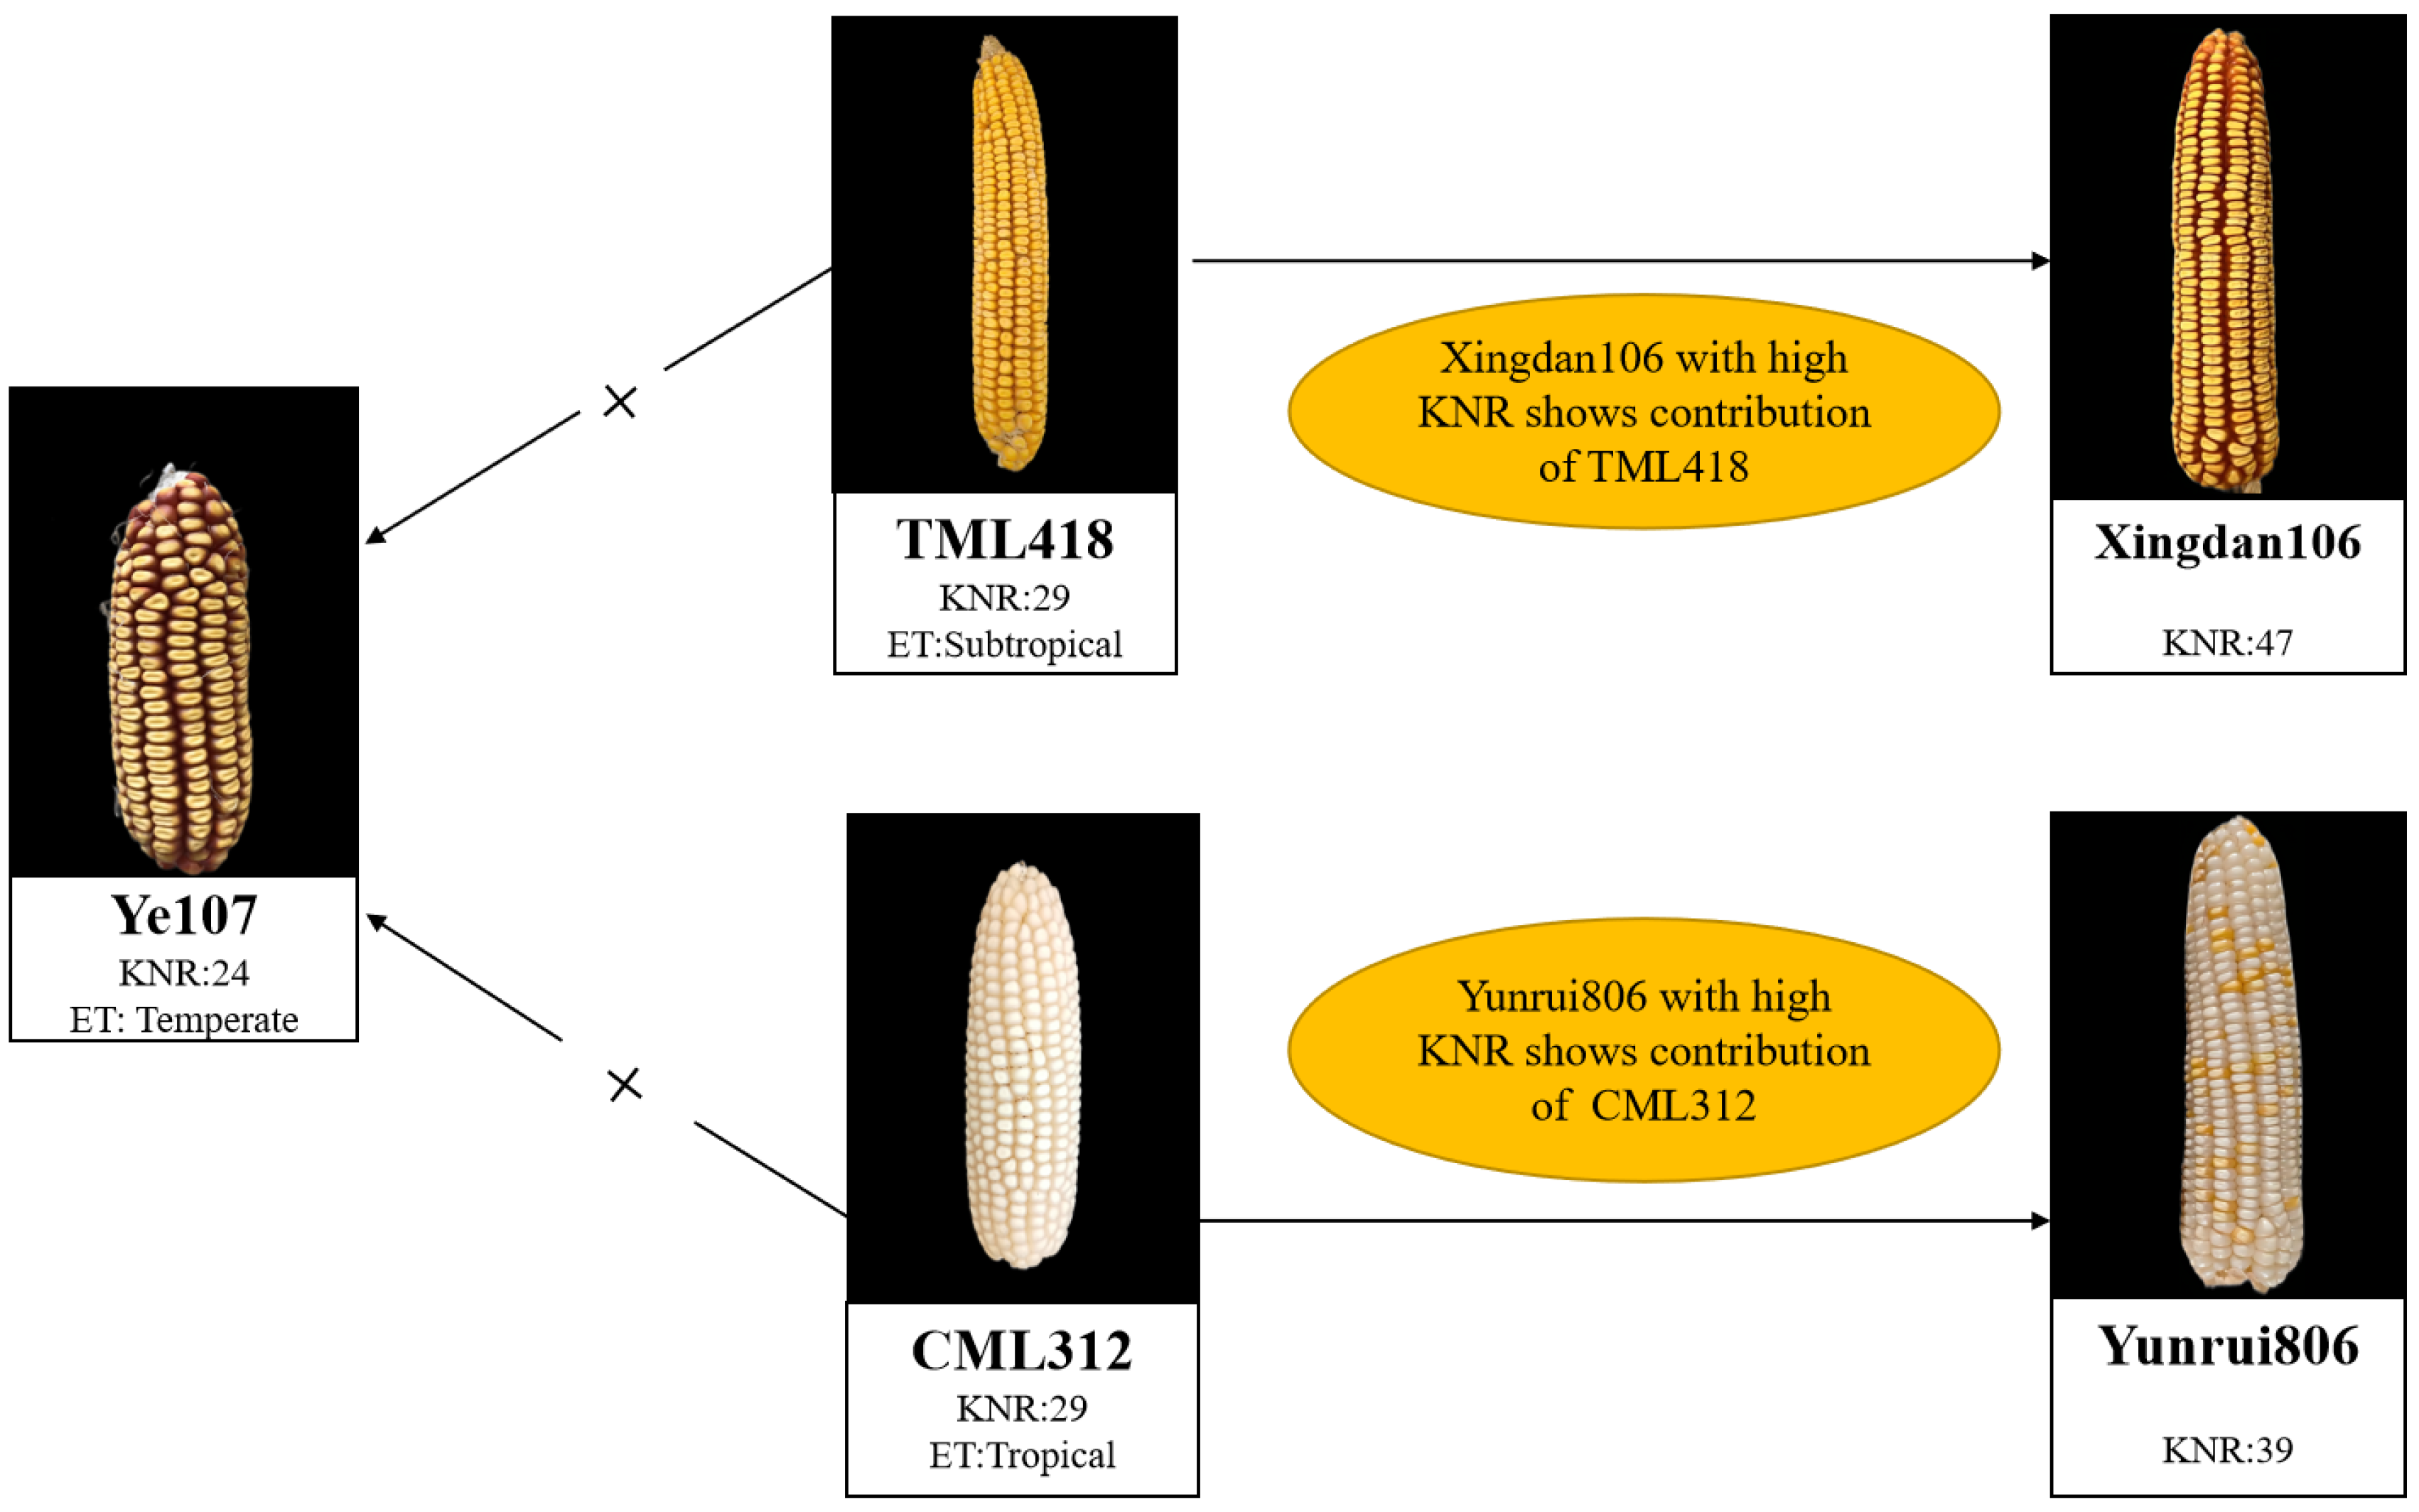
2.1. Test Materials and Field Design
2.2. Phenotype Determination and Analysis
2.3. DNA Extraction and Genotyping-by-Sequencing (GBS)
2.4. Construction of Genetic Linkage Map and QTL Mapping
2.5. Genome Wide Association Study
2.6. Identification and Functional Annotation of Candidate Genes
3. Results
3.1. Phenotype Analysis of KNR in Two RILs Populations
3.2. Linkage Analysis and QTL Mapping of KNR in Two RILs Populations
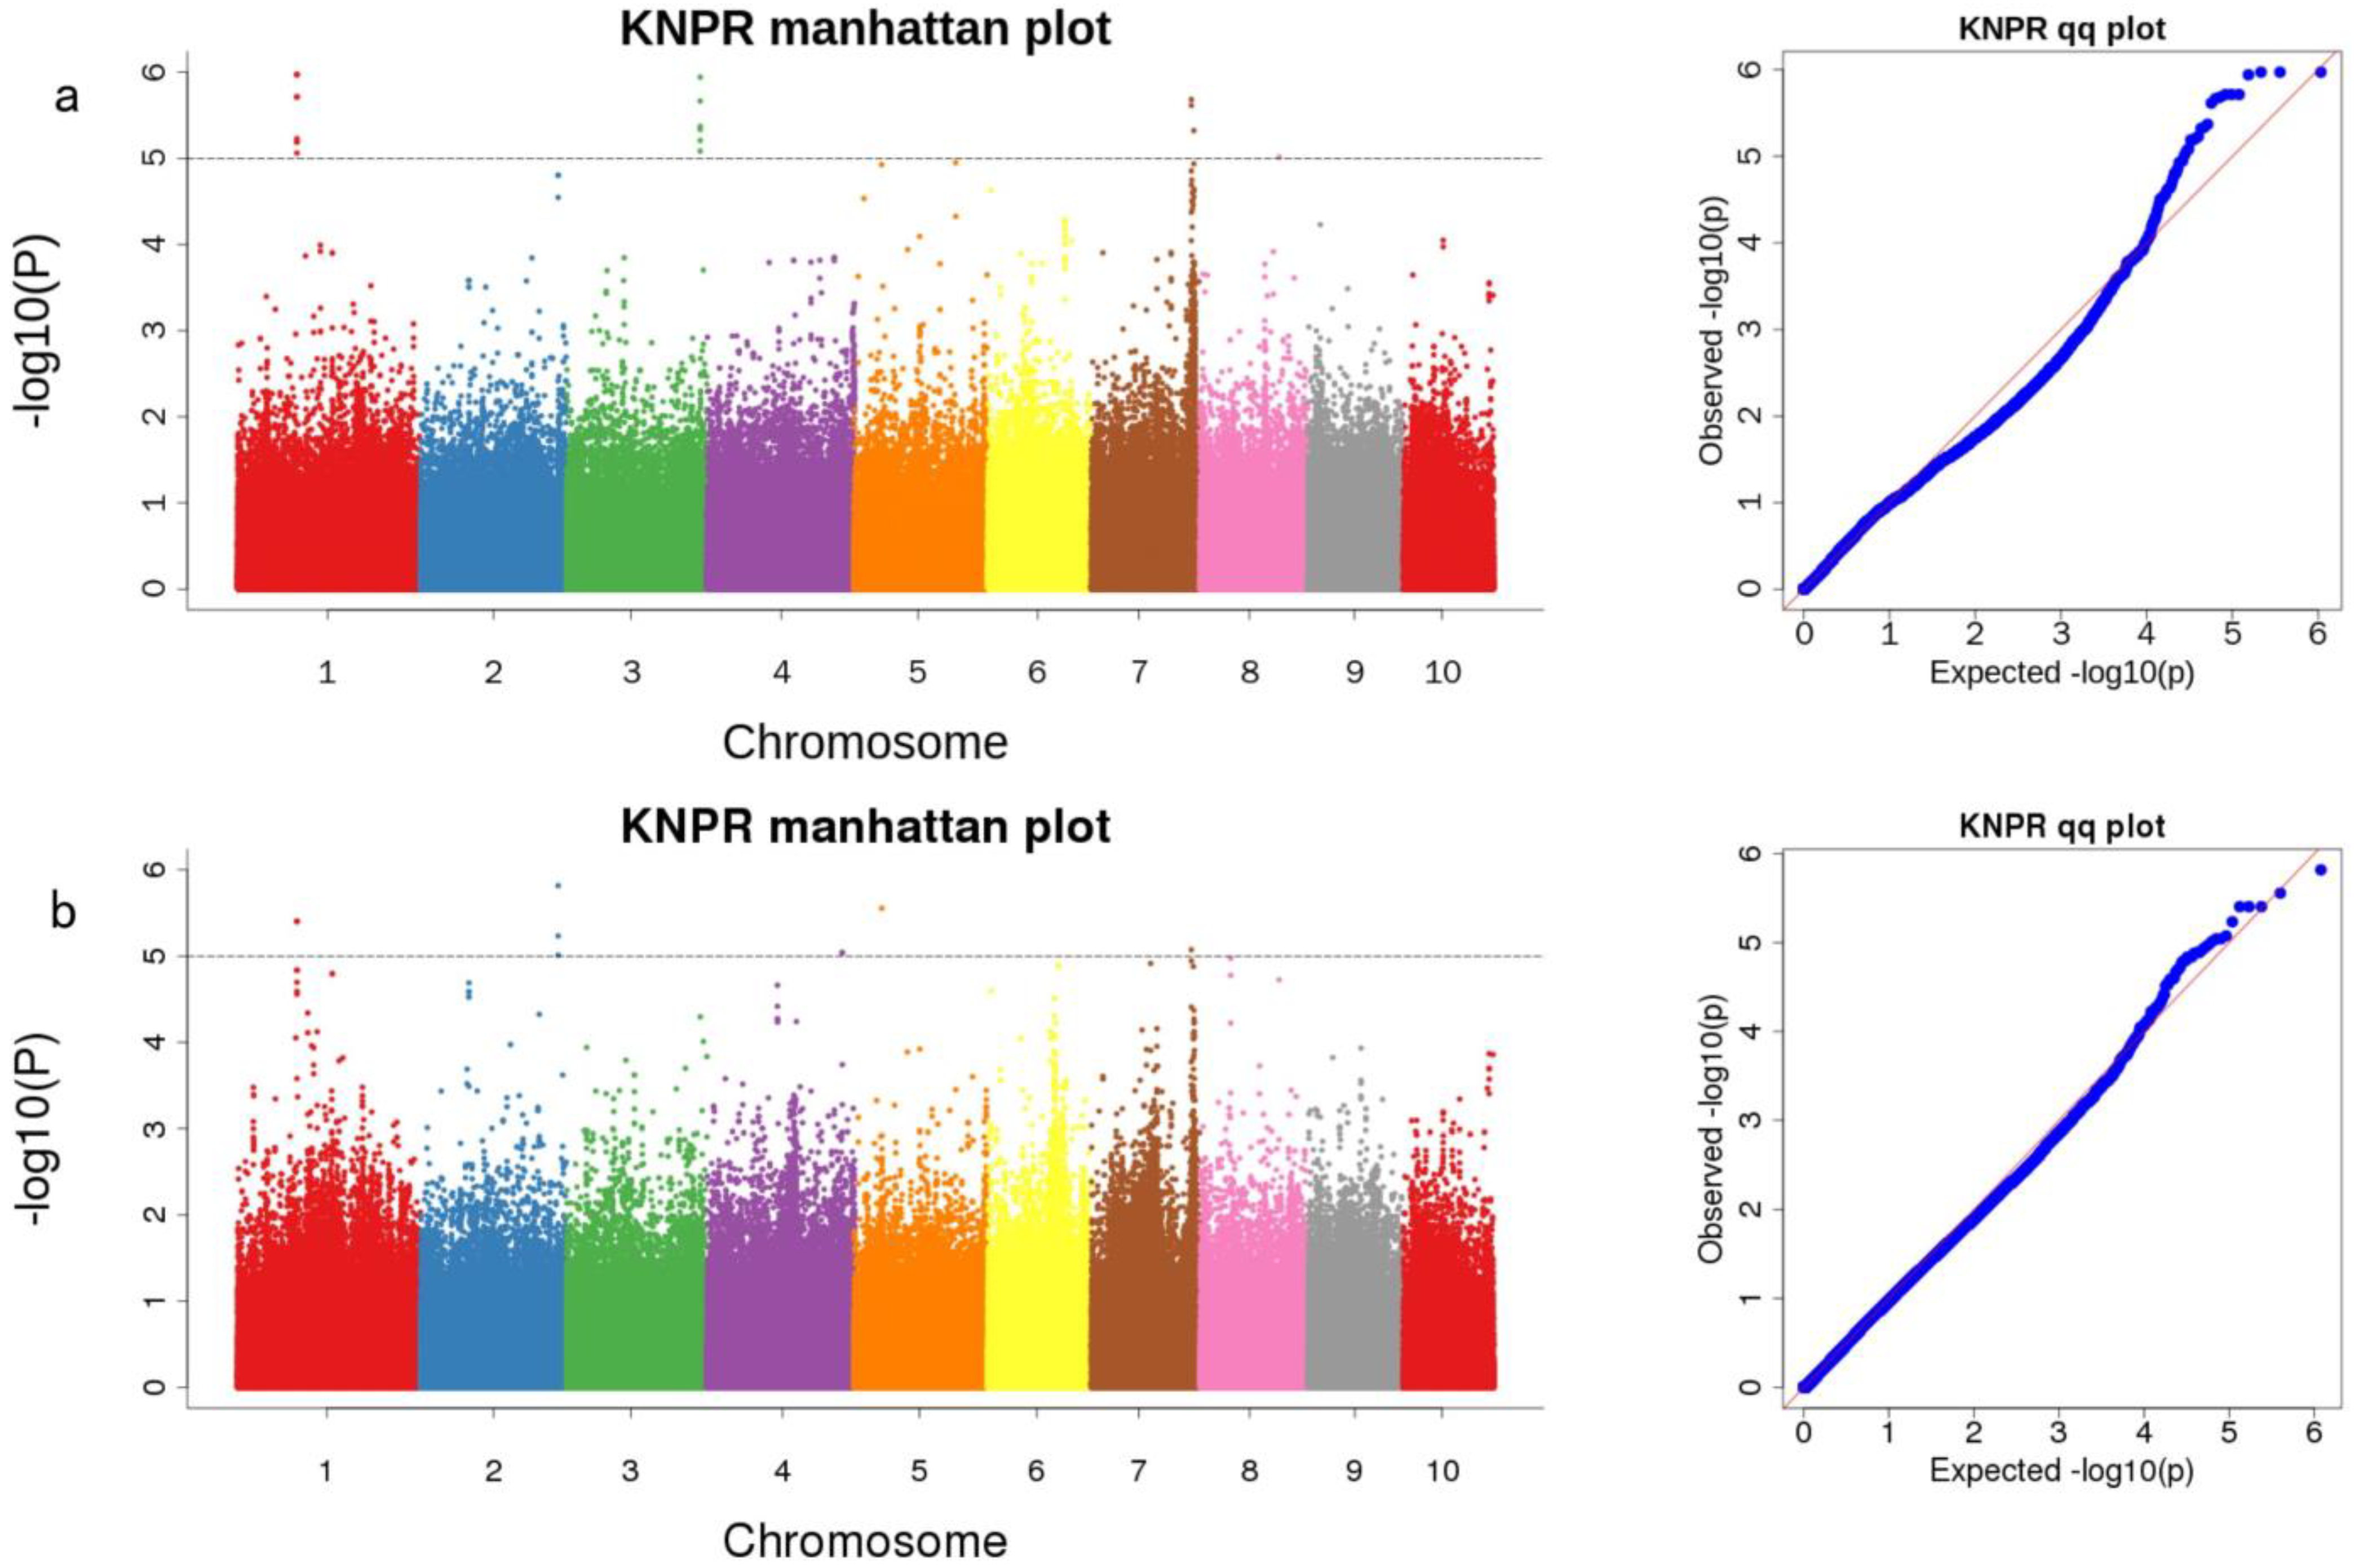
3.3. Genome-Wide Association Analysis of KNR in Two RIL Populations
3.4. Analysis of Consistent Sites Identified under Two Methods
4. Discussion
4.1. The Phenotype of the KNR Is Strongly Influenced by the Environment
4.2. Three New Candidate Genes Associated with KNR Identified on Chromosome 7
4.3. Functional Analysis of Three Candidate Genes Associated with KNR
4.4. Combining Molecular Breeding with Conventional Breeding Methods to Improve Breeding Efficiency
5. Conclusions
Supplementary Materials
Author Contributions
Funding
Institutional Review Board Statement
Data Availability Statement
Conflicts of Interest
References
- Vollbrecht, E.; Schmidt, R.J. Development of the Inflorescences. In Handbook of Maize: Its Biology; Bennetzen, J.L., Hake, S.C., Eds.; Springer: New York, NY, USA, 2009; pp. 13–40. [Google Scholar]
- Andrade, F.H.; Vega, C.; Uhart, S.; Cantarero, M.; Valentinuz, O. Kernel number determination in maize. Crop Sci. 1999, 39, 453–459. [Google Scholar] [CrossRef]
- Ciampitti, I.A.; Elmore, R.W.; Lauer, J. Corn growth and development. Dent 2011, 5, 75. [Google Scholar]
- Sabadin, P.; Junior, C.; de Souza, A.; Garcia, A. QTL mapping for yield components in a tropical maize population using microsatellite markers. Hereditas 2008, 145, 194–203. [Google Scholar] [CrossRef]
- Powder, K.E. Quantitative Trait Loci (QTL) Mapping. Methods Mol. Biol. 2020, 2082, 211–229. [Google Scholar]
- Hayes, B. Overview of Statistical Methods for Genome-Wide Association Studies (GWAS). Methods Mol. Biol. 2013, 1019, 149–169. [Google Scholar]
- Yin, X.F.; Bi, Y.Q.; Jiang, F.Y.; Guo, R.J.; Zhang, Y.D.; Fan, J.; Kang, M.S.; Fan, X.M. Fine mapping of candidate quantitative trait loci for plant and ear height in a maize nested-association mapping population. Front. Plant Sci. 2022, 13, 963985. [Google Scholar] [CrossRef]
- Baker, E.; Schmidt, K.M.; Sims, R.; O’Donovan, M.C.; Williams, J.; Holmans, P.; Consortium, W.T.G. POLARIS: Polygenic LD-adjusted risk score approach for set-based analysis of GWAS data. Genet. Epidemiol. 2018, 42, 366–377. [Google Scholar] [CrossRef]
- Kujur, A.; Upadhyaya, H.D.; Shree, T.; Bajaj, D.; Das, S.; Saxena, M.S.; Parida, S.K. Ultra-high density intra-specific genetic linkage maps accelerate identification of functionally relevant molecular tags governing important agronomic traits in chickpea. Sci. Rep. 2015, 5, 9468. [Google Scholar] [CrossRef]
- Kibe, M.; Nyaga, C.; Nair, S.K.; Beyene, Y.; Das, B.; Suresh, L.M.; Bright, J.M.; Makumbi, D.; Kinyua, J.; Olsen, M.S.; et al. Combination of Linkage Mapping, GWAS, and GP to Dissect the Genetic Basis of Common Rust Resistance in Tropical Maize Germplasm. Int. J. Mol. Sci. 2020, 21, 6518. [Google Scholar] [CrossRef]
- Galli, G.; Alves, F.C.; Morosini, J.S.; Fritsche-Neto, R. On the usefulness of parental lines GWAS for predicting low heritability traits in tropical maize hybrids. PLoS ONE 2020, 15, e0228724. [Google Scholar] [CrossRef]
- Akhatar, J.; Goyal, A.; Kaur, N.; Atri, C.; Mittal, M.; Singh, M.P.; Banga, S.S. Genome wide association analyses to understand genetic basis of flowering and plant height under three levels of nitrogen application in Brassica juncea (L.) Czern & Coss. Sci. Rep. 2021, 11, 4278. [Google Scholar]
- Mazaheri, M.; Heckwolf, M.; Vaillancourt, B.; Gage, J.L.; Burdo, B.; Heckwolf, S.; Kaeppler, S.M. Genome-wide association analysis of stalk biomass and anatomical traits in maize. BMC Plant Biol. 2019, 19, 45. [Google Scholar] [CrossRef]
- Tomkowiak, A.; Bocianowski, J.; Wolko, Ł.; Adamczyk, J.; Mikołajczyk, S.; Kowalczewski, P.Ł. Identification of Markers Associated with Yield Traits and Morphological Features in Maize (Zea mays L.). Plants 2019, 8, 330. [Google Scholar] [CrossRef]
- Li, K.; Tassinari, A.; Giuliani, S.; Rosignoli, S.; Urbany, C.; Tuberosa, R.; Salvi, S. QTL mapping identifies novel major loci for kernel row number-associated ear fasciation, ear prolificacy and tillering in maize (Zea mays L.). Front. Plant Sci. 2023, 13, 1017983. [Google Scholar] [CrossRef]
- Franco, J. From the archives: EAD1 is essential for maize ear development, STM regulates floral fate, and the role of profilin in pollen tube growth. Plant Cell 2023, koad080. [Google Scholar] [CrossRef]
- Bommert, P.; Lunde, C.; Nardmann, J.; Vollbrecht, E.; Running, M.; Jackson, D.; Werr, W. thick tassel dwarf1 encodes a putative maize ortholog of the Arabidopsis CLAVATA1 leucine-rich repeat receptor-like kinase. Development 2005, 132, 1235–1245. [Google Scholar] [CrossRef]
- Czyzewicz, N.; Shi, C.L.; Vu, L.D.; Van De Cotte, B.; Hodgman, C.; Butenko, M.A.; Smet, I.D. Modulation of Arabidopsis and monocot root architecture by CLAVATA3/EMBRYO SURROUNDING REGION 26 peptide. J. Exp. Bot. 2015, 6, 5229–5243. [Google Scholar] [CrossRef]
- Bommert, P.; Nagasawa, N.S.; Jackson, D. Quantitative variation in maize kernel row number is controlled by the FASCIATED EAR2 locus. Nat. Genet. 2013, 45, 334–337. [Google Scholar] [CrossRef]
- Liu, L.; Gallagher, J.; Arevalo, E.D.; Chen, R.; Skopelitis, T.; Wu, Q.; Jackson, D. Enhancing grain-yield-related traits by CRISPR–Cas9 promoter editing of maize CLE genes. Nat. Plants 2021, 7, 287–294. [Google Scholar] [CrossRef]
- Liu, X.; Galli, M.; Camehl, I.; Gallavotti, A. RAMOSA1 ENHANCER LOCUS2-mediated transcriptional repression regulates vegetative and reproductive architecture. Plant Physiol. 2019, 179, 348–363. [Google Scholar] [CrossRef]
- Je, B.I.; Gruel, J.; Lee, Y.K.; Bommert, P.; Arevalo, E.D.; Eveland, A.L.; Wu, Q.; Goldshmidt, A.; Meeley, R.; Bartlett, M.; et al. Signaling from maize organ primordia via FASCIATED EAR3 regulates stem cell proliferation and yield traits. Nat. Genet. 2016, 48, 785–791. [Google Scholar] [CrossRef] [PubMed]
- Liu, L.; Du, Y.; Huo, D.; Wang, M.; Shen, X.; Yue, B.; Qiu, F.; Zheng, Y.; Yan, J.; Zhang, Z. Genetic architecture of maize kernel row number and whole genome prediction. Theor. Appl. Genet. 2015, 128, 2243–2254. [Google Scholar] [CrossRef] [PubMed]
- Chuck, G.S.; Brown, P.J.; Meeley, R.; Hake, S. Maize SBP-box transcription factors unbranched2 and unbranched3 affect yield traits by regulating the rate of lateral primordia initiation. Proc. Natl. Acad. Sci. USA 2014, 111, 18775–18780. [Google Scholar] [CrossRef] [PubMed]
- Beavis, W.D.; Smith, O.S.; Grant, D.; Fincher, R. Identification of quantitative trait loci using a small sample of topcrossed and F4 progeny from maize. Crop Sci. 1994, 34, 882–896. [Google Scholar] [CrossRef]
- Ribaut, J.M.; Jiang, C.; Gonzalez-de-Leon, D.; Edmeades, G.O.; Hoisington, D.A. Identification of quantitative trait loci under drought conditions in tropical maize. 2. Yield components and marker-assisted selection strategies. Theor. Appl. Genet. 1997, 94, 887–896. [Google Scholar] [CrossRef]
- Li, M.; Guo, X.; Zhang, M.; Wang, X.; Zhang, G.; Tian, Y.; Wang, Z. Mapping QTLs for grain yield and yield components under high and low phosphorus treatments in maize (Zea mays L.). Plant Sci. 2010, 178, 454–462. [Google Scholar] [CrossRef]
- Jia, H.; Li, M.; Li, W.; Liu, L.; Jian, Y.; Yang, Z.; Shen, X.; Ning, Q.; Du, Y.; Zhao, R.; et al. A serine/threonine protein kinase encoding gene KERNEL NUMBER PER ROW6 regulates maize grain yield. Nat. Commun. 2020, 11, 988. [Google Scholar] [CrossRef]
- Zhang, G.D. Fine Mapping a Major QTL for Kernel Number Per Row under Different Phosphorus Regimes in Maize (Zea mays L.). Master’s Thesis, Shandong Agricultural University, Taian, China, 2012. [Google Scholar]
- Zhan, J.; Wang, F.; Xing, W.; Liu, J.; Fan, Z.; Tao, Y. Fine mapping and candidate gene prediction of a major QTL for kernel number per ear in maize. Mol. Breed. 2018, 38, 1–9. [Google Scholar] [CrossRef]
- Zhao, L.; Haslam, T.M.; Sonntag, A.; Molina, I.; Kunst, L. Functional overlap of long-chain acyl-CoA synthetases in Arabidopsis. Plant Cell Physiol. 2019, 60, 1041–1054. [Google Scholar] [CrossRef]
- An, Y.; Chen, L.; Li, Y.; Li, C.; Shi, Y.; Song, Y.; Zhang, D.; Li, Y.; Wang, T. Candidate loci for the kernel row number in maize revealed by a combination of transcriptome analysis and regional association mapping. BMC Plant Biol. 2019, 19, 201. [Google Scholar] [CrossRef]
- Zhang, X.; Guan, Z.; Li, Z.; Liu, P.; Ma, L.; Zhang, Y.; Pan, L.; He, S.; Zhang, Y.; Li, P.; et al. A combination of linkage mapping and GWAS brings new elements on the genetic basis of yield-related traits in maize across multiple environments. Theor. Appl. Genet. 2020, 133, 2881–2895. [Google Scholar] [CrossRef]
- Luo, Y.; Zhang, M.; Liu, Y.; Liu, J.; Li, W.; Chen, G.; Peng, Y.; Jin, M.; Wei, W.; Jian, L.; et al. Genetic variation in YIGE1 contributes to ear length and grain yield in maize. New Phytol. 2022, 234, 513–526. [Google Scholar] [CrossRef]
- Baye, W.; Xie, Q.; Xie, P. Genetic Architecture of Grain Yield-Related Traits in Sorghum and Maize. Int. J. Mol. Sci. 2022, 23, 2405. [Google Scholar] [CrossRef]
- Knapp, S.J.; Stroup, W.W.; Ross, W.M. Exact Confidence Intervals for Heritability on a Progeny Mean Basis. Crop Sci. 1983, 25, 192–194. [Google Scholar] [CrossRef]
- Moran, P.; Smith, C. The correlation between relatives on the supposition of mendelian inheritance. Trans. Royal Soc. Edinb. 1918, 52, 438–899. [Google Scholar]
- Maroof, M.A.S.; Biyashev, R.M.; Yang, G.P.; Zhang, Q.; Allard, R.W. Extraordinarily polymorphic microsatellite DNA in barley: Species diversity, chromosomal locations, and population dynamics. Proc. Natl. Acad. Sci. USA 1994, 91, 5466–5470. [Google Scholar] [CrossRef]
- Murray, M.G.; Thompson, W.F. Rapid isolation of high molecular weight plant DNA. Nucleic Acids Res. 1980, 8, 4321–4325. [Google Scholar] [CrossRef]
- McKenna, A.; Hanna, M.; Banks, E.; Sivachenko, A.; Cibulskis, K.; Kernytsky, A.; Garimella, K.; Altshuler, D.; Gabriel, S.; Daly, M.; et al. The Genome Analysis Toolkit: A MapReduce framework for analyzing next-generation DNA sequencing data. Genome Res. 2010, 20, 1297–1303. [Google Scholar] [CrossRef]
- Vogt, F.; Shirsekar, G.; Weigel, D. vcf2gwas: Python API for comprehensive GWAS analysis using GEMMA. Bioinformatics 2022, 38, 839–840. [Google Scholar] [CrossRef]
- Zhang, Z.; Ersoz, E.; Lai, C.Q.; Todhunter, R.J.; Tiwari, H.K.; Gore, M.A.; Buckler, E.S. Mixed linear model approach adapted for genome-wide association studies. Nat. Genet. 2010, 42, 355–360. [Google Scholar] [CrossRef]
- Magar, B.T.; Acharya, S.; Gyawali, B.; Timilsena, K.; Upadhayaya, J.; Shrestha, J. Genetic variability and trait association in maize (Zea mays L.) varieties for growth and yield traits. Heliyon 2021, 7, e07939. [Google Scholar] [CrossRef] [PubMed]
- Alam, M.A.; Rahman, M.; Ahmed, S.; Jahan, N.; Khan, M.A.A.; Islam, M.R.; Hossain, A. Genetic variation and genotype by environment interaction for agronomic traits in maize (Zea mays L.) hybrids. Plants 2022, 11, 1522. [Google Scholar] [CrossRef] [PubMed]
- Paterson, A.H.; Damon, S.; Hewitt, J.D.; Zamir, D.; Rabinowitch, H.D.; Lincoln, S.E.; Lander, E.S.; Tanksley, S.D. Mendelian factors underlying quantitative traits in tomato: Comparison across species, generations, and environments. Genetics 1991, 127, 181–197. [Google Scholar] [CrossRef] [PubMed]
- Pearson, K.I. Mathematical contributions to the theory of evolution—VII. On the correlation of characters not quantitatively measurable. Philosophical Transactions of the Royal Society of London. Series A. Contain. Papers Math. Phys. Character 1900, 195, 262–273. [Google Scholar]
- Tuberosa, R.; Salvi, S.; Sanguineti, M.C.; Landi, P.; Maccaferri, M.; Conti, S. Mapping QTLs regulating morpho-physiological traits and yield: Case studies, shortcomings and perspectives in drought-stressed maize. Ann. Bot. 2002, 89, 941–963. [Google Scholar] [CrossRef]
- Peng, B.; Li, Y.; Wang, Y.; Liu, C.; Liu, Z.; Tan, W.; Zhang, Y.; Wang, D.; Shi, Y.; Sun, B.; et al. QTL analysis for yield components and kernel-related traits in maize across multi-environments. Theor. Appl. Genet. 2011, 122, 1305–1320. [Google Scholar] [CrossRef]
- Messmer, R.; Fracheboud, Y.; Banziger, M.; Vargas, M.; Stamp, P.; Ribaut, J.M. Drought stress and tropical maize: QTL-by-environment interactions and stability of QTLs across environments for yield components and secondary traits. Theor. Appl. Genet. 2009, 119, 913–930. [Google Scholar] [CrossRef]
- Wang, B.T.; Wu, J.Y.; Ding, J.Q.; Xi, Z.Y. Map integration of QTLs for grain yield and its related traits in maize. Acta Agron. Sinica. 2009, 35, 1836–1843. [Google Scholar] [CrossRef]
- Ma, J.; Wang, H.; Wang, L.F.; Cao, Y.Y.; Li, J.J.; Thomas, L.; Wang, L.Y.; Li, H.Y. QTL mapping and Meta-QTL analysis for grain yield related traits in maize (Zea mays L.). J. Plant Genet. Resour. 2019, 20, 37–47. [Google Scholar]
- Zhou, G.F. Identification of a Pleiotropic QTL (qKNR7.2) for Kernel Number per Row, Ear Length and General Combining Ability of Maize. Master’s Thesis, Huazhong Agricultural University, Wuhan, China, 2015. [Google Scholar]
- Li, T.F. Phenotype analysis and QTL location of yield related characters in RILs population of maize. Master’s Thesis, Northeast Agricultural University, Harbin, China, 2010. [Google Scholar]
- Liu, Z.H.; Tang, J.H.; Wei, X.Y.; Wang, C.L.; Tian, G.W.; Hu, Y.M.; Chen, W.C. QTL mapping of ear traits under low and high nitrogen conditions in maize. Sci. Agric. Sin. 2007, 40, 2409–2417. [Google Scholar]
- An, Y.Q. QTL Mapping and Analysis for Ear Traits of 4 RIL Populations in Maize. Master’s Thesis, Henan Agricultural University, Zhengzhou, China, 2016. [Google Scholar]
- Li, Y.; Fan, X.; Chen, Q.; Zhong, H. A photoperiod-responsive protein compendium and conceptual proteome roadmap outline in maize grown in growth chambers with controlled conditions. PLoS ONE 2017, 12, e174003. [Google Scholar] [CrossRef]
- Osnato, M.; Cota, I.; Nebhnani, P.; Cereijo, U.; Pelaz, S. Photoperiod control of plant growth: Flowering time genes beyond flowering. Front. Plant Sci. 2022, 12, 3359. [Google Scholar] [CrossRef]
- Cruz, D.F.; Sprenger, H.; De Meyer, S.; Herman, D. Using single-plant-omics in the field to link maize genes to functions and phenotypes. Mol. Syst. Biol. 2020, 16, e9667. [Google Scholar] [CrossRef]
- Nishad, R.; Ahmed, T.; Rahman, V.J.; Kareem, A. Modulation of plant defense system in response to microbial interactions. Front. Microbiol. 2020, 11, 1298. [Google Scholar] [CrossRef]
- Tamaki, H.; Konishi, M.; Daimon, Y.; Aida, M.; Tasaka, M.; Sugiyama, M. Identification of novel meristem factors involved in shoot regeneration through the analysis of temperature-sensitive mutants of Arabidopsis. Plant J. 2009, 57, 1027–1039. [Google Scholar] [CrossRef]
- Bovy, A.; Van Den Berg, C.; De Vrieze, G.; Thompson, W.F.; Weisbeek, P.; Smeekens, S. Light-regulated expression of the Arabidopsis thaliana ferredoxin gene requires sequences upstream and downstream of the transcription initiation site. Plant Mol. Biol. 1995, 27, 27–39. [Google Scholar] [CrossRef]
- Moussa, A.A.; Mandozai, A.; Jin, Y.; Qu, J.; Zhang, Q.; Zhao, H.; Wang, P. Genome-wide association screening and verification of potential genes associated with root architectural traits in maize (Zea mays L.) at multiple seedling stages. BMC Genom. 2021, 22, 558. [Google Scholar] [CrossRef]
- Yun, J.; Kim, Y.; Jung, J.; Seo, P.J.; Park, C. The AT-hook Motif-containing Protein AHL22 Regulates Flowering Initiation by Modifying FLOWERING LOCUS T Chromatin in Arabidopsis. J. Biol. Chem. 2012, 287, 15307–15316. [Google Scholar] [CrossRef]
- Morisawa, G.; Han-yama, A.; Moda, I.; Tamai, A.; Iwabuchi, M.; Meshi, T. AHM1, a Novel Type of Nuclear Matrix–Localized, MAR Binding Protein with a Single AT Hook and a J Domain–Homologous Region. Plant Cell. 2000, 12, 1903–1916. [Google Scholar]
- Woodhouse, M.R.; Cannon, E.K.; Portwood, J.L.; Harper, L.C.; Gardiner, J.M.; Schaeffer, M.L.; Andorf, C.M. A pan-genomic approach to genome databases using maize as a model system. BMC Plant Biol. 2021, 21, 385. [Google Scholar] [CrossRef]
- Wang, F.; Chen, H. Transcript Profile Analyses of Maize Silks Reveal Effective Activation of Genes Involved in Microtubule-Based Movement, Ubiquitin-Dependent Protein Degradation, and Transport in the pollination process. PLoS ONE 2013, 8, e53545. [Google Scholar]
- Tan, X.; Liu, X.; Wang, W.; Jia, D.; Chen, L.; Zhang, X.; Ye, D. Mutations in the Arabidopsis Nuclear-Encoded Mitochondrial Phage-Type RNA Polymerase Gene RPOTm Led to Defects in Pollen Tube Growth, Female Gametogenesis and Embryogenesis. Plant Cell Physiol. 2010, 51, 635–649. [Google Scholar] [CrossRef] [PubMed]
- Ding, H.; Qin, C.; Luo, X.; Li, L.; Chen, Z.; Liu, H.; Gao, J.; Lin, H.; Shen, Y.; Zhao, M.; et al. Heterosis in Early Maize Ear Inflorescence Development: A Genome-Wide Transcription Analysis for Two Maize Inbred Lines and Their Hybrid. Int. J. Mol. Sci. 2014, 15, 13892–13915. [Google Scholar] [CrossRef] [PubMed]
- Vollbrecht, E.; Springer, P.S.; Goh, L.; Buckler IV, E.S.; Martienssen, R. Architecture of floral branch systems in maize and related grasses. Nature 2005, 436, 1119–1126. [Google Scholar] [CrossRef]
- Zhu, Q.L. Screening and identification of proteins interacting with kernel number per row-associated protein (ZmSTKR) of maize. Master’s Thesis, Huazhong Agricultural University, Wuhan, China, 2015. [Google Scholar]
- Parvathaneni, R.K.; Bertolini, E.; Shamimuzzaman, M.; Vera, D.L.; Lung, P.Y.; Rice, B.R.; Eveland, A.L. The regulatory landscape of early maize inflorescence development. Genome Biol. 2020, 2, 165. [Google Scholar] [CrossRef]
- Springer, N.M.; Stupar, R.M. Allelic variation and heterosis in maize: How do two halves make more than a whole? Genome Res. 2007, 17, 264–275. [Google Scholar] [CrossRef]
- Huo, D.; Ning, Q.; Shen, X.; Liu, L.; Zhang, Z. QTL Mapping of Kernel Number-Related Traits and Validation of One Major QTL for Ear Length in Maize. PLoS ONE 2016, 11, e155506. [Google Scholar] [CrossRef]
- Fan, X.M.; Zhang, Y.D.; Yao, W.H.; Bi, Y.Q.; Liu, L.; Chen, H.M.; Kang, M.S. Reciprocal Diallel Crosses Impact Combining Ability, Variance Estimation, and Heterotic Group Classification. Crop Sci. 2014, 54, 89–97. [Google Scholar] [CrossRef]


| Parents | Pedigree | Heterotic Group | Ecological Type |
|---|---|---|---|
| Ye107 | Derived from US hybrid DeKalb XL80 | Reid | Temperate |
| CML312 | S89500-F2-2-2-1-1-B*5-2-1-6-1 | Non-Reid | Tropical |
| TML418 | Derived from Monsanto hybrid in Thailand | Non-Reid | Subtropical |
| Populations | Environment | Mean | Standard Deviation | Skewness | Kurtosis | Coefficient of Variation (%) | Rang of Variations | h2 (%) | Population Heritability (%) | r |
|---|---|---|---|---|---|---|---|---|---|---|
| pop1 | 18DH | 17.461 | 3.631 | 0.224 | −0.415 | 20.8 | 10–27 | 33.6 | 33.6 | 0.96 |
| 18BS | 17.608 | 3.854 | 0.328 | −0.217 | 21.9 | 9.6–28 | 33.5 | |||
| pop2 | 19DH | 18.215 | 4.496 | 0.491 | 0.395 | 24.7 | 8–32.6 | 34.7 | 32.7 | 0.89 |
| 19BS | 17.564 | 4.321 | 0.261 | 0.175 | 24.6 | 7.5–31 | 34.8 |
| Mapping Population | Chromosome | Number of SNP Markers | Length of Chromosome (cM) | Average Distance (cM) |
|---|---|---|---|---|
| pop1 | 1 | 305 | 208.792 | 0.685 |
| 2 | 508 | 324.439 | 0.639 | |
| 3 | 336 | 144.936 | 0.431 | |
| 4 | 413 | 315.664 | 0.764 | |
| 5 | 442 | 468.093 | 1.059 | |
| 6 | 421 | 384.379 | 0.913 | |
| 7 | 113 | 216.03 | 1.912 | |
| 8 | 197 | 282.949 | 1.436 | |
| 9 | 375 | 410.947 | 1.096 | |
| 10 | 177 | 247.245 | 1.397 | |
| Total | 3287 | 3003.474 | - | |
| Mean | 328.7 | 300.347 | 1.033 | |
| pop2 | 1 | 79 | 437.997 | 5.544 |
| 2 | 119 | 606.246 | 5.095 | |
| 3 | 100 | 342.968 | 3.430 | |
| 4 | 142 | 806.611 | 5.680 | |
| 5 | 62 | 295.757 | 4.770 | |
| 6 | 81 | 309.359 | 3.819 | |
| 7 | 42 | 148.887 | 3.545 | |
| 8 | 79 | 213.109 | 2.698 | |
| 9 | 73 | 62.836 | 0.861 | |
| 10 | 54 | 230.152 | 4.262 | |
| Total | 831 | 3453.922 | - | |
| Mean | 83.1 | 345.392 | 1.100 |
| Mapping Population | QTL | Chromosome | Position (cM) | Mapping Interval | LOD | Additive Effect | R2 |
|---|---|---|---|---|---|---|---|
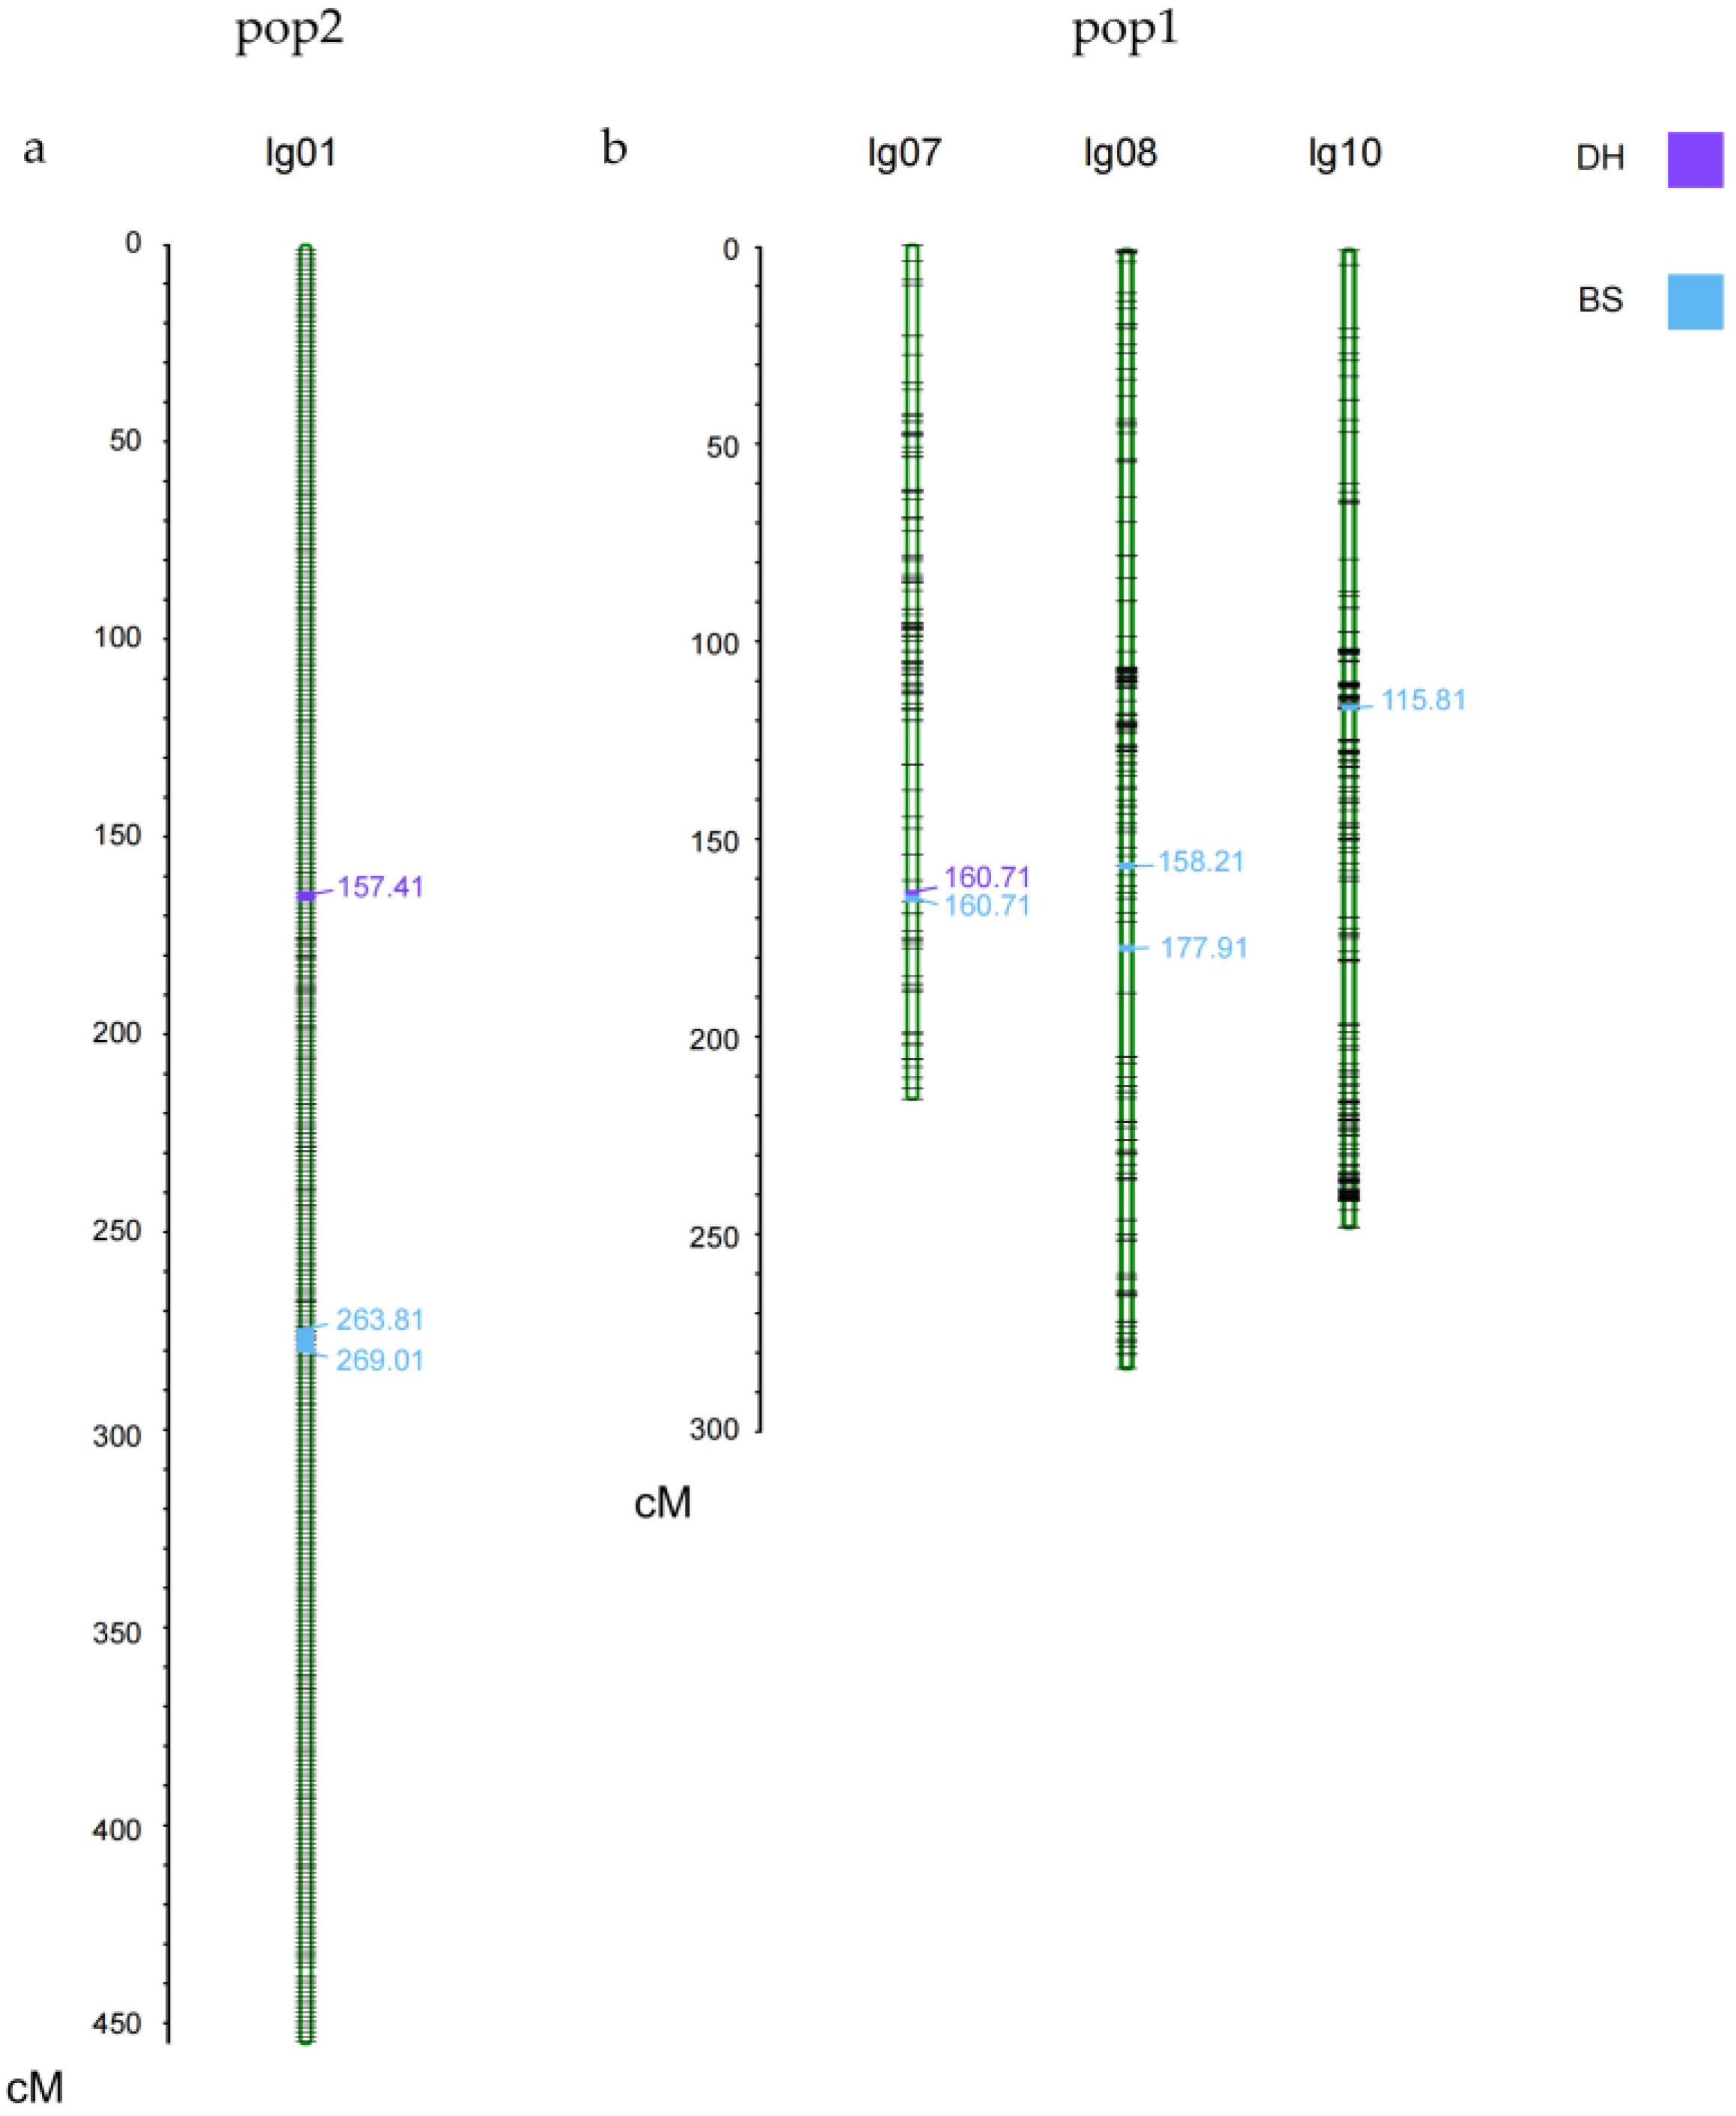
| pop1 | qKNR7-1 | 7 | 160.71 | 170,843,056–171,585,347 | 5.04 | 1.37 | 0.103 |
| qKNR8-1 | 8 | 158.21 | 101,154,574–107,979,743 | 2.75 | −0.91 | 0.052 | |
| qKNR8-2 | 8 | 177.91 | 110,450,438–136,744,298 | 4.59 | −1.51 | 0.141 | |
| qKNR10-1 | 10 | 115.81 | 46,406,004–46,600,980 | 2.81 | −0.89 | 0.050 | |
| pop2 | qKNR1-1 | 1 | 157.41 | 122,555,185–174,447,829 | 2.57 | 1.48 | 0.095 |
| qKNR1-2 | 1 | 263.81 | 87,932,948–87,933,008 | 2.53 | 1.27 | 0.066 | |
| qKNR1-3 | 1 | 269.01 | 82,649,009–87,932,982 | 3.21 | 1.54 | 0.098 |
| Population | Chromosome | Position (cM) | Mapping Interval | Candidate Gene | Gene Annotation |
|---|---|---|---|---|---|
| pop1 | 7 | 165.94 | 172,759,694 | Zm00001d022202 | protein phosphatase homolog2 |
| pop2 | 1 | 266.45 | 2,237,453 | Zm00001d027300 | protein PAIR1 |
| Mapping Population | Marker | Chromosome | Mapping Interval | p-Value | Candidate Gene | Gene Annotation |
|---|---|---|---|---|---|---|
| pop1 | Snp-99488079 | 1 | 99,467,951–99,508,106 | 5.97 | Zm00001d030014 (dist = 63,542) | tetraspanin family protein |
| Zm00001d030015 (dist = 45,616) | - | |||||
| Snp-224368029 | 3 | 224,347,842–224,388,029 | 5.94 | Zm00001d044290 | Beta-galactosidase 1 | |
| Snp-167546055 | 7 | 167,526,037–167,566,055 | 5.68 | Zm00001d021985 | formin-like protein 13 | |
| Snp-171585347 | 7 | 171,565,347–171,605,347 | 5.32 | Zm00001d022168 (dist = 26,086) | AT hook-containing MAR binding 1-like protein [Zea mays] | |
| Zm00001d022169 (dist = 111,235) | RNA polymerase T phage-like 1 | |||||
| Snp-132258909 | 8 | 132,238,909–132,278,909 | 5.01 | Zm00001d010888 (dist = 11,763) | - | |
| Zm00001d010889 (dist = 54,452) | myb-like protein J | |||||
| both | Snp-99488079 | 1 | 99,467,951–99,508,106 | 5.4 | Zm00001d030014 (dist = 63,542) | tetraspanin family protein |
| Zm00001d030015 (dist = 45,616) | - | |||||
| Snp-230569504 | 2 | 230,549,473–230,589,504 | 5.82 | Zm00001d007391 | - | |
| Snp-226862468 | 4 | 226,842,468–226,882,476 | 5.04 | Zm00001d053342 | - | |
| Zm00001d053345 | - | |||||
| Snp-45947193 | 5 | 45,927,193–45,967,193 | 5.55 | Zm00001d014421 | Growth-regulating factor 6 | |
| Snp-167546055 | 7 | 167,526,055–167,566,055 | 5.07 | Zm00001d021985 | formin-like protein 13 |
| Marker | Chromosome | Position | Mapping Interval | Candidate Gene | Gene Annotation |
|---|---|---|---|---|---|
| qKNR7-1 | 7 | 160.71 cM | 170,843,056–171,585,347 | Zm00001d022202 | protein phosphatase homolog2 |
| Snp-171585347 | 7 | 171,585,347 bp | 171,565,347–171,605,347 | Zm00001d022168 | AT hook-containing MAR binding 1-like protein |
| Zm00001d022169 | RNA polymerase T phage-like 1 |
Disclaimer/Publisher’s Note: The statements, opinions and data contained in all publications are solely those of the individual author(s) and contributor(s) and not of MDPI and/or the editor(s). MDPI and/or the editor(s) disclaim responsibility for any injury to people or property resulting from any ideas, methods, instructions or products referred to in the content. |
© 2023 by the authors. Licensee MDPI, Basel, Switzerland. This article is an open access article distributed under the terms and conditions of the Creative Commons Attribution (CC BY) license (https://creativecommons.org/licenses/by/4.0/).
Share and Cite
Wang, Y.; Bi, Y.; Jiang, F.; Shaw, R.K.; Sun, J.; Hu, C.; Guo, R.; Fan, X. Mapping and Functional Analysis of QTL for Kernel Number per Row in Tropical and Temperate–Tropical Introgression Lines of Maize (Zea mays L.). Curr. Issues Mol. Biol. 2023, 45, 4416-4430. https://doi.org/10.3390/cimb45050281
Wang Y, Bi Y, Jiang F, Shaw RK, Sun J, Hu C, Guo R, Fan X. Mapping and Functional Analysis of QTL for Kernel Number per Row in Tropical and Temperate–Tropical Introgression Lines of Maize (Zea mays L.). Current Issues in Molecular Biology. 2023; 45(5):4416-4430. https://doi.org/10.3390/cimb45050281
Chicago/Turabian StyleWang, Yuling, Yaqi Bi, Fuyan Jiang, Ranjan Kumar Shaw, Jiachen Sun, Can Hu, Ruijia Guo, and Xingming Fan. 2023. "Mapping and Functional Analysis of QTL for Kernel Number per Row in Tropical and Temperate–Tropical Introgression Lines of Maize (Zea mays L.)" Current Issues in Molecular Biology 45, no. 5: 4416-4430. https://doi.org/10.3390/cimb45050281
APA StyleWang, Y., Bi, Y., Jiang, F., Shaw, R. K., Sun, J., Hu, C., Guo, R., & Fan, X. (2023). Mapping and Functional Analysis of QTL for Kernel Number per Row in Tropical and Temperate–Tropical Introgression Lines of Maize (Zea mays L.). Current Issues in Molecular Biology, 45(5), 4416-4430. https://doi.org/10.3390/cimb45050281