Article

Genome-Wide Survey Reveals the Microsatellite Characteristics and Phylogenetic Relationships of Harpadon nehereus

Fisheries College, Zhejiang Ocean University, Zhoushan 316022, China
*
Author to whom correspondence should be addressed.
Curr. Issues Mol. Biol. 2021, 43(3), 1282-1292; https://doi.org/10.3390/cimb43030091
Submission received: 3 September 2021 / Revised: 19 September 2021 / Accepted: 22 September 2021 / Published: 25 September 2021
(This article belongs to the Section Bioinformatics and Systems Biology)

Abstract

:
Harpadon nehereus forms one of the most important commercial fisheries along the Bay of Bengal and the southeast coast of China. In this study, the genome-wide survey dataset first produced using next-generation sequencing (NGS) was used to provide general information on the genome size, heterozygosity and repeat sequence ratio of H. nehereus. About 68.74 GB of high-quality sequence data were obtained in total and the genome size was estimated to be 1315 Mb with the 17-mer frequency distribution. The sequence repeat ratio and heterozygosity were calculated to be 52.49% and 0.67%, respectively. A total of 1,027,651 microsatellite motifs were identified and dinucleotide repeat was the most dominant simple sequence repeat (SSR) motif with a frequency of 54.35%. As a by-product of whole genome sequencing, the mitochondrial genome is a powerful tool to investigate the evolutionary relationships between H. nehereus and its relatives. The maximum likelihood (ML) phylogenetic tree was constructed according to the concatenated matrix of amino acids translated from the 13 protein-coding genes (PCGs). Monophyly of two species of the genus Harpadon was revealed in the present study and they formed a monophyletic clade with Saurida with a high bootstrap value of 100%. The results would help to push back the frontiers of genomics and open the doors of molecular diversity as well as conservation genetics studies on this species.

1. Introduction

Harpadonnehereus (Hamilton, 1822), also known as Bombay duck or nomei fish, is generally distributed in the estuarine and nearshore shallow waters of the Indian Ocean and the Western Pacific Ocean [1]. As a familiar marine lizardfish, H. nehereus is welcomed by consumers for its delicious taste and high nutritional value. It is admeasured that the protein content reaches up to 70% of the dry weight and the calcium content ranges from 1500 to 2500 mg/100 g [2]. Nowadays, it is one of the most important commercial fisheries along the coast of southeast China, Pakistan, India and the Bay of Bengal region [3,4,5,6]. In China, the potential amount of H. nehereus in the East China Sea was estimated to surpass 5000 tons, which indicated that H. nehereus occupied a significant position in the coastal marine ecosystem of China. Nevertheless, in recent years, a recession of H. nehereus resources has emerged along with the increasing proportion of annual capture yield [6,7,8]. Therefore, it is necessary to strengthen protection of this fishery in a sustainable way, and further ensure rational exploitation and continued utilization of H. nehereus resources.
Investigation of genetic background is an essential precondition for fishery resource management [9]. However, most studies on H. nehereus have been conducted focusing on stock assessment, morphological traits, biological habits and nutrition processing [10,11,12,13], and limited studies involve the field of genetics. For example, these studies include population genetic structure and genetic variation analysis based on simple sequence repeat (SSR), sequence-related amplified polymorphism (SRAP) and mitochondrial DNA (mtDNA) markers [14,15,16,17], the molecular phylogenetic relationship revealed by mtDNA Cyt b, 16S rRNA and the complete mtDNA genome [17,18,19], and the expression analysis of calcium cycling genes by transcriptome sequencing [20]. With the accomplishment of the Human Genome Project (HGP) early in 2001, a new era of genomics has arrived in the field of genetics research. Thus far, more and more genome sequencings of economic fishes such as Larimichthys crocea, Cynoglossus semilaevis, Salmo salar, Oncorhynchus mykiss and Gadus morhua have been carried out along with the rapid development of high-throughput sequencing technology [21]. However, the genomic resource for H. nehereus is still extremely scarce and its full draft genome remains unclear. Therefore, in this study, we conducted a genomic survey of H. nehereus via next-generation sequencing (NGS) technology for the first time to investigate its genomic profile, excavate the SSR markers and further identify the taxonomic position and phylogenetic relationship of H. nehereus. The results might provide new insight into genetic resource conservation and developmental utilization for H. nehereus.

2. Materials and Methods

2.1. Sample Collecting

A specimen of a male H. nehereus (body length 16.1 cm and body weight 26.9 g) was obtained from coastal waters by a trawl net in autumn 2020. Approximately 2–3 g fresh musculature below the dorsal fin was snipped and soaked in liquid nitrogen as soon as the fish was captured. The sample was immediately brought to the Fisheries Ecology and Biodiversity Laboratory (FEBL) of Zhejiang Ocean University and stored in a −80 °C ultra-low temperature freezer. All animal experiments were conducted according to the guideline and approval of the Ethics Committee for Animal Experimentation of Zhejiang Ocean University, Zhoushan, China. The project identification code was ZJOU-ECAE20210128 and approval date was 6 January 2021.

2.2. DNA Extraction, Library Construction and Illumina Sequencing

The genomic DNA was isolated using a standard phenol–chloroform method [22]. The integrity of DNA was examined by 1% agarose gel electrophoresis. The quality of DNA was assessed using a NanoPhotometer spectrophotometer (Implen, Munich, Germany), Qubit 2.0 fluorometer (Invitrogen, Waltham, MA, USA) and Agilent 2100 bioanalyzer (Agilent, Santa Clara, CA, USA). The qualified DNA sample was randomly interrupted by an ultrasonic crusher (Covaris M220, Woburn, MA, USA), and the DNA fragments (300–350 bp) were used to construct two paired-end DNA libraries followed by terminal repair, adding A-tail and sequencing adaptors, purification and PCR amplification. The constructed library was then sequenced by Wuhan Gooalgene Technology Co., Ltd., Wuhan, China (https://www.gooalgene.com/) (accessed on 18 March 2021) based on the Illumina Nova platform with a read length of 2 × 150 bp. The sequencing data were deposited in the short-read archive (SRA) database (http://www.ncbi.nlm.nih.gov/sra/) (accessed on 15 June 2021) under the accession number PRJNA738314.

2.3. Sequence Quality Control, Assembly and K-mer Analysis

Raw data were first converted to single-sample FASTQ files through base calling and then filtered by SOAPnuke v1.5 [23] with the following criteria: (1) removing reads with splice junctions, (2) discarding duplicated reads caused by PCR reaction or other reasons, (3) deleting reads with N base (unable to determine base information) ratio greater than 10% and low-quality bases (base quality ≤ 5) more than 50% of the total length. Clean data were de novo assembled into contigs and scaffolds by SOAPdenovo v2.01 software [24]. The K-mer analysis was performed to estimate genome size, heterozygosity and repetitive sequences of the genome using Jellyfish v2.2.10 (http://www.genome.umd.edu/jellyfish.html) (accessed on 9 April 2021) and a de Bruijn graph assembler GenomeScope (http://qb.cshl.edu/genomescope/) (accessed on 21 April 2021). Genome size could be expressed as the formula: K-mer number/peak depth [25]. Non-overlapping sliding windows of 10 kb along the assembled sequence were used to calculate the GC content and average depth [26,27].

2.4. Microsatellite Identification and Phylogenetic Analysis

Perl script MISA (MIcroSAtellite identification tool) was used to identify simple sequence repeats (SSRs) in the genome of H. nehereus [28]. The parameters were set for the detection of di-, tri-, tetra-, penta- and hexanucleotide SSR motifs with a minimum of 6, 5, 5, 5 and 5 repeats, respectively. The distribution and frequency of SSRs were computed and mapped by Microsoft Excel. The complete mitochondrial DNA (mtDNA) sequence of H. nehereus was assembled by MITObim version 1.9.1 (https://github.com/chrishah/MITObim) (accessed on 20 May 2021) and annotated using the online tool MITOS (http://mitos2.bioinf.uni-leipzig.de/index.py) (accessed on 26 May 2021). The mtDNA sequence was corrected manually comparing with published sequences of H. nehereus (GenBank accession numbers: JX534239 and MH204885). The nucleotide composition and genetic relationships were analyzed by MEGA 11 [29]. Phylogenetic analysis was performed using fifty-eight complete mtDNA genomes of related species downloaded from GenBank, with Ijimaia dofleini (GenBank accession number: AP002917) selected as an outgroup. The maximum likelihood (ML) method was used to construct the phylogenetic tree based on concatenated amino acids of the 13 protein-coding genes (PCGs).

3. Results

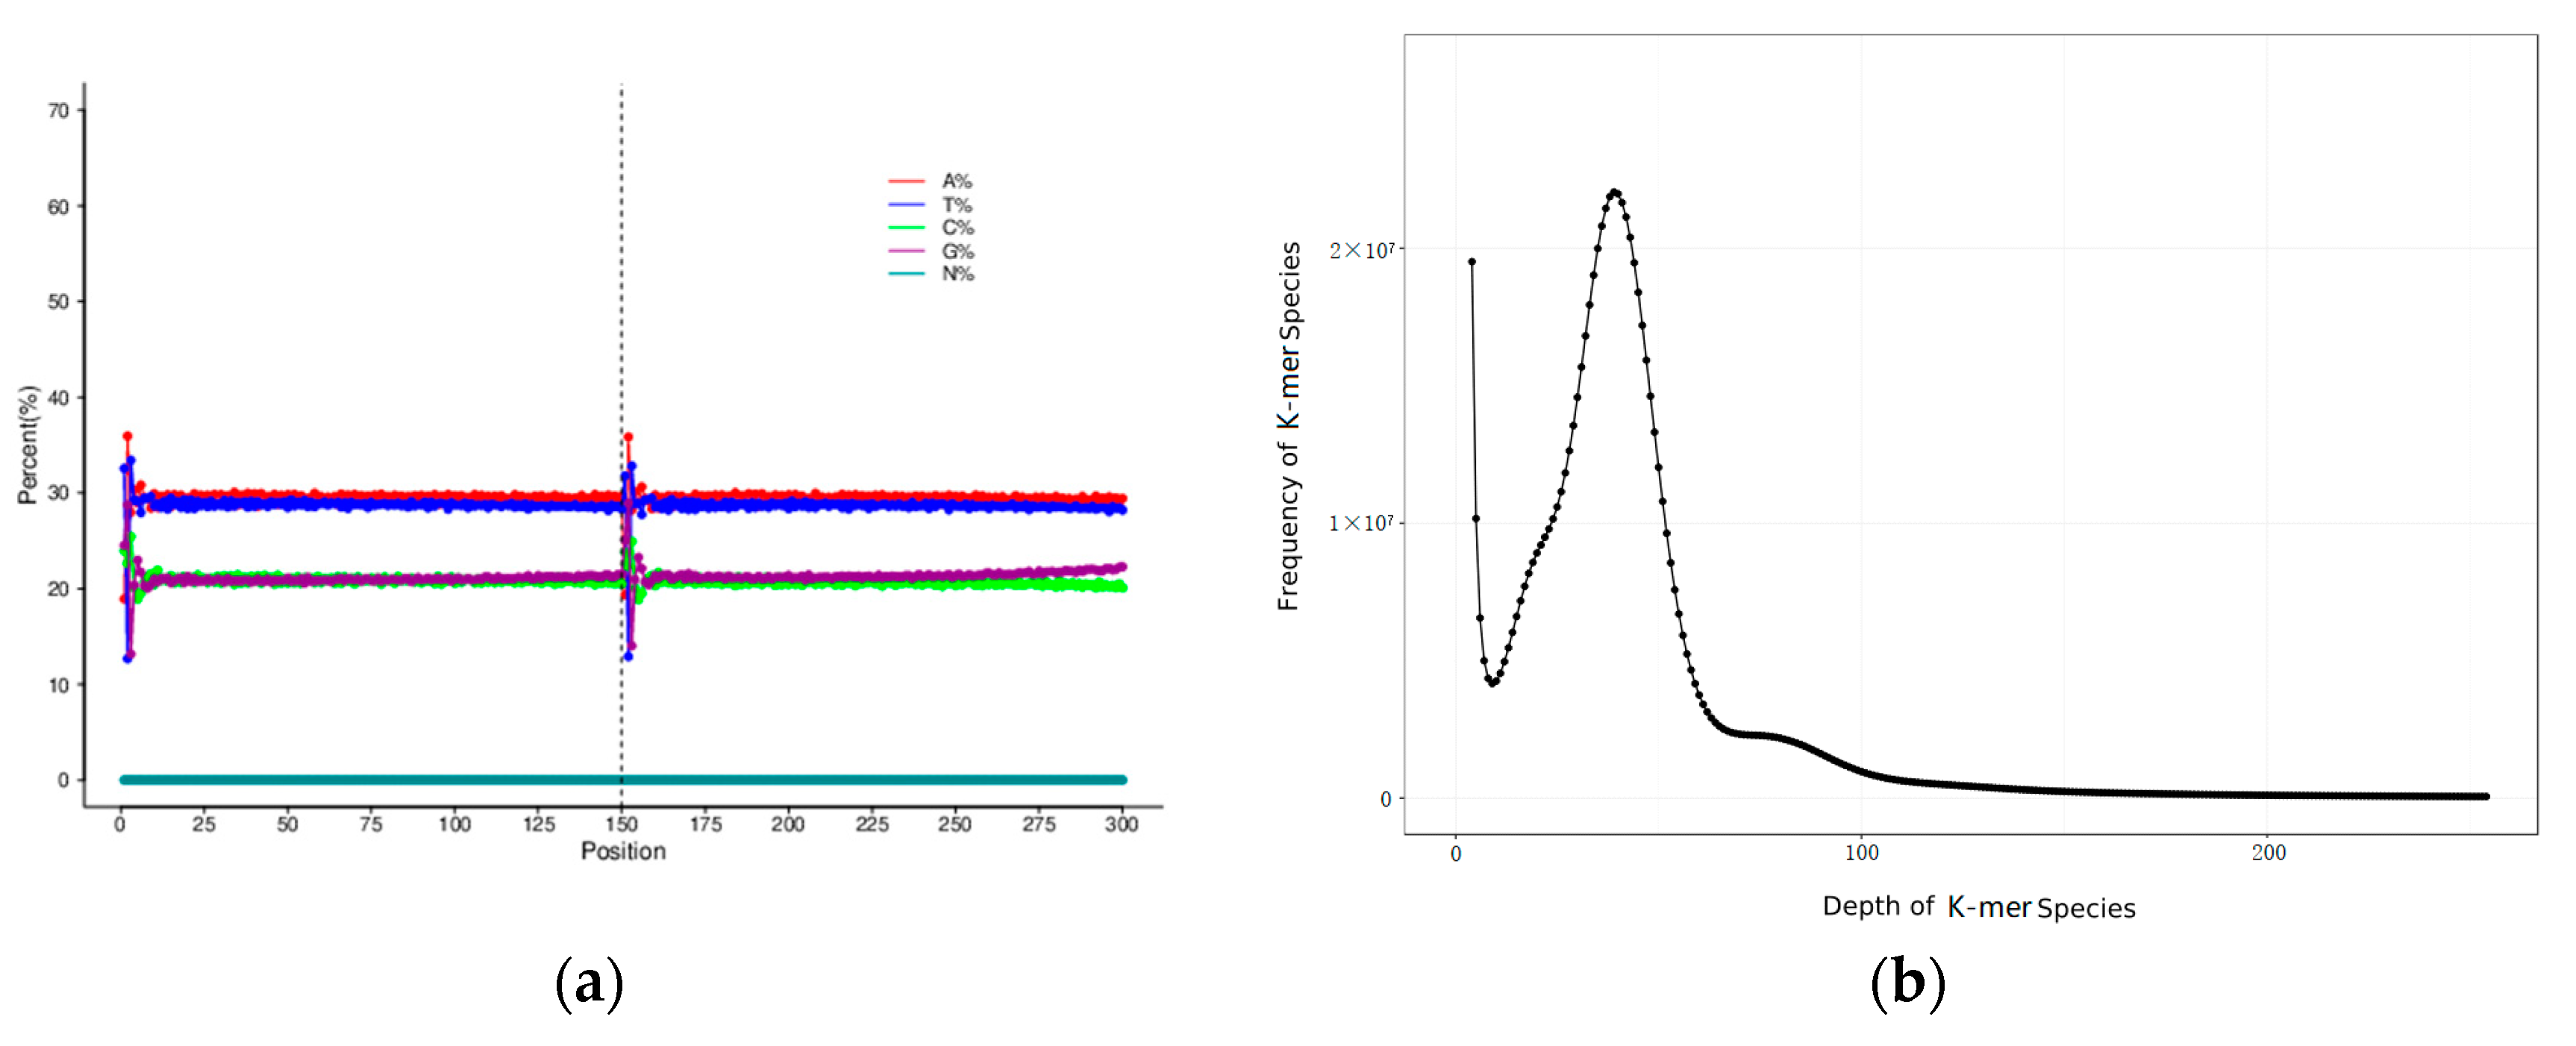
3.1. Sequencing Data Statistics and Sequence Quality Evaluation

After sequence filtering and correction, a total of 68.74 Gb high-quality data were generated by the Illumina Nova platform with high-throughput paired-end sequencing in this study. The Q20 (base quality > 20) value, Q30 (base quality > 30) value and GC content were 96.64%, 91.35% and 41.78%, respectively, with the approximate sequencing depth of 50×. Ten thousand pairs of reads were randomly selected from the filtered high-quality data and compared with the Nucleotide Sequence Database (NT) from the National Center for Biotechnology Information (NCBI) database using the Basic Local Alignment Search Tool (BLAST). The results showed the library was successfully compared to the related species of H. nehereus, which proved that there was no obvious exogenous contamination during the library construction. The proportion of single bases presented the separation of AT content and GC content. In addition, the N content was close to zero (Figure 1a). All of this suggested that the sequencing quality was good.

3.2. Genome Assembly, Heterozygosity and Repeat Prediction

The de Bruijn graph-based assembler SOAPdenovo was applied to generate a total length of 1.35 Gb contigs with an N50 length of 596 bp. A total number of 2,539,084 sequences (the max length was 92,118 bp) comprised approximately 1.36 Gb scaffolds with an N50 length of 1568 kb (Table 1). K-mer analysis (K = 17) was used to estimate the genomic characteristics. The K-mer distribution map is shown in Figure 1b. The K-mer number obtained from the sequencing data was 54,514,460,352, with a K-mer depth of 39. The revised genome size of the diploid fish H. nehereus was 1315 Mb after eliminating the effects of erroneous K-mers. The heterozygosity ratio and repeat sequence ratio were 0.67% and 52.49%, respectively.

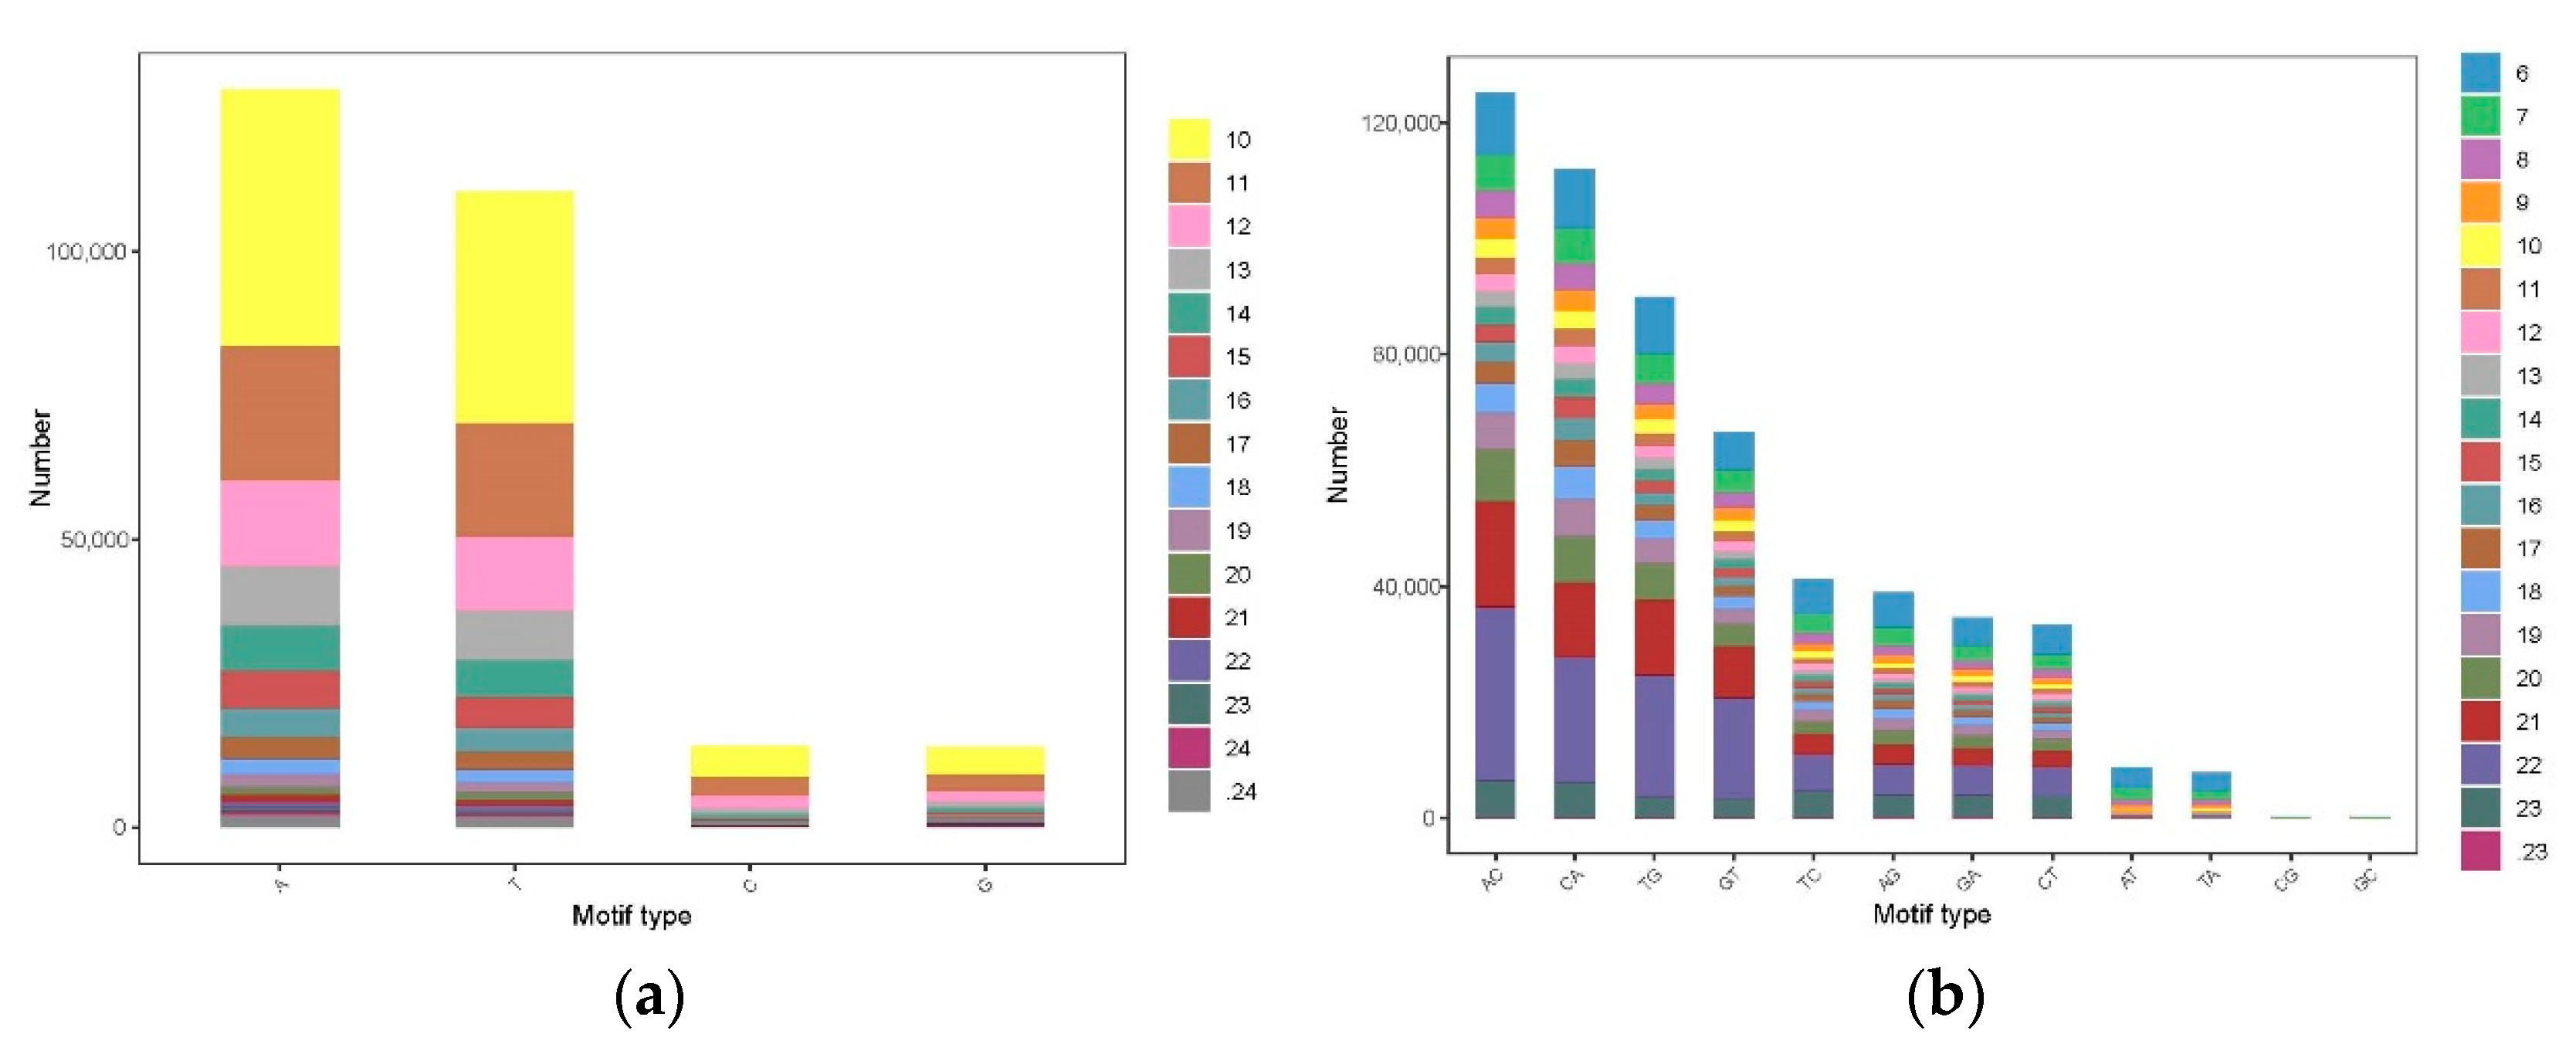
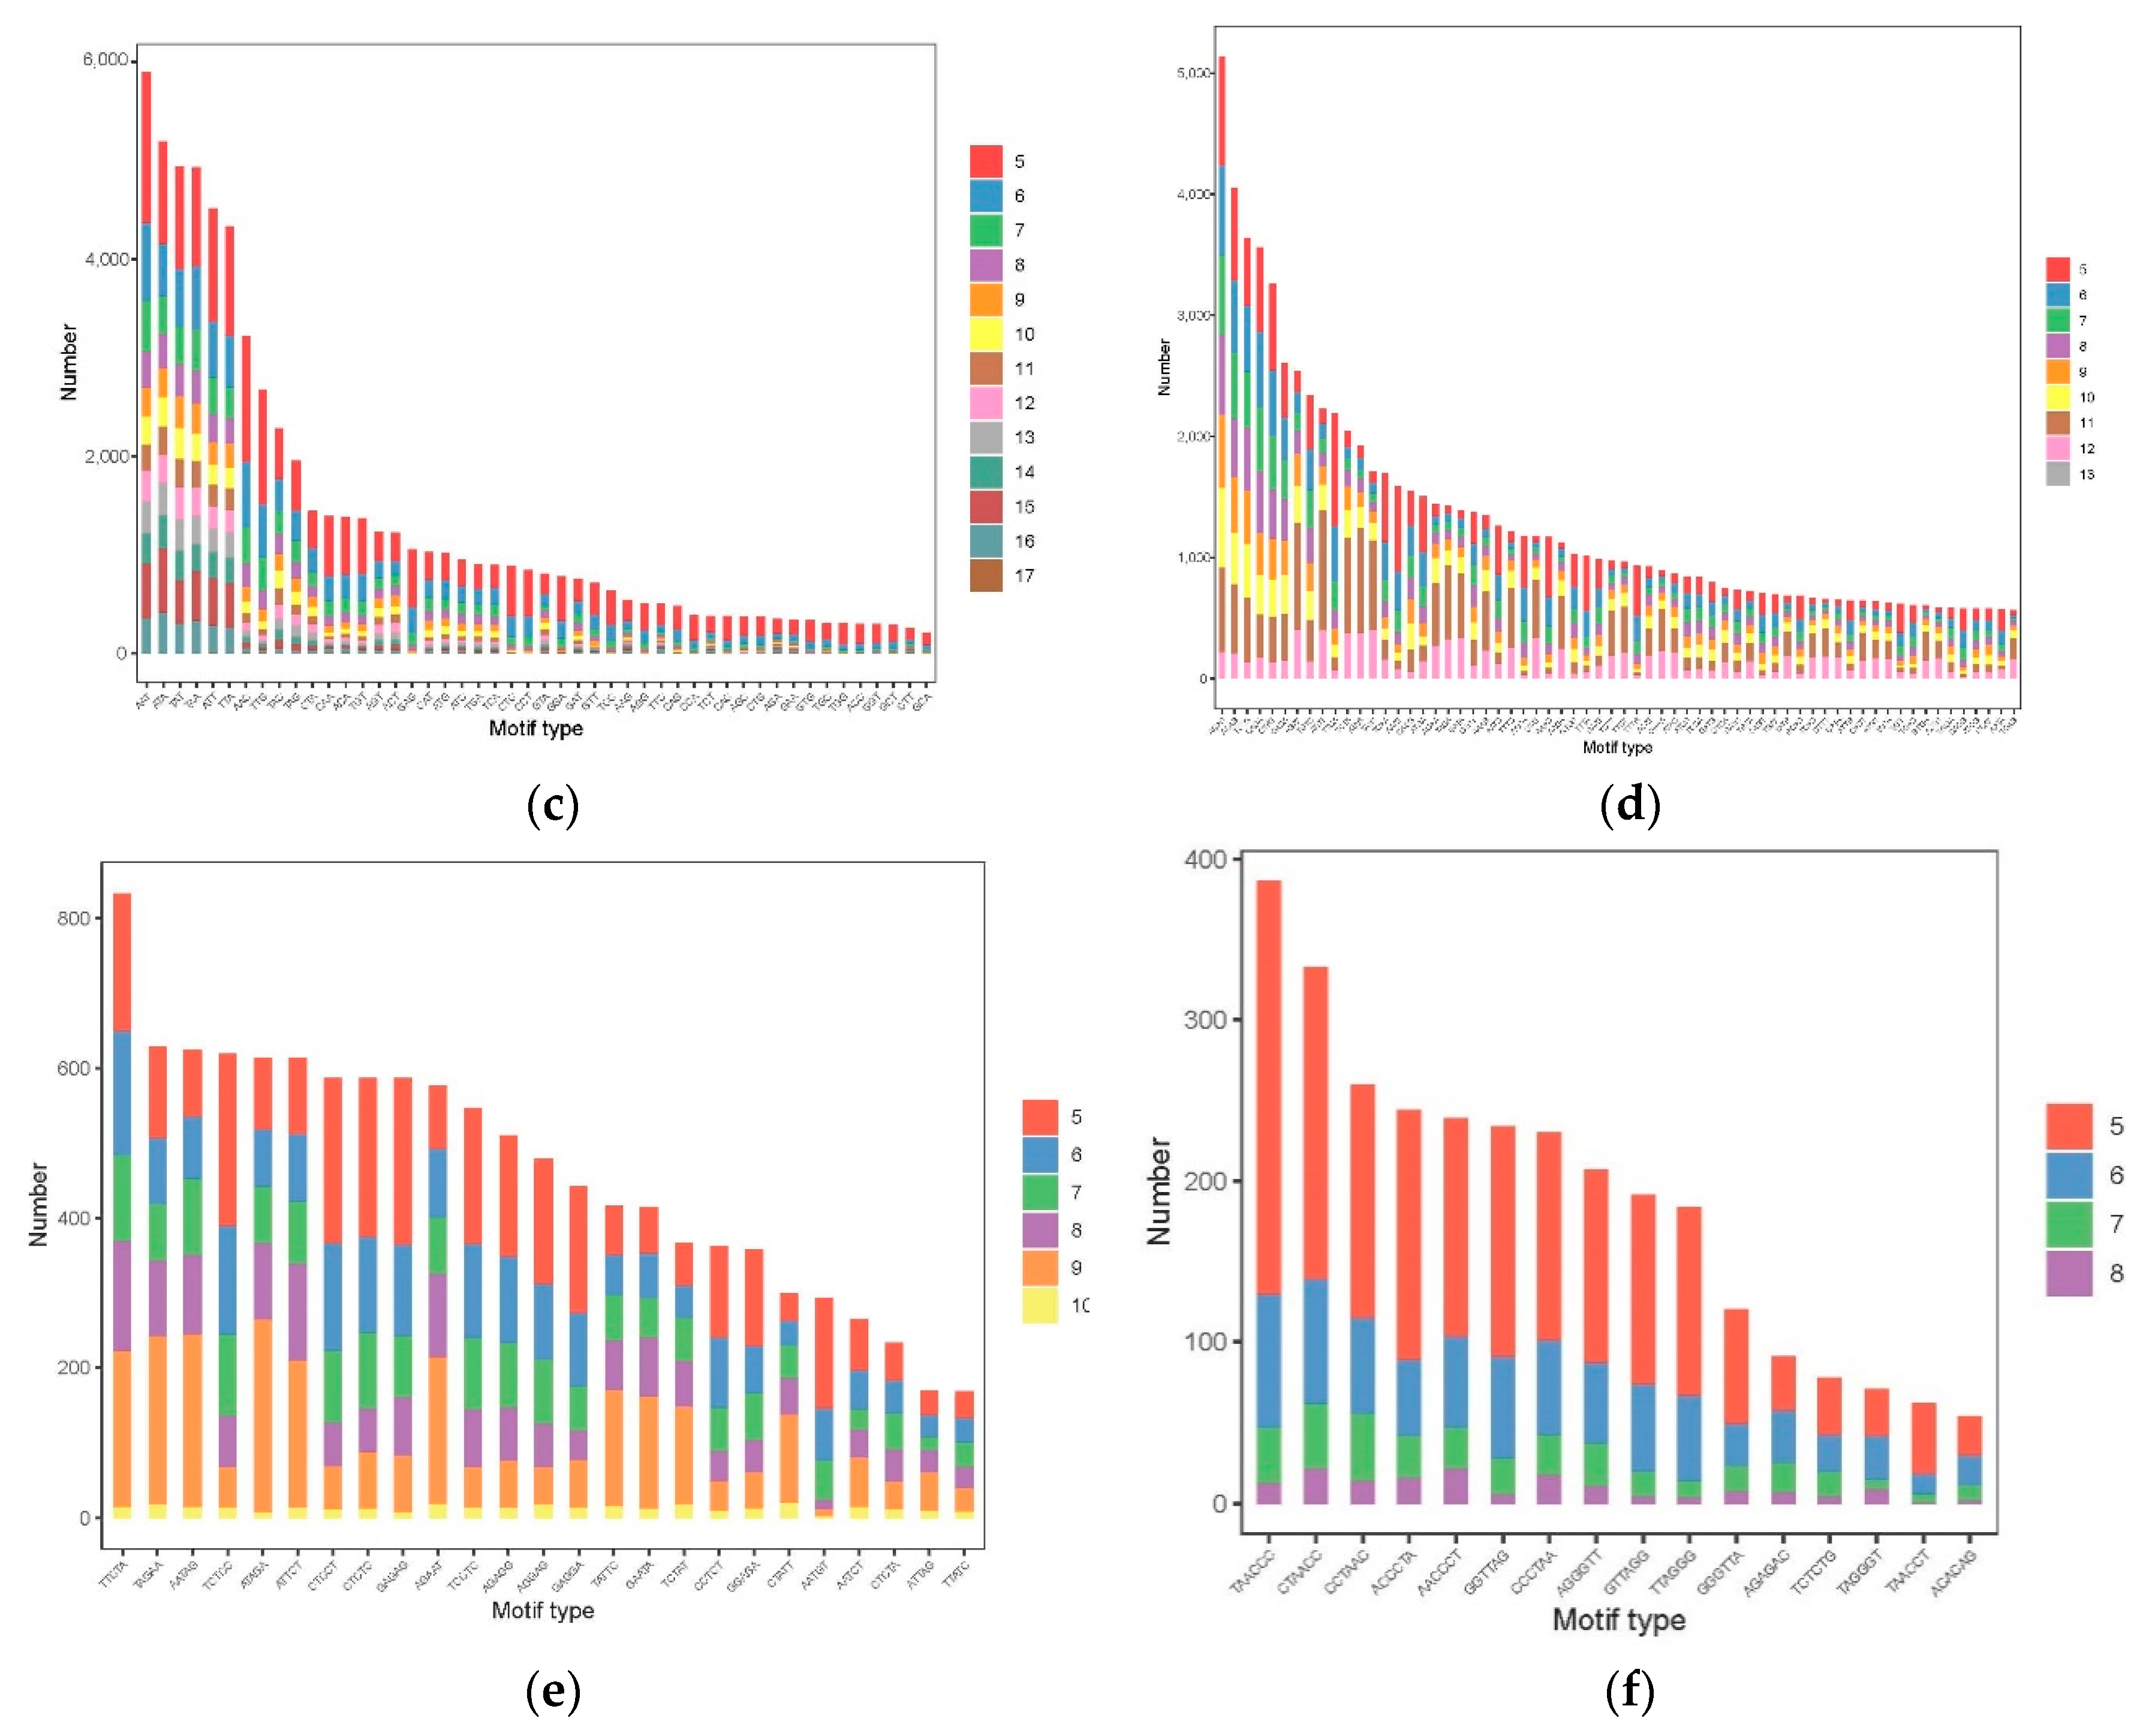
3.3. The Distribution and Characteristics of SSR Loci

A total of 1,027,651 SSR-containing motif repeats were identified, with a total SSR length of 27,355,367 bp (Table 2). Among all these SSRs, the mono-, di-, tri- and tetra-nucleotide repeats contributed nearly 99% of SSRs in H. nehereus. The dinucleotide repeat was the most abundant SSR marker, accounting for 54.35% of the total SSR markers, which was followed by mononucleotide (25.96%) and tetranucleotide (10.26%) repeats. The percentage of hexaucleotide repeats was the lowest of all (0.53%). The frequency of different repeat motifs is presented in Figure 2. The frequency of A/T repeats was the highest within the four types of mononucleotide repeat. Among the dinucleotide microsatellite motifs, the CA/TG repeat motif was the most abundant, which accounted for 19.64%, followed by AC/GT at 18.66%. The AAT/ATT (1.05%) repeat motif was the most frequent among all types of repeats. Additionally, among the tetranucleotide repeat motifs, the common motifs were AGAC/GTCT and ACAG/CTGT, accounting for 0.63% and 0.71%, respectively.

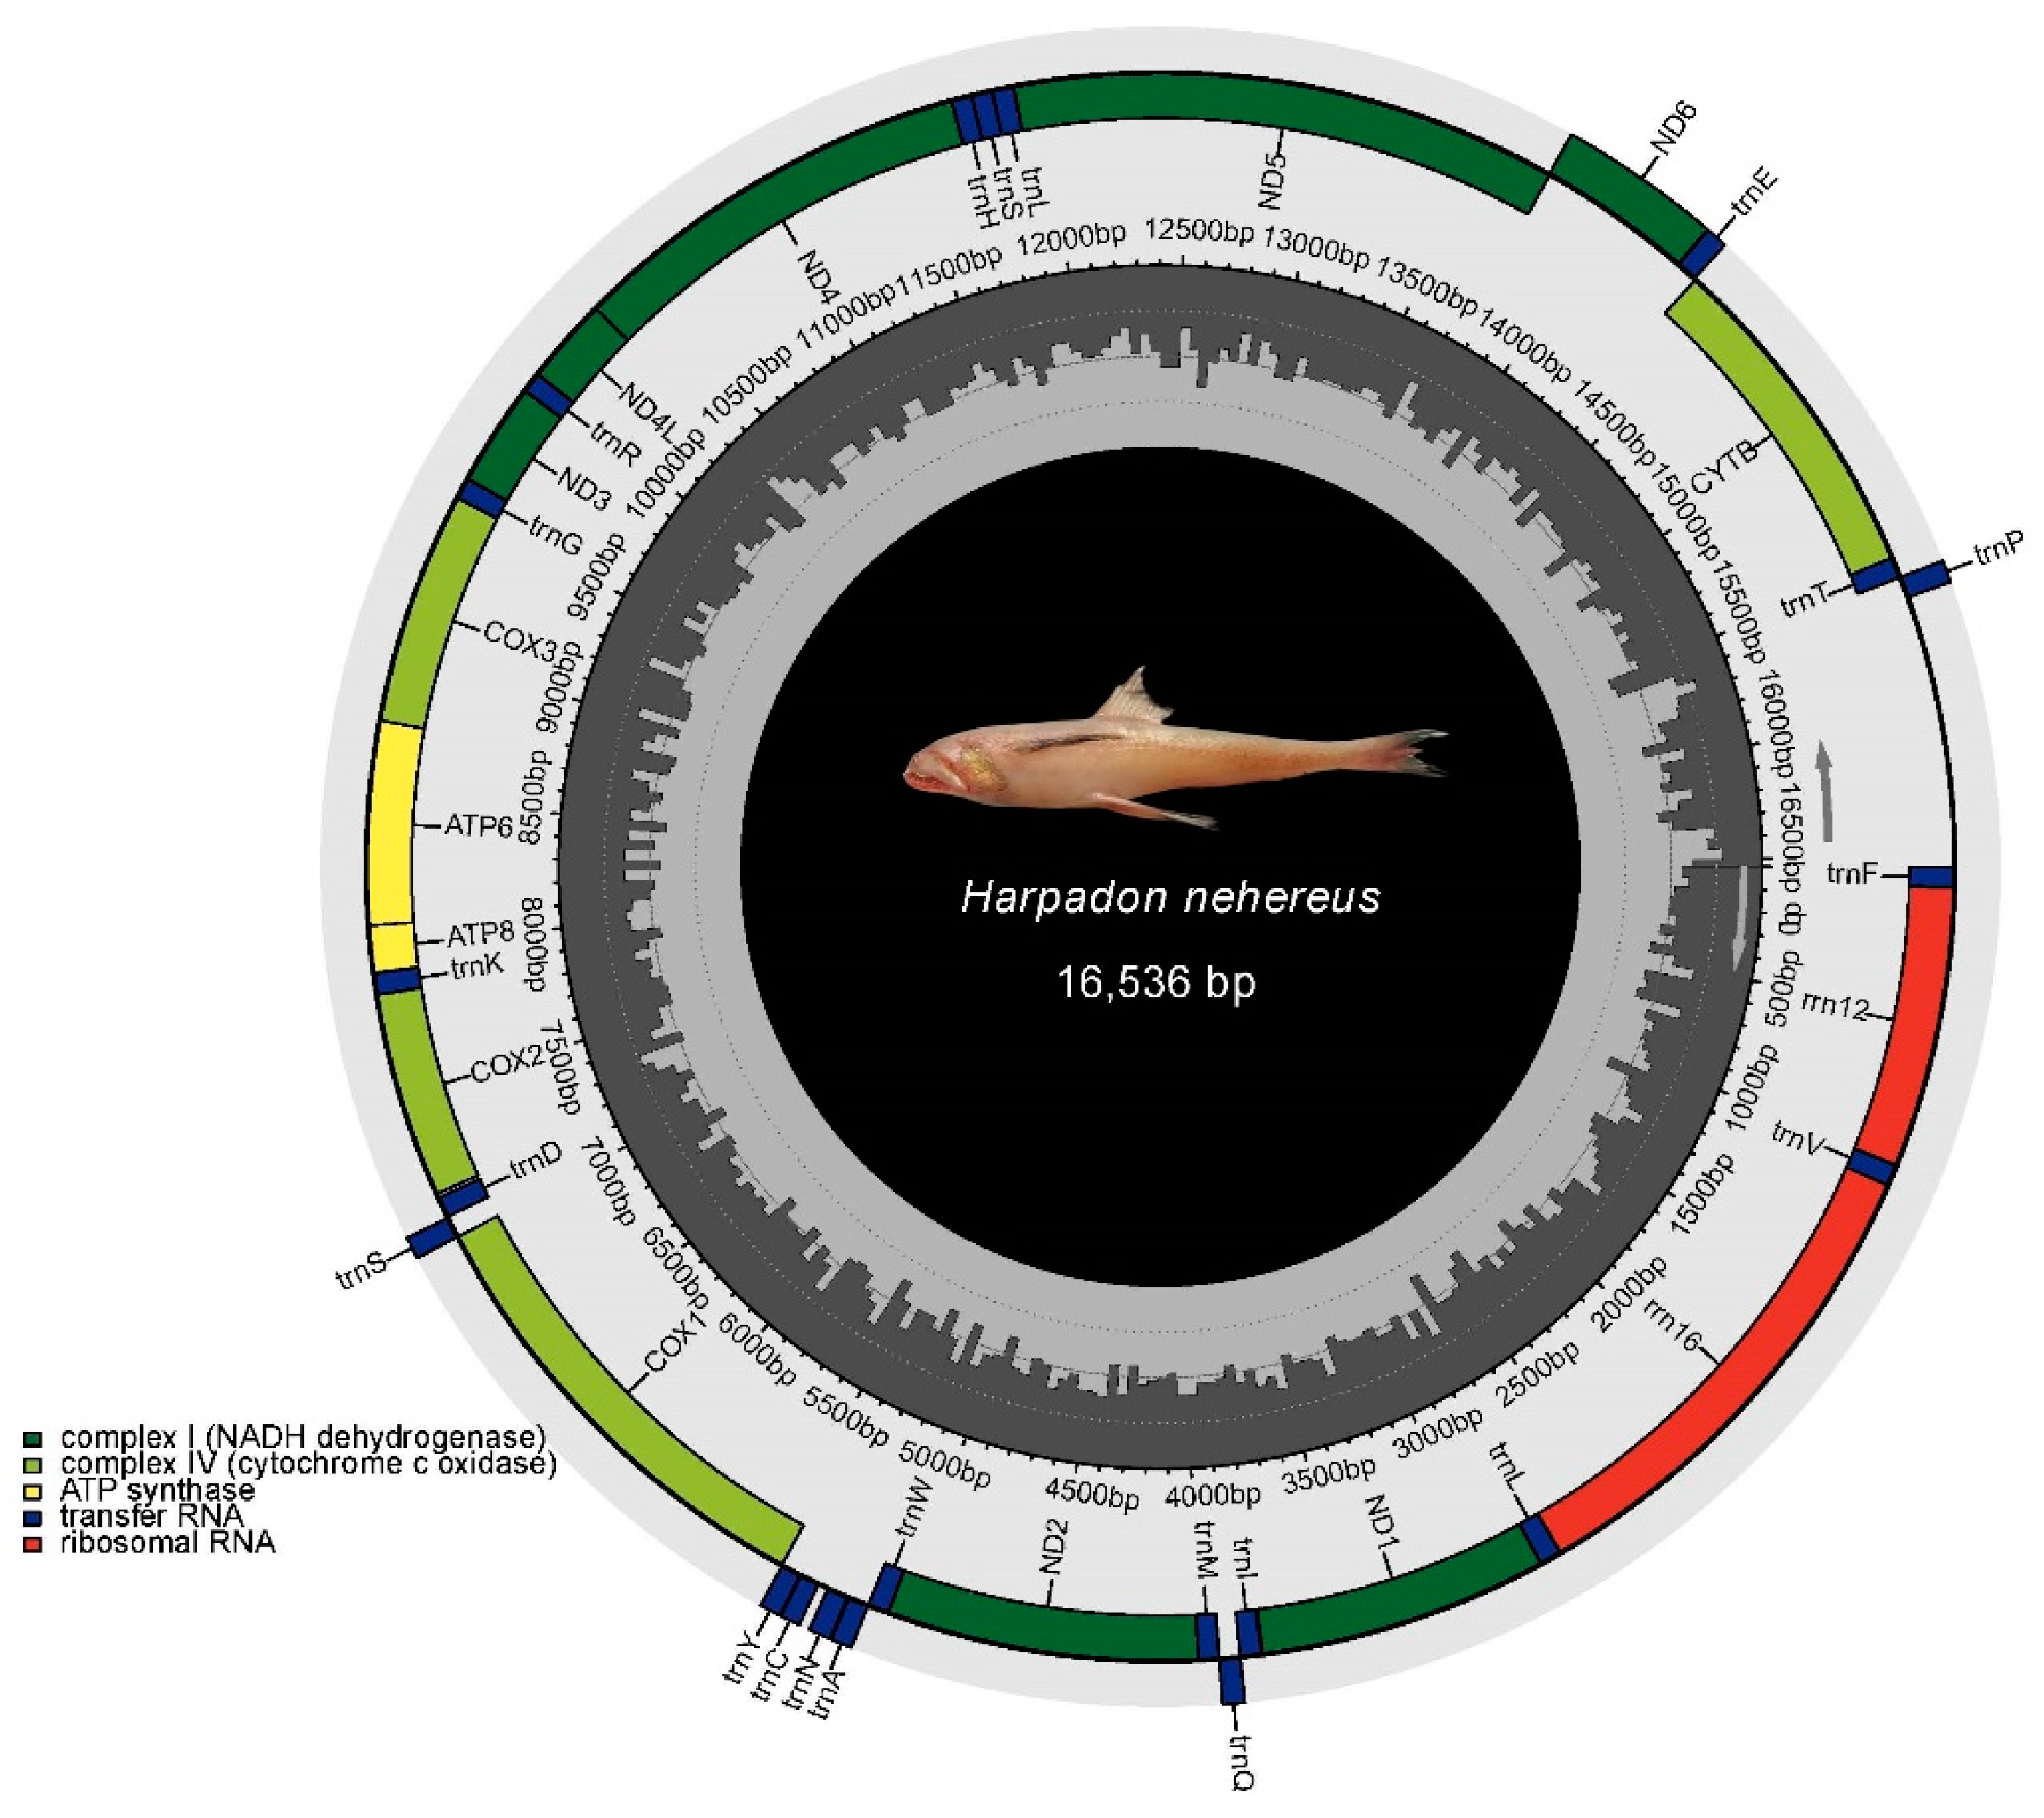
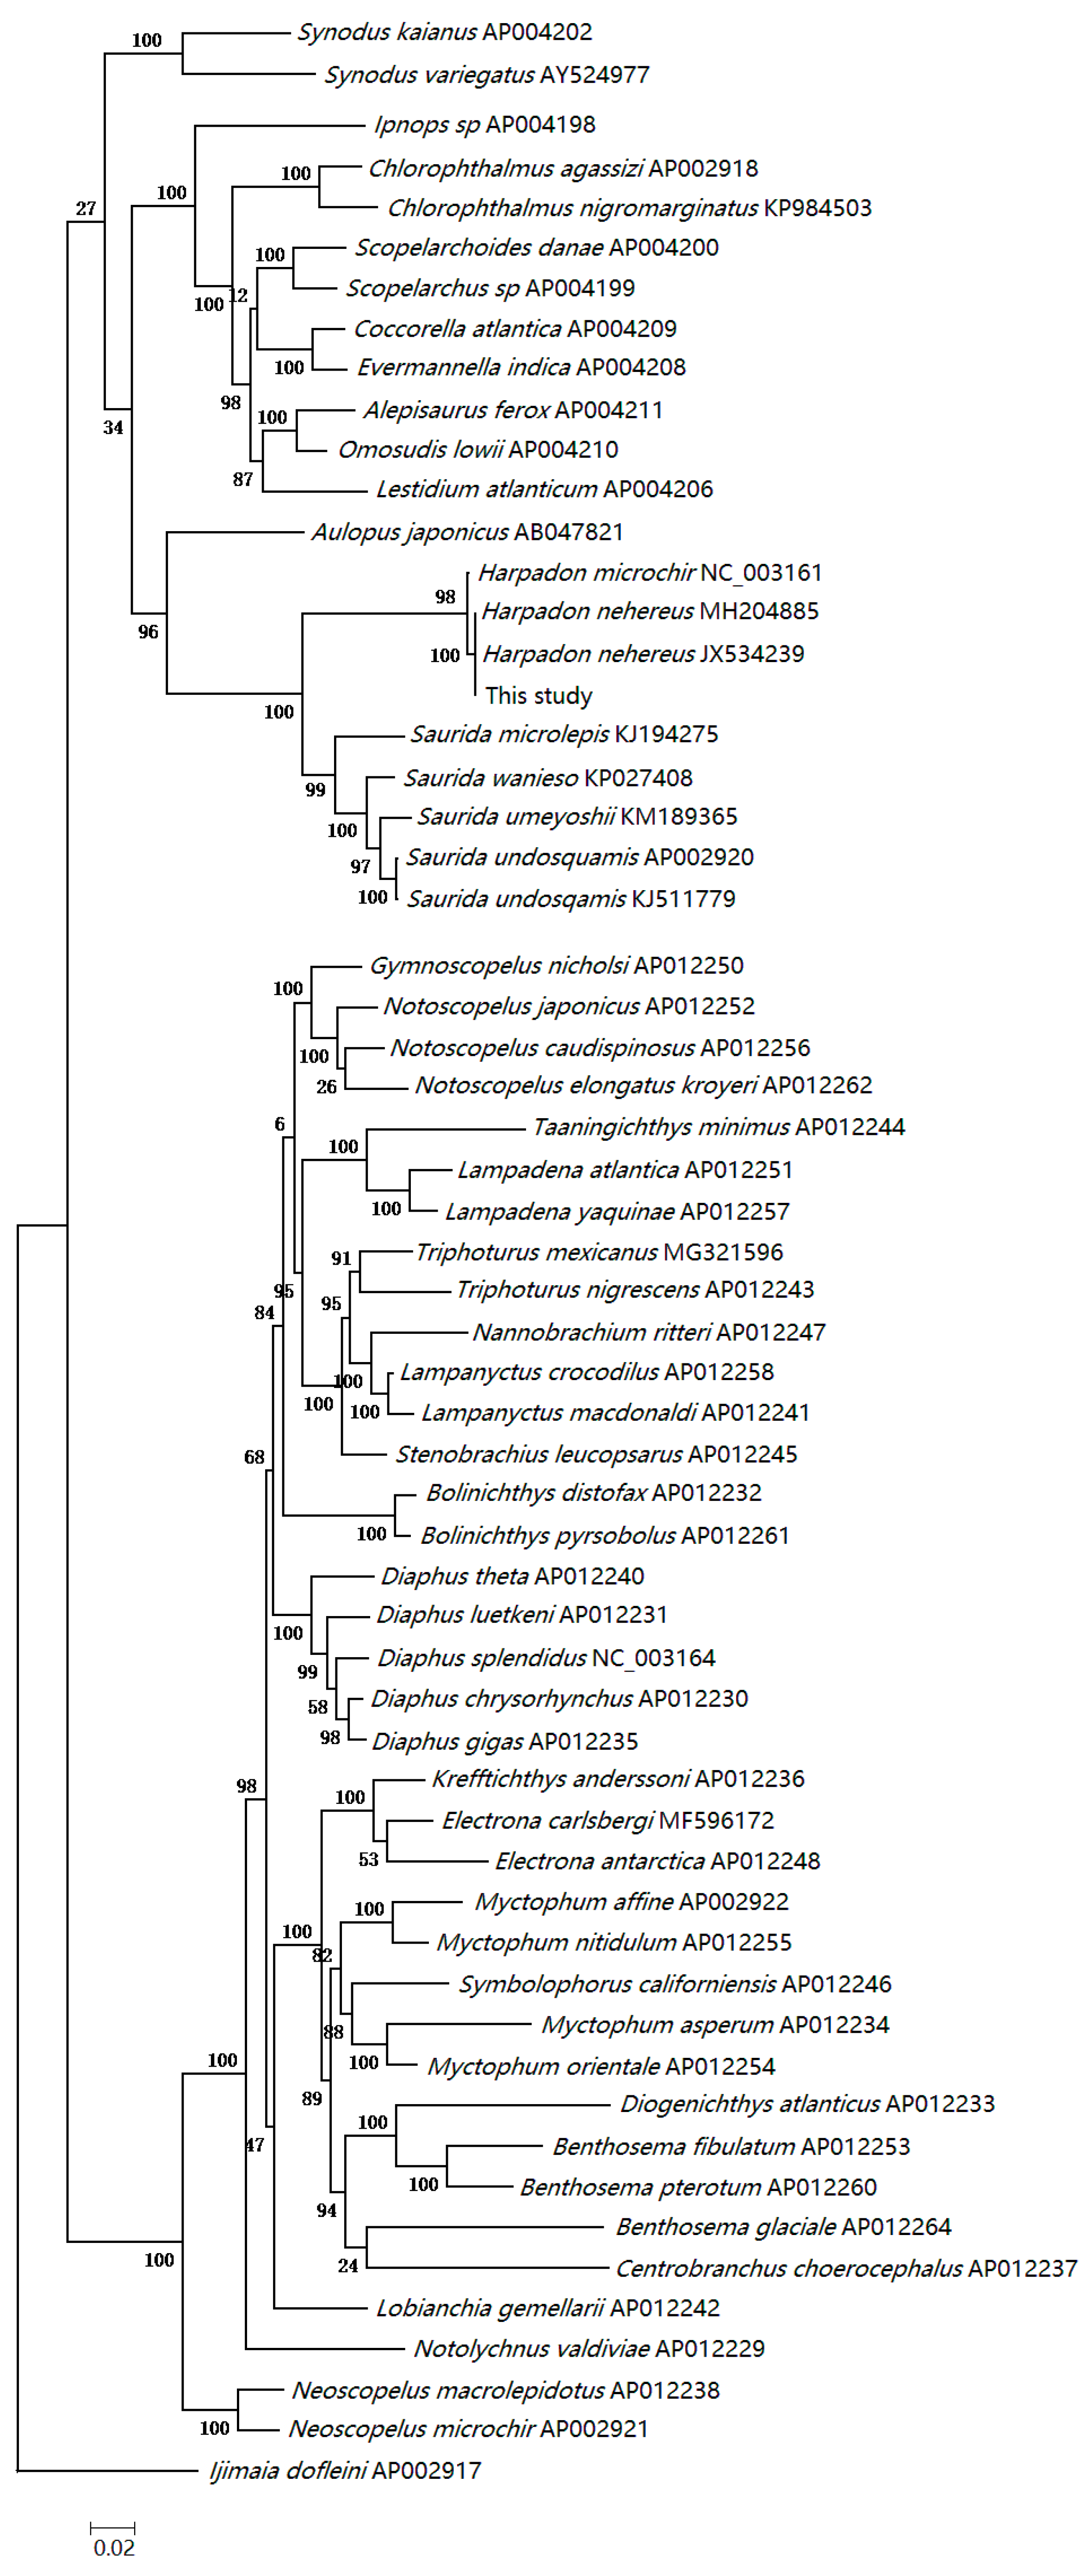
3.4. Mitochondrial DNA Assembly and Phylogenetic Relationships of H. nehereus

The total length of the complete mitogenome of H. nehereus was 16,536 bp. Just like other published bony fishes’ mtDNA genomes [30], the closed circular molecule included the 13 PCGs, two ribosomal RNA genes, 22 transfer RNA genes and a control region (Figure 3). Most mitochondrial genes were encoded on the H-strand, excluding ND6 and eight tRNAs (Gln, Ala, Asn, Cys, Tyr, Ser-UCN, Glu and Pro) that were located on the L-strand. The nucleotide percentages were as follows: A = 26.75%, T = 26.74%, G = 16.73% and C = 29.78%. The proportion of A + T (53.49%) was higher than that of G + C (46.51%), indicating an AT bias. The phylogenetic tree was constructed using the ML method based on combined amino acids translated from the 13 PCGs (Figure 4). The topological structure showed that all individuals were divided into two clades. Species of the families Myctophidae and Neoscopelidae formed one clade, and the rest were clustered into the other one. H. nehereus and H. microchir were the closest relatives, and they clustered with the genus Saurida. Members of the suborder Alepisauroidei gathered together and had close relationships with Chlorophthalmus agassizi, C. nigromarginatus and Ipnops sp.

4. Discussion

The rapid development of high-throughput sequencing technology not only greatly reduces the sequencing cost, but also significantly shortens the sequencing cycle and promotes the research process of whole genome sequencing (WGS) and genetic mapping [31,32]. Since the first fish genome (known as “torafugu” Fugu rubripes) was published in 2002 [33], WGS has been explosively applied into more and more fish species, ranging from the model fish medaka [34] and zebrafish [35] to many commercially important fishes. Particularly in recent years, the implementation of “The China Aquatic 10-100-1000 Genomics Program” and the “Fish 10K Project” have brought the sequencing of fish genome into a new stage [36,37]. Genomic approaches have shown their great powers in conservation and utilization of fishery resources, exploration of species evolution, molecular breeding, research and development of marine drugs and disease control [38,39]. In this study, we reported the genome survey of an important economic lizardfish, Bombay duck, using the WGS method for the first time. In addition, the microsatellite and mtDNA markers were also identified and characterized for genetic diversity and population structure studies in the future.
According to the K-mer analysis, the genome size of H. nehereus was estimated to be 1315 Mb, which was smaller than the predicted genome size based on the DNA content [40]. This possibly resulted from the non-specific fluorescent dye binding to non-genomic nucleotides. Until now, the published teleost genome size has ranged from 322.5 Mb (Fugu rubripes) [33] to 40 Gb (Protopterus annectens) [41]. Most of the commercial marine species have a genome size of less than 1 Gb, such as Larimichthys crocea [42], Paralichthys olivaceus [43], Lateolabrax maculatus [44] and Thamnaconus septentrionalis [45]. Additionally, compared with Benthosema glaciale (accession number: PRJEB12469), the only reported genome of lanternfishes, it was almost twice as much as that of this species (approximately 676 Mb). It was inferred that the genome size of H. nehereus was relatively large, as a result of the higher repetitive sequence ratio (52.49%). Sequence bias would occur in Illumina sequencing libraries if the GC content was out of the range of 25–65%, and thus seriously affect genome assembly [46]. The GC content of the H. nehereus genome was 41.78%, which was within the acceptable range for genome assembly.
Heterozygosity is another important factor affecting genome assembly and subsequent analysis. As both sister chromatids would be separately assembled in high-heterozygosity regions, it might cause the imprecise assessment of genome size. The heterozygosity ratio of H. nehereus observed in the present study was 0.67%, which was higher than that of Scatophagus argus (female 0.37% and male 0.38%) [47], Sebastiscus marmoratus (0.17%) [48] and Acanthogobius ommaturus (0.17%) [49], but smaller than that of Sillago sihama (0.92%) [50]. Genome assembly becomes more difficult when the heterozygosity ratio is higher than 0.5% [25]. Therefore, the higher heterozygosity ratio might impact the accuracy of genome size estimation.
As a powerful and popular tool to unravel the higher-level relationships of teleosts, complete mtDNA has been more and more widely applied in the studies of evolutionary biology and phylogenetics [30,51]. The genome-wide data include both nuclear DNA information and mitochondrial DNA sequences, hence we excavated the complete mitogenome of H. nehereus to further decipher its taxonomic status and systematic evolution. Rosen discovered the distinctive features of the second and third pharyngobranchials in Aulopiformes fishes, and separated them from Myctophiformes for the first time [52]. Subsequently, Nelson agreed with Rosen’s taxonomy in the reprinted “Fishes of the World (2nd Edition)” on the basis of morphological structures of gill rakers, and he regarded the Myctophiformes (Myctophidae + Neoscopelidae) and Aulopiformes (Auiopoidei + Alepisauroidei) as two different orders [53]. In our study, the cladogram constructed using a concatenated set of amino acid sequences from the 13 PCGs supported the above-mentioned taxonomical criteria, and revealed a monophyly of Myctophiformes that was corroborated by morphological characteristics and molecular evidence [54,55,56,57]. The evolutionary tree also showed that H. nehereus and H. microchir belong to the family Synodontidae located in the same clade of Aulopiformes and had the closest relationships with each other. The genus Harpadon was inferred as a sister group to Saurida with a strong bootstrap value, which was consistent with the results of a previous study using 16S rRNA and COI genes [19,58].

5. Conclusions

This was the first report of the genome survey analysis of a commercially important marine lizardfish (Bombay duck) based on the Illumina platform. The genome size of H. nehereus was 1315 Mb, with 2,539,084 scaffolds and an N50 length of 1568 bp. The candidate SSR and mitochondrial markers developed from H. nehereus genome data could provide novel insight into population genetics and germplasm resource conservation in the future. Considering that the higher level of repetitive DNA and heterozygosity might make it more challenging to generate highly accurate de novo genome assembly, the strategy of Illumina combined with PacBio and Hi-C techniques should be applied to obtain a higher-quality genome of H. nehereus, and more efforts are still to be made in the further research on the genome of this species.

Author Contributions

Conceptualization, T.G. and T.Y.; investigation, Z.N.; writing—original draft preparation, T.Y.; writing—review and editing, X.H. All authors have read and agreed to the published version of the manuscript.

Funding

This research was funded by the National Science Foundation of China (No. 41776171) and Scientific Research Projects of the Zhejiang Department of Education (No. Y201942611).

Institutional Review Board Statement

The study was conducted according to the guidelines of the Declaration of Helsinki, and approved by the Ethics Committee of Zhejiang Ocean University (protocol code ZJOU-ECAE20210128 and date of approval 6 January 2021).

Informed Consent Statement

Not applicable.

Data Availability Statement

All data presented during this study are included in this article.

Conflicts of Interest

The authors declare no conflict of interest.

References

  1. Nelson, J.S.; Grande, T.C.; Wilson, M.V.H. Fishes of the World, 5th ed.; John & Wiley & Sons: Hoboken, NJ, USA, 2016. [Google Scholar]
  2. Chakraborty, P.; Sahoo, S.; Bhattacharyya, D.K.; Ghosh, M. Marine lizardfish (Harpadon nehereus) meal concentrate in preparation of ready-to-eat protein and calcium rich extruded snacks. J. Food Sci. Technol. 2020, 57, 338–349. [Google Scholar] [CrossRef]
  3. Luo, H.Z. Study of Main Biology Character and Analysis of Resource Status on the Harpodon nehereus. Master’s Thesis, Zhejiang Ocean University, Zhoushan, China, 2012. (In Chinese). [Google Scholar]
  4. Kalhoro, M.A.; Liu, Q.; Memon, K.H.; Chang, M.S.; Jatt, A.N. Estimation of maximum sustainable yield of Bombay Duck, Harpodon nehereus fishery in Pakistan using the CEDA and ASPIC packages. Pakistan J. Zool. 2013, 45, 1757–1764. [Google Scholar]
  5. Jaiswar, A.K.; Chakraborty, S.K. A review on fishery, biology and stock parameters of Bombay duck Harpodon nehereus (Hamilton, 1822) occurring in India. J. Indian Fish. Assoc. 2016, 43, 67–96. [Google Scholar]
  6. Sarker, M.; Humayun, M.; Rahman, M.A.; Uddin, M.S. Population dynamics of Bombay duck Harpodon nehereus (Hamilton, 1822) of the Bay of Bengal along Bangladesh coast. Bangl. J. Zool. 2018, 45, 101–110. [Google Scholar] [CrossRef] [Green Version]
  7. Chen, L.; Shui, B.N.; Dong, W.X. Growth characteristics and resources sustainable utilization of Harpodon nehereus. Technol. Manag. 2012, 3, 68–70. (In Chinese) [Google Scholar]
  8. Sudheesan, D.; Roshith, C.M.; Manna, R.K.; Das, S.K.; Koushlesh, S.K.; Chanu, T.N.; Bhakta, D. Implication towards growth overfishing of Harpadon nehereus in bag net fishing. In Proceedings of the 29th All India Congress of Zoology, ICAR-CIFRI, Kolkata, India, 9–11 June 2017. [Google Scholar]
  9. Utter, F.M. Biochemical genetics and fishery management: An historical perspective. J. Fish Biol. 2010, 39, 1–20. [Google Scholar] [CrossRef]
  10. Kurian, A.; Kurup, K.N. Stock assessment of Bombay duck Harpodon nehereus (Ham.) off Maharashtra coast. Indian J. Fish. 1992, 39, 243–248. [Google Scholar]
  11. Rupsankar, C. Improvement of cooking quality and gel formation capacity of Bombay duck (Harpodon nehereus) fish meat. J. Food Sci. Technol. 2010, 47, 534–540. [Google Scholar] [CrossRef] [Green Version]
  12. Firdaus, M.; Lelono, T.D.; Saleh, R.; Bintoro, G.; Salim, G. The expression of the body shape in fish species Harpadon nehereus (Hamilton, 1822) in the waters of Juata Laut, Tarakan city, North Kalimantan. AACL Bioflux 2018, 11, 613–624. [Google Scholar]
  13. Taqwa, A.; Burhanuddin, A.I.; Niartiningsih, A.; Nessa, M.N. Nomei fish (Harpadon nehereus, Ham. 1822) reproduction biology in Tarakan waters. In IOP Conference Series: Earth and Environmental Science; IOP Publishing: Bristol, UK, 2020; Volume 473, pp. 1–6. [Google Scholar]
  14. Xu, T.J.; Sun, D.Q.; Li, H.Y.; Wang, R.X. Development and characterization of microsatellite markers for the lizardfish known as the Bombay duck, Harpadon nehereus (Synodontidae). Genet. Mol. Res. 2011, 10, 1701–1706. [Google Scholar] [CrossRef] [PubMed]
  15. Zhu, Z.H.; Li, H.Y.; Qin, Y.; Wang, R.X. Genetic diversity and population structure in Harpadon nehereus based on sequence-related amplified polymorphism markers. Genet. Mol. Res. 2014, 13, 5974–5981. [Google Scholar] [CrossRef]
  16. Guo, Y.J.; Yang, T.Y.; Meng, W.; Hang, Z.Q.; Gao, T.X. The genetic structure of the Bombay duck (Harpadon nehereus) based on mitochondrial Cyt b gene. Acta Hydrobiol. Sin. 2019, 43, 945–952. (In Chinese) [Google Scholar]
  17. Saha, S.; Ferdous, Z.; Jahan, H.; Khandaker, A.M.; Shahjahan, M.R.; Begum, R.A. Polymorphic loci analysis of 16S ribosomal RNA gene of economically important marine lizardfish Bombay duck (Harpadon nehereus). Bangl. J. Zool. 2019, 47, 49–57. [Google Scholar] [CrossRef]
  18. Zhang, H.; Xian, W.W. The complete mitochondrial genome of the larval Bombay duck Harpodon nehereus (Aulopiformes, Synodontidae) from Yangtze estuary and the phylogenetic relationship of Synodontidae species. Mitochondrial DNA B 2018, 3, 657–658. [Google Scholar] [CrossRef] [PubMed] [Green Version]
  19. Yang, T.Y.; Jiang, Y.L.; Guo, Y.J.; Zhu, L.Q.; Lin, Y.J.; Zheng, Y.J.; Gao, T.X. Molecular phylogeny of Harpadon nehereus and its close relatives based on mitochondrial Cyt b gene. Trans. Oceanol. Limn. 2020, 6, 77–85. (In Chinese) [Google Scholar]
  20. Zhang, H.; Audira, G.; Li, Y.; Xian, W.W.; Varikkodan, M.M.; Hsiao, C.D. Comparative study the expression of calcium cycling genes in Bombay duck (Harpadon nehereus) and beltfish (Trichiurus lepturus) with different swimming activities. Genom. Data 2017, 12, 58–61. [Google Scholar] [CrossRef] [PubMed]
  21. Chen, H.Y.; Chen, Y.Y.; Rong, L.I.; Xiao, H.; Chen, S.Y. Research advances in whole-genome sequencing of representative fish species. J. Biol. 2017, 34, 73–77. (In Chinese) [Google Scholar]
  22. Sambrook, J.; Fritsch, E.F.; Maniatis, T. Molecular Cloning: A Laboratory Manual; Cold Spring Harbor Laboratory Press: New York, NY, USA, 1982. [Google Scholar]
  23. Chen, Y.X.; Chen, Y.S.; Shi, C.M.; Huang, Z.B.; Zhang, Y.; Li, S.K.; Li, Y.; Ye, J.; Yu, C.; Li, Z.; et al. SOAPnuke: A MapReduce acceleration-supported software for integrated quality control and preprocessing of high-throughput sequencing data. Oxford Open 2018, 7, 1–6. [Google Scholar] [CrossRef] [PubMed] [Green Version]
  24. Luo, R.B.; Liu, B.H.; Xie, Y.L.; Li, Z.Y.; Huang, W.H.; Yuan, J.Y.; He, G.Z.; Chen, Y.X.; Pan, Q.; Liu, Y.J.; et al. SOAPdenovo2: An empirically improved memory-efficient short-read de novo assembler. GigaScience 2012, 1, 1–6. [Google Scholar] [CrossRef] [PubMed]
  25. Marcais, G.; Kingsford, C. A fast, lock-free approach for efficient parallel counting of occurrences of k-mers. Bioinformatics 2011, 27, 764–770. [Google Scholar] [CrossRef] [PubMed] [Green Version]
  26. Li, R.Q.; Zhu, H.M.; Ruan, J.; Qian, W.B.; Fang, X.D.; Shi, Z.B.; Li, Y.R.; Li, S.T.; Shan, G.; Kristiansen, K.; et al. De novo assembly of human genomes with massively parallel short read sequencing. Genome Res. 2010, 20, 265–272. [Google Scholar] [CrossRef] [Green Version]
  27. Kajitani, R.; Toshimoto, K.; Noguchi, H.; Toyoda, A.; Ogura, Y.; Okuno, M.; Yabana, M.; Harada, M.; Nagayasu, E.; Nagayasu, H.; et al. Efficient de novo assembly of highly heterozygous genomes from whole-genome shotgun short reads. Genome Res. 2014, 24, 1384–1395. [Google Scholar] [CrossRef] [Green Version]
  28. Thiel, T.; Michalek, W.; Varshney, R.K.; Graner, A. Exploiting EST databases for the development and characterization of gene-derived SSR-markers in barley (Hordeum vulgare L.). Theor. Appl. Genet. 2003, 106, 411–422. [Google Scholar] [CrossRef]
  29. Tamura, K.; Stecher, G.; Kumar, S. MEGA11: Molecular evolutionary genetics analysis version 11. Mol. Biol. Evol. 2021, 38, 3022–3027. [Google Scholar] [CrossRef]
  30. Miya, M.; Kawaguchi, A.; Nishida, M. Mitogenomic exploration of higher teleostean phylogenies: A case study for moderate-scale evolutionary genomics with 38 newly determined complete mitochondrial DNA sequences. Mol. Biol. Evol. 2001, 18, 1993–2009. [Google Scholar] [CrossRef] [PubMed] [Green Version]
  31. Zhu, Q.L.; Liu, S.; Gao, P.; Luan, F.S. High-throughput sequencing technology and its application. J. Northeast Agric. Univ. (Engl. Ed.) 2014, 21, 84–96. [Google Scholar]
  32. Reuter, J.; Spacek, D.V.; Snyder, M. High-throughput sequencing technologies. Mol. Cell 2015, 58, 586–597. [Google Scholar] [CrossRef] [PubMed] [Green Version]
  33. Aparicio, S.; Chapman, J.; Stupka, E.; Putnam, N.; Chia, J.M.; Dehal, P.; Christoffels, A.; Rash, S.; Hoon, A.; Smit, A.; et al. Whole-genome shotgun assembly and analysis of the genome of Fugu rubripes. Science 2002, 297, 1301–1310. [Google Scholar] [CrossRef] [Green Version]
  34. Kasahara, M.; Naruse, K.; Sasaki, S.; Nakatani, Y.; Qu, W.; Ahsan, B.; Yamada, T.; Nagayasu, Y.; Doi, K.; Kasai, Y.; et al. The medaka draft genome and insights into vertebrate genome evolution. Nature 2007, 44, 714–719. [Google Scholar] [CrossRef] [PubMed] [Green Version]
  35. Howe, K.; Clark, M.D.; Torroja, C.F.; Torrance, J.; Berthelot, C.; Muffato, M.; Collins, J.E.; Humphray, S.; McLaren, K.; Matthews, L.; et al. The zebrafish reference genome sequence and its relationship to the human genome. Nature 2013, 496, 498–503. [Google Scholar] [CrossRef] [Green Version]
  36. Liu, Y.J.; Xu, P.; Xu, J.M.; Huang, Y.; Liu, Y.X.; Fang, H.; Hu, Y.C.; You, X.X.; Bian, C.; Sun, M.; et al. China is initiating the aquatic 10-100-1000 genomics program. Sci. China Life Sci. 2017, 60, 329–332. [Google Scholar] [CrossRef]
  37. Fan, G.Y.; Song, Y.; Yang, D.L.; Huang, X.Y.; Zhang, S.Y.; Zhang, M.Q.; Yang, X.W.; Chang, Y.; Zhang, H.; Li, Y.X.; et al. Initial data release and announcement of the 10,000 Fish Genomes Project (Fish10K). GigaScience 2020, 9, 1–8. [Google Scholar] [CrossRef]
  38. Wardle, F.; Mueller, F. Fish genomics: Casting the net wide. Brief. Funct. Genomics 2014, 13, 79–81. [Google Scholar] [CrossRef] [Green Version]
  39. Chen, S.L.; Xu, W.T.; Liu, Y. Fish genomic research: Decade review and prospect. J. Fish. China 2019, 43, 1–14. (In Chinese) [Google Scholar]
  40. Dolezel, J.; Bartos, J.; Voglmayr, H.; Greilhuber, J. Nuclean DNA content and genome size of trout and human. Cytom. Part A 2003, 51, 127–128. [Google Scholar]
  41. Wang, K.; Wang, J.; Zhu, C.L.; Yang, L.D.; Ren, Y.D.; Ruan, J.; Fan, G.Y.; Hu, J.; Xu, W.J.; Bi, X.P.; et al. African lungfish genome sheds light on the vertebrate water-to-land transition. Cell 2021, 184, 1362–1376. [Google Scholar] [CrossRef]
  42. Wu, C.W.; Zhang, D.; Kan, M.Y.; Lv, Z.M.; Zhu, A.Y.; Su, Y.Q.; Zhou, D.Z.; Zhang, J.S.; Zhang, Z.; Xu, M.Y.; et al. The draft genome of the large yellow croaker reveals well-developed innate immunity. Nat. Commun. 2014, 5, 5227. [Google Scholar] [CrossRef] [PubMed] [Green Version]
  43. Shao, C.W.; Bao, B.L.; Xie, Z.Y.; Chen, X.Y.; Li, B.; Jia, X.D.; Yao, Q.L.; Ortí, G.; Li, W.H.; Li, X.H.; et al. The genome and transcriptome of Japanese flounder provide insights into flatfish asymmetry. Nat. Genet. 2017, 49, 119–124. [Google Scholar] [CrossRef] [PubMed]
  44. Shao, C.W.; Li, C.; Wang, N.; Qin, Y.T.; Xu, W.T.; Liu, Q.; Zhou, Q.; Zhao, Y.; Li, X.H.; Liu, S.S.; et al. Chromosome-level genome assembly of the spotted sea bass, Lateolabrax maculatus. GigaScience 2018, 7, 1–7. [Google Scholar] [CrossRef] [PubMed]
  45. Bian, L.; Li, F.H.; Ge, J.L.; Wang, P.F.; Chang, Q.; Zhang, S.N.; Li, J.; Liu, C.L.; Liu, K.; Liu, X.T.; et al. Chromosome-level genome assembly of the greenfin horse-faced filefish (Thamnaconus septentrionalis) using Oxford Nanopore PromethION sequencing and Hi-C technology. Mol. Ecol. Resour. 2020, 20, 1069–1079. [Google Scholar] [CrossRef] [PubMed]
  46. Aird, D.; Ross, M.G.; Chen, W.S.; Danielsson, M.; Fennell, T.; Russ, C.; Jaffe, D.B.; Nusbaum, C.; Gnirke, A. Analyzing and minimizing PCR amplification bias in Illumina sequencing libraries. Genome Biol. 2011, 12, R18. [Google Scholar] [CrossRef] [PubMed] [Green Version]
  47. Huang, Y.Q.; Jiang, D.N.; Li, M.; Mustapha, U.F.; Tian, C.X.; Chen, H.P.; Huang, Y.; Deng, S.P.; Wu, T.L.; Zhu, C.H.; et al. Genome survey of male and female spotted scat (Scatophagus argus). Animals 2019, 9, 1117. [Google Scholar] [CrossRef] [PubMed] [Green Version]
  48. Xu, S.Y.; Song, N.; Xiao, S.J.; Gao, T.X. Whole genome survey analysis and microsatellite motif identification of Sebastiscus marmoratus. Biosci. Rep. 2020, 40, 1–7. [Google Scholar] [CrossRef] [Green Version]
  49. Chen, B.J.; Sun, Z.C.; Lou, F.R.; Gao, T.X.; Song, N. Genomic characteristics and profile of microsatellite primers for Acanthogobius ommaturus by genome survey sequencing. Biosci. Rep. 2020, 40, 1–8. [Google Scholar] [CrossRef]
  50. Li, Z.Y.; Tian, C.X.; Huang, Y.; Lin, X.H.; Wang, Y.R.; Jiang, D.N.; Zhu, C.H.; Chen, H.P.; Li, G.L. A first insight into a draft genome of silver sillago (Sillago sihama) via genome survey sequencing. Animals 2019, 9, 756. [Google Scholar] [CrossRef] [PubMed] [Green Version]
  51. Miya, M.; Takeshima, H.; Endo, H.; Ishiguro, N.B.; Inoue, J.G.; Mukai, T.; Satoh, T.P.; Yamaguchi, M.; Kawaguchi, A.; Mabuchi, K.; et al. Major patterns of higher teleostean phylogenies: A new perspective based on 100 complete mitochondrial DNA sequences. Mol. Phylogenet. Evol. 2003, 26, 121–138. [Google Scholar] [CrossRef]
  52. Rosen, D.E. Interrelationships of higher euteleostean fishes. Zool. J. Linn. Soc. 1973, 53, 397–513. [Google Scholar]
  53. Nelson, J.S. Fishes of the World, 2nd ed.; John & Wiley & Sons: Hoboken, NJ, USA, 1984. [Google Scholar]
  54. Stiassny, M.L.J. Basal ctenosquamate relationships and the interrelationships of the Myctophiform (Scopelomorph) fishes. In Interrelationships of Fishes; Stiassny, M.L.J., Parenti, L.R., Johnson, G.D., Eds.; Academic Press: Cambridge, UK, 1996; pp. 405–426. [Google Scholar]
  55. Poulsen, J.Y.; Byrkjedal, I.; Willassen, E.; Rees, D.; Takeshima, H.; Satoh, T.P.; Shinohara, G.; Nishida, M.; Miya, M. Mitogenomic sequences and evidence from unique gene rearrangements corroborate evolutionary relationships of Myctophiformes (Neoteleostei). BMC Evol. Biol. 2013, 13, 1–21. [Google Scholar] [CrossRef] [Green Version]
  56. Denton, J.S.S. Seven-locus molecular phylogeny of Myctophiformes (Teleostei; Scopelomorpha) highlights the utility of the order for studies of deep-sea evolution. Mol. Phylogenet. Evol. 2014, 76, 270–292. [Google Scholar] [CrossRef] [PubMed]
  57. Martin, R.P.; Davis, M.P. The evolution of specialized dentition in the deep-sea lanternfishes (Myctophiformes). J. Morphol. 2020, 281, 536–555. [Google Scholar] [CrossRef] [PubMed]
  58. Nugroho, E.D.; Nawir, D.; Amin, M.; Lestari, U. DNA barcoding of nomei fish (Synodontidae: Harpadon sp.) in Tarakan Island, Indonesia. AACL Bioflux 2017, 10, 1466–1474. [Google Scholar]
Figure 1. The base distribution and K-mer (K = 17) analysis of H. nehereus. (a) On the x-axis, the read-1 base contents are on the left side of the dotted line and the read-2 base contents are on the right. Different colors represent different base types. The y-axis represents the sequencing depth. (b) The x-axis means K-mer depth and the y-axis represents the frequency for the corresponding depth.
Cimb 43 00091 g001
Figure 2. The distribution and frequency of microsatellite motifs in H. nehereus. (af) present frequency of the mono-, di-, tri-, tetra-, penta- and hexanucleotide microsatellite motifs.
Cimb 43 00091 g002aCimb 43 00091 g002b
Figure 3. The complete mitogenome structure of H. nehereus.
Cimb 43 00091 g003
Figure 4. The phylogenetic tree inferred from mitochondrial genomes of related species.
Cimb 43 00091 g004
Table 1. Assembly statistics for stitched contigs and scaffolds of H. nehereus.
Sample Total Length (bp)Total
Number
Total Number (≥2 kb)Max Length (bp)N50 (bp)N90 (bp)
H. nehereuscontigs1,352,668,1473,766,07873,28130,284596138
scaffolds1,363,443,5452,539,084133,08992,1181568162
Table 2. The statistics of SSRs in the H. nehereus genome based on repeat types.
SSR TypeNumberPercent (%)Sequence NumberTotal SSR Length (bp)
p1266,76125.96208,2193,369,363
p2558,54354.35400,98517,745,246
p366,2706.4562,0461,638,864
p4105,42610.2697,0163,527,488
p525,1822.4523,958883,000
p654690.535374191,406
Total1,027,651100797,59827,355,367
Publisher’s Note: MDPI stays neutral with regard to jurisdictional claims in published maps and institutional affiliations.

