
Homozygosity Haplotype and Whole-Exome Sequencing Analysis to Identify Potentially Functional Rare Variants Involved in Multiple Sclerosis among Sardinian Families

 ,
,  , ,
, , 
Abstract
:1. Introduction
2. Results
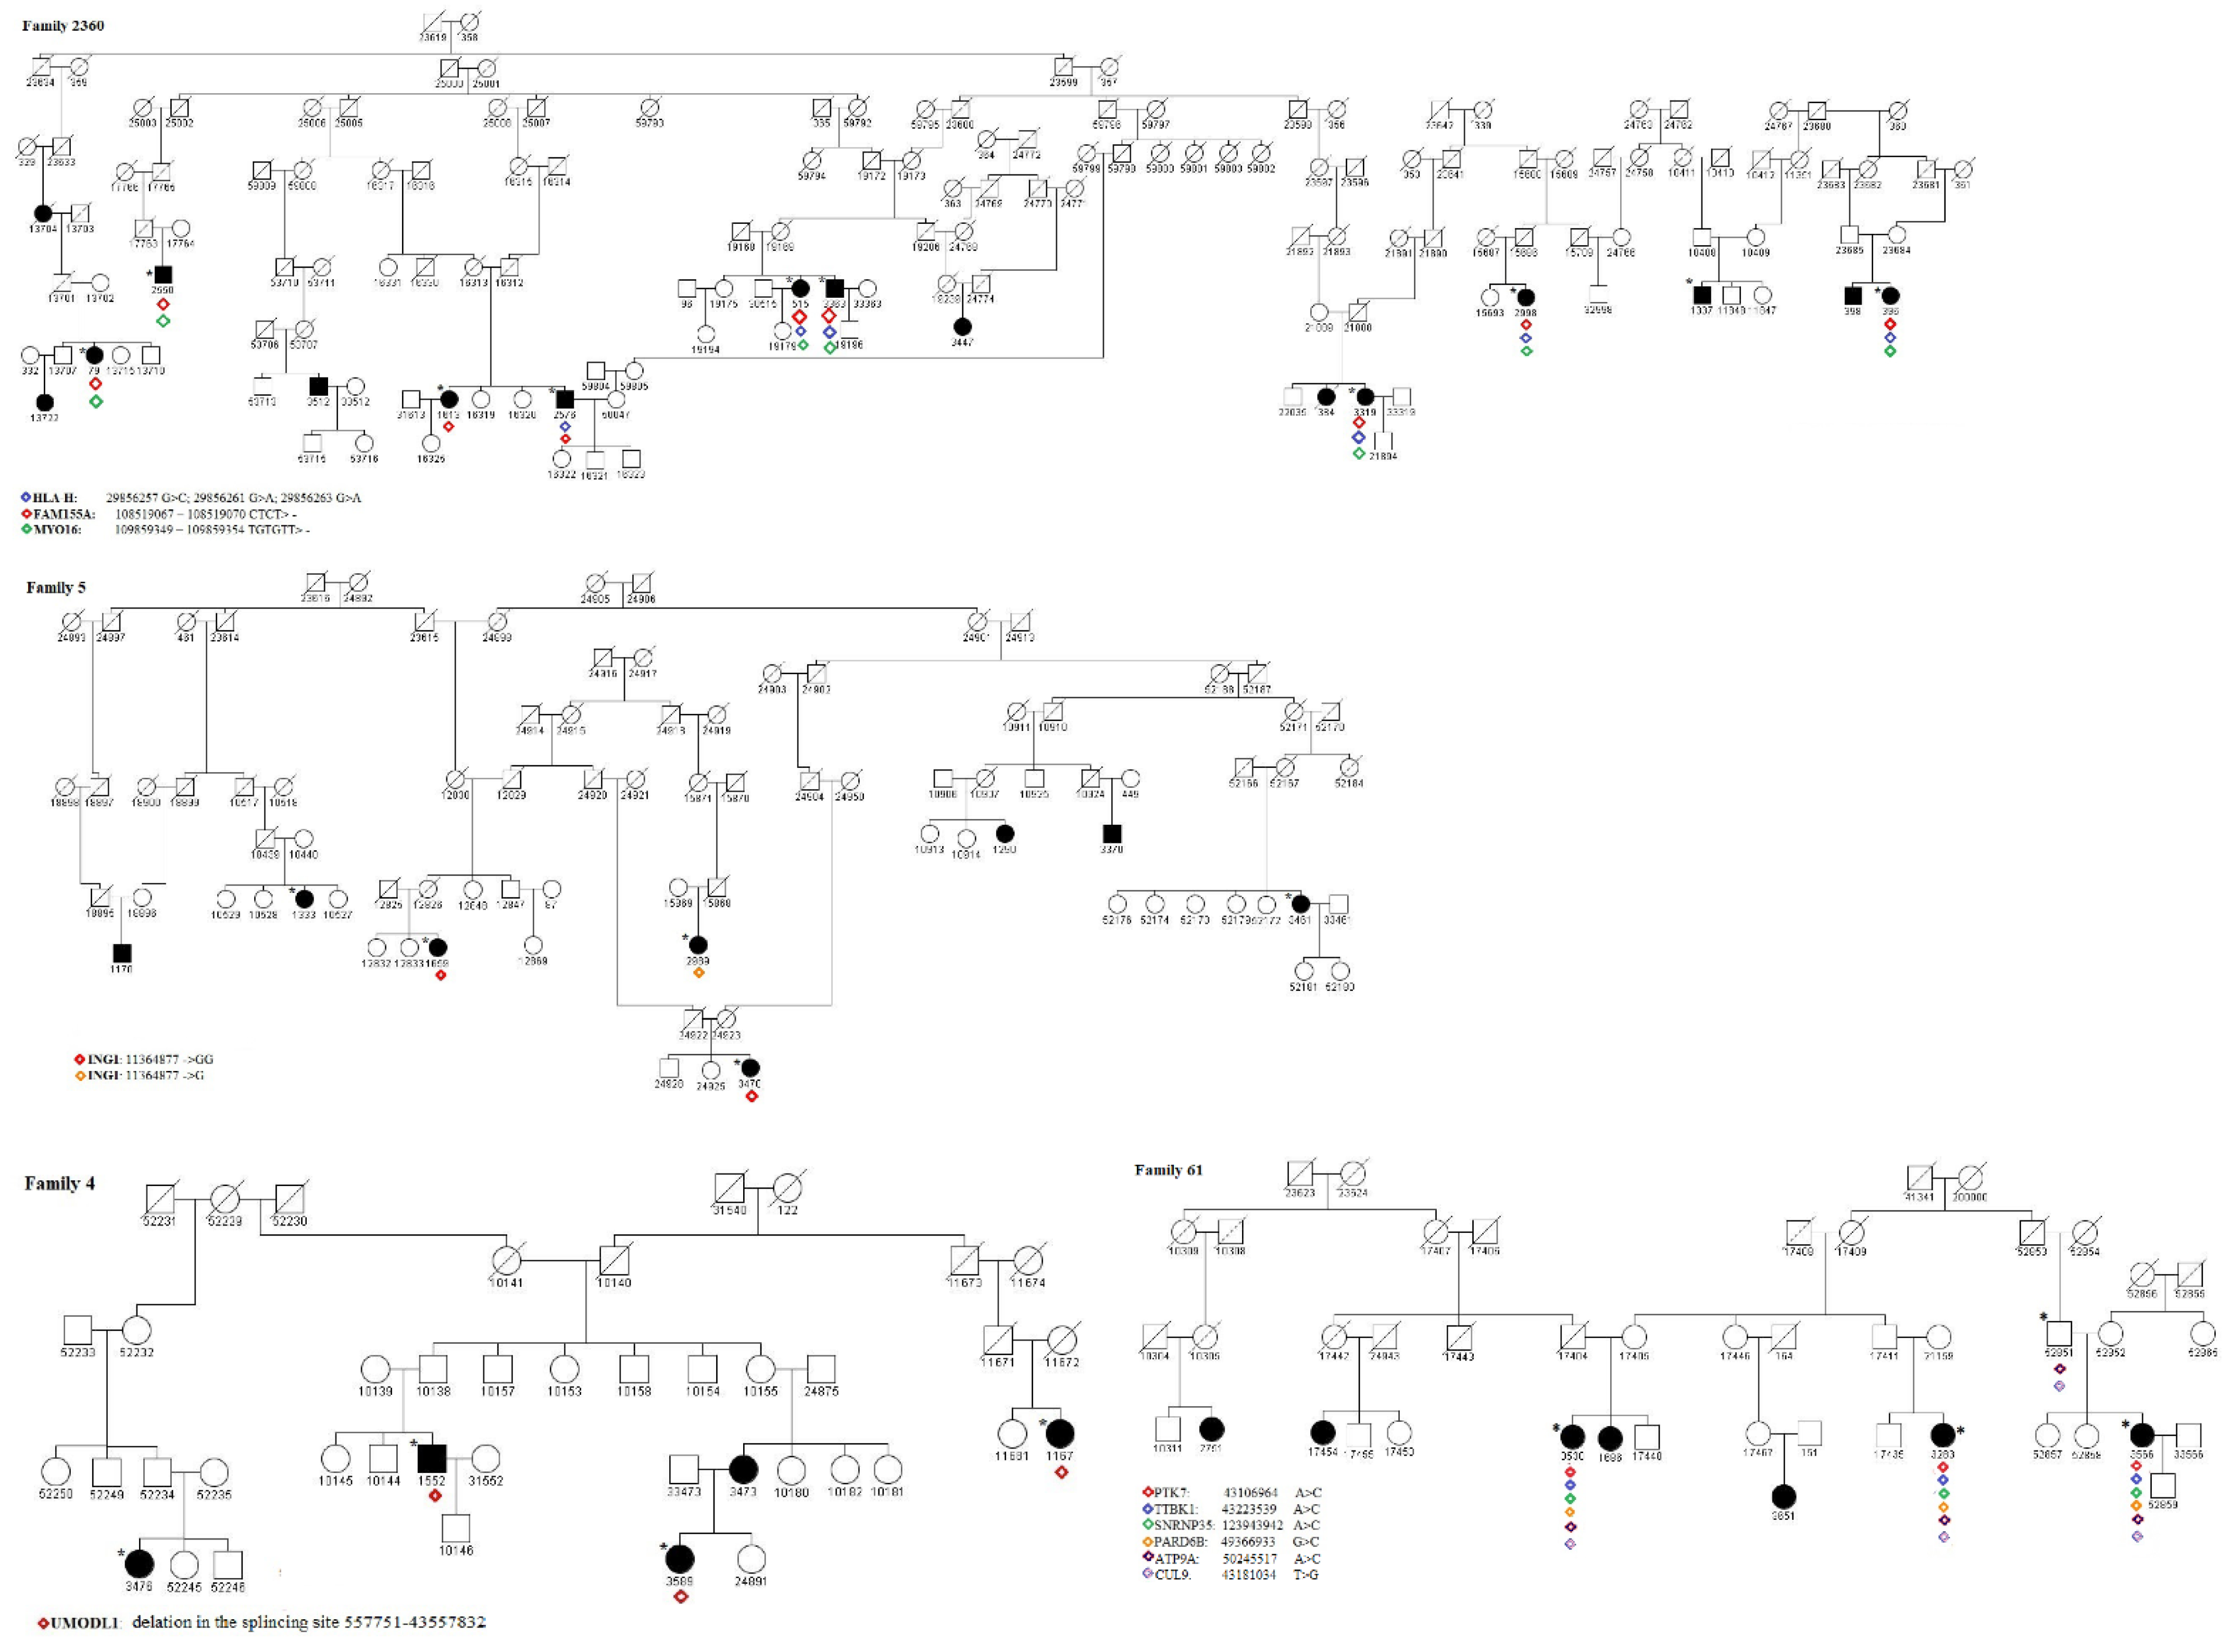
2.1. Sample Description
2.2. Identification of RCHHs
2.3. Identification of Pathogenic Variants
3. Discussion
- (i)
- The RCHH region on chr6:42767957-43333769, shared in 5 cases and 7 controls of family 61, where we identified the variant 43181034 T > G in the splicing region on exon 27 of the CUL9 gene. CUL9 is highly expressed in the brain, particularly in the cerebral cortex [28]. A study [29] using a human cell-derived model to characterize CUL9 in human neuronal development showed that the deletion or depletion of the protein causes the aberrant formation of neural rosettes that are related to the early stage of neurodevelopment. Furthermore, the neuronal transcription factors CUX1 and SOX3 were significantly upregulated in CUL9 knockout neuroepithelial progenitor cells. Fisher et al. [30] analyzed the potential molecular pathways of tissue injury in active cortical MS lesions, and by identifying prominent changes in gene expression, they found genes that are involved in different steps of apoptosis, DNA damage, p53 function, and DNA repair, including CUL9. In the same RCHH region, 43106964 A > C, a non-synonymous variant on exon 9, and rs780764712, in PTK7, a gene involved in the Wnt/planar cell polarity pathway, were also found. It is important to note that the PTK7 mutant with a truncated protein perinatally caused severe defects in neural tube closure [31]. In this stidy, 43223539 A > C, a non-synonymous variant on exon 9 in the TTBK1 gene, and 42976917 A > C, a non-synonymous variant on exon 9 in the PPP2R5D gene, were also found in all the available cases. TTBK1 is a brain-specific tau kinase expressed in the entorhinal cortex and hippocampal regions. TTBK1 transgenic mice showed severe axonal degeneration in the perforant path, which is essential for many forms of memory [32]. TTBK1 is highly expressed in the entorhinal cortex and the perforant path region, two specific brain regions involved in the early stage of Alzheimer’s disease pathology [33], and thus, has a critical role in axonal degeneration. Collapsin response mediator protein-2 (CRMP2) is a downstream target of TTBK1 [32], whose expression induces the accumulation of phosphorylated CRMP2, and it was shown to be involved in the axonal degeneration pathology in MS [34]. PPP2R5D is a regulatory B subunit of Protein Phosphatase 2A (PP2A) and plays a crucial role in normal neuronal development and functioning. Variants of this gene were found to be associated with intellectual disability, autism, and other neurodevelopmental disorders [35]. Mutations in this gene were found in juvenile-onset parkinsonism [36].
- (ii)
- The RCHH region on chr13:108090996-108968251, shared in 11 cases and 17 controls of family 6, where we identified the variant 109859349-109859354 TGTGTT> in 3′UTR of the MYO16 gene. This variant is also present in 1 case of family 4, in 2 cases of family 45, and in 1 case of family 5. MYO16 is mainly expressed in the central nervous system and seems to be involved in the development and functioning of the nervous system also in adulthood; therefore, alterations in this gene, e.g., SNPs, deletions, or epigenetic modifications, are associated with neurodegenerative and neuropsychiatric disorders [37,38,39]. MYO16 is thus considered as an important regulator of neural cells’ functioning even if its specific role and molecular mechanisms remain to be elucidated. Interestingly, not far from MYO16, in the chr13:108090996-108968251 region highlighted by HH analysis, is located the TNFSF13B gene, encoding the cytokine and drug target B-cell activation factor (BAFF) whose overexpression is related to autoimmunity [40]. In particular, in [41], a TNFSF13B variant was found to be associated with MS and systemic lupus erythematosus (SLE) through a mechanism that led to an overexpression of BAFF, which, in turn, upregulated the humoral immunity.
- (iii)
- The RCHH region on chr20:49044993-50323395, shared in 5 cases and 7 controls of family 61, where we identified the variant 50245517 A > C in the splicing region on exon 16 of the ATP9A gene. ATP9A is a regulator of endosomal recycling and plays an inhibitory role in the release of extracellular vesicles (EV) [42], and many biological processes, such as the immune response, are modulated by proteins, DNA, miRNA, and mRNAs that could be controlled via EV-instigated intercellular communication [43].
4. Materials and Methods
4.1. Sample Collection and Genotyping
4.2. HH Analysis
4.3. Screening of Known Causative Genes
4.4. Whole-Exome Sequencing Data Generation
5. Conclusions
Supplementary Materials
Author Contributions
Funding
Institutional Review Board Statement
Informed Consent Statement
Data Availability Statement
Acknowledgments
Conflicts of Interest
References
- Kahana, E. Epidemiologic studies of multiple sclerosis: A review. Biomed. Pharmacother. 2000, 54, 100–102. [Google Scholar] [CrossRef]
- Compston, A.; Coles, A. Multiple sclerosis. Lancet 2008, 372, 1502–1517. [Google Scholar] [CrossRef]
- Pugliatti, M.; Sotgiu, S.; Rosati, G. The worldwide prevalence of multiple sclerosis. Clin. Neurol. Neurosurg 2002, 104, 182–191. [Google Scholar] [CrossRef]
- Bargagli, A.M.; Colais, P.; Agabiti, N.; Mayer, F.; Buttari, F.; Centonze, D.; Di Folco, M.; Filippini, G.; Francia, A.; Galgani, S.; et al. Prevalence of multiple sclerosis in the Lazio region, Italy: Use of an algorithm based on health information systems. J. Neurol. 2016, 263, 751–759. [Google Scholar] [CrossRef] [PubMed]
- Urru, S.A.M.; Antonelli, A.; Sechi, G.M. Prevalence of multiple sclerosis in Sardinia: A systematic cross-sectional multi-source survey. Mult. Scler. J. 2020, 26, 372–380. [Google Scholar] [CrossRef]
- Hemminki, K.; Li, X.; Sundquist, J.; Hillert, J.; Sundquist, K. Risk for multiple sclerosis in relatives and spouses of patients diagnosed with autoimmune and related conditions. Neurogenetics 2009, 10, 5–11. [Google Scholar] [CrossRef]
- Montomoli, C.; Prokopenko, I.; Caria, A.; Ferrai, R.; Mander, A.; Seaman, S.; Musu, L.; Piras, M.L.; Ticca, A.F.; Murgia, S.B.; et al. Multiple sclerosis recurrence risk for siblings in an isolated population of Central Sardinia, Italy. Genet. Epidemiol. 2002, 22, 265–271. [Google Scholar] [CrossRef] [PubMed]
- Bahlo, M.; Booth, D.R.; Simon, A.B.; Brown, M.A.; Foote, S.J.; Griffiths, L.R.; Kilpatrick, T.J.; Lechner-Scott, J.; Moscato, P.; Perreau, V.M.; et al. Genome-wide association study identifies new multiple sclerosis susceptibility loci on chromosomes 12 and 20. Nat. Genet. 2009, 41, 824–828. [Google Scholar] [CrossRef]
- Baranzini, S.E.; Galwey, N.W.; Wang, J.; Khankhanian, P.; Lindberg, R.; Pelletier, D.; Wu, W.; Uitdehaag, B.M.J.; Kappos, L.; Polman, C.H.; et al. Pathway and network-based analysis of genome-wide association studies in multiple sclerosis. Hum. Mol. Genet. 2009, 18, 2078–2090. [Google Scholar] [CrossRef] [PubMed] [Green Version]
- Consortium, I.M.S.G.; Beecham, A.H.; Patsopoulos, N.A.; Xifara, D.K.; Davis, M.F.; Kemppinen, A.; Cotsapas, C.; Shah, T.S.; Spencer, C.; Booth, D.; et al. Analysis of immune-related loci identifies 48 new susceptibility variants for multiple sclerosis. Nat. Genet 2013, 45, 1353–1360. [Google Scholar]
- Consortium, I.M.S.G.; Consortium, W.T.C.C.; Sawce, S.; Hellenthal, G.; Pirinen, M.; Spencer, C.C.; Patsopoulos, N.A.; Moutsianas, L.; Dilthey, A.; Su, Z.; et al. Genetic risk and a primary role for cell-mediated immune mechanisms in multiple sclerosis. Nature 2011, 476, 214–219. [Google Scholar]
- Consortium, I.M.S.G. Multiple sclerosis genomic map implicates peripheral immune cells and microglia in susceptibility. Science 2019, 365, eaav7188. [Google Scholar] [CrossRef] [Green Version]
- Fazia, T.; Pastorino, R.; Foco, L.; Han, L.; Abney, M.; Beecham, A.; Hadjixenofontos, A.; Guo, H.; Gentilini, D.; Papachristou, C.; et al. Investigating multiple sclerosis genetic susceptibility on the founder population of east-central Sardinia via association and linkage analysis of immune-related loci. Mult. Scler. J. 2017. [Google Scholar] [CrossRef]
- Sawcer, S.; Franklin, R.J.M.; Ban, M. Multiple sclerosis genetics. Lancet Neurol. 2014, 13, 700–709. [Google Scholar] [CrossRef]
- Mitrovič, M.; Patsopoulos, N.A.; Beecham, A.H.; Dankowski, T.; Goris, A.; Dubois, B.; D’hooghe, M.B.; Lemmens, R.; Van Damme, P.; Søndergaard, H.B.; et al. Low-Frequency and Rare-Coding Variation Contributes to Multiple Sclerosis Risk. Cell 2018, 180, 403. [Google Scholar] [CrossRef] [Green Version]
- Manolio, T.A.; Collins, F.S.; Cox, N.J.; Goldstein, D.B.; Hindorff, L.A.; Hunter, D.J.; McCarthy, M.I.; Ramos, E.M.; Cardon, L.R.; Chakravarti, A.; et al. Finding the missing heritability of complex diseases. Nature 2009, 461, 747–753. [Google Scholar] [CrossRef] [Green Version]
- Zhuo, X.; Guo, X.; Zhang, X.; Jing, G.; Wang, Y.; Chen, Q.; Jiang, Q.; Liu, J.; Zhang, C. Usp16 regulates kinetochore localization of Plk1 to promote proper chromosome alignment in mitosis. J. Cell Biol. 2015, 210, 727–735. [Google Scholar] [CrossRef]
- Zhang, Y.; Liu, R.B.; Cao, Q.; Fan, K.Q.; Huang, L.J.; Yu, J.S.; Gao, Z.J.; Huang, T.; Zhong, J.Y.; Mao, X.T.; et al. USP16-mediated deubiquitination of calcineurin A controls peripheral T cell maintenance. J. Clin. Investig. 2019, 129, 2856–2871. [Google Scholar] [CrossRef] [Green Version]
- Sidore, C.; Busonero, F.; Maschio, A.; Porcu, E.; Naitza, S.; Zoledziewska, M.; Mulas, A.; Pistis, G.; Steri, M.; Danjou, F.; et al. Genome sequencing elucidates Sardinian genetic architecture and augments association analyses for lipid and blood inflammatory markers. Nat. Genet. 2015, 47, 1272–1281. [Google Scholar] [CrossRef] [PubMed] [Green Version]
- Chiang, C.W.K.; Marcus, J.H.; Sidore, C.; Biddanda, A.; Al-Asadi, H.; Zoledziewska, M.; Pitzalis, M.; Busonero, F.; Maschio, A.; Pistis, G.; et al. Genomic history of the Sardinian population. Nat. Genet. 2018, 50, 1426–1434. [Google Scholar] [CrossRef]
- Peterson, J.W.; Bö, L.; Mörk, S.; Chang, A.; Trapp, B.D. Transected neurites, apoptotic neurons, and reduced inflammation in cortical multiple sclerosis lesions. Ann. Neurol. 2001, 50, 389–400. [Google Scholar] [CrossRef]
- Kutzelnigg, A.; Lucchinetti, C.F.; Stadelmann, C.; Brück, W.; Rauschka, H.; Bergmann, M.; Schmidbauer, M.; Parisi, J.E.; Lassmann, H. Cortical demyelination and diffuse white matter injury in multiple sclerosis. Brain 2005, 128, 2705–2712. [Google Scholar] [CrossRef]
- Kutzelnigg, A.; Faber-Rod, J.C.; Bauer, J.; Lucchinetti, C.F.; Sorensen, P.S.; Laursen, H.; Stadelmann, C.; Brück, W.; Rauschka, H.; Schmidbauer, M.; et al. Widespread demyelination in the cerebellar cortex in multiple sclerosis. Brain Pathol. 2007, 17, 38–44. [Google Scholar] [CrossRef]
- Geurts, J.J.G.; Bö, L.; Roosendaal, S.D.; Hazes, T.; Daniëls, R.; Barkhof, F.; Witter, M.P.; Huitinga, I.; Van Der Valk, P. Extensive hippocampal demyelination in multiple sclerosis. J. Neuropathol. Exp. Neurol. 2007, 66, 819–827. [Google Scholar] [CrossRef] [Green Version]
- Tam, V.; Patel, N.; Turcotte, M.; Bossé, Y.; Paré, G.; Meyre, D. Benefits and limitations of genome-wide association studies. Nat. Rev. Genet. 2019, 20, 467–484. [Google Scholar] [CrossRef]
- Cotsapas, C.; Mitrovic, M. Genome-wide association studies of multiple sclerosis. Clin. Transl. Immunol. 2018, 7, e1018. [Google Scholar] [CrossRef] [PubMed]
- Eichler, E.E.; Flint, J.; Gibson, G.; Kong, A.; Leal, S.M.; Moore, J.H.; Nadeau, J.H. Missing heritability and strategies for finding the underlying causes of complex disease How should we solve the problem of “missing heritability” in complex diseases? Nat. Rev. Genet. 2010, 11, 446–450. [Google Scholar] [CrossRef] [PubMed] [Green Version]
- van de Leemput, J.; Boles, N.C.; Kiehl, T.R.; Corneo, B.; Lederman, P.; Menon, V.; Lee, C.; Martinez, R.A.; Levi, B.P.; Thompson, C.L.; et al. CORTECON: A temporal transcriptome analysis of in vitro human cerebral cortex development from human embryonic stem cells. Neuron 2014, 83, 51–68. [Google Scholar] [CrossRef] [PubMed] [Green Version]
- Ortolano, N.A.; Romero-Morales, A.I.; Rasmussen, M.L.; Bodnya, C.; Kline, L.A.; Joshi, P.; Connelly, J.P.; Rose, K.L.; Pruett-Miller, S.M.; Gama, V. A proteomics approach for the identification of cullin-9 (CUL9) related signaling pathways in induced pluripotent stem cell models. PLoS ONE 2021, 16, e0248000. [Google Scholar] [CrossRef] [PubMed]
- Fischer, M.T.; Wimmer, I.; Höftberger, R.; Gerlach, S.; Haider, L.; Zrzavy, T.; Hametner, S.; Mahad, D.; Binder, C.J.; Krumbholz, M.; et al. Disease-specific molecular events in cortical multiple sclerosis lesions. Brain 2013, 136, 1799–1815. [Google Scholar] [CrossRef]
- Lu, X.; Borchers, A.G.M.; Jolicoeur, C.; Rayburn, H.; Baker, J.C.; Tessier-Lavigne, M. PTK7/CCK-4 is a novel regulator of planar cell polarity in vertebrates. Nature 2004, 430, 93–98. [Google Scholar] [CrossRef]
- Ikezu, S.; Ingraham Dixie, K.L.; Koro, L.; Watanabe, T.; Kaibuchi, K.; Ikezu, T. Tau-tubulin kinase 1 and amyloid-β peptide induce phosphorylation of collapsin response mediator protein-2 and enhance neurite degeneration in Alzheimer disease mouse models. Acta Neuropathol. Commun. 2020, 8, 12. [Google Scholar] [CrossRef] [PubMed] [Green Version]
- Lund, H.; Cowburn, R.F.; Gustafsson, E.; Strömberg, K.; Svensson, A.; Dahllund, L.; Malinowsky, D.; Sunnemark, D. Tau-tubulin kinase 1 expression, phosphorylation and co-localization with phospho-ser422 tau in the Alzheimer’s disease brain. Brain Pathol. 2013, 23, 378–389. [Google Scholar] [CrossRef] [PubMed]
- Petratos, S.; Ozturk, E.; Azari, M.F.; Kenny, R.; Young Lee, J.; Magee, K.A.; Harvey, A.R.; McDonald, C.; Taghian, K.; Moussa, L.; et al. Limiting multiple sclerosis related axonopathy by blocking Nogo receptor and CRMP-2 phosphorylation. Brain 2012, 135, 1794–1818. [Google Scholar] [CrossRef] [PubMed]
- Shang, L.; Henderson, L.B.; Cho, M.T.; Petrey, D.S.; Fong, C.T.; Haude, K.M.; Shur, N.; Lundberg, J.; Hauser, N.; Carmichael, J.; et al. De novo missense variants in PPP2R5D are associated with intellectual disability, macrocephaly, hypotonia, and autism. Neurogenetics 2016, 17, 43–49. [Google Scholar] [CrossRef] [PubMed]
- Walker, I.M.; Riboldi, G.M.; Drummond, P.; Saade-Lemus, S.; Martin-Saavedra, J.S.; Frucht, S.; Bardakjian, T.M.; Gonzalez-Alegre, P.; Deik, A. PPP2R5D Genetic Mutations and Early-Onset Parkinsonism. Ann. Neurol. 2021, 89, 194–195. [Google Scholar] [CrossRef]
- Telek, E.; Kengyel, A.; Bugyi, B. Myosin XVI in the Nervous System. Cells 2020, 9, 1903. [Google Scholar] [CrossRef]
- Brown, M.E.; Bridgman, P.C. Myosin Function in Nervous and Sensory Systems. J. Neurobiol. 2004, 58, 118–130. [Google Scholar] [CrossRef] [PubMed]
- Gallo, G. The Neuronal Actin Cytoskeleton and the Protrusion of Lamellipodia and Filopodia. In Functions of Myosin Motor Proteins in the Nervous System; Springer: New York, NY, USA, 2011; pp. 45–72. [Google Scholar]
- Mackay, F.; Schneider, P.; Rennert, P.; Browning, J. BAFF and APRIL: A tutorial on B cell survival. Annu. Rev. Immunol. 2003, 21, 231–264. [Google Scholar] [CrossRef]
- Steri, M.; Orrù, V.; Idda, M.L.; Pitzalis, M.; Pala, M.; Zara, I.; Sidore, C.; Faà, V.; Floris, M.; Deiana, M.; et al. Overexpression of the Cytokine BAFF and Autoimmunity Risk. N. Engl. J. Med. 2017, 376, 1615–1626. [Google Scholar] [CrossRef] [PubMed]
- Naik, J.; Hau, C.M.; ten Bloemendaal, L.; Mok, K.S.; Hajji, N.; Wehman, A.M.; Meisner, S.; Muncan, V.; Paauw, N.J.; de Vries, H.E.; et al. The P4-ATPase ATP9A is a novel determinant of exosome release. PLoS ONE 2019, 14, e0213069. [Google Scholar] [CrossRef] [PubMed]
- Xu, X.; Xu, L.; Zhang, P.; Ouyang, K.; Xiao, Y.; Xiong, J.; Wang, D.; Liang, Y.; Duan, L. Effects of ATP9A on extracellular vesicle release and exosomal lipid composition. Oxid. Med. Cell. Longev. 2020. [Google Scholar] [CrossRef]
- Poser, C.M.; Paty, D.W.; Scheinberg, L.; McDonald, W.I.; Davis, F.A.; Ebers, G.C.; Johnson, K.P.; Sibley, W.A.; Silberberg, D.H.; Tourtellotte, W.W. New diagnostic criteria for multiple sclerosis: Guidelines for research protocols. Ann. Neurol 1983, 13, 227–231. [Google Scholar] [CrossRef]
- Miyazawa, H.; Kato, M.; Awata, T.; Kohda, M.; Iwasa, H.; Koyama, N.; Tanaka, T.; Huqun; Kyo, S.; Okazaki, Y.; et al. Homozygosity haplotype allows a genomewide search for the autosomal segments shared among patients. Am. J. Hum. Genet. 2007, 80, 1090–1102. [Google Scholar] [CrossRef] [PubMed] [Green Version]
- Jiang, H.; Orr, A.; Guernsey, D.L.; Robitaille, J.; Asselin, G.; Samuels, M.E.; Dubé, M.P. Application of homozygosity haplotype analysis to genetic mapping with high-density SNP genotype data. PLoS ONE 2009, 4, e5280. [Google Scholar] [CrossRef] [PubMed] [Green Version]
- Hagiwara, K.; Morino, H.; Shiihara, J.; Tanaka, T.; Miyazawa, H.; Suzuki, T.; Kohda, M.; Okazaki, Y.; Seyama, K.; Kawakami, H. Homozygosity mapping on homozygosity haplotype analysis to detect recessive disease-causing genes from a small number of unrelated, outbred patients. PLoS ONE 2011, 6, e25059. [Google Scholar] [CrossRef]
- Lander, E.S.; Botstein, D. Homozygosity mapping: A way to map human recessive traits with the DNA of inbred children. Science 1987, 236, 1567–1570. [Google Scholar] [CrossRef] [PubMed] [Green Version]
- R Development Core Team R: A Language and Environment for Statistical Computing; R Development Core Team R: Vienna, Austria, 2017.
- Li, H.; Durbin, R. Fast and accurate short read alignment with Burrows-Wheeler transform. Bioinformatics 2009, 25, 1754–1760. [Google Scholar] [CrossRef] [Green Version]


| Family | Total N. of Affected | N. of Affected with Genotyping Data | Total N. of Unaffected | N. of Unaffected with Genotyping Data |
|---|---|---|---|---|
| 3 | 6 | 5 | 84 | 29 |
| 4 | 5 | 5 | 37 | 23 |
| 5 | 8 | 5 | 79 | 22 |
| 9 | 9 | 8 | 64 | 22 |
| 12 | 3 | 3 | 19 | 3 |
| 21 | 5 | 5 | 53 | 19 |
| 26 | 6 | 3 | 43 | 13 |
| 44 | 3 | 3 | 14 | 9 |
| 45 | 6 | 4 | 36 | 15 |
| 58 | 3 | 2 | 27 | 14 |
| 61 | 7 | 6 | 40 | 17 |
| 81 | 3 | 3 | 23 | 8 |
| 2360 | 16 | 11 | 136 | 26 |
| Family | No. Subjects Sharing RCHH in Patient Pool | No. Subjects Sharing RCHH in Control Pool | Chr | Start–End (bp *) | Start–End (SNP) | -log10(p-Value) |
|---|---|---|---|---|---|---|
| 2360 | 6 out of 11 | 7 out of 26 | 1 | 20024018-20110347 | rs12405947-rs10492999 | 1.20 |
| 2360 | 8 out of 11 | 11 out of 26 | 3 | 127665610-128219449 | rs1687462-rs9826526 | 1.23 |
| 2360 | 5 out of 11 | 5 out of 26 | 6 | 26287459-32628250 | rs4458680-rs11757159 | 1.25 |
| 2360 | 7 out of 11 | 9 out of 26 | 11 | 16548170-17019030 | rs4593976-rs7942085 | 1.20 |
| 2360 | 11 out of 11 | 19 out of 26 | 13 | 106416156-106713791 | rs9555302-rs1819243 | 1.30 |
| 2360 | 11 out of 11 | 18 out of 26 | 13 | 106716741-106978764 | rs3949948-rs16970623 | 1.47 |
| 2360 | 11 out of 11 | 19 out of 26 | 13 | 106979630-106979630 | rs1830754-rs1830754 | 1.30 |
| 2360 | 11 out of 11 | 18 out of 26 | 13 | 106979661-108046934 | rs2076766-rs7992149 | 1.47 |
| 2360 | 11 out of 11 | 19 out of 26 | 13 | 108048315-108048315 | rs9583266-rs9583266 | 1.30 |
| 2360 | 11 out of 11 | 18 out of 26 | 13 | 108050353-108090301 | rs12586075-rs16972849 | 1.47 |
| 2360 | 11 out of 11 | 17 out of 26 | 13 | 108090996-108968251 | rs16972855-rs9521415 | 1.63 |
| 2360 | 7 out of 11 | 9 out of 26 | 22 | 43217334-43366873 | rs133807-rs138628 | 1.20 |
| 61 | 5 out of 6 | 7 out of 17 | 2 | 221458760-223560597 | rs634813-rs1440063 | 1.22 |
| 61 | 6 out of 6 | 10 out of 17 | 4 | 181036139-181598064 | rs7655585-rs2727426 | 1.23 |
| 61 | 6 out of 6 | 10 out of 17 | 5 | 31060610-31060610 | rs1392428-rs1392428 | 1.23 |
| 61 | 5 out of 6 | 7 out of 17 | 6 | 42767957-43333769 | rs394754-rs7752120 | 1.22 |
| 61 | 5 out of 6 | 7 out of 17 | 6 | 45282619-46437363 | rs7762957-rs1372567 | 1.22 |
| 61 | 4 out of 6 | 4 out of 17 | 6 | 62416537-67861137 | rs213824-rs9294736 | 1.38 |
| 61 | 4 out of 6 | 4 out of 17 | 6 | 100591693-100883678 | rs9399393-rs2658132 | 1.38 |
| 61 | 5 out of 6 | 7 out of 17 | 7 | 8552281-8768564 | rs1859275-rs10268580 | 1.22 |
| 61 | 6 out of 6 | 9 out of 17 | 9 | 8991207-8991239 | rs10511519-rs10816028 | 1.41 |
| 61 | 6 out of 6 | 8 out of 17 | 9 | 8991538-8994896 | rs10511520-rs10816029 | 1.61 |
| 61 | 6 out of 6 | 9 out of 17 | 9 | 9000336-9395003 | rs7025315-rs10759064 | 1.41 |
| 61 | 6 out of 6 | 10 out of 17 | 9 | 9395316-11328859 | rs1475680-rs17788370 | 1.23 |
| 61 | 6 out of 6 | 10 out of 17 | 9 | 12662320-13015284 | rs1408801-rs10514822 | 1.23 |
| 61 | 5 out of 6 | 7 out of 17 | 9 | 115676064-115712622 | rs6478042-rs7034929 | 1.22 |
| 61 | 6 out of 6 | 10 out of 17 | 9 | 134997809-134997809 | rs626713-rs626713 | 1.23 |
| 61 | 6 out of 6 | 10 out of 17 | 12 | 122479650-122743242 | rs1706477-rs7137946 | 1.23 |
| 61 | 6 out of 6 | 10 out of 17 | 12 | 127998742-128288581 | rs11060036-rs10847807 | 1.23 |
| 61 | 5 out of 6 | 7 out of 17 | 16 | 84533519-84542101 | rs305059-rs908988 | 1.22 |
| 61 | 5 out of 6 | 6 out of 17 | 20 | 48202462-49044808 | rs6020298-rs6122991 | 1.43 |
| 61 | 5 out of 6 | 7 out of 17 | 20 | 49044993-50323395 | rs11904901-rs6068117 | 1.22 |
| 61 | 5 out of 6 | 6 out of 17 | 20 | 50326580-50563902 | rs6021835-rs2024650 | 1.43 |
| 45 | 4 out of 4 | 7 out of 15 | 1 | 22014570-23032859 | rs2010397-rs4654821 | 1.22 |
| 45 | 3 out of 4 | 4 out of 15 | 7 | 54280160-56646646 | rs13438238-rs2634081 | 1.21 |
| 45 | 4 out of 4 | 7 out of 15 | 13 | 72551882-73411123 | rs4883922-rs728926 | 1.22 |
| 45 | 4 out of 4 | 6 out of 15 | 13 | 73411181-75116077 | rs17288193-rs1006412 | 1.40 |
| 44 | 3 out of 3 | 3 out of 9 | 1 | 2289487-2455004 | rs7545940-rs9803764 | 1.24 |
| 44 | 3 out of 3 | 3 out of 9 | 1 | 156653770-160351933 | rs2188102-rs1415259 | 1.24 |
| 44 | 3 out of 3 | 3 out of 9 | 2 | 138041133-138458405 | rs7563139-rs10199542 | 1.24 |
| 44 | 3 out of 3 | 3 out of 9 | 4 | 96765575-103179634 | rs11941922-rs2129294 | 1.24 |
| 44 | 3 out of 3 | 3 out of 9 | 5 | 73747-556484 | rs7709758-rs6420045 | 1.24 |
| 44 | 3 out of 3 | 3 out of 9 | 5 | 150483977-150816773 | rs2303027-rs17802828 | 1.24 |
| 44 | 3 out of 3 | 3 out of 9 | 5 | 154874578-156864954 | rs1295243-rs2277027 | 1.24 |
| 44 | 3 out of 3 | 3 out of 9 | 7 | 142903019-142909027 | rs6963381-rs1880560 | 1.24 |
| 44 | 3 out of 3 | 3 out of 9 | 8 | 602758-3038563 | rs9314595-rs13261550 | 1.24 |
| 44 | 3 out of 3 | 3 out of 9 | 16 | 10909415-11580966 | rs2229321-rs8050461 | 1.24 |
| 26 | 3 out of 3 | 3 out of 13 | 1 | 171619320-173691804 | rs6701066-rs860905 | 1.65 |
| 26 | 3 out of 3 | 4 out of 13 | 1 | 173695580-174106457 | rs1016815-rs10798418 | 1.40 |
| 26 | 3 out of 3 | 4 out of 13 | 14 | 80069595-82872217 | rs1543918-rs17625929 | 1.40 |
| 21 | 5 out of 5 | 10 out of 19 | 1 | 14226898-14226898 | rs4579751-rs4579751 | 1.27 |
| 21 | 5 out of 5 | 10 out of 19 | 5 | 73478194-73598034 | rs2120729-rs1460812 | 1.27 |
| 9 | 4 out of 8 | 4 out of 22 | 11 | 45356859-51450167 | rs717653-rs12291581 | 1.31 |
| 9 | 4 out of 8 | 4 out of 22 | 12 | 44020977-44336606 | rs10785572-rs878111 | 1.31 |
| 9 | 7 out of 8 | 10 out of 22 | 21 | 27810551-29354016 | rs2830992-rs1064019 | 1.48 |
| 5 | 3 out of 5 | 4 out of 22 | 5 | 58726008-59841224 | rs525099-rs40512 | 1.41 |
| 5 | 4 out of 5 | 8 out of 22 | 9 | 85066453-85227053 | rs10867967-rs871790 | 1.21 |
| 5 | 4 out of 5 | 7 out of 22 | 9 | 85228118-85448505 | rs3860918-rs1052690 | 1.39 |
| 5 | 5 out of 5 | 12 out of 22 | 13 | 109106993-109251608 | rs9515092-rs7986346 | 1.22 |
| 5 | 5 out of 5 | 11 out of 22 | 13 | 109253434-109607383 | rs11069806-rs9521623 | 1.36 |
| 5 | 4 out of 5 | 8 out of 22 | 13 | 109945232-110218960 | rs9555712-rs12865465 | 1.21 |
| 4 | 5 out of 5 | 12 out of 23 | 1 | 237070145-237394008 | rs869035-rs1980004 | 1.30 |
| 4 | 5 out of 5 | 11 out of 23 | 1 | 237395275-238575190 | rs11808376-rs10495466 | 1.43 |
| 4 | 5 out of 5 | 12 out of 23 | 1 | 238576784-238576784 | rs7552602-rs7552602 | 1.30 |
| 4 | 5 out of 5 | 11 out of 23 | 1 | 238579605-238713399 | rs12137050-rs9662136 | 1.43 |
| 4 | 5 out of 5 | 11 out of 23 | 7 | 142336895-143056687 | rs4236481-rs12540188 | 1.43 |
| 4 | 5 out of 5 | 12 out of 23 | 7 | 143059971-143855577 | rs4640977-rs2057868 | 1.30 |
| 4 | 5 out of 5 | 11 out of 23 | 7 | 143858588-144083589 | rs17169930-rs7793227 | 1.43 |
| 4 | 5 out of 5 | 12 out of 23 | 7 | 144088382-145211344 | rs6954142-rs4601231 | 1.30 |
| 4 | 5 out of 5 | 12 out of 23 | 8 | 126600646-126663920 | rs4006563-rs7016867 | 1.30 |
| 4 | 5 out of 5 | 12 out of 23 | 8 | 126672376-128144872 | rs4870946-rs1456314 | 1.30 |
| 4 | 5 out of 5 | 12 out of 23 | 13 | 109370211-109416832 | rs7323507-rs7984646 | 1.30 |
| 4 | 5 out of 5 | 11 out of 23 | 13 | 109419064-109607383 | rs9583447-rs9521623 | 1.43 |
| 4 | 5 out of 5 | 11 out of 23 | 14 | 92683815-94120061 | rs12589195-rs12880862 | 1.43 |
| 4 | 5 out of 5 | 12 out of 23 | 14 | 94122073-94216494 | rs2069956-rs7148204 | 1.30 |
| 4 | 5 out of 5 | 12 out of 23 | 17 | 67527147-67755206 | rs9914764-rs12939271 | 1.30 |
| 4 | 5 out of 5 | 12 out of 23 | 21 | 42351204-42525479 | rs17114247-rs881395 | 1.30 |
| 4 | 5 out of 5 | 11 out of 23 | 21 | 42525851-42616108 | rs915846-rs691567 | 1.43 |
| 4 | 5 out of 5 | 12 out of 23 | 22 | 24549605-24559502 | rs4820658-rs4822661 | 1.30 |
| 4 | 5 out of 5 | 12 out of 23 | 22 | 24561312-24579927 | rs17704912-rs2748234 | 1.30 |
| 3 | 3 out of 5 | 6 out of 29 | 1 | 171432870-171774723 | rs1234313-rs1461019 | 1.30 |
| 3 | 1 out of 5 | 1 out of 29 | 2 | 90959860-91680834 | rs10201040-rs4373803 | 1.23 |
| 3 | 5 out of 5 | 14 out of 29 | 3 | 71749225-72031216 | rs864380-rs9861583 | 1.38 |
| 3 | 5 out of 5 | 15 out of 29 | 3 | 72031489-72458673 | rs1995453-rs4303823 | 1.27 |
| 3 | 5 out of 5 | 14 out of 29 | 3 | 72459498-74148704 | rs6790069-rs1405396 | 1.38 |
| 3 | 5 out of 5 | 14 out of 29 | 3 | 74710393-74710393 | rs13073838-rs13073838 | 1.38 |
| 3 | 4 out of 5 | 10 out of 29 | 3 | 75820822-76074141 | rs536575-rs4095546 | 1.27 |
| 3 | 1 out of 5 | 1 out of 29 | 5 | 69782071-69967168 | rs169717-rs3871460 | 1.23 |
| 3 | 4 out of 5 | 10 out of 29 | 6 | 52061483-52205031 | rs6906409-rs6913472 | 1.27 |
| 3 | 4 out of 5 | 9 out of 29 | 6 | 52205660-52213626 | rs9395771-rs9382084 | 1.42 |
| 3 | 5 out of 5 | 10 out of 29 | 7 | 4275511-4316475 | rs10272180-rs2107834 | 1.96 |
| 3 | 5 out of 5 | 11 out of 29 | 7 | 4318943-4930528 | rs2097884-rs2089967 | 1.79 |
| 3 | 5 out of 5 | 12 out of 29 | 7 | 4930906-4930906 | rs6947947-rs6947947 | 1.64 |
| 3 | 5 out of 5 | 11 out of 29 | 7 | 4934189-5342068 | rs13224720-rs10234709 | 1.79 |
| 3 | 5 out of 5 | 12 out of 29 | 7 | 5344404-5549582 | rs13238999-rs2098225 | 1.64 |
| 3 | 5 out of 5 | 13 out of 29 | 7 | 5551125-6459404 | rs1725213-rs7810553 | 1.50 |
| 3 | 5 out of 5 | 14 out of 29 | 7 | 6461542-7642706 | rs7792987-rs10280185 | 1.38 |
| 3 | 5 out of 5 | 15 out of 29 | 7 | 7767212-7831276 | rs17137412-rs12702661 | 1.27 |
| 3 | 5 out of 5 | 15 out of 29 | 7 | 150524562-150524562 | rs310586-rs310586 | 1.27 |
| 3 | 5 out of 5 | 14 out of 29 | 7 | 150526978-150611097 | rs7458773-rs6953552 | 1.38 |
| 3 | 5 out of 5 | 15 out of 29 | 7 | 150613053-150619105 | rs7797007-rs219245 | 1.27 |
| 3 | 1 out of 5 | 1 out of 29 | 9 | 40059290-44362584 | rs375972-rs4929023 | 1.23 |
| 3 | 1 out of 5 | 1 out of 29 | 9 | 44670536-46992793 | rs12006135-rs7049015 | 1.23 |
| 3 | 1 out of 5 | 1 out of 29 | 9 | 65231255-65635106 | rs28533023-rs1480368 | 1.23 |
| 3 | 1 out of 5 | 1 out of 29 | 13 | 111553045-114123122 | rs12017986-rs12874290 | 1.23 |
| 3 | 1 out of 5 | 1 out of 29 | 20 | 28039018-28259678 | rs7267880-rs6567465 | 1.23 |
| Family | RCHH Region (bph18) | Chr | Start | End | Ref | Alt | Function | Gene | No. of Affected | No. of Unaffected |
|---|---|---|---|---|---|---|---|---|---|---|
| 61 | chr6: 42767957-43333769 | 6 | 43181034 | 43181034 | T | G | splicing region on exon 27 | CUL9 | 3 out of 3 | 1 out of 1 |
| 6 | 43106964 | 43106964 | A | C | non-synonymous variant on exon 9 | PTK7 | 3 out of 3 | 0 out of 1 | ||
| 6 | 43223539 | 43223539 | A | C | non-synonymous variant on exon 9 | TTBK1 | 3 out of 3 | 0 out of 1 | ||
| 6 | 42976917 | 42976917 | A | C | non-synonymous variant on exon 9 | PPP2R5D | 3 out of 3 | 0 out of 1 | ||
| chr20:48202462-49044808 | 20 | 49366933 | 49366933 | G | C | non-synonymous variant on exon 3 | PARD6B | 3 out of 3 | 0 out of 1 | |
| chr20:49044993-50323395 | 20 | 50245517 | 50245517 | A | C | splicing region on exon 16 | ATP9A | 3 out of 3 | 1 out of 1 | |
| chr12:122479650-122743242 | 12 | 123943942 | 123943942 | A | C | intronic variant | SNRNP35 | 3 out of 3 | 0 out of 1 | |
| chr2:221458760-223560597 | 2 | 223554057 | 223554057 | T | G | non-synonymous variant on exon 3 | MOGAT1 | 3 out of 3 | 1 out of 1 | |
| 2360 | chr6:26287459-32628250 | 6 | 29856257 | 29856257 | G | C | non-coding RNA | HLA-H | 6 out of 10 | NA |
| 6 | 29856261 | 29856261 | G | A | non-coding RNA | HLA-H | 6 out of 10 | NA | ||
| 6 | 29856263 | 29856263 | G | A | non-coding RNA | HLA-H | 6 out of 10 | NA | ||
| chr13:108090996-108968251 | 13 | 108519067 | 108519070 | CTCT | - | 5′UTR | FAM155A (NLF-1) | 9 out of 10 | NA | |
| 13 | 109859349 | 109859354 | TGTGTT | - | 3′UTR | MYO16 | 7 out of 10 | NA | ||
| 4 | chr21:42351204-42525479 | 21 | 43557751 | 43557832 | deletion on slicing site | UMODL1 | 3 out of 4 | NA | ||
| 5 | chr13:109945232-110218960 | 13 | 11364877 | 11364877 | - | GGG | insertion in the upstream site | ING1 | 3 out of 5 | NA |
Publisher’s Note: MDPI stays neutral with regard to jurisdictional claims in published maps and institutional affiliations. |
© 2021 by the authors. Licensee MDPI, Basel, Switzerland. This article is an open access article distributed under the terms and conditions of the Creative Commons Attribution (CC BY) license (https://creativecommons.org/licenses/by/4.0/).
Share and Cite
Fazia, T.; Marzanati, D.; Carotenuto, A.L.; Beecham, A.; Hadjixenofontos, A.; McCauley, J.L.; Saddi, V.; Piras, M.; Bernardinelli, L.; Gentilini, D. Homozygosity Haplotype and Whole-Exome Sequencing Analysis to Identify Potentially Functional Rare Variants Involved in Multiple Sclerosis among Sardinian Families. Curr. Issues Mol. Biol. 2021, 43, 1778-1793. https://doi.org/10.3390/cimb43030125
Fazia T, Marzanati D, Carotenuto AL, Beecham A, Hadjixenofontos A, McCauley JL, Saddi V, Piras M, Bernardinelli L, Gentilini D. Homozygosity Haplotype and Whole-Exome Sequencing Analysis to Identify Potentially Functional Rare Variants Involved in Multiple Sclerosis among Sardinian Families. Current Issues in Molecular Biology. 2021; 43(3):1778-1793. https://doi.org/10.3390/cimb43030125
Chicago/Turabian StyleFazia, Teresa, Daria Marzanati, Anna Laura Carotenuto, Ashley Beecham, Athena Hadjixenofontos, Jacob L. McCauley, Valeria Saddi, Marialuisa Piras, Luisa Bernardinelli, and Davide Gentilini. 2021. "Homozygosity Haplotype and Whole-Exome Sequencing Analysis to Identify Potentially Functional Rare Variants Involved in Multiple Sclerosis among Sardinian Families" Current Issues in Molecular Biology 43, no. 3: 1778-1793. https://doi.org/10.3390/cimb43030125
APA StyleFazia, T., Marzanati, D., Carotenuto, A. L., Beecham, A., Hadjixenofontos, A., McCauley, J. L., Saddi, V., Piras, M., Bernardinelli, L., & Gentilini, D. (2021). Homozygosity Haplotype and Whole-Exome Sequencing Analysis to Identify Potentially Functional Rare Variants Involved in Multiple Sclerosis among Sardinian Families. Current Issues in Molecular Biology, 43(3), 1778-1793. https://doi.org/10.3390/cimb43030125