Article

Comparative Proteomic Analysis of tPVAT during Ang II Infusion

Department of Pharmacology, School of Pharmacy, Nantong University, 19 QiXiu Road, Nantong 226001, China
*
Author to whom correspondence should be addressed.
These authors contributed equally to this work.
Biomedicines 2021, 9(12), 1820; https://doi.org/10.3390/biomedicines9121820
Submission received: 1 November 2021 / Revised: 26 November 2021 / Accepted: 29 November 2021 / Published: 2 December 2021
(This article belongs to the Section Molecular and Translational Medicine)

Abstract

:
Perivascular adipose tissue (PVAT) homeostasis plays an important role in maintaining vascular function, and PVAT dysfunction may induce several pathophysiological situations. In this study, we investigated the effect and mechanism of the local angiotensin II (Ang II) on PVAT. High-throughput comparative proteomic analysis, based on TMT labeling combined with LC-MS/MS, were performed on an in vivo Ang II infusion mice model to obtain a comprehensive view of the protein ensembles associated with thoracic PVAT (tPVAT) dysfunction induced by Ang II. In total, 5037 proteins were confidently identified, of which 4984 proteins were quantified. Compared with the saline group, 145 proteins were upregulated and 146 proteins were downregulated during Ang II-induced tPVAT pathogenesis. Bioinformatics analyses revealed that the most enriched GO terms were annotated as gene silencing, monosaccharide binding, and extracellular matrix. In addition, some novel proteins, potentially associated with Ang II infusion, were identified, such as acyl-CoA carboxylase α, very long-chain acyl-CoA synthetase (ACSVL), uncoupling protein 1 (UCP1), perilipin, RAS protein-specific guanine nucleotide-releasing factor 2 (RasGRF2), and hypoxia inducible factor 1α (HIF-1α). Ang II could directly participate in the regulation of lipid metabolism, transportation, and adipocyte differentiation by affecting UCP1 and perilipin. Importantly, the key KEGG pathways were involved in fatty acid biosynthesis, FABP3-PPARα/γ, RasGRF2-ERK-HIF-1α, RasGRF2-PKC-HIF-1α, and STAT3-HIF-1α axis. The present study provided the most comprehensive proteome profile of mice tPVAT and some novel insights into Ang II-mediated tPVAT dysfunction and will be helpful for understanding the possible relationship between local RAS activation and PVAT dysfunction.

1. Introduction

The renin–angiotensin–aldosterone system (RAAS) is involved in systemic blood pressure regulation and renal electrolyte homeostasis. It is well accepted that Ang II mediates vascular smooth muscle cell (VSMC) proliferation, migration, and vascular remodeling [1,2]. We also previously reported that Ang II regulates VSMC proliferation and vascular remodeling by RhoGDI signaling [3]. However, there is no detailed report on the effect of Ang II on PVAT (perivascular adipose tissue) structure and function.
PVAT is an adipose tissue with endocrine and paracrine functions surrounding the blood vessels, such as the small mesenteric and femoral arteries or the large abdominal aorta (AA), and plays wide-ranging physiological roles on vascular environment stability and influences vascular pathogenesis [4,5]. Under physiological conditions, PVAT has strong anti-atherosclerosis properties, induces non-shivering thermogenesis (NST), and metabolizes fatty acids by secreting various bioactive factors [6]. Under pathological conditions (such as obesity), PVAT loses its thermogenic ability and secretes pro-inflammatory adipocytokines that induce endothelial dysfunction and inflammatory cell infiltration and promotes the development of atherosclerosis [6]. The PVAT in the thoracic aorta is more similar to brown adipose tissue (BAT), while the PVAT in the abdominal aorta is similar to white adipose tissue (WAT). WAT primarily stores energy in the form of triglycerides, while excessive lipid accumulation in WAT leads to adipocyte hypertrophy and dysfunction. This leads to increased secretion of harmful fat factors and inflammatory cytokines into circulation, thus impairing the function of the vascular endothelium [7,8]. Unlike WAT, BAT can absorb lipids by uncoupling oxidation in the mitochondrial electron transport chain to generate heat, and this is characterized by the expression of the heat-producing gene uncoupling protein 1 (UCP1) [9]. In addition, WAT can be browned under the stimulation of low temperature and catecholamine [10,11]. The browning of WAT is characterized by a high expression of the brown adipocyte marker UCP1 [12], which is now called the third adipose tissue-beige adipose tissue (BEt). In general, changes in the phenotype of PVAT correlate with disease progression.
Many studies have shown that there is local RAAS activity in PVAT [13]. It has been reported that Ang II inhibits adipogenic differentiation of human preadipocytes in vitro via the AT1 receptor [14]. The AngII-AT2 or Ang (1–7)-Mas activation stimulates adipogenesis and antagonizes the antiadipogenic effect of AngII-AT1 activation [15,16]. However, the effect of Ang II on PVAT remains unclear. In this study, we used TMT, combined with LC-MS/MS and bioinformatics analysis, to analyze the phenotypic changes of PVAT during Ang II infusion.

2. Materials and Methods

2.1. Materials

Ang II was obtained from MedChemExpress (#HY-B0202; Princeton, NJ, USA). The primary antibodies against KDM1A (BM4356), ALCAM (A01788-1), MBNL1 (A02309-1), and TSN (A02777) were purchased from Boster Biological Technology (Wuhan, Hubei, China). Anti-TMEM41B (29270-1-AP), -PRTN3 (25278-1-AP), -GIGYF2 (24790-1-AP), -NHP2 (15128-1-AP), -RDH10 (14644-1-AP), and -TIMD4 (12008-1-AP) antibodies were purchased from Proteintech (Chicago, IL, USA). Anti-CtBP1 (ab129181), -PKN1 (ab231038), and -CCN1 (ab228592) antibodies were purchased from Abcam (Cambridge, MA, USA). Peroxidase-conjugated AffiniPure goat anti-rabbit IgG (H + L) was from Proteintech (SA00001–2; Chicago, IL, USA). An SABC immunohistochemistry staining kit was sourced from BosterBio (SA1028; Wuhan, Hubei, China). All other chemicals used in this study were analytical grade and were made in China.

2.2. Animals and Experimental Protocol

Animal procedures were performed in accordance with the Ethics Committee and the Animal Care and Use Committee of Nantong University (Ethic Committee approval number: 1213201.1) and conformed to the NIH Guide for the Care and Use of Laboratory Animals. Male C57BL/6 mice, aged 45 days weighing 20 ± 1 g (20 mice per group), were purchased from Beijing Vital River Laboratory Animal Technology Co., Ltd. (Beijing, China). Mice were anesthetized by intraperitoneal injection of 3.6% chloral hydrate (11 mL/kg). For Ang II infusion, mice were implanted with an Alzet Model 1002 osmotic minipump (Alzet Corp, Cupertino, CA, USA) for subcutaneous infusion of Ang II at a rate of 1000 ng/kg/min [3]. Control mice were implanted with pumps for infusion of normal saline. Pumps were placed into the subcutaneous space of anesthetized mice through a small incision in the back of the neck. The incision was closed, and the mice were allowed to recover without medication. After 14 days, mice were then euthanized. The aortic tree was quickly separated and washed with pre-chilled saline for subsequent analysis.

2.3. Adipose Tissue Transplantation

The PVAT around the thoracic aorta was carefully removed with microforceps under a surgical microscope. The removed thoracic PVAT (tPVAT) was then weighed and placed in Dulbecco’s Modifed Eagle Medium (DMEM, Gibco, Termo Fisher Scientifc, Inc., Waltham, MA, USA) containing 1% antibiotics (R&D Systems, Inc., Minneapolis, MN, USA). For proteomics analysis, the normal and Ang II infusion group had no less than 600 mg of the removed tPVAT in each group. The remaining tPVAT and blood vessels were used for the following experiments or stored in a liquid nitrogen tank.

2.4. H&E Staining

The removed tPVAT around the thoracic aorta was fixed in 4% paraformaldehyde and then embedded in paraffin for staining with hematoxylin and eosin. For quantitative analysis of adipocyte diameter, tissue sections were captured with Olympus digital camera (Tokyo, Japan) and quantified via Image-Pro Plus 6.0 software (Media Cybernetics, Rockville, MD, USA).

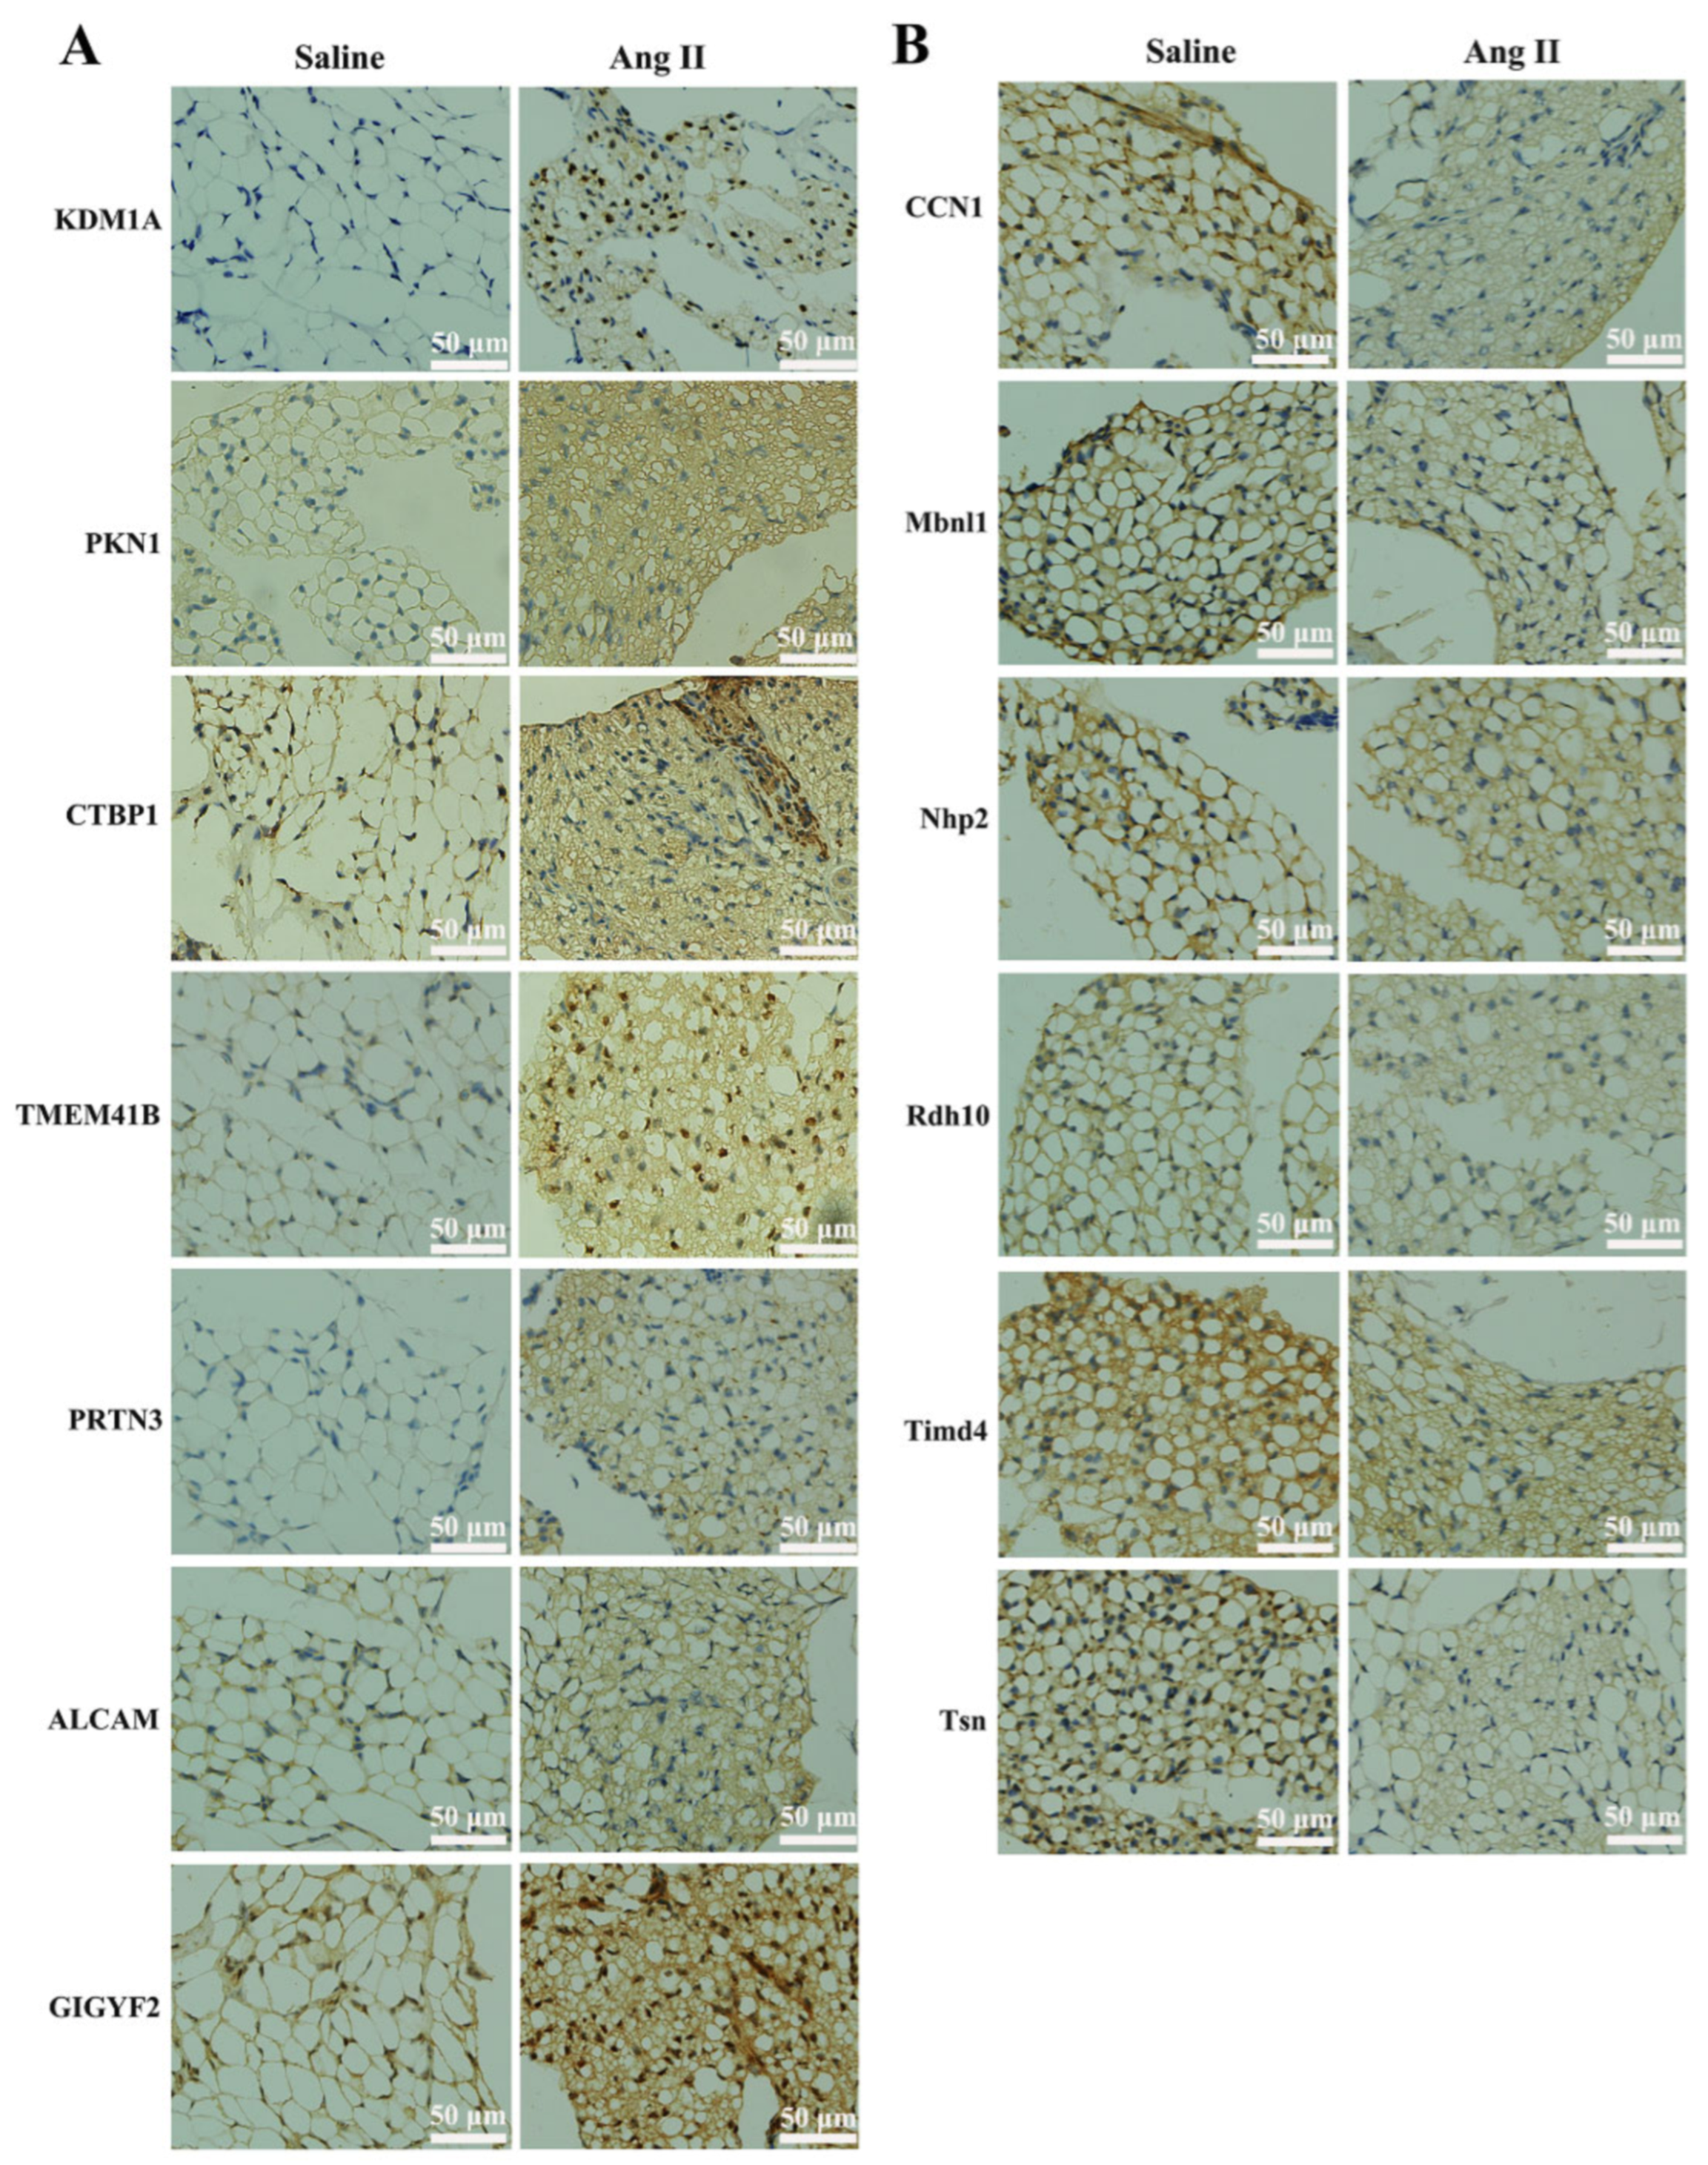
2.5. Immunohistochemical Analysis

Immunohistochemical staining against KDM1A, ALCAM, MBNL1, TSN, TMEM41B, PRTN3, GIGYF2, NHP2, RDH10, TIMD4, CtBP1, PKN1, and CCN1 were performed using a strept avidin-biotin complex (SABC) immunohistochemistry staining kit and following the manufacturer’s instructions. Paraffin-embedded tissue sections of the transplanted tPVAT (5 μm thick) were deparafnized and blocked with 0.5% horse serum. The sections were then incubated with the primary antibodies overnight at 4 °C, followed by incubation with biotinylated anti-rabbit IgG as the secondary antibody at room temperature for 2 h and SABC for 1 h. The samples were then visualized using a diaminobenzidine (DAB) staining kit, followed by counterstaining with hematoxylin, in order to stain the target proteins brown. All images were captured using an Olympus digital camera (Olympus, Tokyo, Japan) and analyzed using the Image-Pro Plus 6.0 software program (Media Cybernetics, Rockville, MD, USA).

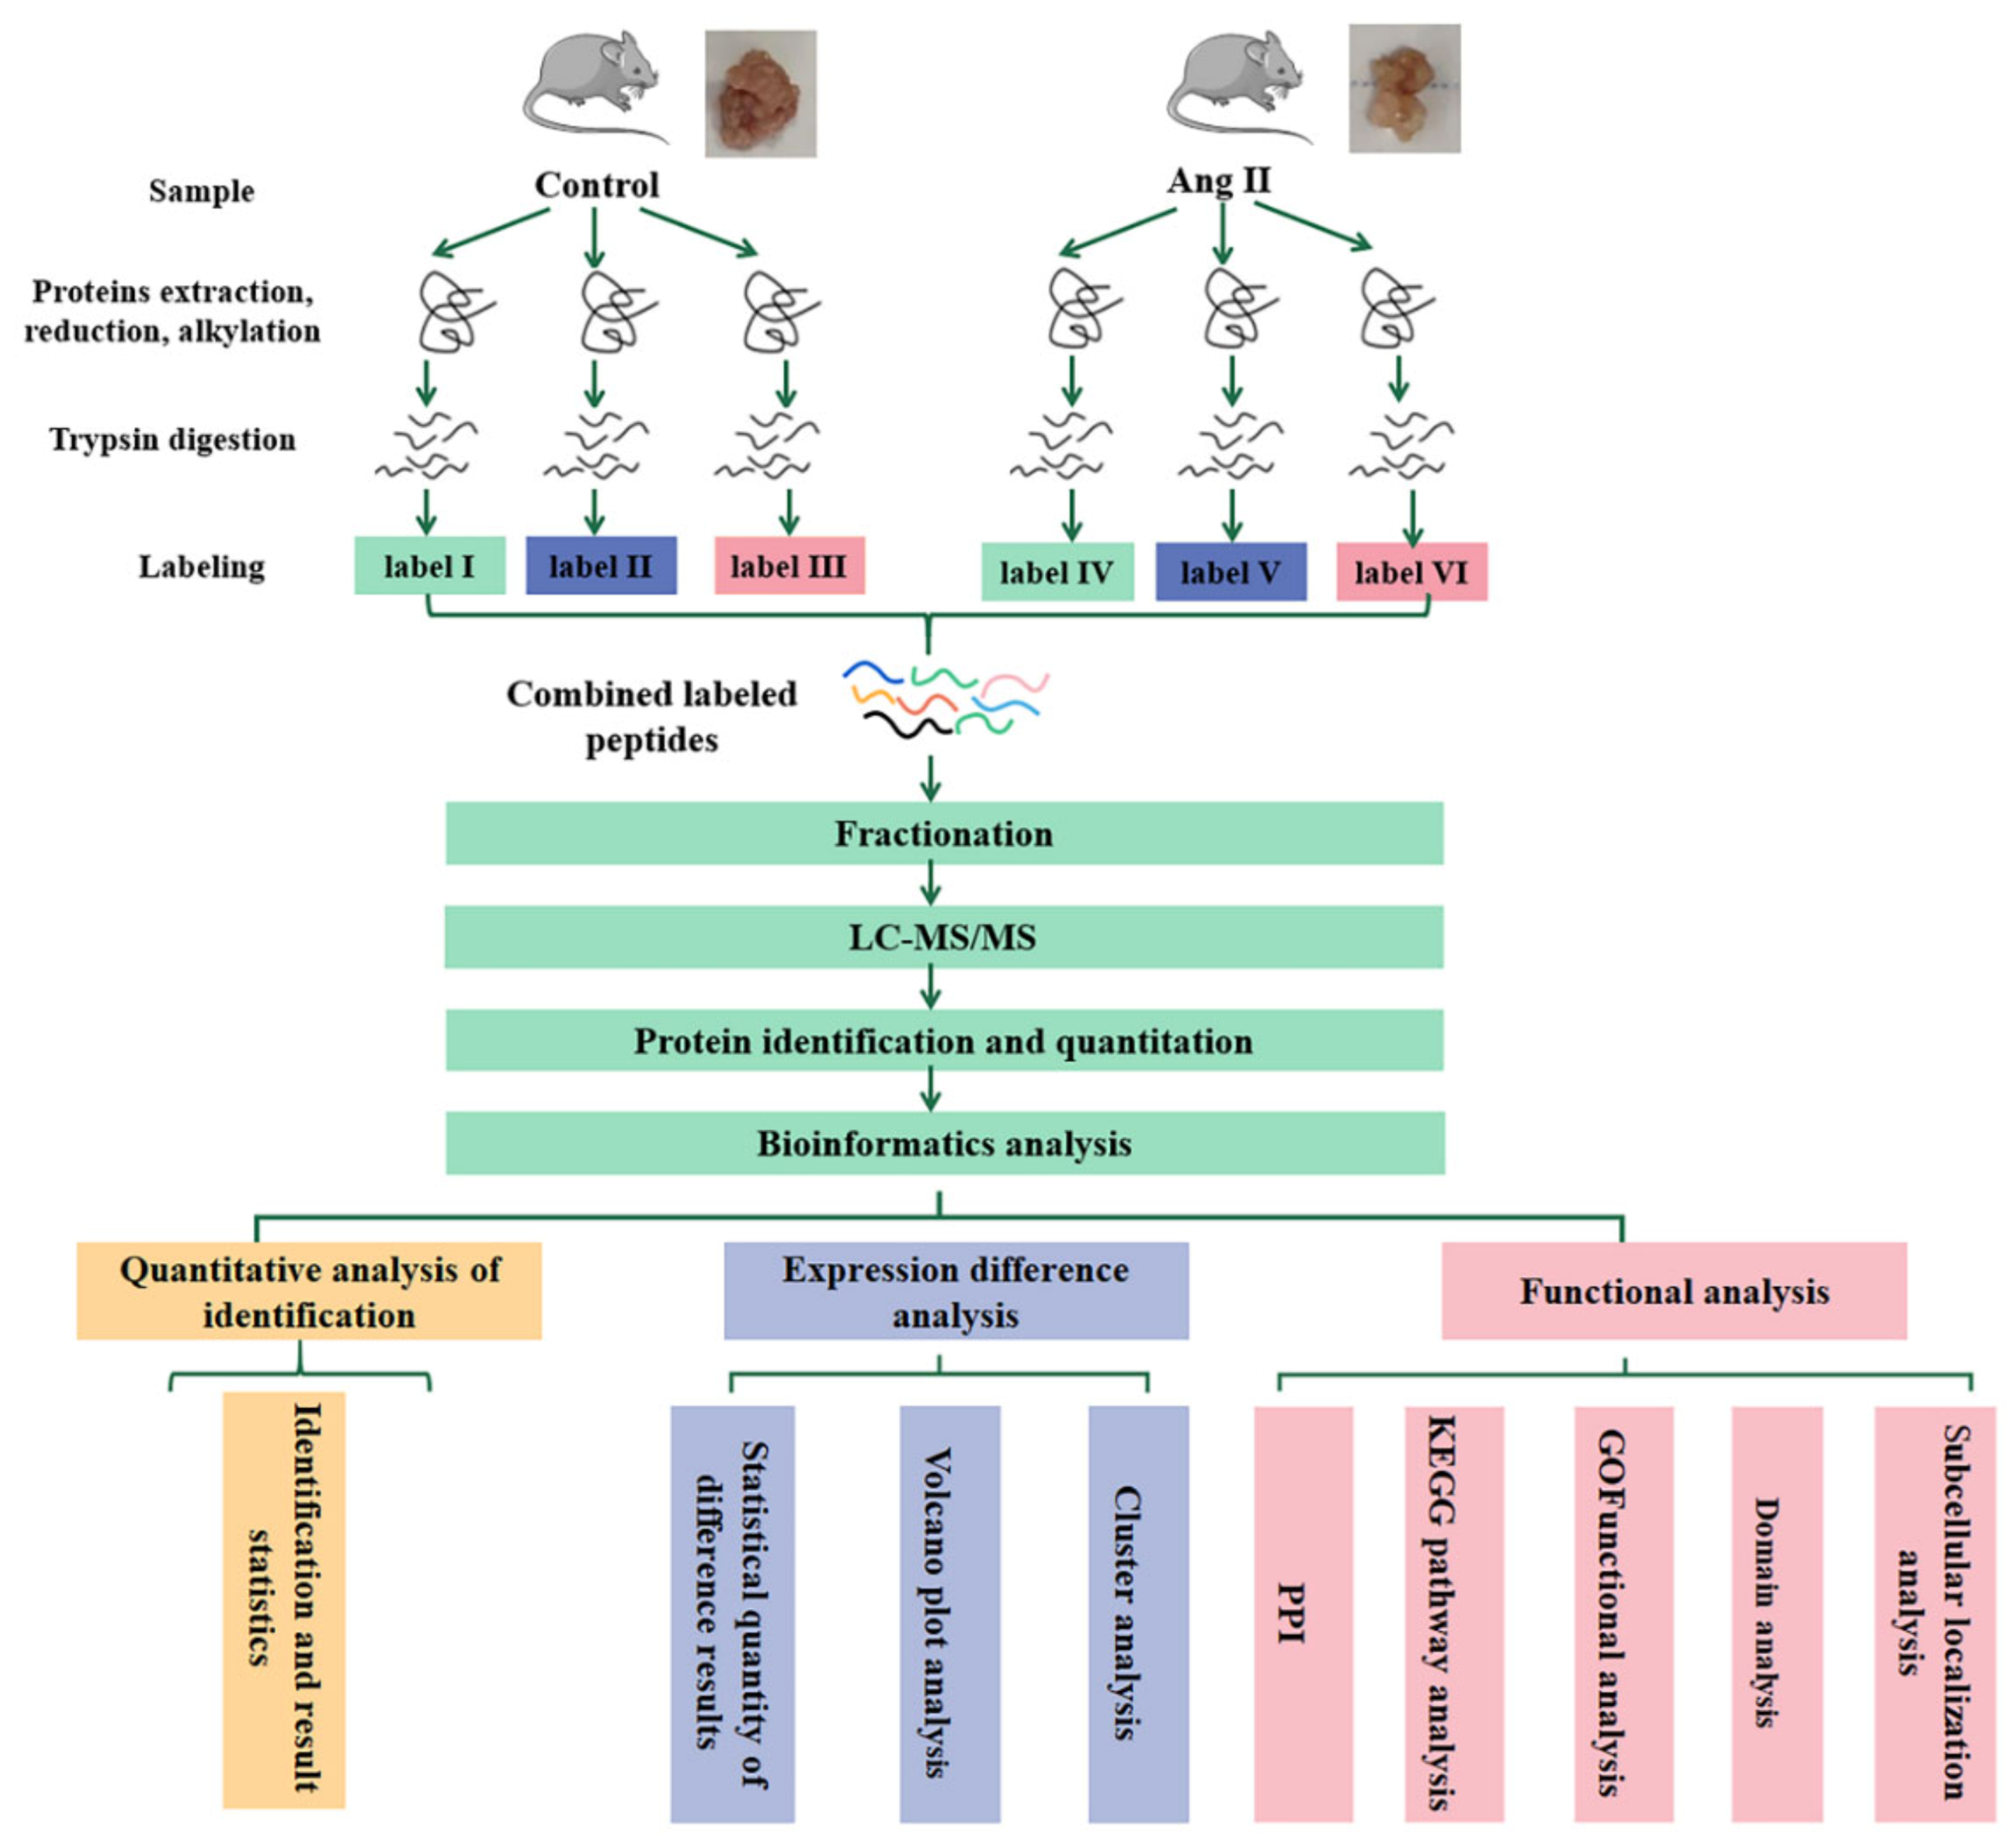
2.6. Quantitative Proteomic Profiling by Tandem Mass Tag (TMT) Technology

The flowchart of proteomics and bioinformatics analysis is shown in Figure 1.
The removed tPVAT around the thoracic aorta was ground to powder in liquid nitrogen. Proteins were extracted in lysis buffer (4% SDS, 100 mM Tris-HCL, 1 mM DTT, pH 7.6) for 30 min on ice. Then, cells were further broken using an ultrasonic cell disruptor, followed by centrifugation at 14,000 rpm for 1.5 h at 19 °C using a TL-100 ultracentrifuge (Beckman, Palo Alto, Brea, CA, USA). Finally, the middle layer of aqueous liquid was retained. The amount of protein was quantified with the BCA Protein Assay Kit (Bio-Rad, Hercules, CA, USA). Protein digestion by trypsin was performed according to filter-aided sample preparation (FASP) procedure described previously [17]. The digest peptides of each sample were desalted on C18 Cartridges (Empore™ SPE Cartridges C18, Oxford, PA, USA (standard density), bed I.D. 7 mm, volume 3 mL, Sigma), concentrated by vacuum centrifugation and reconstituted in 40 µL of 0.1% (v/v) formic acid. The peptide content was estimated by UV light spectral density at 280 nm using an extinctions coefficient of 1.1 of 0.1% (g/L) solution that was calculated on the basis of the frequency of tryptophan and tyrosine in vertebrate proteins.
100 μg peptide mixture of each sample was labeled using TMT reagent according to the manufacturer’s instructions (Thermo Scientific, Waltham, MA, USA). Labeled peptides were fractionated by SCX chromatography using the AKTA Purifier system (GE Healthcare, Chicago, IL, USA). The dried peptide mixture was reconstituted and acidified with buffer A (10 mM KH2PO4 in 25% of ACN, pH 3.0) and loaded onto a PolySULFOETHYL 4.6 × 100 mm column (5 µm, 200 Å, PolyLC Inc., Columbia, MD, USA). The peptides were eluted at a flow rate of 1 mL/min with a gradient of 0% buffer B (500 mM KCl, 10 mM KH2PO4 in 25% of ACN, pH 3.0) for 25 min, 0–10% buffer B during 25–32 min, 10–20% buffer B during 32–42 min, 20–45% buffer B during 42–47 min, 45–100% buffer B during 47–52 min, 100% buffer B during 52–60 min, and buffer B was reset to 0% after 60 min. The elution was monitored by absorbance at 214 nm, and fractions were collected every 1 min. The collected fractions were desalted on C18 Cartridges and concentrated by vacuum centrifugation.
Liquid chromatography tandem mass spectrometry (LC-MS/MS) analysis was performed on a Q Exactive mass spectrometer (Thermo Scientific, Waltham, MA, USA) that was coupled to Easy nLC (Proxeon Biosystems, now Thermo Fisher Scientific) for 60/90 min. The peptides were loaded onto a reverse phase trap column (Thermo Scientific Acclaim PepMap100, 100 μm × 2 cm, nanoViper C18), connected to the C18-reversed phase analytical column (Thermo Scientific Easy Column, 10 cm long, 75 μm inner diameter, 3 μm resin) in buffer A (0.1% Formic acid) and separated with a linear gradient of buffer B (84% acetonitrile and 0.1% Formic acid) at a flow rate of 300 nL/min, controlled by IntelliFlow technology. The mass spectrometer was operated in positive ion mode. MS data was acquired using a data-dependent top-10 method, dynamically choosing the most abundant precursor ions from the survey scan (300–1800 m/z) for HCD fragmentation. Automatic gain control (AGC) target was set to 3e6, and maximum inject time to 10 ms. Dynamic exclusion duration was 40.0 s. Survey scans were acquired at a resolution of 70,000 at m/z 200 and resolution for HCD spectra was set to 17,500 at m/z 200, and isolation width was 2 m/z. Normalized collision energy was 30 eV and the underfill ratio, which specifies the minimum percentage of the target value likely to be reached at maximum fill time, was defined as 0.1%. The instrument was run with peptide recognition mode enabled.

2.7. Identification and Quantitation of Proteins

The MS raw data for each sample were searched using the MASCOT engine (Matrix Science, London, UK; version 2.2), embedded into Proteome Discoverer 1.4 software for identification and quantitation analysis. Related parameters and instructions were shown in Supplementary Materials Table S1. The mass spectrometry proteomics data have been deposited to the ProteomeXchange Consortium via the PRIDE partner repository with the dataset identifier PXD029980.

2.8. Bioinformatic Analysis

Upregulated genes and downregulated genes were used to conduct a cluster analysis, a subcellular localization analysis, a Gene Ontology (GO, Valencia, Spain) analysis, a Kyoto Encyclopedia of Genes and Genomes (KEGG, Kyoto, Japan) pathway and enrichment analysis, and a protein-protein interaction (PPI, Hinxton, Cambridgeshire, UK) analysis.

2.8.1. Cluster Analysis

Cluster 3.0 (http://bonsai.hgc.jp/~mdehoon/software/cluster/software.htm, accessed on 17 February 2020) and Java Treeview software 3.0 (http://jtreeview.sourceforge.net, accessed on 17 February 2020) were used to perform hierarchical clustering analysis. Euclidean distance algorithm for similarity measure and average linkage clustering algorithm (clustering uses the centroids of the observations) for clustering were selected when performing hierarchical clustering. A heat map was often presented as a visual aid, in addition to the dendrogram.

2.8.2. Subcellular Localization

CELLO (http://cello.life.nctu.edu.tw/, accessed on 17 February 2020), which is a multi-class SVM classification system, was used to predict protein subcellular localization.

2.8.3. GO Analysis

The protein sequences of the selected differentially expressed proteins (DEPs) were locally searched using the NCBI BLAST+ client software (ncbi-blast-2.2.28 + -win32.exe) and InterProScan to find homologue sequences, then GO terms were mapped and sequences were annotated using the software program Blast2GO (version 2.5.0). The GO annotation results were plotted by R scripts.

2.8.4. KEGG Pathway

Following annotation steps, the studied proteins were blasted against the online KEGG database (http://geneontology.org/, accessed on 17 February 2020) to retrieve their KEGG orthology identifications and were subsequently mapped to pathways in KEGG. Enrichment analyses were applied based on the Fisher’ exact test, considering the whole quantified proteins as background dataset. Benjamini–Hochberg correction for multiple testing was further applied to adjust derived p-values. Only functional categories and pathways with p-values under a threshold of 0.05 were considered significant.

2.8.5. PPI Analysis

The PPI information of the studied proteins was retrieved from IntAct molecular interaction database (http://www.ebi.ac.uk/intact/, accessed on 17 February 2020) by their gene symbols or STRING software (http://string-db.org/, accessed on 17 February 2020, version 11.5). The results were downloaded in the XGMML format and imported into Cytoscape software (http://www.cytoscape.org/, accessed on 17 February 2020, version 3.2.1) to visualize and further analyze functional protein-protein interaction networks. Furthermore, the degree of each protein was calculated to evaluate the importance of the protein in the PPI network.

2.9. Statistical Analysis

All of the results are expressed as the mean ±SD. One-way ANOVA, followed by Tukey’s post-hoc test, as implemented in SPSS 22.0, was used for statistical analysis. Differences with a value of p < 0.05 were considered to be statistically significant.

3. Results

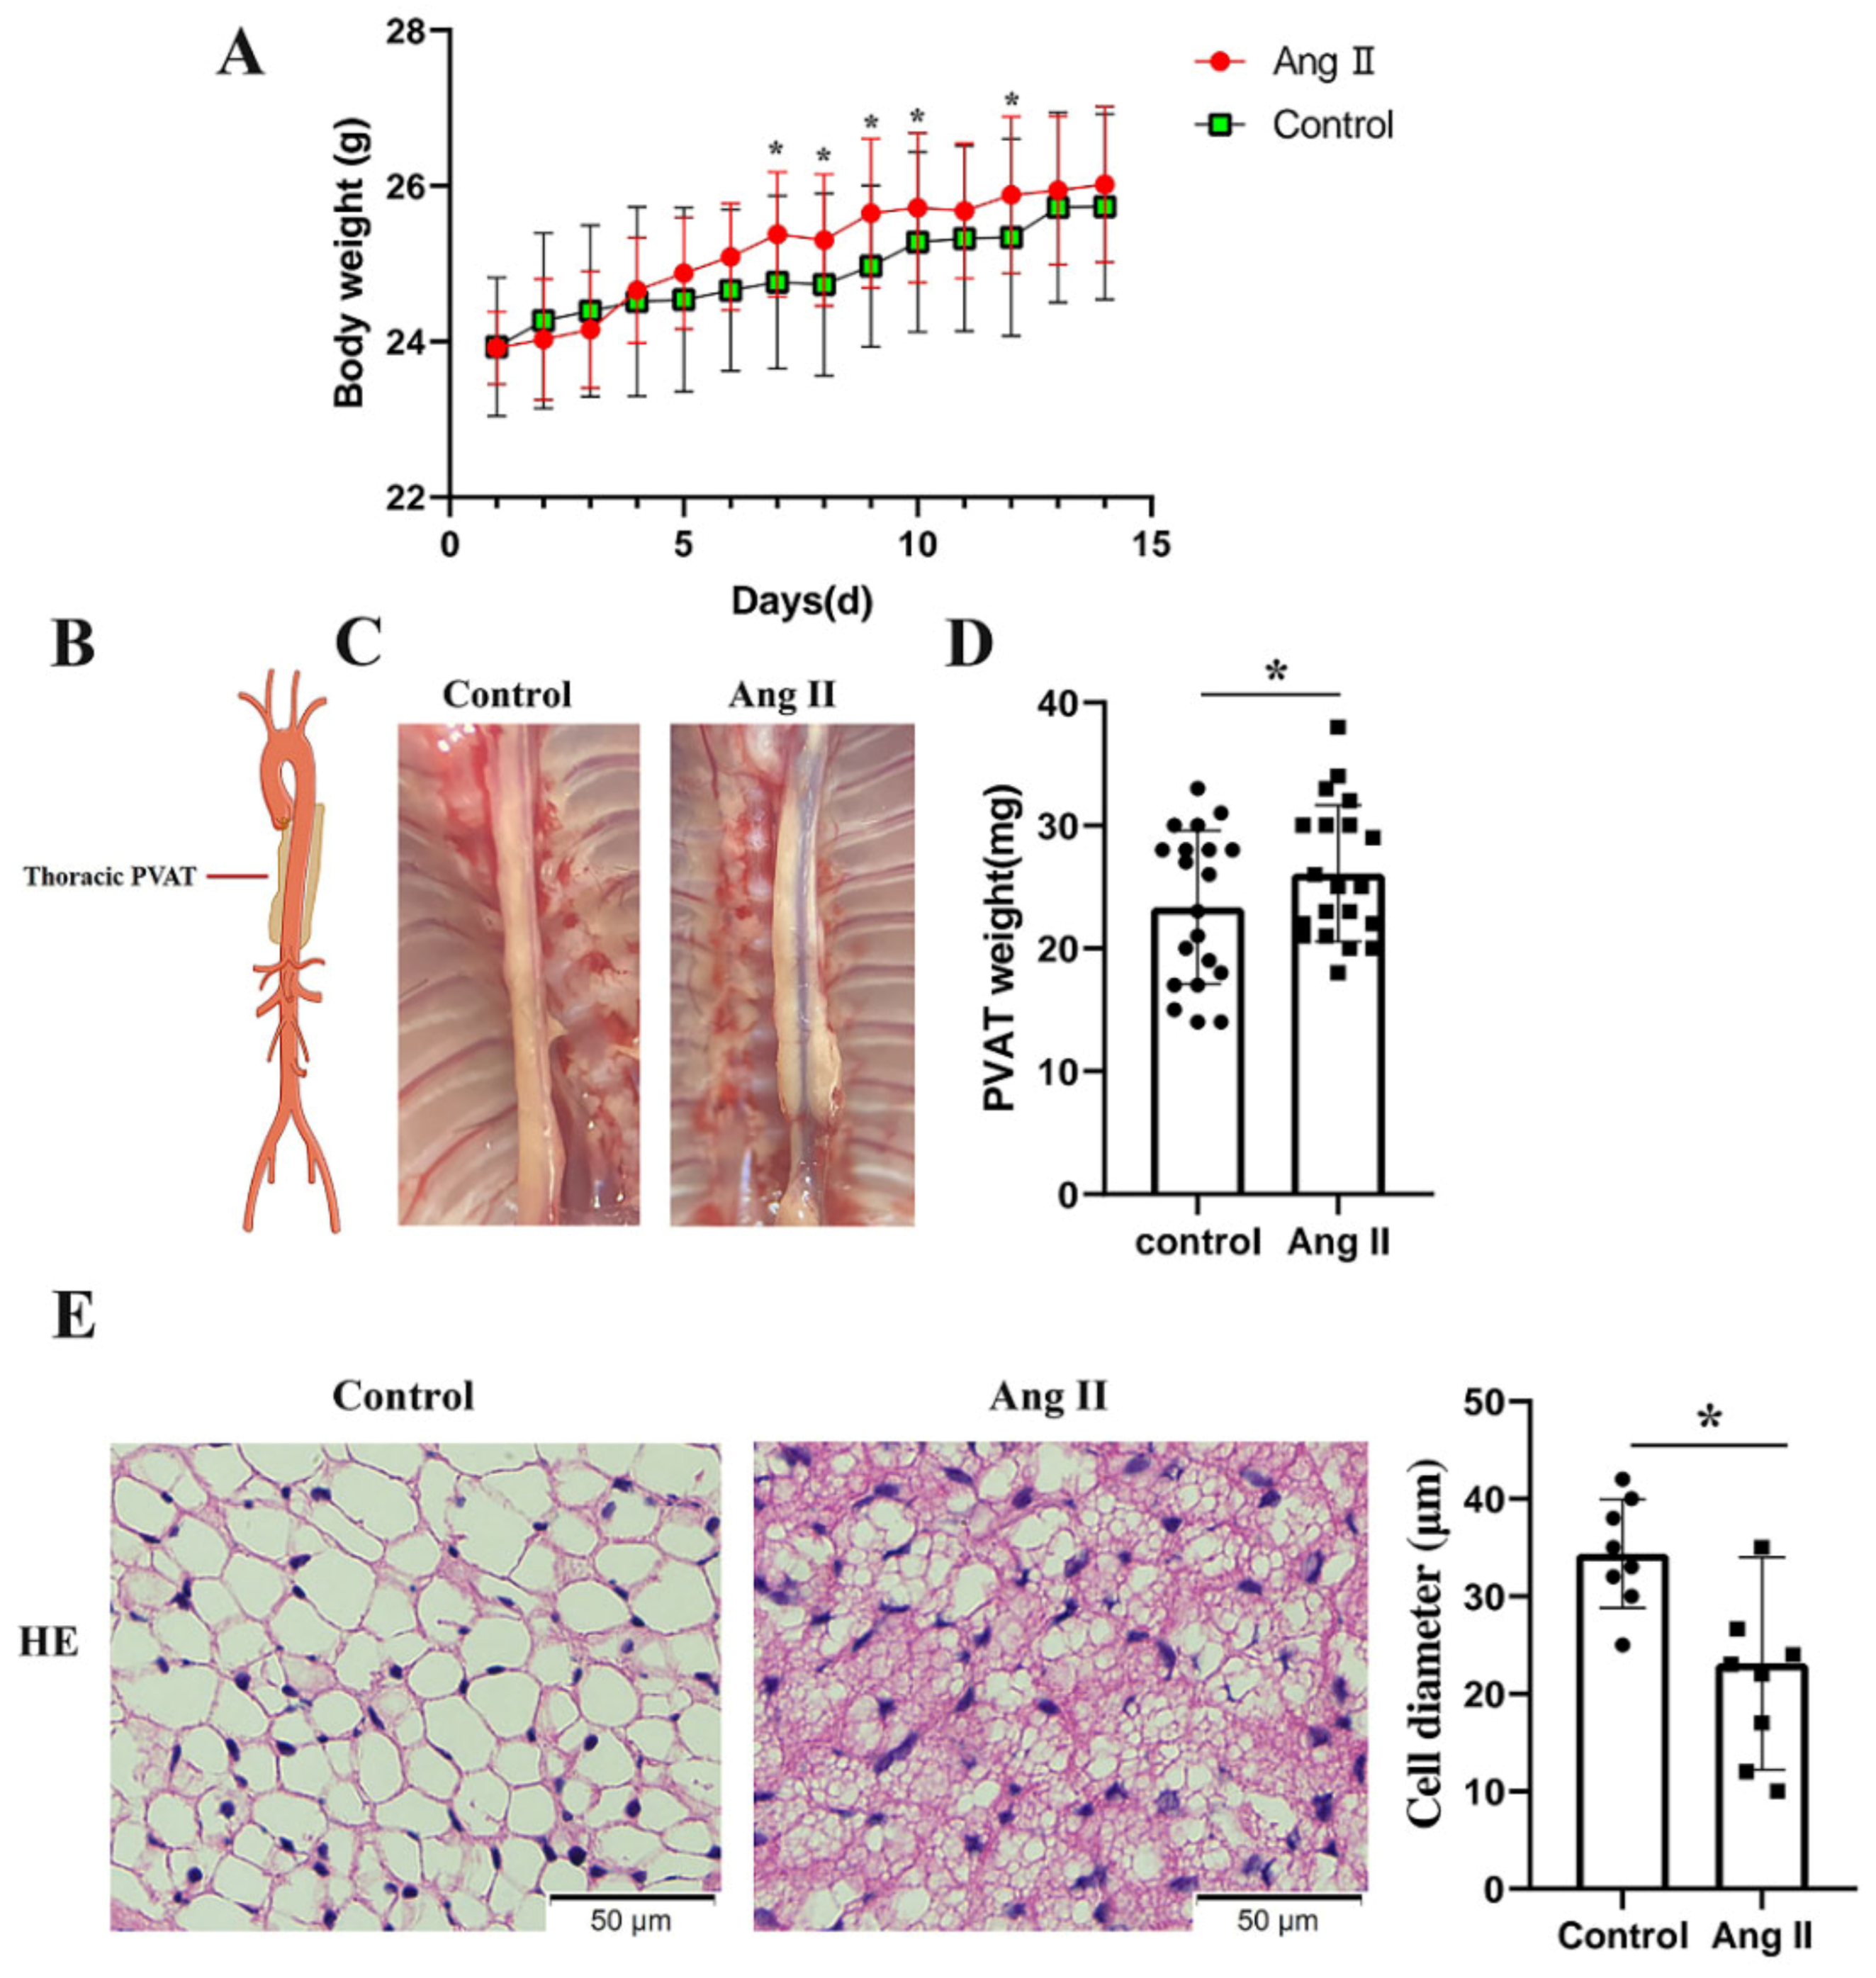
3.1. Pathological Conversion of tPVAT after Ang II Infusion

To determine the effects of Ang II on the tPVAT phenotype, male C57BL/6J mice aged 42–48 days were infused with Ang II or normal saline for two weeks. Mice that were infused with Ang II were significantly heavier than the controls by 7 and 12 days (Figure 2A). The tPVAT was successfully separated (Figure 2B,C). Figure 2C shows that Ang II infusion made the tPVAT morphology significantly irregular and caused hypertrophy, when compared with the saline group. The tPVAT weight of the Ang II infusion group was significantly higher than that of the control group (Figure 2D). Next, we histologically analyzed tPVAT after Ang II infusion. Mice infused with Ang II had a marked phenotypic conversion of tPVAT from a regular cell size to an irregular size (Figure 2E). Compared with the saline group, the Ang II-infused mice showed a substantial decrease in adipocyte size in tPVAT (Figure 2E).

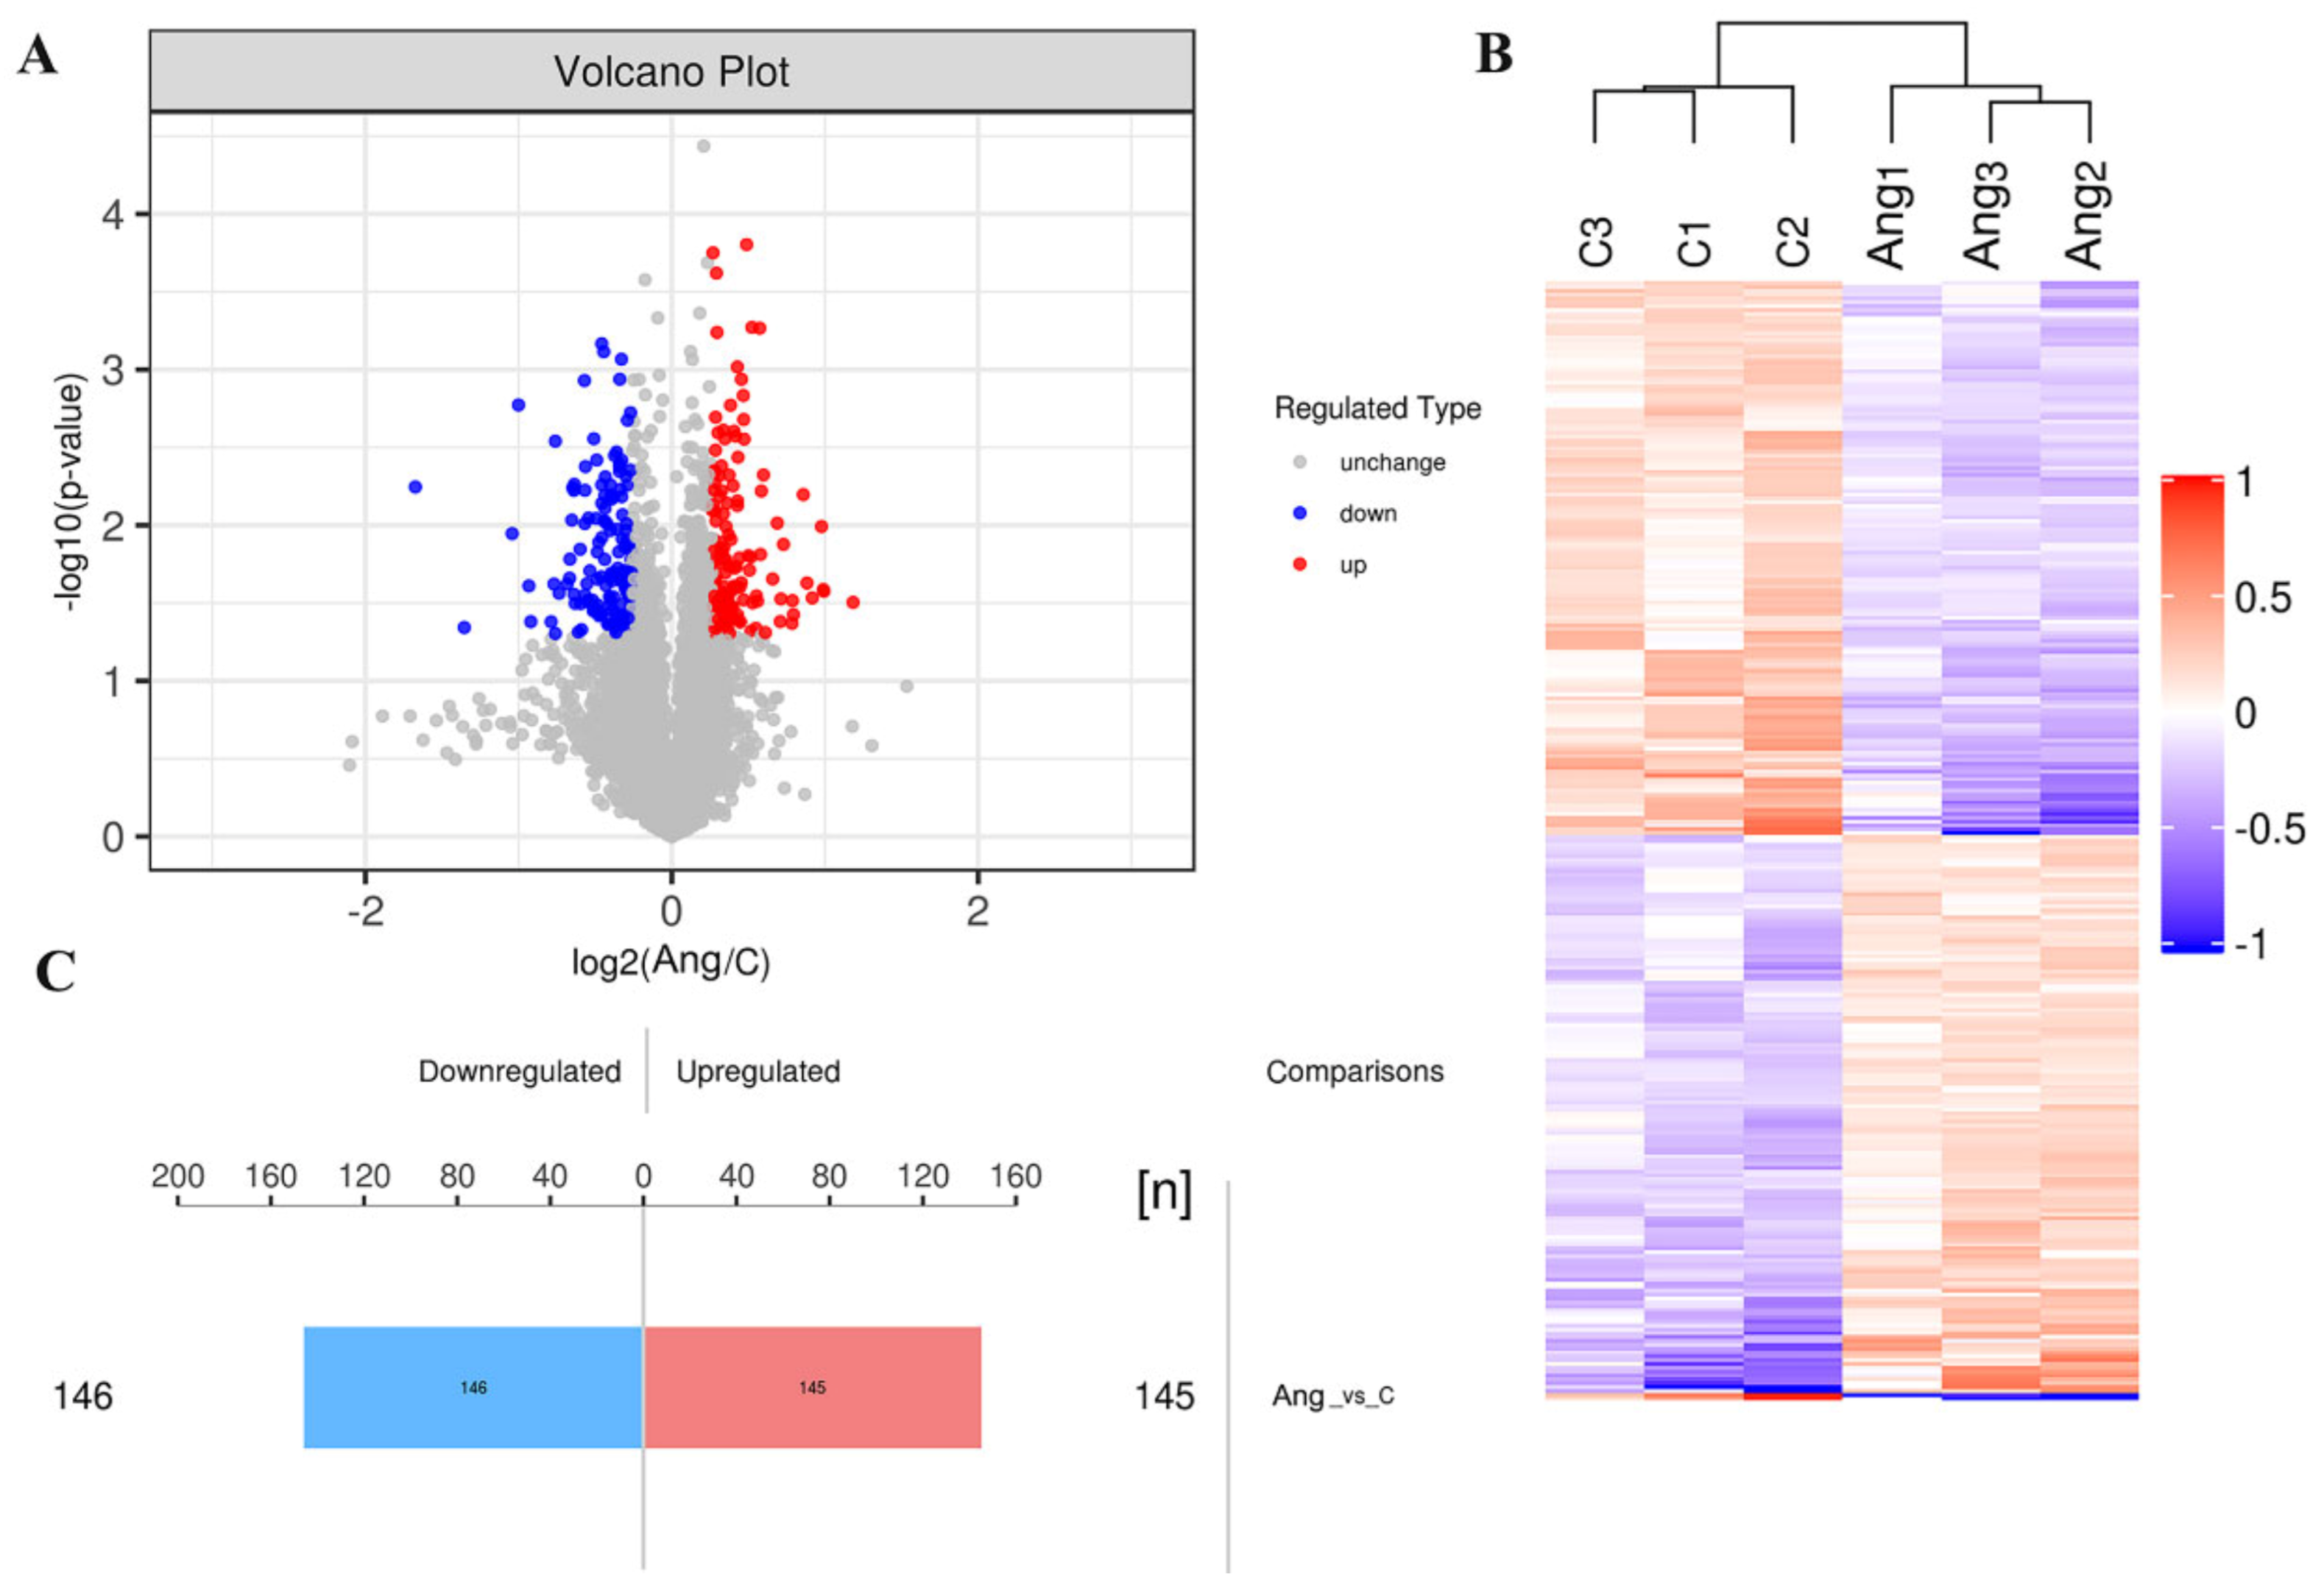
3.2. Molecular Changes during tPVAT Pathogenesis Analyzed by LC-MS/MS

To elucidate the molecular events occurring in tPVAT during Ang II infusion, a quantitative proteomic analysis, based on TMT labeling, was executed in the in vivo Ang II infusion model. A total of 30,079 peptide fragments, of which 27,160 were unique peptides corresponding to a total of 5037 proteins (Figure S1), were used. We received a good quality deviation during the data acquisition process using a high-quality Q Exactive mass spectrometer. The mass deviations of all the identified peptides were primarily distributed within 10 ppm, indicating that the identification results were accurate and reliable (Figure S2A). We obtained an ideal score with a median of 27.49, and more than 65.64% of the peptides scored higher than 20 when evaluating each MS2 spectrogram (Figure S2B). The protein ratio distribution of the saline and the Ang II-infused group are shown in Figure S2C. A 1.2-fold change cut-off, with a p-value < 0.05, was used to indicate significant changes in the abundance of the differentially expressed proteins (DEPs) between the saline and Ang II-infused groups.

3.3. Identification of DEPs

In our study, the changes in expression of the DEPs between the saline and Ang II-infused groups were determined using a volcano plot and K-means clustering heatmaps as shown in Figure 3A,B. A total of 291 proteins were found to be significantly differentially expressed between the two groups, of which 145 proteins were upregulated and 146 proteins were downregulated (Figure 3C), indicating a drastic phenotypic alteration of tPVAT during Ang II infusion, when compared with the saline-infused group. The abbreviated lists of the up- and down-regulated proteins are provided in Table 1 and Table 2. As demonstrated in Table 1, most of the top 10 up-regulated proteins have been shown to be involved in epigenetic modification, cell phenotype changes, and differentiation. These proteins include KDM1A, PKN1, and ENGase [18,19,20]. In addition, CtBP1 participates in BAT differentiation [21], and TMEM41B is a novel ER-localized regulator of lipid mobilization and lipid droplets [22]. Regarding the down-regulated proteins, as demonstrated in Table 2, many of the top 10 proteins have been shown to participate in lipid metabolism, brown adipogenesis, and various pathological processes, such as coronary heart disease (CHD) and robust adiposity [23,24,25,26,27,28].
In addition, in order to verify the results of the TMT proteomics, we selected the top 10 up- or down-regulated proteins for immunohistochemical analyses. Figure 4 shows that the expressions of KDM1A, PKN1, CtBP1, TMEM41B, PRTN3, GIGYF2, and ALCAM were significantly up-regulated, while that of CCN1, MBNL1, NHP2, RDH10, TIMD4, and TSN were significantly decreased after Ang II infusion. The immunohistochemical results confirmed the expression pattern observed in the quantitative proteomics analysis. Since there were no suitable antibodies for ENGase, RasGRF2, ABHD4, Pate4, Selenof, Reps1, and COQ10B, we did not perform immunohistochemical verification of these proteins.

3.4. Bioinformatics Analysis of the Altered Proteins during Ang II Infusion

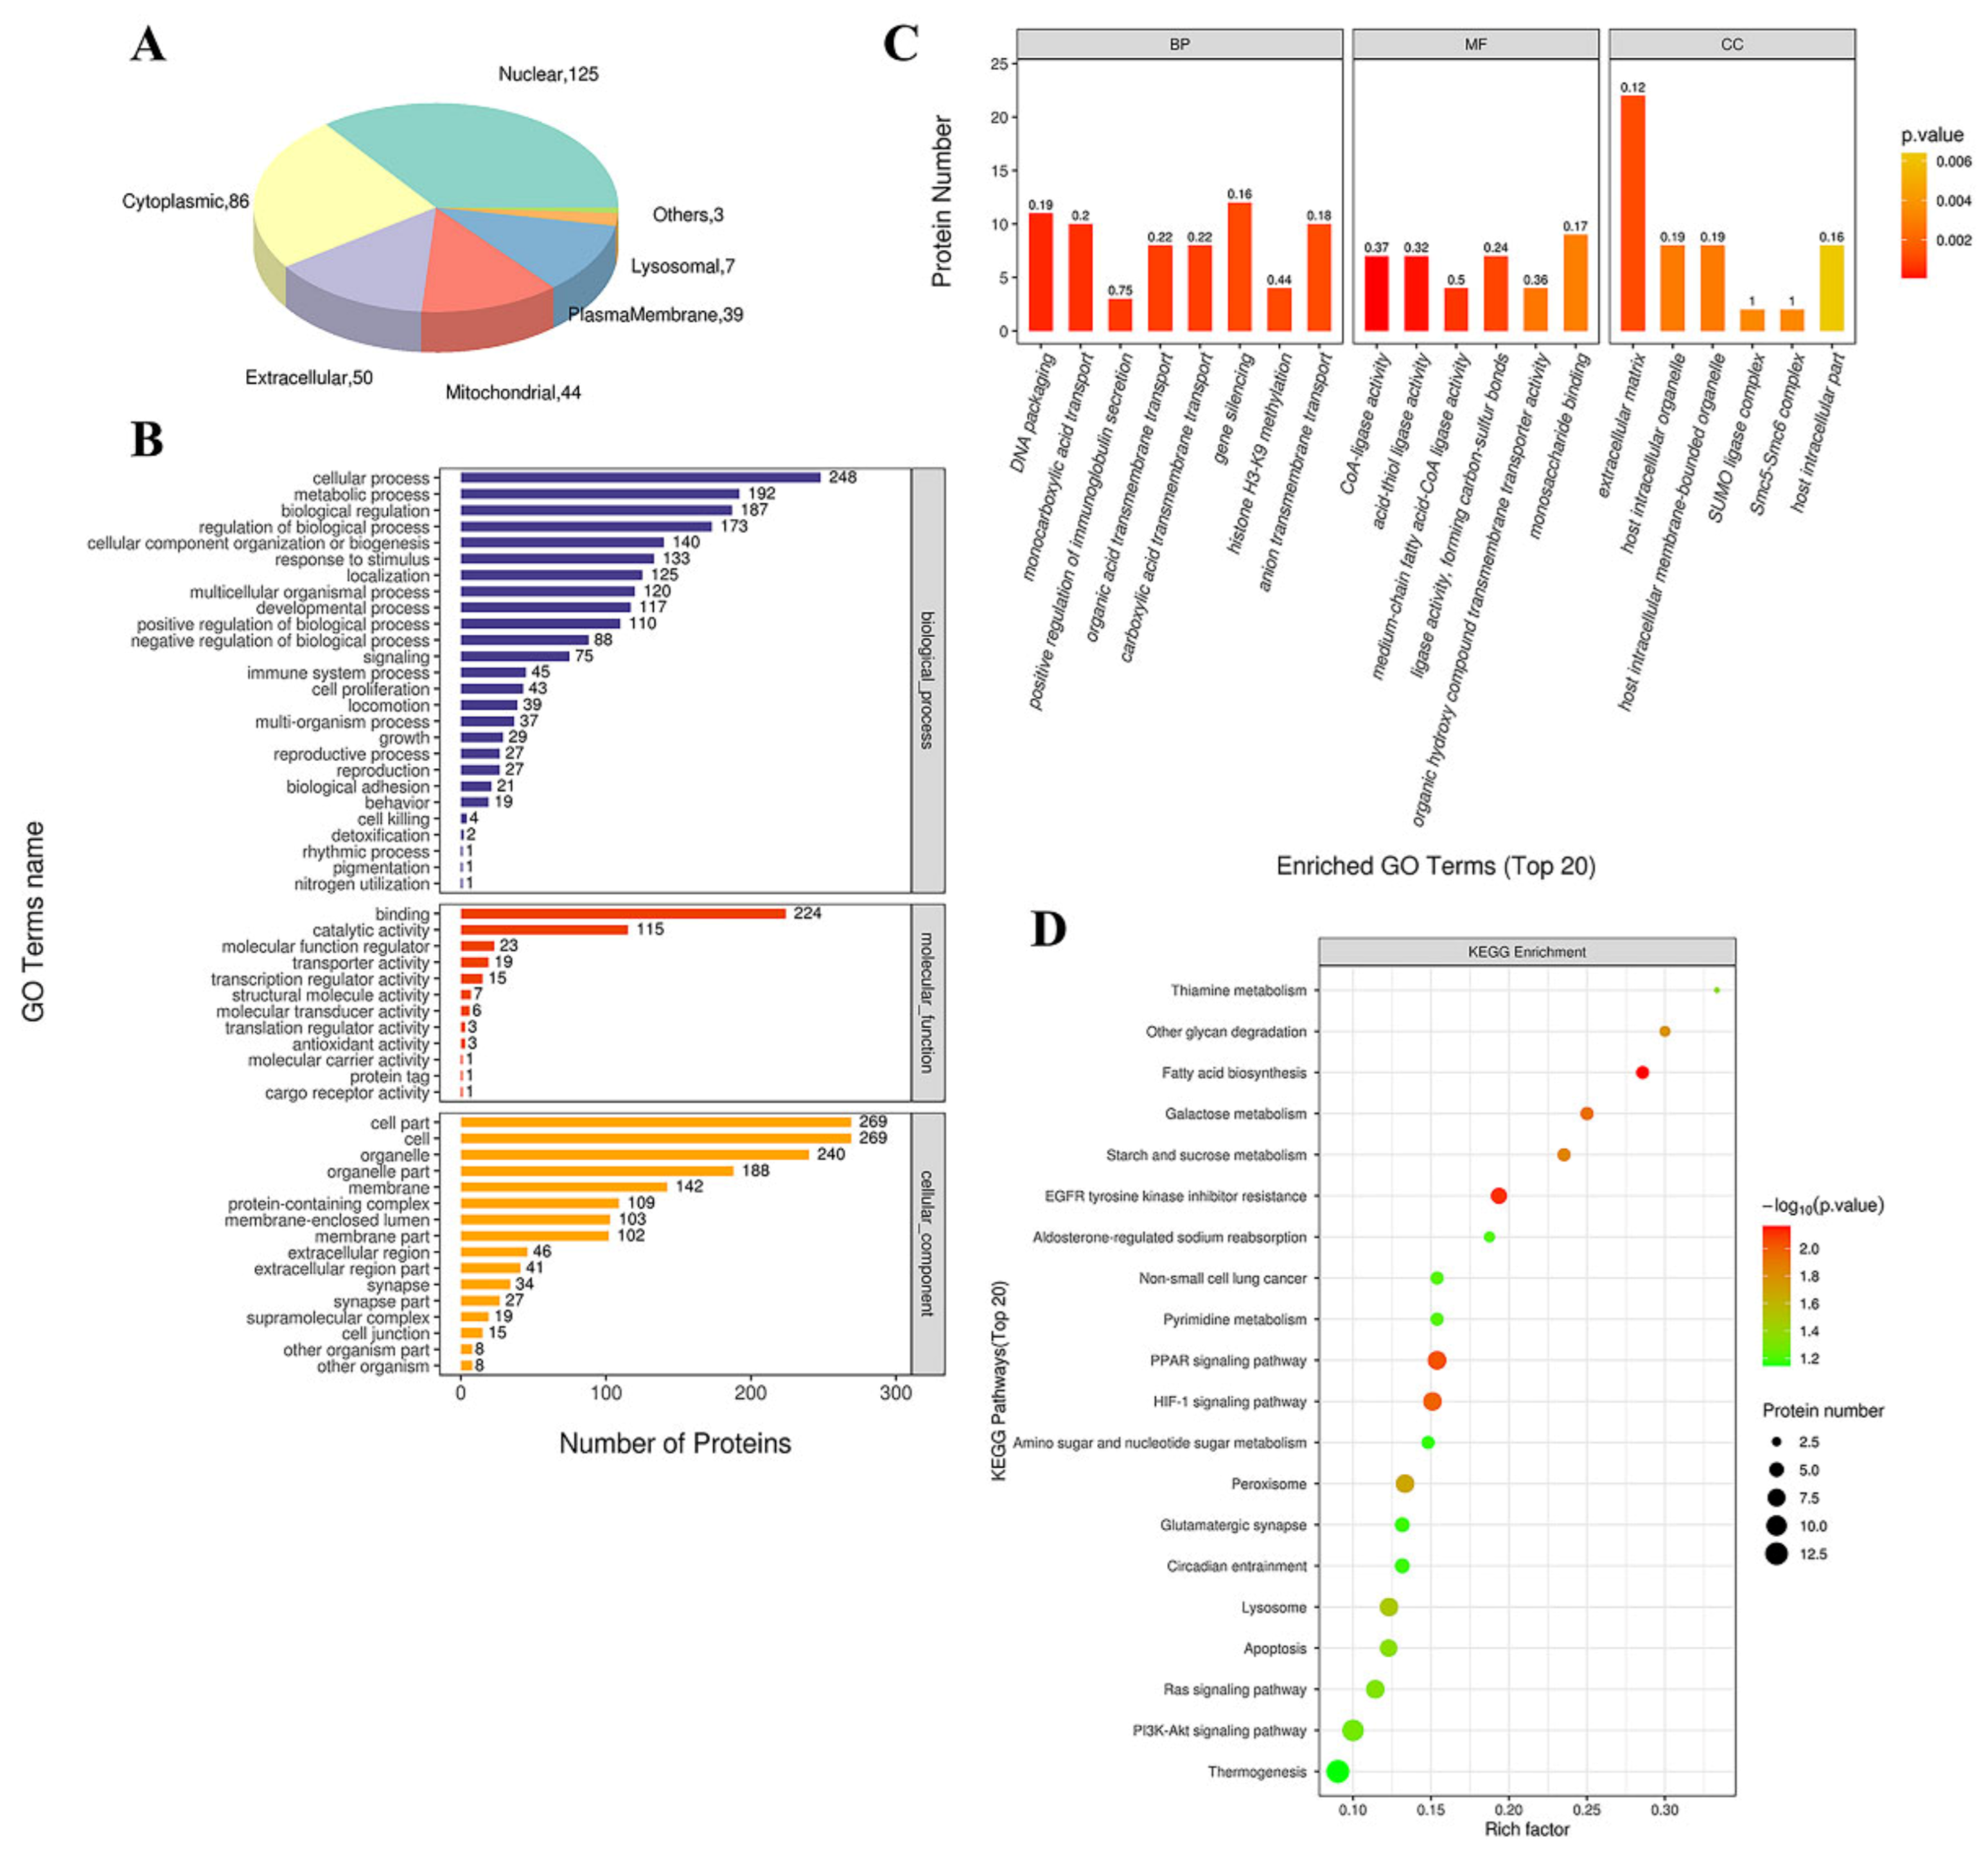
3.4.1. GO Functional Annotation and Analysis

We used the subcellular structure prediction software CELLO to analyze the subcellular location of all the DEPs. As shown in Figure 5A, most of the proteins were distributed in the nucleus, cytoplasm, extracellular matrix, and mitochondria. The DEPs were then analyzed against the GO database using three sets of ontologies: biological process (BP), molecular function (MF), and cellular component (CC). The most enriched GO terms of BP, MF, and CC were annotated as a gene silencing (12 proteins, richFactor = 0.16), monosaccharide binding (9 proteins, richFactor = 0.17), extracellular matrix (22 proteins, richFactor = 0.12), respectively (Figure 5B,C and Table 3). Other important BPs were included in DNA packaging, monocarboxylic acid transport, positive regulation of immunoglobulin secretion, organic acid transmembrane transport, carboxylic acid transmembrane transport, etc. (Figure 5C). Other important MFs included CoA-ligase activity, acid-thiol ligase activity, medium-chain fatty acid-CoA ligase activity, ligase activity, forming carbon-sulfur bonds, and organic hydroxy compound transmembrane transporter activity (Figure 5C). Other important CCs included host intracellular organelles, host intracellular membrane-bounded organelles, SUMO ligase complex, and Smc5–Smc6 complex (Figure 5C).

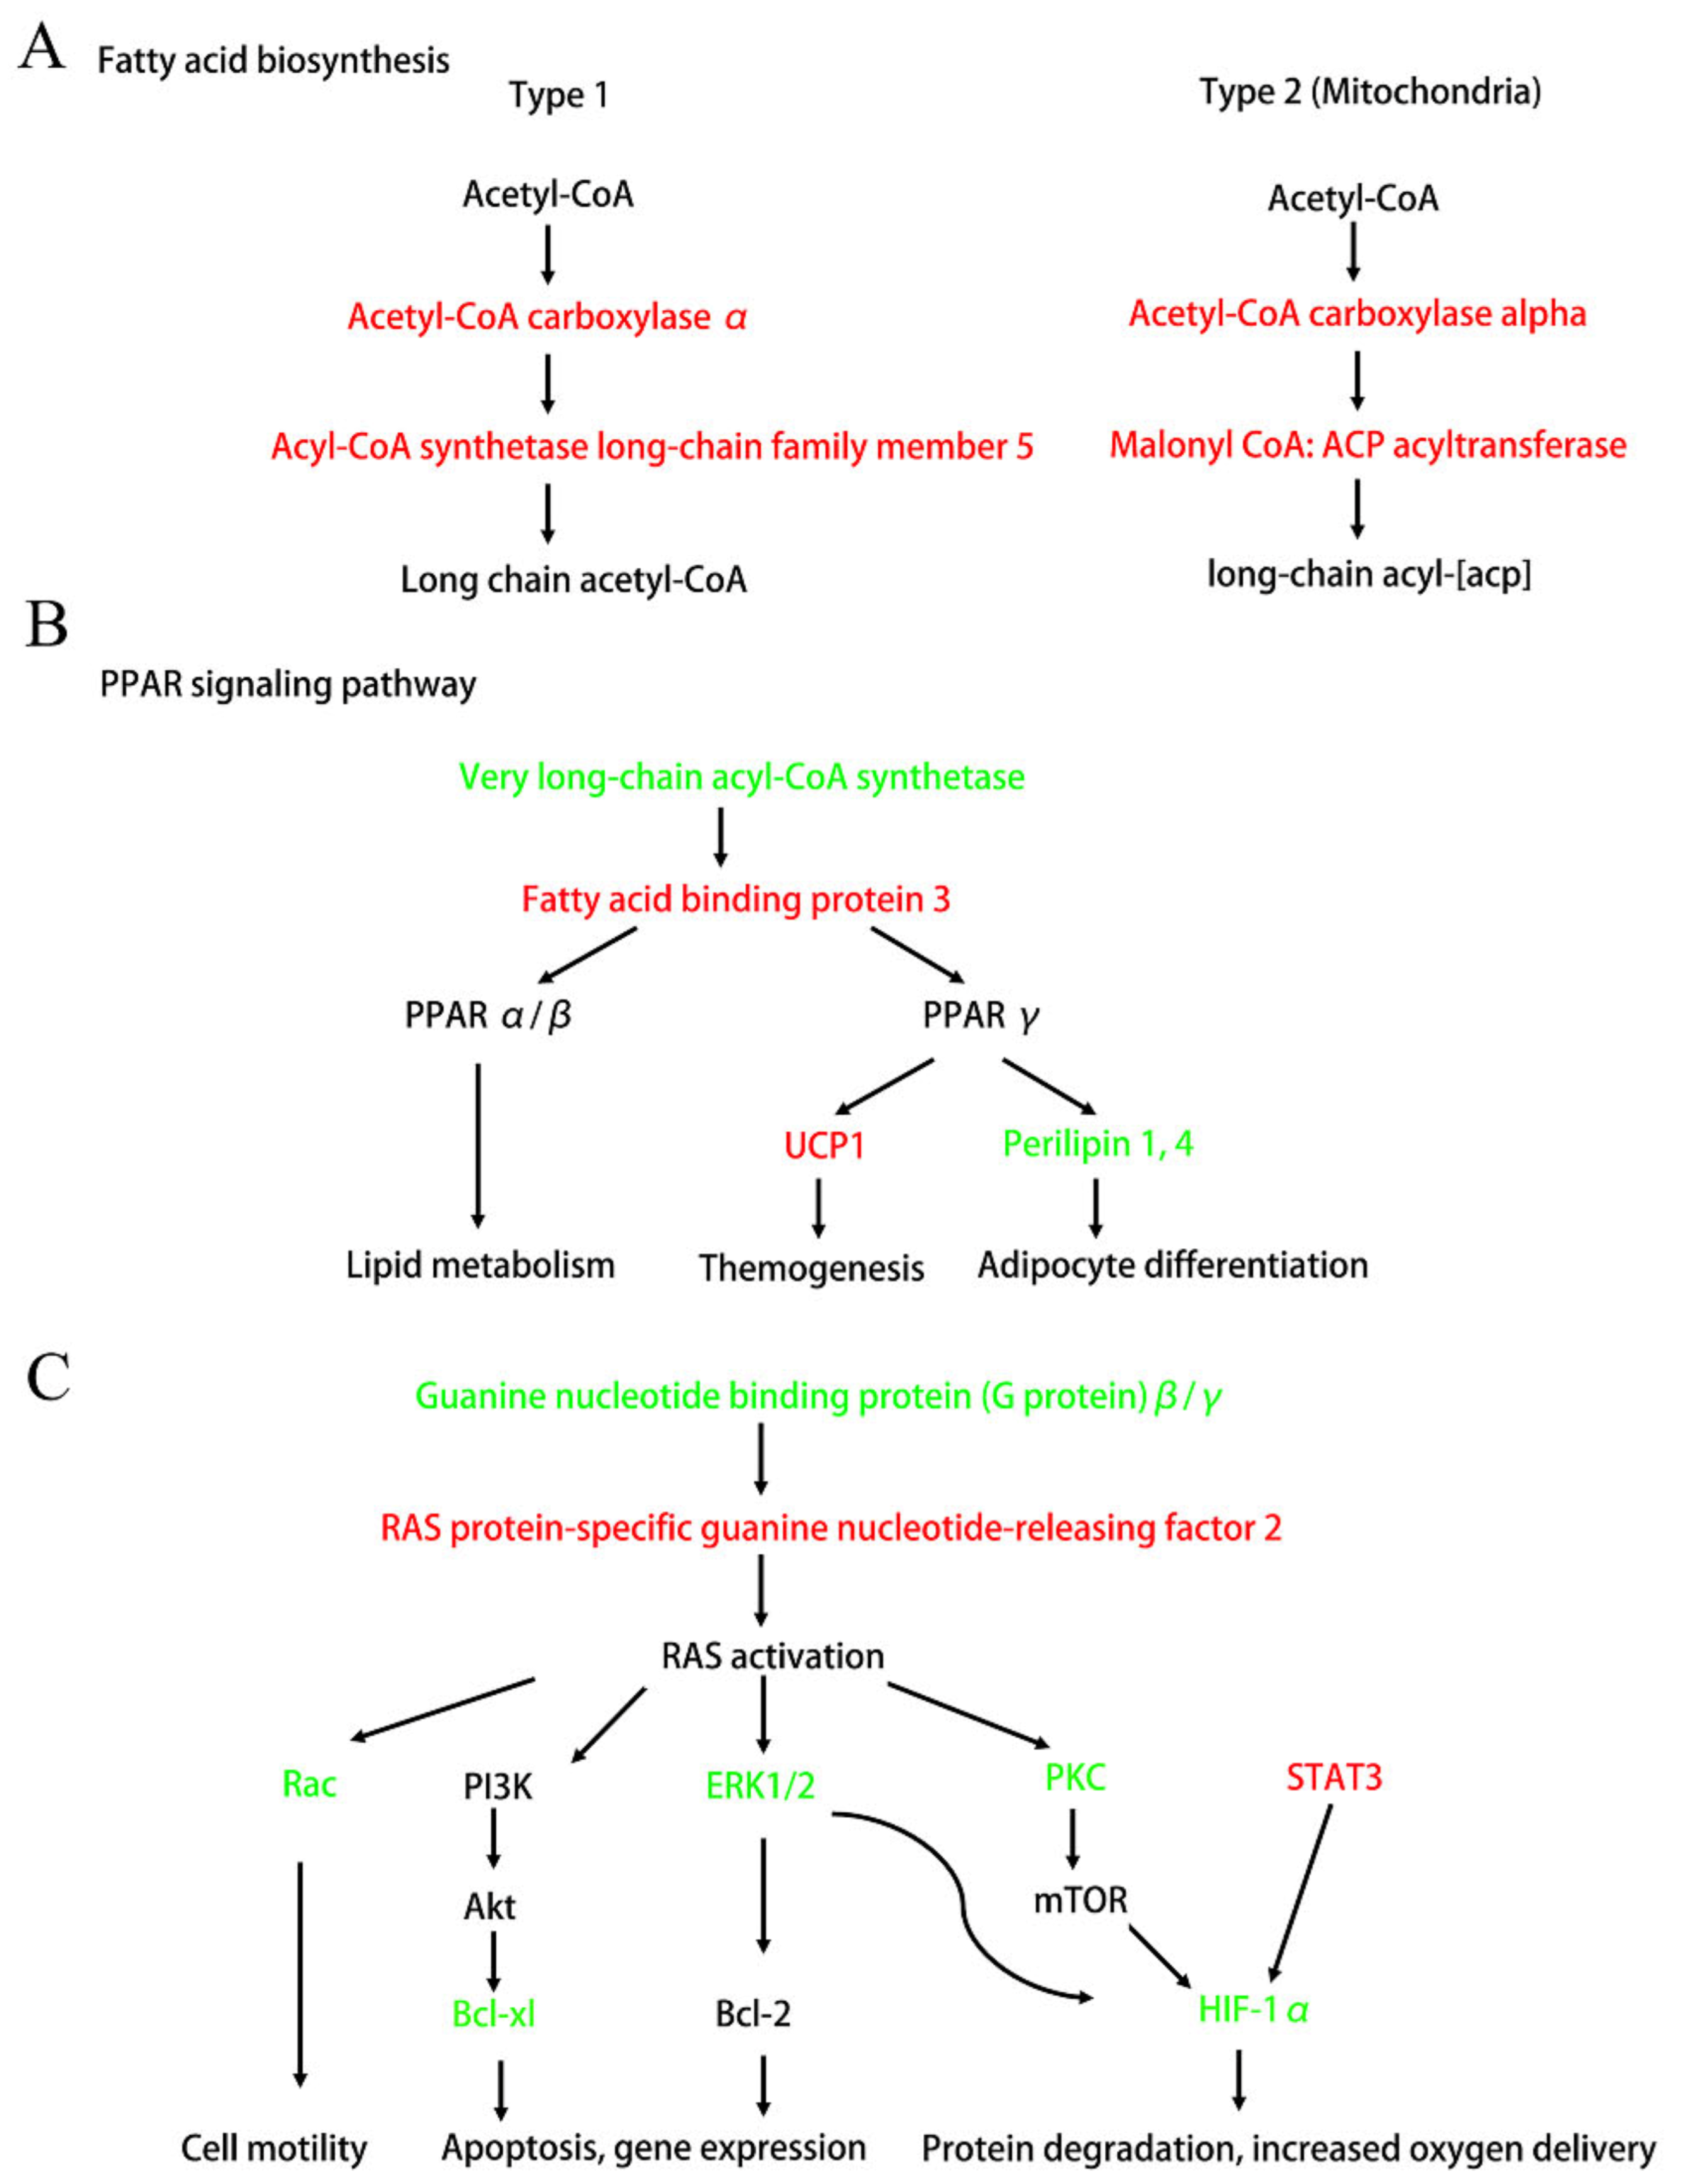
3.4.2. KEGG Pathway Analysis
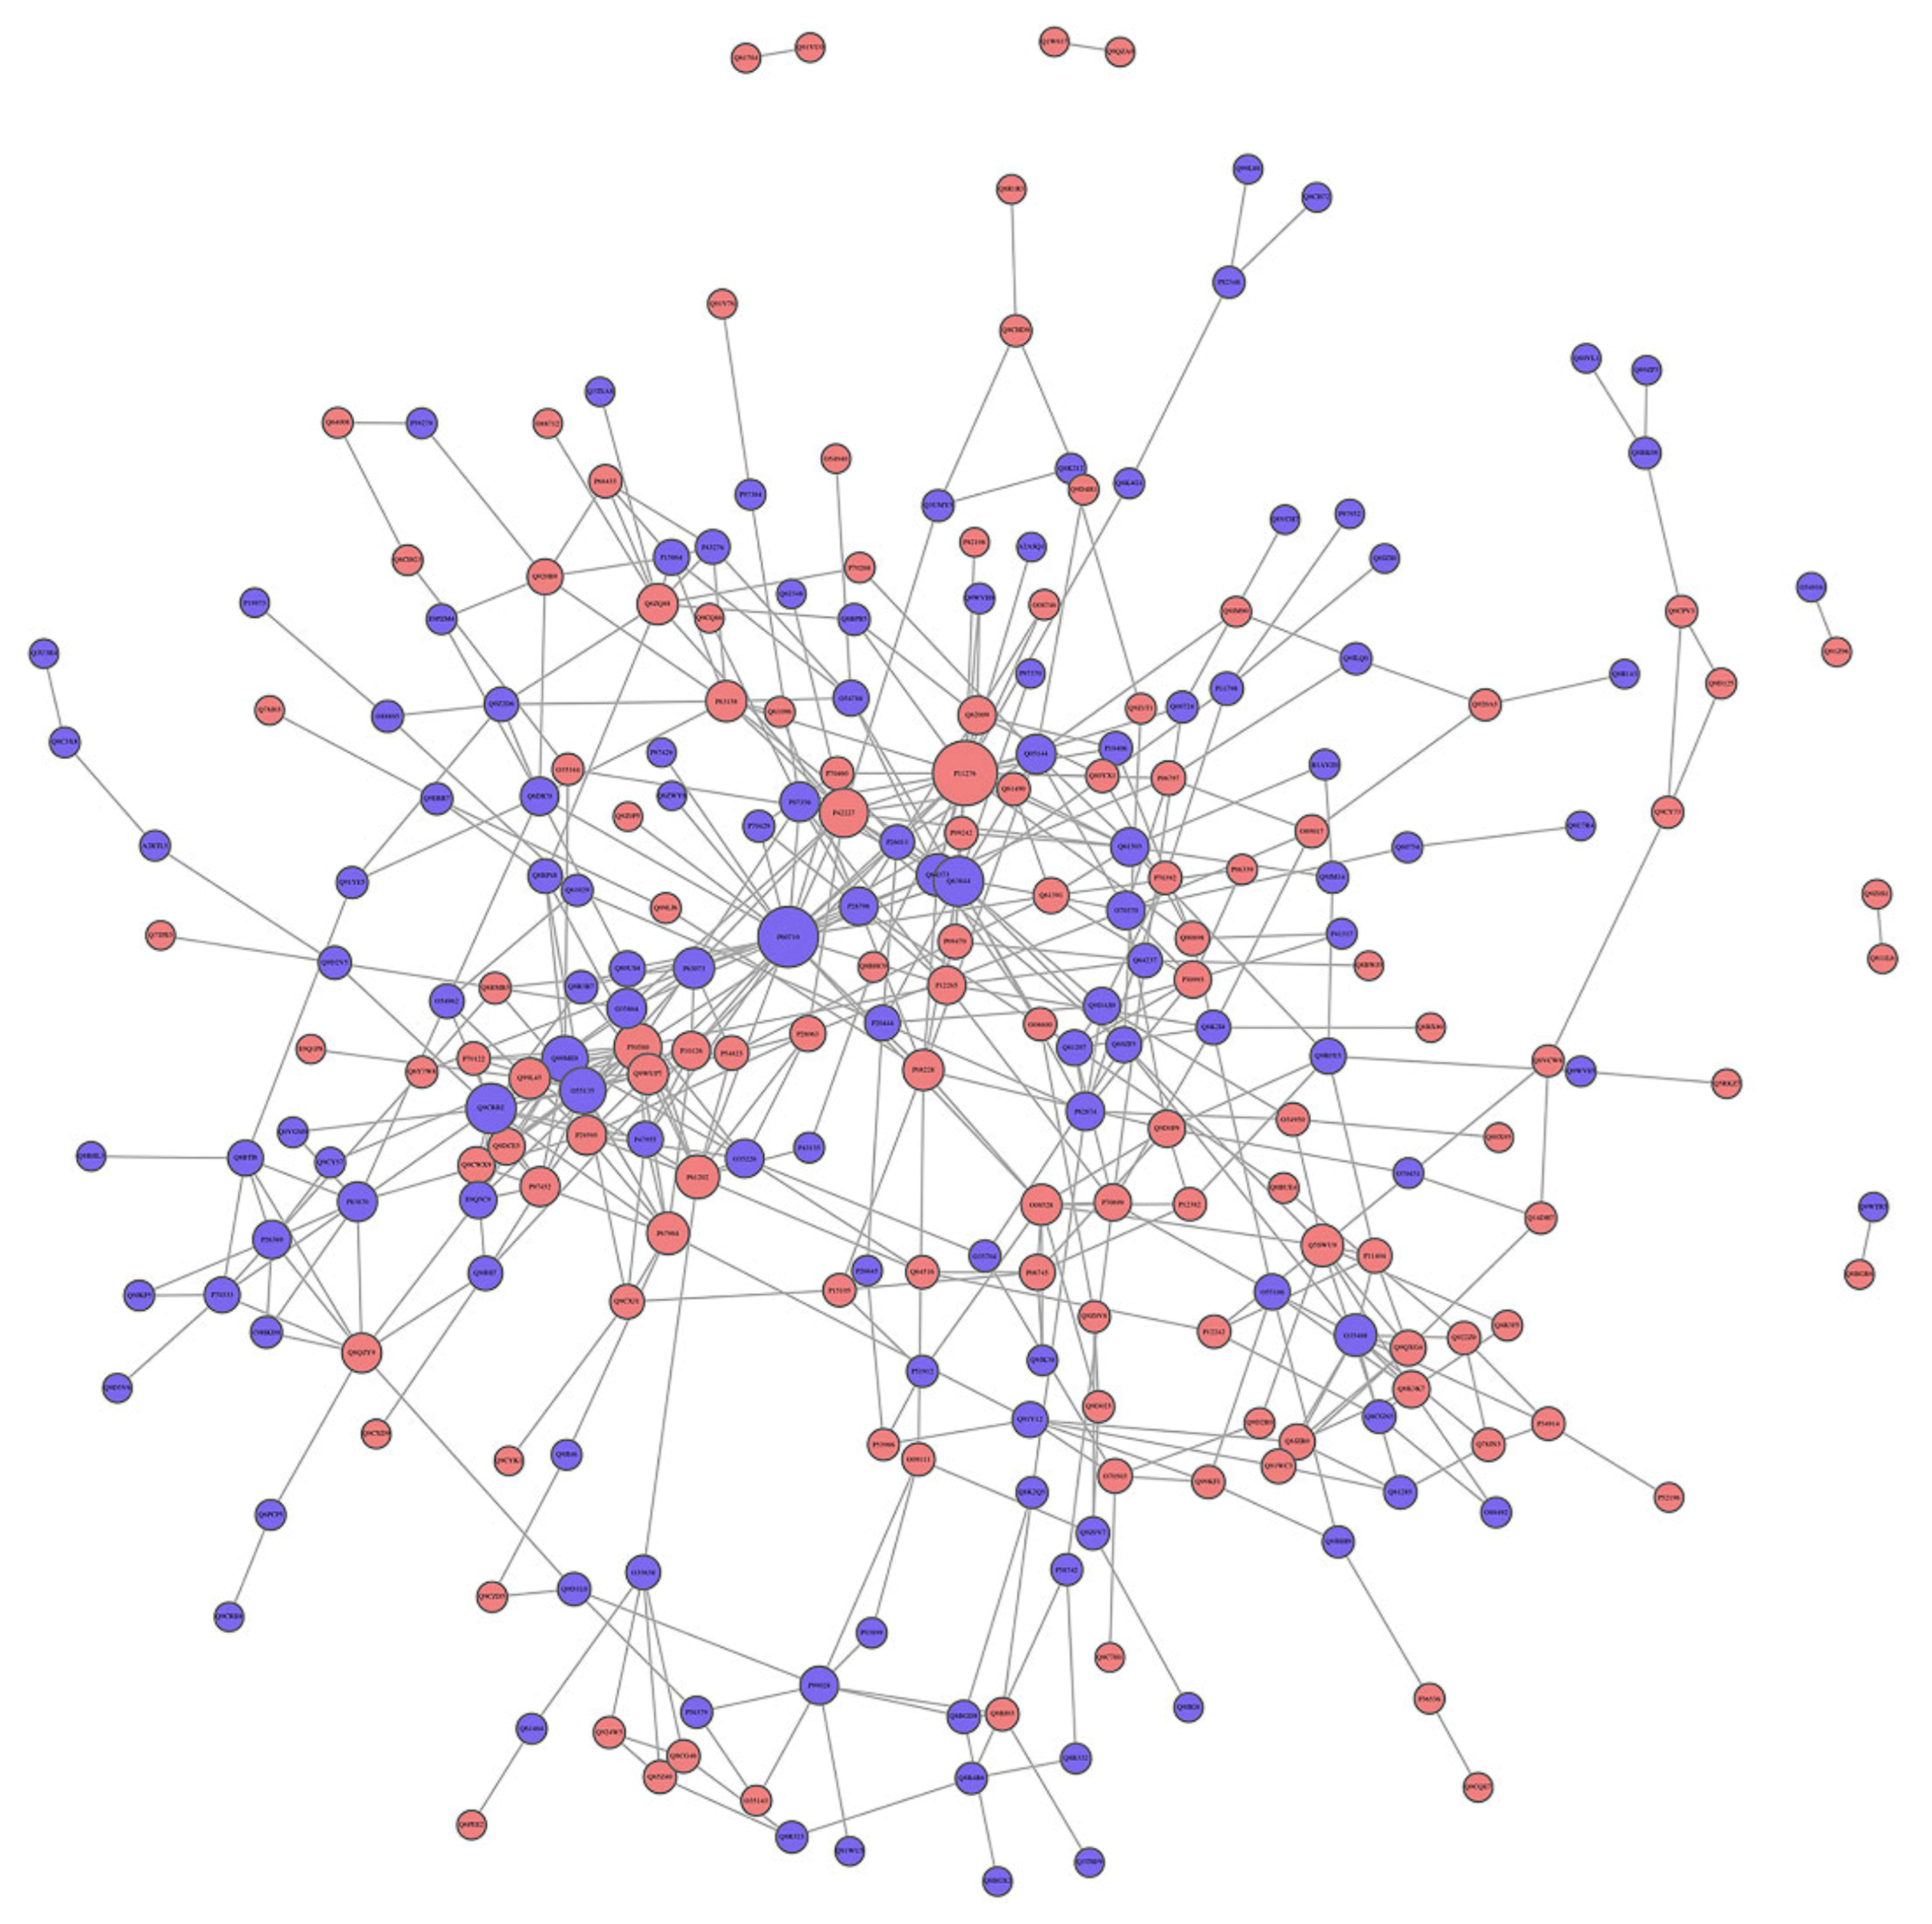
By searching the major biological pathways and relevant regulatory processes involved in the KEGG, we analyzed all of the DEPs in the saline and Ang II infusion groups. The results of the KEGG pathway analysis showed that the significant enrichment pathways included fatty acid (FA) biosynthesis (4 proteins, richFactor = 0.29), EGFR tyrosine kinase inhibitor resistance (6 proteins, richFactor = 0.19), PPAR signaling pathway (8 proteins, richFactor = 0.15), HIF-1 signaling pathway (8 proteins, richFactor = 0.15), galactose metabolism (4 proteins, richFactor = 0.25), starch and sucrose metabolism (4 proteins, richFactor = 0.24), other glycan degradation (3 proteins, richFactor = 0.30), peroxisome (8 proteins, richFactor = 0.13), lysosome (8 proteins, richFactor = 0.12), thiamine metabolism (2 proteins, richFactor = 0.33), apoptosis (7 proteins, richFactor = 0.12), and Ras signaling pathway (8 proteins, richFactor = 0.11) (Figure 5D and Table 3).
Next, we connected these significant enrichment pathways and found that Ang II infusion deeply affected the fat metabolism and adipocyte differentiation (Figure 6A,B). Figure 6A shows that the up-regulation of acetyl-CoA carboxylase α and acyl-CoA synthetase long-chain family member 5 significantly affected the synthesis of long-chain FAs. In addition, Figure 6B shows that Ang II infusion affected the PPAR signaling pathway by regulating very long-chain acyl-CoA synthase (ACSVL) and FA binding protein 3 (FABP3), and thereby affected lipid metabolism, thermogenesis, and adipocyte differentiation. Additionally, we also found that Ang II infusion could affect many downstream signaling pathways, such as Rac, PI3K/Akt, MAPK, and the HIF-1α pathways, by regulating the Ras signaling that, in turn, affected many cell functions and participated in pathogenesis (Figure 6C).

3.4.3. PPI Analysis

In the PPI network, there were 20 high-connectivity degree DEPs with a large circle and a degree value of more than 10 between the saline and Ang II groups (Figure 7). These high-connectivity DEPs were identified as fibronectin (P11276), actin (P60710), mitogen-activated protein kinase (MAPK) 3 (Q63844), H/ACA ribonucleoprotein complex subunit 2 (Q9CRB2), signal transducer and activator of transcription (STAT) 3 (P42227), proliferation-associated protein 2G4 (P50580), nucleolar GTP-binding protein 1 (Q99ME9), eukaryotic translation initiation factor 6 (O55135), COP9 signalosome complex subunit 2 (P61202), Bcl-2-like protein 1 (Q64373), ACSVL (O35488), acetyl-CoA carboxylase 1 (Q5SWU9), 60S ribosomal protein L22 (P67984), hexokinase-2 (O08528), superoxide dismutase [Cu-Zn] (P08228), eukaryotic translation initiation factor 4E (P63073), high mobility group protein B1 (P63158), eukaryotic translation initiation factor 2 subunit 2 (Q99L45), lysine-specific histone demethylase 1A (Q6ZQ88), and ubiquitin carboxyl-terminal hydrolase isozyme L5 (Q9WUP7) (Table 4). Some high-connectivity node proteins in Table 4 were related to the MAPK-Erk, STAT, FA biosynthesis, PPAR, and apoptosis signaling pathways, and these were highly consistent with those obtained using KEGG.

4. Discussion

PVAT is the connective tissue surrounding most of the systemic blood vessels and is now considered to be an important endocrine tissue that maintains the vascular homeostasis. Healthy PVAT has anti-contraction, anti-inflammation, and anti-oxidation effects [6]. According to the region of the vascular layer, where PVAT is located, PVAT shows phenotypic and functional heterogeneity [29]. For example, in the aorta of rodents, PVAT is primarily composed of WAT in the abdominal region, while PVAT is primarily composed of BAT in the thoracic region [30]. Angiotensinogen (AGT) was first found in BAT around the aorta in 1987 [31]. Evidence has demonstrated that the local renin-angiotensin system (RAS) may play an important role in adipocyte growth and differentiation [32]. However, the effect of pathological local RAS activation on the normal physiological function of PVAT is still unknown. Because Ang II is the primary component of RAS, we used the mice Ang II infusion model in the present study to simulate the pathological increase of local RAS at tPVAT. The results showed that Ang II infusion significantly increased the body weight and tPVAT weight of mice. In addition, the morphology of tPVAT also changed, and the distribution of tPVAT around the thoracic aorta appeared uneven (Figure 2A–D). To further verify the influence of Ang II infusion on the structure of tPVAT, we performed H&E staining on tPVAT tissue. The result showed that Ang II significantly changed the diameter and size of adipocytes in tPVAT (Figure 2E). These results indicate that the pathological activation of local RAS may greatly change the structure and function of tPVAT, and thereby affect vascular function.
To further clarify the molecular mechanisms of tPVAT structural changes caused by Ang II infusion, TMT label-based nanoscale LC–MS/MS was used in the present study. We identified a number of novel proteins associated with Ang II infusion and extended our understanding of this process. A total of 291 with significantly differential expression (145 up-regulation and 146 down-regulation) were identified in three biological replicates, and the hierarchical cluster analysis showed that these proteins were wel-distinguished. This indicated that the overall protein screening had reasonable accuracy. Additionally, we selected the top 10 differential expressed proteins with appropriate antibodies for immunohistochemical verification, and the data showed trends that paralleled those observed in the TMT results (Figure 4). To our knowledge, this is the first and most comprehensive large-scale proteomic profiling of Ang II-infused tPVAT, and the data will facilitate future studies of pathological tPVAT after the local activation of RAS.
The GO enrichment results indicated that the most enriched BP, MF, and CC categories after Ang II infusion were gene silencing (up regulation: CtBP1, KDM1A, GIGYF2, MRPL44, STAT3, H3C1; down regulation: BAZ2A, MECP2, TDRKH, H1-2, H1.5, eIF6), monosaccharide binding (up regulation: HK2, P4HA1, OGFOD3, PFKL, GPI; down regulation: Mbl2, MANBA, DBH, GNPNAT1), and extracellular matrix (up regulation: FN1, POSTN, CTSL, TNC, MATN2, TGFBI, ITIH3, SRPX2, HSD17B12, ALPL, LRRc17; down regulation: ANXA2, FBLN5, ANXA4, LTBP-4, ANXA11, AGRN, MFAP1a, Mbl2, EFEMP1, CCN1, Marco), respectively. We found that the genes in gene silencing, such as CtBP1, KDM1A, MECP2, STAT3, eIF6, were involved in regulating adipocyte inflammatory, differentiation, reconstruction, oxidation, and metabolism [21,33,34,35,36,37,38]. In addition, a large number of extracellular matrix components and regulatory proteins have changed after Ang II infusion, and these may participate in regulating cell proliferation, migration, and other phenotypic transformations.
As highlighted by the KEGG analysis, the most important networks, after Ang II infusion, were related to FA biosynthesis, PPAR signaling, Ras signaling, MAPK-Erk pathway, STAT3, and the HIF-1α pathway (Figure 6). Although it has been reported that Ang II induces adipocyte dysfunction, the mechanisms of this action are not very clear [39]. Our current study found that Ang II affected the synthesis of long-chain FAs, by up-regulating acyl-CoA carboxylase α and down-regulating ACSVL (Figure 6A,B). Additionally, these two FA synthesis-related enzymes had a high connectivity degree in the PPI analysis (Figure 7, Table 4) and could serve as possible novel molecular targets for Ang II action. Furthermore, Ang II affected the PPARγ signaling by up-regulating FABP3, which, in turn, promoted UCP1 and suppressed perilipin1, 4 expressions (Figure 6B). FABP3 is one of the members of the lipid-binding proteins superfamily. It is both membrane-bound, aiding cellular long-chain FA uptake, and cytoplasmic, being crucial to intracellular transport of FAs to sites of metabolic conversion [40]. It has been reported that the FABP3-PPARα axis has an indispensable role in Ang II-induced cardiac hypertrophy and heart failure [41]. Therefore, we speculate that the FABP3-PPARα axis also plays an important role in Ang II-induced tPVAT pathogenesis. In addition, Ang II promoted UCP1 and inhibited perilipin 4 expressions (Figure 6B). UCP1 primarily exists in BAT and is a mitochondrial protein embedded in the inner membrane of mitochondria, and it can dissipate the energy stored in mitochondrial electrochemical gradient as heat and “decouple” from ATP synthesis [42]. The thermogenesis of BAT and the energy steady state of the system depend entirely on the action of UCP1, and UCP1 up-regulation indicates adipocyte browning [43,44]. Therefore, the pathological increase of Ang II in this study may affect tPVAT thermometabolism and preadipocyte browning by up-regulating UCP1, which in turn affects vascular function. Perilipin proteins were discovered in the adipocyte, where they regulate lipid storage and lipolysis and are considered direct PPARγ targets [45,46]. Perilipin 1 appears to be a highly specific marker for adipocytic differentiation [47]. Perilipin 4 participates in the formation of lipid droplets and is an adipocyte regulator of triglyceride synthesis and packaging [48]. In the current study, Ang II may regulate the differentiation and function of adipocytes at mice tPVAT by down-regulating perilipin 1 and 4. In brief, the present study suggests that UCP1 and perilipin may be new targets of Ang II infusion, allowing Ang II to directly participate in the regulation of lipid metabolism, transportation, and adipocyte differentiation.
The Ras-ERK pathway is largely known for its regulation of cell proliferation, differentiation, survival, and drug-mediated behaviors. A recent study found that RasGRF2 (RAS protein-specific guanine nucleotide-releasing factor 2) mediates cocaine self-administration (SA) in mice via an ERK-dependent mechanism [49]. Our study discovered that RasGRF2 was up-regulated after Ang II infusion and could serve as a novel target for Ang II action, and the RasGRF2-Ras-ERK signal axis may play an important role in Ang II-mediated tPVAT pathogenesis. In addition, hypoxia inducible factor 1α (HIF-1α) has been reported to participate in the Ang II-mediated inflammatory response process [50], cardiomyocyte hypertrophy [51], preautonomic neurons activation [52], and vascular remodeling [53]. Our study showed a decreased expression level of HIF-1α after Ang II infusion and indicated that HIF-1α may be also a novel biomarker for Ang II-mediated tPVAT pathogenesis. In addition, RasGRF2-ERK-HIF-1α, RasGRF2-PKC-HIF-1α, and the STAT3-HIF-1α axis may be three important pathways at tPVAT with locally pathological activation of RAS, which can be further studied by subsequent researchers. A recent report showed that STAT3/HIF-1α signaling participates in peritoneal fibrosis during long-term peritoneal dialysis (PD) treatment [54]. Our results indicated an increased expression of STAT3 after Ang II infusion, and STAT3 had a high connectivity degree in the PPI analysis (Figure 6C and Table 4). Thus, STAT3 signaling may play an important role in Ang II-mediated phenotypic changes of tPVAT.
In conclusion, the present quantitative proteomic study provided the most comprehensive proteome profiles of mice tPVAT and a list of DEPs between saline-infused and Ang II-infused tPVAT. The bioinformatics analyses found that the functions of these altered proteins were primarily concentrated in gene silencing and the extracellular matrix. More importantly, the present study provided novel molecular targets of Ang II, such as acyl-CoA carboxylase α, ACSVL, UCP1, perilipin, and RasGRF2, as well as important signaling pathways, such as FA biosynthesis, FABP3-PPARα/γ, RasGRF2-ERK-HIF-1α, RasGRF2-PKC-HIF-1α, and STAT3-HIF-1α, during Ang II-induced tPVAT pathogenesis. The data provided here will promote our understanding of the effects of local RAS activation on PVAT and vascular function.

Supplementary Materials

The following are available online at https://www.mdpi.com/article/10.3390/biomedicines9121820/s1. Supplementary figure legends, Figure S1: statistical histogram of protein identification and quantitative results; Figure S2: quality control of peptides; Figure S3: diagram of the fatty acid biosynthesis; Figure S4: diagram of PPAR signaling pathway; Figure S5: diagram of Ras signaling pathway; Figure S6: diagram of HIF-1 signaling pathway; Figure S7: diagram of apoptosis pathway; Table S1: parameters and instructions of MASCOT engine search. Table S2: Quantitative analysis of all differentially expressed proteins.

Author Contributions

Conceptualization, W.Y.; methodology, X.L. and H.G.; software, J.S.; validation, Y.Q. and X.L.; formal analysis, J.S.; investigation, X.L. and H.G.; resources, H.G.; data curation, H.G.; writing—original draft preparation, X.L.; writing review and editing, W.Y.; visualization, H.G.; supervision, W.Y.; project administration, W.Y.; funding acquisition, W.Y. The authors declare that all data were generated in-house and that no paper mill was used. All authors have read and agreed to the published version of the manuscript.

Funding

This work was supported by a grant from the National Natural Sciences Foundation of China (81970226), Key University Science Research Project of Jiangsu Province (19KJA320010).

Institutional Review Board Statement

Male C57BL/6 mice were used as experimental animals. The breeding, maintenance, and feeding of these mice, as well as food and water consumption and weight monitoring, were all carried out in the Laboratory Animal Center, School of Pharmacy, Nantong University. All of the procedures were approved by the Animal Care and Use Committee of Nantong University (Ethic Committee approval number: 1213201.1) and conformed to the NIH Guide for the Care and Use of Laboratory Animals.

Informed Consent Statement

Not applicable.

Data Availability Statement

The data presented in this study are available upon request from the corresponding author.

Conflicts of Interest

The authors declare no conflict of interest.

References

  1. Bourmoum, M.; Charles, R.; Claing, A. The GTPase ARF6 controls ROS production to mediate angiotensin II-induced vascular smooth muscle cell proliferation. PLoS ONE 2016, 11, e0148097. [Google Scholar] [CrossRef] [PubMed]
  2. Nour-Eldine, W.; Ghantous, C.M.; Zibara, K.; Dib, L.; Issaa, H.; Itani, H.A.; El-Zein, N.; Zeidan, A. Adiponectin attenuates angiotensin II-induced vascular smooth muscle cell remodeling through nitric oxide and the RhoA/ROCK pathway. Front. Pharmacol. 2016, 7, 86. [Google Scholar] [CrossRef] [PubMed] [Green Version]
  3. Dai, F.; Qi, Y.; Guan, W.; Meng, G.; Liu, Z.; Zhang, T.; Yao, W. RhoGDI stability is regulated by SUMOylation and ubiquitination via the AT1 receptor and participates in Ang II-induced smooth muscle proliferation and vascular remodeling. Atherosclerosis 2019, 288, 124–136. [Google Scholar] [CrossRef] [PubMed]
  4. Siegel-Axel, D.I.; Häring, H.U. Perivascular adipose tissue: An unique fat compartment relevant for the cardiometabolic syndrome. Rev. Endocr. Metab. Disord. 2016, 17, 51–60. [Google Scholar] [CrossRef]
  5. Fernández-Alfonso, M.S.; Gil-Ortega, M.; Aranguez, I.; Souza, D.; Dreifaldt, M.; Somoza, B.; Dashwood, M.R. Role of PVAT in coronary atherosclerosis and vein graft patency: Friend or foe? Br. J. Pharmacol. 2017, 174, 3561–3572. [Google Scholar] [CrossRef] [Green Version]
  6. Qi, X.Y.; Qu, S.L.; Xiong, W.H.; Rom, O.; Chang, L.; Jiang, Z.S. Perivascular adipose tissue (PVAT) in atherosclerosis: A double-edged sword. Cardiovasc. Diabetol. 2018, 17, 134. [Google Scholar] [CrossRef] [Green Version]
  7. Langin, D.; Arner, P. Importance of TNF alpha and neutral lipases in human adipose tissue lipolysis. Trends. Endocrinol. Metab. 2006, 17, 314–320. [Google Scholar] [CrossRef]
  8. Cao, H. Adipocytokines in obesity and metabolic disease. J. Endocrinol. 2014, 220, T47–T59. [Google Scholar] [CrossRef] [Green Version]
  9. Cannon, B.; Nedergaard, J. Brown adipose tissue: Function and physiological significance. Physiol. Rev. 2004, 84, 277–359. [Google Scholar] [CrossRef]
  10. Kern, P.A.; Finlin, B.S.; Zhu, B.; Rasouli, N.; McGehee, R.E., Jr.; Westgate, P.M.; Dupont-Versteegden, E.E. The effects of temperature and seasons on subcutaneous white adipose tissue in humans: Evidence for thermogenic gene induction. J. Clin. Endocrinol. Metab. 2014, 99, E2772–E2779. [Google Scholar] [CrossRef]
  11. Lin, J.Z.; Martagón, A.J.; Cimini, S.L.; Gonzalez, D.D.; Tinkey, D.W.; Biter, A.; Baxter, J.D.; Webb, P.; Gustafsson, J.Å.; Hartig, S.M.; et al. Pharmacological activation of thyroid hormone receptors elicits a functional conversion of white to brown fat. Cell. Rep. 2015, 13, 1528–1537. [Google Scholar] [CrossRef] [Green Version]
  12. Wu, J.; Boström, P.; Sparks, L.M.; Ye, L.; Choi, J.H.; Giang, A.H.; Khandekar, M.; Virtanen, K.A.; Nuutila, P.; Schaart, G.; et al. Beige adipocytes are a distinct type of thermogenic fat cell in mouse and human. Cell 2012, 150, 366–376. [Google Scholar] [CrossRef] [Green Version]
  13. Uysal, K.T.; Wiesbrock, S.M.; Marino, M.W.; Hotamisligil, G.S. Protection from obesity-induced insulin resistance in mice lacking TNF-alpha function. Nature 1997, 389, 610–614. [Google Scholar] [CrossRef]
  14. Janke, J.; Engeli, S.; Gorzelniak, K.; Luft, F.C.; Sharma, A.M. Mature adipocytes inhibit in vitro differentiation of human preadipocytes via angiotensin type 1 receptors. Diabetes 2002, 51, 1699–1707. [Google Scholar] [CrossRef] [Green Version]
  15. Than, A.; Leow, M.K.; Chen, P. Control of adipogenesis by the autocrine interplays between angiotensin 1-7/Mas receptor and angiotensin II/AT1 receptor signaling pathways. J. Biol. Chem. 2013, 288, 15520–15531. [Google Scholar] [CrossRef] [Green Version]
  16. Sysoeva, V.Y.; Ageeva, L.V.; Tyurin-Kuzmin, P.A.; Sharonov, G.V.; Dyikanov, D.T.; Kalinina, N.I.; Tkachuk, V.A. Local angiotensin II promotes adipogenic differentiation of human adipose tissue mesenchymal stem cells through type 2 angiotensin receptor. Stem. Cell. Res. 2017, 25, 115–122. [Google Scholar] [CrossRef]
  17. Wiśniewski, J.R.; Zougman, A.; Nagaraj, N.; Mann, M. Universal sample preparation method for proteome analysis. Nat. Methods 2009, 6, 359–362. [Google Scholar] [CrossRef]
  18. Francois, A.A.; Obasanjo-Blackshire, K.; Clark, J.E.; Boguslavskyi, A.; Holt, M.R.; Parker, P.J.; Marber, M.S.; Heads, R.J. Loss of Protein Kinase Novel 1 (PKN1) is associated with mild systolic and diastolic contractile dysfunction, increased phospholamban Thr17 phosphorylation, and exacerbated ischaemia-reperfusion injury. Cardiovasc. Res. 2018, 114, 138–157. [Google Scholar] [CrossRef] [Green Version]
  19. Fang, Y.; Liao, G.; Yu, B. LSD1/KDM1A inhibitors in clinical trials: Advances and prospects. J. Hematol. Oncol. 2019, 12, 129. [Google Scholar] [CrossRef] [Green Version]
  20. Fairbanks, A.J. Chemoenzymatic synthesis of glycoproteins. Curr. Opin. Chem. Biol. 2019, 53, 9–15. [Google Scholar] [CrossRef]
  21. Farmer, S.R. Molecular determinants of brown adipocyte formation and function. Genes. Dev. 2008, 22, 1269–1275. [Google Scholar] [CrossRef] [PubMed] [Green Version]
  22. Moretti, F.; Bergman, P.; Dodgson, S.; Marcellin, D.; Claerr, I.; Goodwin, J.M.; DeJesus, R.; Kang, Z.; Antczak, C.; Begue, D.; et al. TMEM41B is a novel regulator of autophagy and lipid mobilization. EMBO. Rep. 2018, 19, e45889. [Google Scholar] [CrossRef] [PubMed]
  23. Kim, K.H.; Won, J.H.; Cheng, N.; Lau, L.F. The matricellular protein CCN1 in tissue injury repair. J. Cell. Commun. Signal. 2018, 12, 273–279. [Google Scholar] [CrossRef] [PubMed] [Green Version]
  24. Ren, B.; Liu, M.; Ni, J.; Tian, J. Role of selenoprotein f in protein folding and secretion: Potential involvement in human disease. Nutrients 2018, 10, 1619. [Google Scholar] [CrossRef] [PubMed] [Green Version]
  25. Zhang, Q.H.; Yin, R.X.; Chen, W.X.; Cao, X.L.; Chen, Y.M. Association between the TIMD4-HAVCR1 variants and serum lipid levels, coronary heart disease and ischemic stroke risk and atorvastatin lipid-lowering efficacy. Biosci. Rep. 2018, 38, BSR20171058. [Google Scholar] [CrossRef] [PubMed] [Green Version]
  26. Fu, X.; Shah, A.P.; Li, Z.; Li, M.; Tamashiro, K.L.; Baraban, J.M. Genetic inactivation of the translin/trax microRNA-degrading enzyme phenocopies the robust adiposity induced by Translin (Tsn) deletion. Mol. Metab. 2020, 40, 101013. [Google Scholar] [CrossRef] [PubMed]
  27. Hung, C.S.; Lin, J.C. Alternatively spliced MBNL1 isoforms exhibit differential influence on enhancing brown adipogenesis. Biochim. Biophys. Acta. Gene. Regul. Mech. 2020, 1863, 194437. [Google Scholar] [CrossRef]
  28. Zheng, X.; Ren, B.; Li, X.; Yan, H.; Xie, Q.; Liu, H.; Zhou, J.; Tian, J.; Huang, K. Selenoprotein F knockout leads to glucose and lipid metabolism disorders in mice. J. Biol. Inorg. Chem. 2020, 25, 1009–1022. [Google Scholar] [CrossRef]
  29. Cheng, C.K.; Bakar, H.A.; Gollasch, M.; Huang, Y. Perivascular adipose tissue: The sixth man of the cardiovascular system. Cardiovasc. Drugs. Ther. 2018, 32, 481–502. [Google Scholar] [CrossRef]
  30. Miao, C.Y.; Li, Z.Y. The role of perivascular adipose tissue in vascular smooth muscle cell growth. Br. J. Pharmacol. 2012, 165, 643–658. [Google Scholar] [CrossRef] [Green Version]
  31. Campbell, D.J.; Habener, J.F. Cellular localization of angiotensinogen gene expression in brown adipose tissue and mesentery: Quantification of messenger ribonucleic acid abundance using hybridization in situ. Endocrinology. 1987, 121, 1616–1626. [Google Scholar] [CrossRef]
  32. Cassis, L.A.; Police, S.B.; Yiannikouris, F.; Thatcher, S.E. Local adipose tissue renin-angiotensin system. Curr. Hypertens. Rep. 2008, 10, 93–98. [Google Scholar] [CrossRef] [Green Version]
  33. Hanzu, F.A.; Musri, M.M.; Sánchez-Herrero, A.; Claret, M.; Esteban, Y.; Kaliman, P.; Gomis, R.; Párrizas, M. Histone demethylase KDM1A represses inflammatory gene expression in preadipocytes. Obesity 2013, 21, E616–E625. [Google Scholar] [CrossRef]
  34. Brina, D.; Miluzio, A.; Ricciardi, S.; Clarke, K.; Davidsen, P.K.; Viero, G.; Tebaldi, T.; Offenhäuser, N.; Rozman, J.; Rathkolb, B.; et al. eIF6 coordinates insulin sensitivity and lipid metabolism by coupling translation to transcription. Nat. Commun. 2015, 6, 8261. [Google Scholar] [CrossRef] [Green Version]
  35. Xiong, Y.; Wang, E.; Huang, Y.; Guo, X.; Yu, Y.; Du, Q.; Ding, X.; Sun, Y. Inhibition of lysine-specific demethylase-1 (LSD1/KDM1A) promotes the adipogenic differentiation of hESCs through H3K4 methylation. Stem. Cell. Rev. Rep. 2016, 12, 298–304. [Google Scholar] [CrossRef] [Green Version]
  36. Liu, C.; Wang, J.; Wei, Y.; Zhang, W.; Geng, M.; Yuan, Y.; Chen, Y.; Sun, Y.; Chen, H.; Zhang, Y.; et al. Fat-specific knockout of Mecp2 upregulates slpi to reduce obesity by enhancing browning. Diabetes 2020, 69, 35–47. [Google Scholar] [CrossRef]
  37. Reilly, S.M.; Hung, C.W.; Ahmadian, M.; Zhao, P.; Keinan, O.; Gomez, A.V.; DeLuca, J.H.; Dadpey, B.; Lu, D.; Zaid, J.; et al. Catecholamines suppress fatty acid re-esterification and increase oxidation in white adipocytes via STAT3. Nat. Metab. 2020, 2, 620–634. [Google Scholar] [CrossRef]
  38. Xu, Y.; Wang, N.; Tan, H.Y.; Li, S.; Zhang, C.; Zhang, Z.; Feng, Y. Panax notoginseng saponins modulate the gut microbiota to promote thermogenesis and beige adipocyte reconstruction via leptin-mediated AMPKα/STAT3 signaling in diet-induced obesity. Theranostics 2020, 10, 11302–11323. [Google Scholar] [CrossRef]
  39. Lakhani, H.V.; Zehra, M.; Pillai, S.S.; Puri, N.; Shapiro, J.I.; Abraham, N.G.; Sodhi, K. Beneficial role of HO-1-SIRT1 axis in attenuating angiotensin II-induced adipocyte dysfunction. Int. J. Mol. Sci. 2019, 20, 3205. [Google Scholar] [CrossRef] [Green Version]
  40. Goel, H.; Melot, J.; Krinock, M.D.; Kumar, A.; Nadar, S.K.; Lip, G.Y.H. Heart-type fatty acid-binding protein: An overlooked cardiac biomarker. Ann. Med. 2020, 52, 444–461. [Google Scholar] [CrossRef]
  41. Zhuang, L.; Mao, Y.; Liu, Z.; Li, C.; Jin, Q.; Lu, L.; Tao, R.; Yan, X.; Chen, K. FABP3 deficiency exacerbates metabolic derangement in cardiac hypertrophy and heart failure via PPARα pathway. Front. Cardiovasc. Med. 2021, 8, 722908. [Google Scholar] [CrossRef] [PubMed]
  42. Betz, M.J.; Enerbäck, S. Targeting thermogenesis in brown fat and muscle to treat obesity and metabolic disease. Nat. Rev. Endocrinol. 2018, 14, 77–87. [Google Scholar] [CrossRef] [PubMed]
  43. Eugene Chen, Y. Editorial: The Yin and Yang of perivascular adipose tissue in vascular disease. Cardiovasc. Drugs. Ther. 2018, 32, 477–479. [Google Scholar] [CrossRef] [PubMed] [Green Version]
  44. Liang, X.; Qi, Y.; Dai, F.; Gu, J.; Yao, W. PVAT: An important guardian of the cardiovascular system. Histol. Histopathol. 2020, 35, 779–787. [Google Scholar]
  45. Dalen, K.T.; Schoonjans, K.; Ulven, S.M.; Weedon-Fekjaer, M.S.; Bentzen, T.G.; Koutnikova, H.; Auwerx, J.; Nebb, H.I. Adipose tissue expression of the lipid droplet-associating proteins S3-12 and perilipin is controlled by peroxisome proliferator-activated receptor-gamma. Diabetes 2004, 53, 1243–1252. [Google Scholar] [CrossRef] [Green Version]
  46. Smith, C.E.; Ordovás, J.M. Update on perilipin polymorphisms and obesity. Nutr. Rev. 2012, 70, 611–621. [Google Scholar] [CrossRef] [Green Version]
  47. Westhoff, C.C.; Mrozinski, J.; Riedel, I.; Heid, H.W.; Moll, R. Perilipin 1 is a highly specific marker for adipocytic differentiation in sarcomas with intermediate sensitivity. J. Cancer Res. Clin. Oncol. 2017, 143, 225–232. [Google Scholar] [CrossRef]
  48. Han, X.; Zhu, J.; Zhang, X.; Song, Q.; Ding, J.; Lu, M.; Sun, S.; Hu, G. Plin4-dependent lipid droplets hamper neuronal mitophagy in the MPTP/p-induced mouse model of Parkinson’s disease. Front. Neurosci. 2018, 12, 397. [Google Scholar] [CrossRef] [Green Version]
  49. Bernardi, R.E.; Olevska, A.; Morella, I.; Fasano, S.; Santos, E.; Brambilla, R.; Spanagel, R. The inhibition of RasGRF2, but not RasGRF1, alters cocaine reward in mice. J. Neurosci. 2019, 39, 6325–6338. [Google Scholar] [CrossRef]
  50. Huang, H.; Fan, Y.; Gao, Z.; Wang, W.; Shao, N.; Zhang, L.; Yang, Y.; Zhu, W.; Chen, Z.; Hu, J.; et al. HIF-1α contributes to Ang II-induced inflammatory cytokine production in podocytes. BMC. Pharmacol. Toxicol. 2019, 20, 59. [Google Scholar] [CrossRef] [Green Version]
  51. Yan, X.; Zhao, R.; Feng, X.; Mu, J.; Li, Y.; Chen, Y.; Li, C.; Yao, Q.; Cai, L.; Jin, L.; et al. Sialyltransferase7A promotes angiotensin II-induced cardiomyocyte hypertrophy via HIF-1α-TAK1 signalling pathway. Cardiovasc. Res. 2020, 116, 114–126. [Google Scholar] [CrossRef]
  52. Sharma, N.M.; Haibara, A.S.; Katsurada, K.; Nandi, S.S.; Liu, X.; Zheng, H.; Patel, K.P. Central Ang II (Angiotensin II)-mediated sympathoexcitation: Role for HIF-1α (hypoxia-inducible factor-1α) facilitated glutamatergic tone in the paraventricular nucleus of the hypothalamus. Hypertension 2021, 77, 147–157. [Google Scholar] [CrossRef]
  53. Qi, D.; Wei, M.; Jiao, S.; Song, Y.; Wang, X.; Xie, G.; Taranto, J.; Liu, Y.; Duan, Y.; Yu, B.; et al. Hypoxia inducible factor 1α in vascular smooth muscle cells promotes angiotensin II-induced vascular remodeling via activation of CCL7-mediated macrophage recruitment. Cell Death Dis. 2019, 10, 544. [Google Scholar] [CrossRef] [Green Version]
  54. Yang, X.; Bao, M.; Fang, Y.; Yu, X.; Ji, J.; Ding, X. STAT3/HIF-1α signaling activation mediates peritoneal fibrosis induced by high glucose. J. Transl. Med. 2021, 19, 283. [Google Scholar] [CrossRef]
Figure 1. Workflow for the whole study. tPVAT samples in each group (no less than 600 mg per group) were subjected to three biological replicates (each replicate is a mixture of tPVAT from 5–7 mice). LC-MS/MS, liquid chromatography-tandem mass spectrometry; GO, gene ontology; KEGG, Kyoto Encyclopedia of Genes and Genomes; PPI, Protein Protein Interaction.
Biomedicines 09 01820 g001
Figure 2. Phenotypic differences between saline and Ang II infused mice. Mice infused with saline were used as control. (A) Body weights of the mice perfused with saline and Ang II, during 2 weeks of perfusion (n = 20, biological replicates); * p < 0.05, vs. the control group (saline infusion). (B) Simplified schematic showing thoracic PVAT (tPVAT) in mice; PVAT, perivascular adipose tissue. (C) Representative picture illustrating isolation of tPVAT. (D) tPVAT weights from saline and Ang II infused mice (n = 20, biological replicates); * p < 0.05, vs. the control group. (E) Hematoxylin and eosin staining of tPVAT and the quantification of cell diameter between saline and Ang II infusion group (n = 8, biological replicates); * p < 0.05, vs. the control group.
Biomedicines 09 01820 g002
Figure 3. Differentially expressed proteins (DEPs) of tPVAT were identified in Ang II infused mice. (A) The volcano plot showed the distribution and number of DEPs between the saline and Ang II infused tPVAT. The red dots represent the up-regulated proteins, while the blue dots represent the down-regulated proteins. (B) Hierarchical clustering of DEPs from the Ang II group, compared with the saline group (three biological replicates per group). Red indicates upregulation and blue represents downregulation. (C) The number of DEPs. There are 145 up-regulated proteins and 146 down-regulated proteins.
Biomedicines 09 01820 g003
Figure 4. Immunohistochemical verification of DEPs. (A) Immunohistochemistry staining of up-regulated proteins, such as lysine-specific histone demethylase 1A (KDM1A), serine/threonine-protein kinase N1 (PKN1), C-terminal-binding protein 1 (CtBP1), transmembrane protein 41B (TMEM41B), myeloblastin (PRTN3), CD166 antigen (ALCAM), and GRB10-interacting GYF protein 2 (GIGYF2). Positive staining was indicated by brown coloration, and nuclei were stained with hematoxylin in blue. (B) Immunohistochemistry staining of down-regulated proteins, such as CCN family member 1 (CCN1), muscleblind-like protein 1 (MBNL1), H/ACA ribonucleoprotein complex subunit 2 (NHP2), retinol dehydrogenase 10 (RDH10), T-cell immunoglobulin and mucin domain-containing protein 4 (TIMD4), and Translin (TSN). Positive cells are indicated by brown coloration.
Biomedicines 09 01820 g004
Figure 5. Functional analysis of DEPs. (A) Subcellular location of DEPs between saline and Ang II group. The numbers show the proteins located in different subcellular components. (B) Overall enriched GO terms. The vertical axis with different colors of the bar charts represents the significance of enrichment of the three categories (biological processes, molecular functions, cellular components). The horizontal axes represent the number of DEPs. (C) Top 20 enriched GO analyses of Ang II-altered proteins. BP: biological processes; MF: molecular functions; CC: cellular components. The color gradient from orange to red represents the p value. The numbers above the bar charts represent the richFactor (richFactor ≤ 1). (D) KEGG pathway enrichment bubble chart. The horizontal axes represent the richFactor (richFactor ≤ 1), which represents the ratio of the number of DEPs annotated to the KEGG pathway to the number of all identified proteins annotated to the KEGG category. The vertical axis represents the statistical results of DEPs under Top 20 KEGG pathways. The color of the bubble represents the significance of the enriched KEGG pathways. The color gradient from green to red represents the p value; the closer to red color, the lower the p value and the higher the significance level corresponding to the enrichment.
Biomedicines 09 01820 g005
Figure 6. Diagram of the important signaling pathways that have changed after Ang II infusion. Up-regulated DEPs after Ang II infusion are shown in red. Down-regulated DEPs after Ang II infusion are shown in green. (A) Fatty acid biosynthetic pathway (simplified from Figure S3). (B) PPAR signaling pathway that affects lipid metabolism, themogenesis, and adipocyte differentiation (simplified from Figure S4). (C) Ras and its downstream signaling pathways (simplified from Figures S5–S7). Ras-Rac signaling affects cell motility. Ras-PI3K-Akt and Ras-ERK1/2 signaling affects cell apoptosis and gene expression. Ras-HIF1α pathway affects cell protein degradation and oxygen delivery.
Biomedicines 09 01820 g006
Figure 7. Protein protein interaction (PPI) analysis of DEPs between saline and Ang II infusion group. The circled nodes represent DEPs, and the lines represent protein-protein interactions. Red circles represent up-regulation proteins. Blue circles represent down-regulation proteins. The size of the circle indicates the degree of protein connectivity.
Biomedicines 09 01820 g007
Table 1. List of up-regulated proteins during Ang II infusion.
Accession NO.Gene NameProtein NameAccession NO.Gene NameProtein Name
Q6ZQ88KDM1ALysine-specific histone demethylase 1AQ9CPV3MRPL4239S ribosomal protein L42, mitochondrial
P70268PKN1Serine/threonine-protein kinase N1Q8VCW8ACSF2Medium-chain acyl-CoA ligase ACSF2, mitochondrial
Q8BX80ENGaseCytosolic endo-beta-N-acetylglucosaminidaseQ9D0F9PGM1Phosphoglucomutase-1
O88712CtBP1C-terminal-binding protein 1P53986SLC16A1Monocarboxylate transporter 1
Q8K1A5Tmem41bTransmembrane protein 41BQ8BGQ1VIPAS39Spermatogenesis-defective protein 39 homolog
P70392RasGRF2Ras-specific guanine nucleotide-releasing factor 2Q9D2R0AACSAcetoacetyl-CoA synthetase
Q61096PRTN3MyeloblastinQ9CXR1DHRS7Dehydrogenase/reductase SDR family member 7
Q8VD66ABHD4(Lyso)-N-acylphosphatidylethanolamine lipaseQ8K3K7AGPAT21-acyl-sn-glycerol-3-phosphate acyltransferase beta
Q6Y7W8GIGYF2GRB10-interacting GYF protein 2Q924N4SLC12A6Solute carrier family 12 member 6
Q61490ALCAMCD166 antigenQ922Z0DDOD-aspartate oxidase
Q8CHD8RAB11FIP3Rab11-family interacting protein 3Q14DH7ACSS3Acyl-CoA synthetase short-chain family member 3, mitochondrial
Q8R054SRPX2Sushi repeat-containing protein SRPX2Q00898SERPINA1EAlpha-1-antitrypsin 1–5
Q3UVG3FAM91A1Protein FAM91A1Q9JJF9SPPL2aSignal peptide peptidase-like 2A
O89017LGMNLegumainQ9CS72FILIP1Filamin-A-interacting protein 1
Q8R1R3StarD7StAR-related lipid transfer protein 7, mitochondrialQ9QXG4ACSS2Acetyl-coenzyme A synthetase, cytoplasmic
Q924W5Smc6Structural maintenance of chromosomes protein 6P28063PSMB8Proteasome subunit beta type-8
Q64516GKGlycerol kinaseQ5RKZ7MOCS1Molybdenum cofactor biosynthesis protein 1
Q9D023MPC2Mitochondrial pyruvate carrier 2P67984Rpl2260S ribosomal protein L22
E9Q1P8IRF2BP2Interferon regulatory factor 2-binding protein 2Q99KF1TMED9Transmembrane emp24 domain-containing protein 9
P12242UPC1Mitochondrial brown fat uncoupling protein 1Q9CY73MRPL4439S ribosomal protein L44, mitochondrial
P11404FABP3Fatty acid-binding protein, heartQ8BHJ6SERINC5Serine incorporator 5
P09470ACEAngiotensin-converting enzymeP70699GAALysosomal alpha-glucosidase
Q8BMB3eIF4E2Eukaryotic translation initiation factor 4E type 2Q3U4G3XXYLT1Xyloside xylosyltransferase 1
Q9D136OGFOD32-oxoglutarate and iron-dependent oxygenase domain-containing protein 3Q8C7H1MMAAMethylmalonic aciduria type A homolog, mitochondrial
Q62009POSTNPeriostinQ80VW7AKNAMicrotubule organization protein AKNA
Q78JN3Eci3Enoyl-CoA delta isomerase 3, peroxisomalO54940BNIP2BCL2/adenovirus E1B 19 kDa protein-interacting protein 2
P68433H3C1Histone H3.1Q6PEE2CTIFCBP80/20-dependent translation initiation factor
Q5SF07IGF2BP2Insulin-like growth factor 2 mRNA-binding protein 2Q9D4H1EXOC2Exocyst complex component 2
Q9JM90STAP1Signal-transducing adaptor protein 1Q8CFV9RFKRiboflavin kinase
Q80YX1TNCTenascinP29595NEDD8NEDD8
Q9DCE5PAK1IP1p21-activated protein kinase-interacting protein 1Q9Z0P5TWF2Twinfilin-2
Q8JZR0ACSL5Long-chain-fatty-acid--CoA ligase 5Q9CXJ1EARS2Probable glutamate--tRNA ligase, mitochondrial
Q9CXD9LRRc17Leucine-rich repeat-containing protein 17Q8VHQ9ACOT11Acyl-coenzyme A thioesterase 11
Q8BWJ3PHKA2Phosphorylase b kinase regulatory subunit alpha, liver isoformQ920B9SUPT16HFACT complex subunit SPT16
Q811L6MAST4Microtubule-associated serine/threonine-protein kinase 4Q9DCV4RMDN1Regulator of microtubule dynamics protein 1
P61202COPS2COP9 signalosome complex subunit 2P06745GPIGlucose-6-phosphate isomerase
Q1W617SHROOM4Protein SHROOM4O08600EndoGEndonuclease G, mitochondrial
P63158HMGB1High mobility group protein B1O08746MATN2Matrilin-2
P36536SAR1AGTP-binding protein SAR1AQ78J03MsrB2Methionine-R-sulfoxide reductase B2, mitochondrial
Q8BJ03COX15Cytochrome c oxidase assembly protein COX15 homologQ99L45EIF2S2Eukaryotic translation initiation factor 2 subunit 2
Q8BHC0LYVE-1Lymphatic vessel endothelial hyaluronic acid receptor 1P97452BOP1Ribosome biogenesis protein BOP1
Q8VE11MTMR6Myotubularin-related protein 6O08528HK2Hexokinase-2
Q91V76C11orf54Ester hydrolase C11orf54 homologQ9Z1T1Ap3B1AP-3 complex subunit beta-1
Q64008Rab34Ras-related protein Rab-34Q920A5SCPEP1Retinoid-inducible serine carboxypeptidase
P30993C5aR1C5a anaphylatoxin chemotactic receptor 1Q91VU0FAM3CProtein FAM3C
Q91WC3ACSL6Long-chain-fatty-acid--CoA ligase 6Q9CQE7ERGIC3Endoplasmic reticulum-Golgi intermediate compartment protein 3
Q7TPM3TRIM17E3 ubiquitin-protein ligase TRIM17P50580PA2G4Proliferation-associated protein 2G4
P70122SBDSRibosome maturation protein SBDSQ9CZD5MTIF3Translation initiation factor IF-3, mitochondrial
Q8CHG3GCC2GRIP and coiled-coil domain-containing protein 2P01631 Ig kappa chain V-II region 26–10
Q80X95RRAGARas-related GTP-binding protein AQ9D125MRPS2528S ribosomal protein S25, mitochondrial
Q8R3F5MCATMalonyl-CoA-acyl carrier protein transacylase, mitochondrialQ5SW19CLUHClustered mitochondria protein homolog
Q99LJ6GPX7Glutathione peroxidase 7Q7TPE5SLC7A6OSProbable RNA polymerase II nuclear localization protein SLC7A6OS
O70503HSD17B12Very-long-chain 3-oxoacyl-CoA reductaseP42227STAT3Signal transducer and activator of transcription 3
P12382PFKLATP-dependent 6-phosphofructokinase, liver typeQ9Z0S1BPNT-13′(2′),5′-bisphosphate nucleotidase 1
Q61704ITIH3Inter-alpha-trypsin inhibitor heavy chain H3P09242ALPLAlkaline phosphatase, tissue-nonspecific isozyme
P06797CTSLCathepsin L1P12265GUSBBeta-glucuronidase
Q80WG5LRRC8AVolume-regulated anion channel subunit LRRC8AQ61391MMENeprilysin
Q9CQV4RETREG3Reticulophagy regulator 3P82198TGFBITransforming growth factor-beta-induced protein ig-h3
Q8BGR6ARL15ADP-ribosylation factor-like protein 15Q9WUP7UCHL5Ubiquitin carboxyl-terminal hydrolase isozyme L5
P11276FN1FibronectinP52196TSTThiosulfate sulfurtransferase
P70460VASPVasodilator-stimulated phosphoproteinQ9QZA0CA5BCarbonic anhydrase 5B, mitochondrial
P06339H2-T23H-2 class I histocompatibility antigen, D-37 alpha chainQ8QZY9SF3B4Splicing factor 3B subunit 4
Q65Z40WaplWings apart-like protein homologP34914EPHX2Bifunctional epoxide hydrolase 2
P10126Eef1a1Elongation factor 1-alpha 1O54946DNAJB6DnaJ homolog subfamily B member 6
P54823Ddx6Probable ATP-dependent RNA helicase DDX6Q9CQ86MIEN1Migration and invasion enhancer 1
Q8BUE4Aifm2Apoptosis-inducing factor 2Q8CG46SMC5Structural maintenance of chromosomes protein 5
O35143ATP5IF1ATPase inhibitor, mitochondrialQ60715P4HA1Prolyl 4-hydroxylase subunit alpha-1
Q9Z0V8Timm17aMitochondrial import inner membrane translocase subunit Tim17-AP15105GLULGlutamine synthetase
Q9CWX9Ddx47Probable ATP-dependent RNA helicase DDX47P08228SOD1Superoxide dismutase [Cu-Zn]
O35344Kpna3Importin subunit alpha-4Q5SWU9ACACAAcetyl-CoA carboxylase 1
O54950Prkag15’-AMP-activated protein kinase subunit gamma-1Q91Z96BMP2KBMP-2-inducible protein kinase
Q99P65Slc29a3Equilibrative nucleoside transporter 3Q9CYK1WARS2Tryptophan--tRNA ligase, mitochondrial
O09111Ndufb11NADH dehydrogenase [ubiquinone] 1 beta subcomplex subunit 11, mitochondrial
This table contains the 145 proteins that displayed more than 1.2-fold up-regulation in Ang II-infused mice in three independent experiments. The protein accession number, gene name, and name of each protein are provided here. The proteins are listed in descending order, according to their fold change (the fold change can be seen in Table S2), and the top 10 up-regulated proteins appear in bold.
Table 2. List of down-regulated proteins during Ang II infusion.
Accession NO.Gene NameProtein NameAccession NO.Gene NameProtein Name
P18406CCN1CCN family member 1A2RTL5RSRC2Arginine/serine-rich coiled-coil protein 2
Q09098Pate4Prostate and testis expressed protein 4Q8BL86MBLAC2Metallo-beta-lactamase domain-containing protein 2
Q9ERR7SelenofSelenoprotein FQ6ZWY8TMSB10Thymosin beta-10
O54916Reps1RalBP1-associated Eps domain-containing protein 1Q9D5V6Syap1Synapse-associated protein 1
Q9CRB2NHP2H/ACA ribonucleoprotein complex subunit 2Q8BK08TMEM11Transmembrane protein 11, mitochondrial
Q6U7R4TIMD4T-cell immunoglobulin and mucin domain-containing protein 4Q80X80C2CD2LPhospholipid transfer protein C2CD2L
Q9JKP5MBNL1Muscleblind-like protein 1Q9WV85NME3Nucleoside diphosphate kinase 3
Q62348TSNTranslinQ9DCL2CIAO2ACytosolic iron-sulfur assembly component 2A
Q8VCH7RDH10Retinol dehydrogenase 10Q61285ABCD2ATP-binding cassette sub-family D member 2
Q3THF9COQ10BCoenzyme Q-binding protein COQ10 homolog B, mitochondrialP70333HNRNPH2Heterogeneous nuclear ribonucleoprotein H2
Q9JK38GNPNAT1Glucosamine 6-phosphate N-acetyltransferaseQ69ZP3PNKDProbable hydrolase PNKD
Q05144Rac2Ras-related C3 botulinum toxin substrate 2O35864COPS5COP9 signalosome complex subunit 5
P60710ACTBActin, cytoplasmic 1Q61464ZNF638Zinc finger protein 638
Q9Z140CPNE6Copine-6Q9JM14NT5C5’(3’)-deoxyribonucleotidase, cytosolic type
P47955RPLP160S acidic ribosomal protein P1Q9D1L0CHCHD2Coiled-coil-helix-coiled-coil-helix domain-containing protein 2
P63073eIF4EEukaryotic translation initiation factor 4EQ3TMW1CCDC102ACoiled-coil domain-containing protein 102A
Q8CH72TRIM32E3 ubiquitin-protein ligase TRIM32Q9Z0V7TIMM17BMitochondrial import inner membrane translocase subunit Tim17-B
P83870PHF5APHD finger-like domain-containing protein 5AO88895HDAC3Histone deacetylase 3
P41317MBL2Mannose-binding protein CP97370ATP1B3Sodium/potassium-transporting ATPase subunit beta-3
P15864H1-2Histone H1.2P26645MARCKSMyristoylated alanine-rich C-kinase substrate
Q91WU5AS3MTArsenite methyltransferaseQ3TEA8HP1BP3Heterochromatin protein 1-binding protein 3
O54962BANF1Barrier-to-autointegration factorQ9D1I2CARD19Caspase recruitment domain-containing protein 19
O70451SLC16A7Monocarboxylate transporter 2Q3UEZ8SLC10A4Sodium/bile acid cotransporter 4
P26011ITGB7Integrin beta-7Q99ME9GTPBP4Nucleolar GTP-binding protein 1
Q9JHH9COPZ2Coatomer subunit zeta-2Q0VGM9RTEL1Regulator of telomere elongation helicase 1
O54788DFFBDNA fragmentation factor subunit betaQ9JLQ0CD2APCD2-associated protein
P82348SGCGGamma-sarcoglycanO70370CTSSCathepsin S
B1AVZ0UPRTUracil phosphoribosyltransferase homologQ69ZF3GBA2Non-lysosomal glucosylceramidase
Q9JHI7EXOSC9Exosome complex component RRP45Q8K124PLEKHO2Pleckstrin homology domain-containing family O member 2
Q61207PSAPProsaposinP19973LSP1Lymphocyte-specific protein 1
O35638STAG2Cohesin subunit SA-2P62874GNB1Guanine nucleotide-binding protein G(I)/G(S)/G(T) subunit beta-1
Q91YE5BAZ2ABromodomain adjacent to zinc finger domain protein 2AQ80VL1TDRKHTudor and KH domain-containing protein
Q9CY57ChtopChromatin target of PRMT1 proteinQ9Z2D6MECP2Methyl-CpG-binding protein 2
O55135eIF6Eukaryotic translation initiation factor 6Q61503NT5E5’-nucleotidase
Q8R3B7BRD8Bromodomain-containing protein 8Q8K2Q5CHCHD7Coiled-coil-helix-coiled-coil-helix domain-containing protein 7
Q8R143PTTG1IPPituitary tumor-transforming gene 1 protein-interacting proteinQ8BP48MetAP1Methionine aminopeptidase 1
Q9D2V5AAR2Protein AAR2 homologQ64237DBHDopamine beta-hydroxylase
P28798GRNProgranulinO35226PSMD426S proteasome non-ATPase regulatory subunit 4
Q9R0Y5AK-1Adenylate kinase isoenzyme 1E9PZM4CHD2Chromodomain-helicase-DNA-binding protein 2
P03899MTND3NADH-ubiquinone oxidoreductase chain 3P26369U2AF2Splicing factor U2AF 65 kDa subunit
Q8JZS0LIN7AProtein lin-7 homolog AP56379ATP5MPLATP synthase subunit ATP5MPL, mitochondrial
Q91V12ACOT7Cytosolic acyl coenzyme A thioester hydrolaseE9Q5C9NOLC1Nucleolar and coiled-body phosphoprotein 1
Q00724RBP4Retinol-binding protein 4P59279RAB2BRas-related protein Rab-2B
Q78HU7GYPCGlycophorin-CQ8R332NUP58Nucleoporin p58/p45
Q9QZB0RGS17Regulator of G-protein signaling 17P97384ANXA11Annexin A11
Q8BGX2TIMM29Mitochondrial import inner membrane translocase subunit Tim29Q5XG73ACBD5Acyl-CoA-binding domain-containing protein 5
P97429ANXA4Annexin A4Q60754MARCOMacrophage receptor MARCO
O55186CD59aCD59a glycoproteinA2AJB2TMEM141Transmembrane protein 141
Q8BLV3SLC9A7Sodium/hydrogen exchanger 7Q8K2I4MANBABeta-mannosidase
Q0VBL1TIGD2Tigger transposable element-derived protein 2P20444PRKCAProtein kinase C alpha type
O09117SYPL1Synaptophysin-like protein 1P43276H1.5Histone H1.5
Q9WTR5CDH13Cadherin-13Q8CGN5PLIN1Perilipin-1
Q8VCF0MAVSMitochondrial antiviral-signaling proteinQ63844MAPK3Mitogen-activated protein kinase 3
O88492PLIN4Perilipin-4Q3UMY5EML4Echinoderm microtubule-associated protein-like 4
Q80US4ACTR5Actin-related protein 5Q6DIC0SNF2L2Probable global transcription activator SNF2L2
Q8C3X8LMF2Lipase maturation factor 2P07356ANXA2Annexin A2
P99028UQCRHCytochrome b-c1 complex subunit 6, mitochondrialQ9WVH9FBLN5Fibulin-5
P58742AAASAladinP43135NR2F2COUP transcription factor 2
Q6PCP5MffMitochondrial fission factorQ8R4R6NUP35Nucleoporin NUP35
O35488SLC27A2Very long-chain acyl-CoA synthetaseP11798CAMK2ACalcium/calmodulin-dependent protein kinase type II subunit alpha
Q9DAS9GNG12Guanine nucleotide-binding protein G(I)/G(S)/G(O) subunit gamma-12Q8BHL3TBC1D10BTBC1 domain family member 10B
Q9D1G5LRRC57Leucine-rich repeat-containing protein 57Q8BTI8SRRNM2Serine/arginine repetitive matrix protein 2
Q8BGD8COA6Cytochrome c oxidase assembly factor 6 homologP97952SCN1BSodium channel subunit beta-1
Q9CRB8MTFP1Mitochondrial fission process protein 1P51912SLC1A5Neutral amino acid transporter B (0)
Q99MS7EHBP1L1EH domain-binding protein 1-like protein 1Q8BPB5EFEMP1EGF-containing fibulin-like extracellular matrix protein 1
Q61029TMPOLamina-associated polypeptide 2, isoforms beta/delta/epsilon/gammaQ64373BCL2L1Bcl-2-like protein 1
Q91YU6LZTS2Leucine zipper putative tumor suppressor 2Q6P9Q4FHOD1FH1/FH2 domain-containing protein 1
Q8K212PACS1Phosphofurin acidic cluster sorting protein 1Q99L88SNTB1Beta-1-syntrophin
Q3U3R4LMF1Lipase maturation factor 1Q80UZ0FGD5FYVE, RhoGEF and PH domain-containing protein 5
Q9JI46NUDT3Diphosphoinositol polyphosphate phosphohydrolase 1O35704SPTLC1Serine palmitoyltransferase 1
Q8K4G1LTBP-4Latent-transforming growth factor beta-binding protein 4A2ASQ1AGRNAgrin
P70429EVLEna/VASP-like proteinQ9JIG8PRAF2PRA1 family protein 2
C0HKD8MFAP1aMicrofibrillar-associated protein 1AQ8R323RFC3Replication factor C subunit 3
This table contains the 146 proteins that displayed less than 0.83-fold down-regulation in Ang II-infused mice in three independent experiments. The protein accession number, gene name, and name of each protein are provided here. The proteins are listed in ascending order according to their fold change (the fold change can be seen in Table S2), and the top 10 down-regulated proteins appear in bold.
Table 3. Distribution of proteins and signaling pathways response to Ang II infusion, based on GO and KEGG analysis.
TermsCountp ValueFDRrichFactorAccession NO.
GO (gene ontology)
Gene silencing (BP)120.00110.50100.1600Q91YE5, Q9Z2D6, O88712, Q6ZQ88, Q6Y7W8, Q9CY73, Q80VL1, P15864, P43276, O55135, P42227, P68433
Monosaccharide binding (MF)90.00290.50100.1698P41317, Q8K2I4, O08528, Q60715, Q64237, Q9D136, P12382, P06745, Q9JK38
Extracellular matrix (CC)220.00120.50100.1164P07356, P11276, Q9WVH9, P97429, Q8K4G1, Q62009, P97384, A2ASQ1, C0HKD8, P06797, P41317, Q8BPB5, Q80YX1, O08746, P82198, P18406, Q61704, Q8R054, Q60754, O70503, P09242, Q9CXD9
KEGG (kyoto encyclopedia of genes and genomes) pathways
Fatty acid biosynthesis40.00690.58940.2857Q5SWU9, Q8JZR0, Q8R3F5, Q91WC3
EGFR tyrosine kinase inhibitor resistance60.00760.58940.1935Q63844, Q8BMB3, P63073, Q64373, P20444, P42227
PPAR signaling pathway80.00920.58940.1538P12242, Q8CGN5, O88492, Q8JZR0, P11404, Q64516, O35488, Q91WC3
HIF-1 signaling pathway80.01030.58940.1509P12382, O08528, P11798, Q63844, Q8BMB3, P63073, P20444, P42227
Galactose metabolism40.01140.58940.2500P12382, Q9D0F9, O08528, P70699
Starch and sucrose metabolism40.01430.61370.2353Q9D0F9, O08528, P06745, P70699
Other glycan degradation30.01690.62300.3000Q8BX80, Q69ZF3, Q8K2I4
Peroxisome80.02100.67570.1333P08228, Q8JZR0, P34914, Q78JN3, Q61285, O35488, Q91WC3, Q922Z0
Lysosome80.03230.77580.1231Q61207, Q9Z1T1, P06797, O89017, P12265, P70699, O70370, Q8K2I4
Thiamine metabolism20.04270.77580.3333P09242, Q9R0Y5
Apoptosis70.04430.77580.1228P60710, O08600, P06797, Q63844, Q64373, O70370, O54788
Ras signaling pathway80.04720.77580.1143P62874, Q05144, Q9DAS9, Q63844, Q64373, P20444, P70392, Q9D4H1
Abbreviations: BP, biological processes; MF, molecular functions; CC, cellular components; FDR, false discovery rate. GO and KEGG pathway enrichment were analyzed by the Fisher’ exact test, based on the entire quantified protein annotations as the background dataset. Only functional categories and pathways with p-values < 0.05 were considered as significant.
Table 4. DEPs with high connectivity degree in PPI analysis between saline and Ang II infusion group.
Accession NO.Gene NameProtein NameDegreeUp/Down Regulation
P11276FN1Fibronectin28up
P60710ACTBActin, cytoplasmic 125down
Q63844MAPK3Mitogen-activated protein kinase 317down
Q9CRB2NHP2H/ACA ribonucleoprotein complex subunit 217down
P42227STAT3Signal transducer and activator of transcription 316up
P50580PA2G4Proliferation-associated protein 2G415up
Q99ME9GTPBP4Nucleolar GTP-binding protein 114down
O55135eIF6Eukaryotic translation initiation factor 614down
P61202COPS2COP9 signalosome complex subunit 212up
Q64373BCL2L1Bcl-2-like protein 111down
O35488SLC27A2Very long-chain acyl-CoA synthetase11down
Q5SWU9ACACAAcetyl-CoA carboxylase 111up
P67984Rpl2260S ribosomal protein L2211up
O08528HK2Hexokinase-210up
P08228SOD1Superoxide dismutase [Cu-Zn]10up
P63073eIF4EEukaryotic translation initiation factor 4E10down
P63158HMGB1High mobility group protein B110up
Q99L45EIF2S2Eukaryotic translation initiation factor 2 subunit 210up
Q6ZQ88KDM1ALysine-specific histone demethylase 1A10up
Q9WUP7UCHL5Ubiquitin carboxyl-terminal hydrolase isozyme L510up
Publisher’s Note: MDPI stays neutral with regard to jurisdictional claims in published maps and institutional affiliations.

