
An Empirical Investigation into Alarming Signals Ignored by the U.S. Multi-Brand Retailer J. Crew Incorporation during COVID-19 Pandemic


Abstract
1. Introduction
2. Literature Review
3. Research Methodology
- ➢
- Vertical income statement;
- ➢
- Vertical balance sheet;
- ➢
- Horizontal income statement;
- ➢
- Horizontal balance sheet;
- ➢
- Trend analysis of income statement;
- ➢
- Trend analysis of balance sheet.
- ➢
- Signals from vertical, horizontal, and trend analysis statements;
- ➢
- Signals from ratio analysis.
4. Data Analysis and Results
4.1. J. Crew Group Inc. Business Establishments
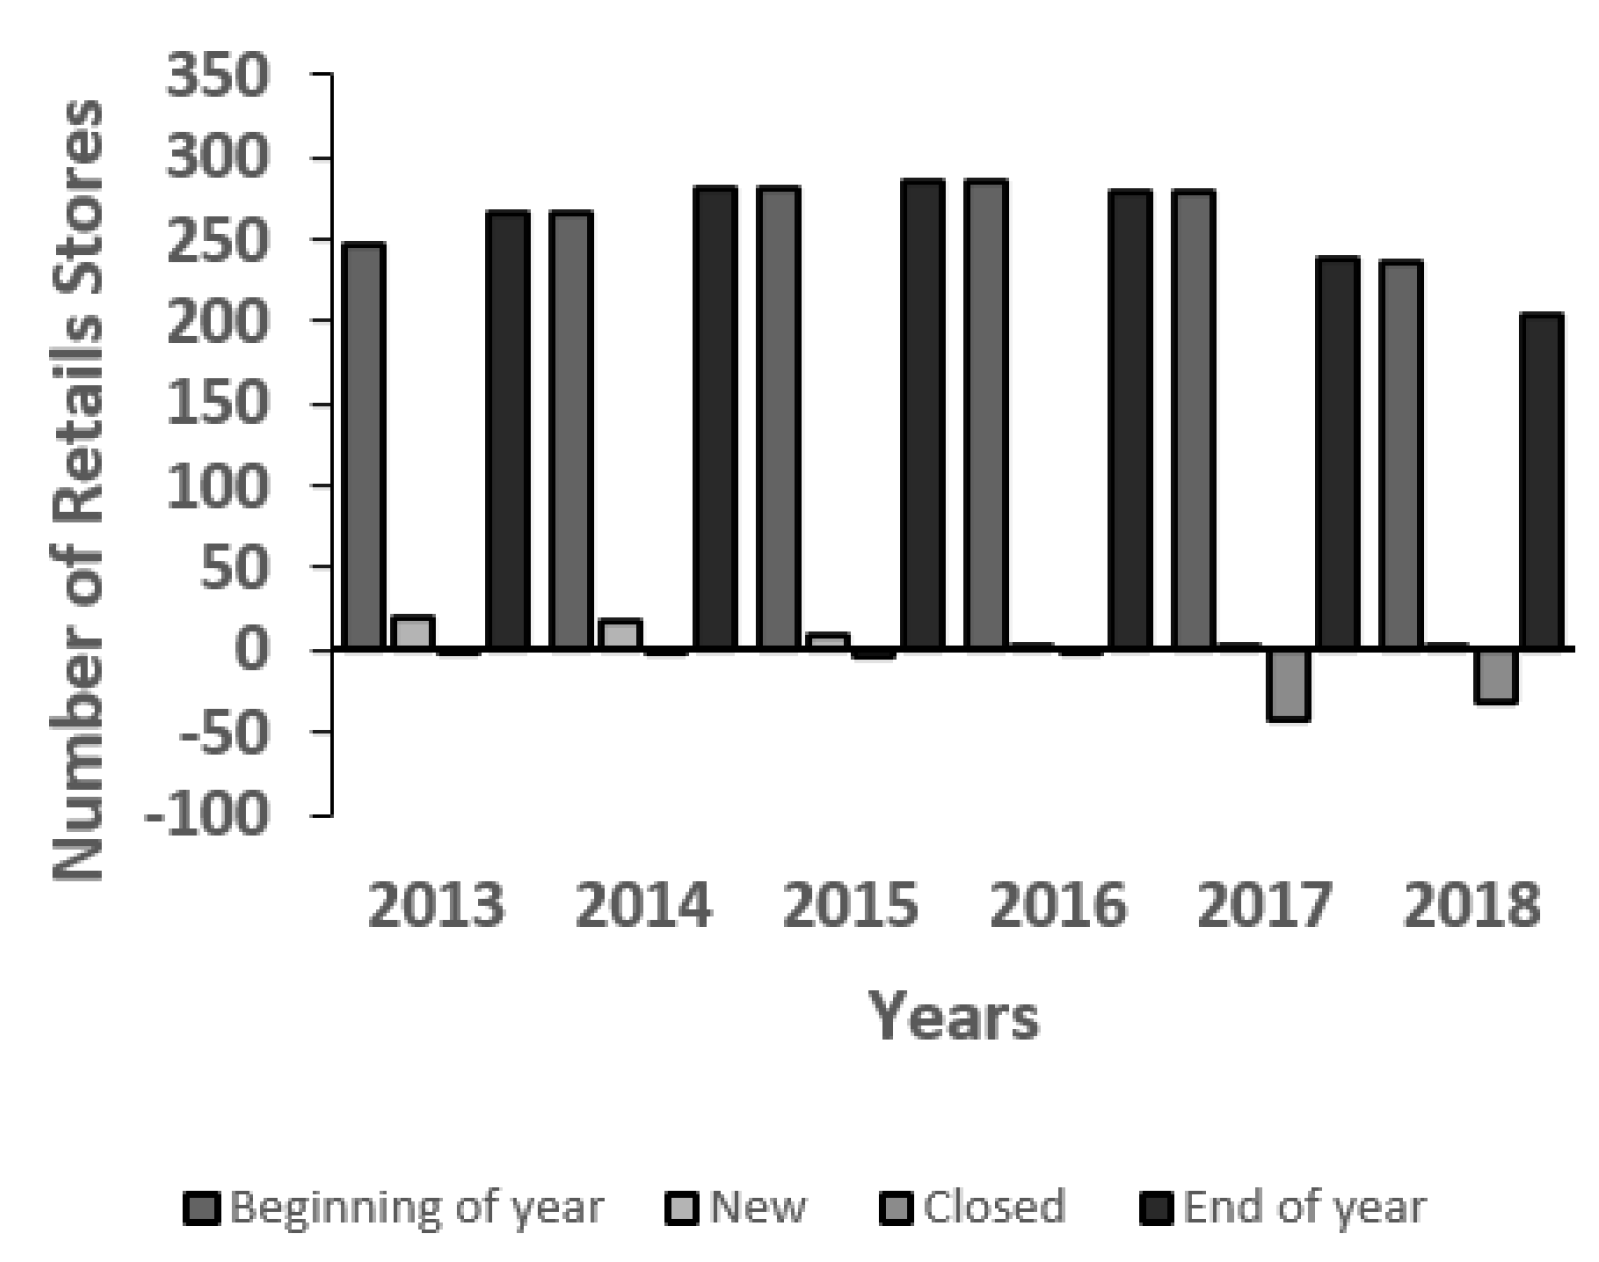
4.2. J. Crew Group Inc. Retail Stores
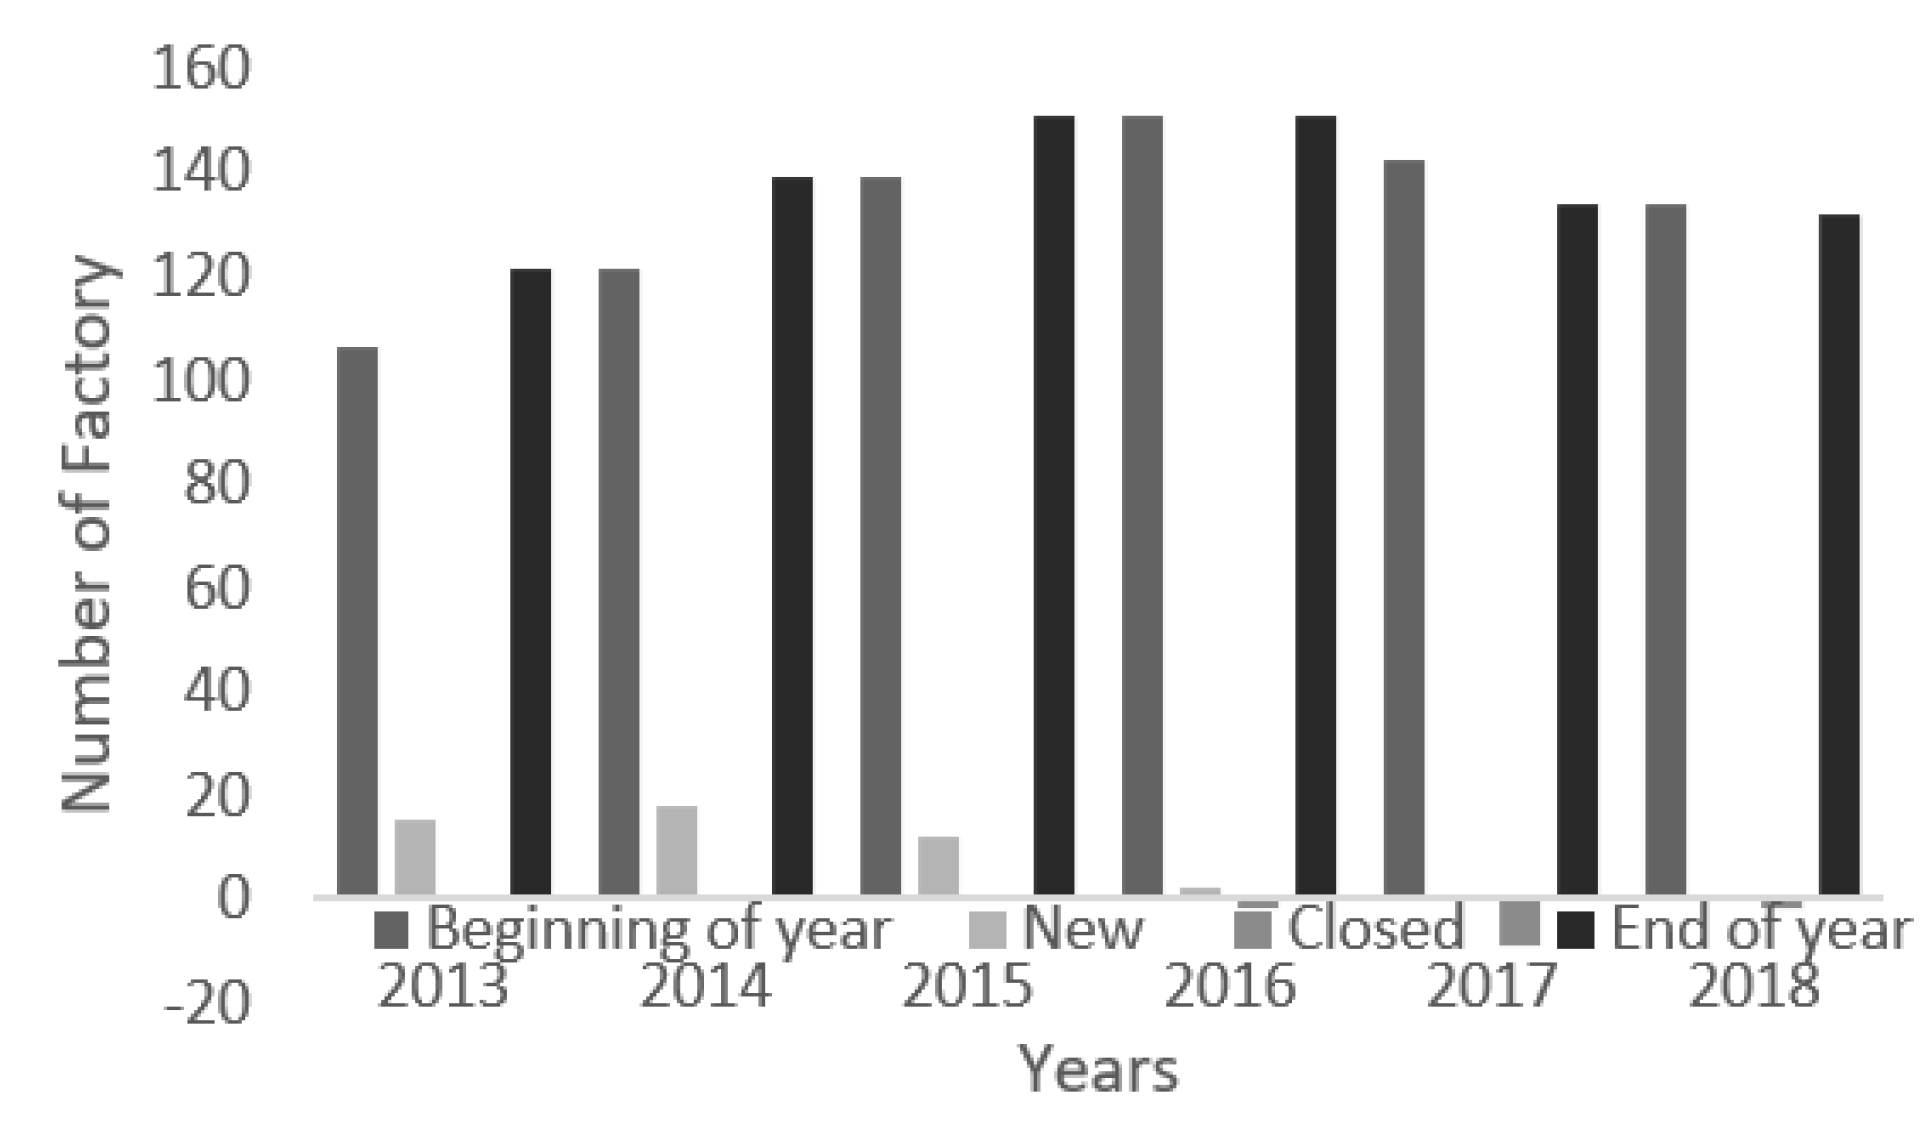
4.3. J. Crew Group Inc. Factory
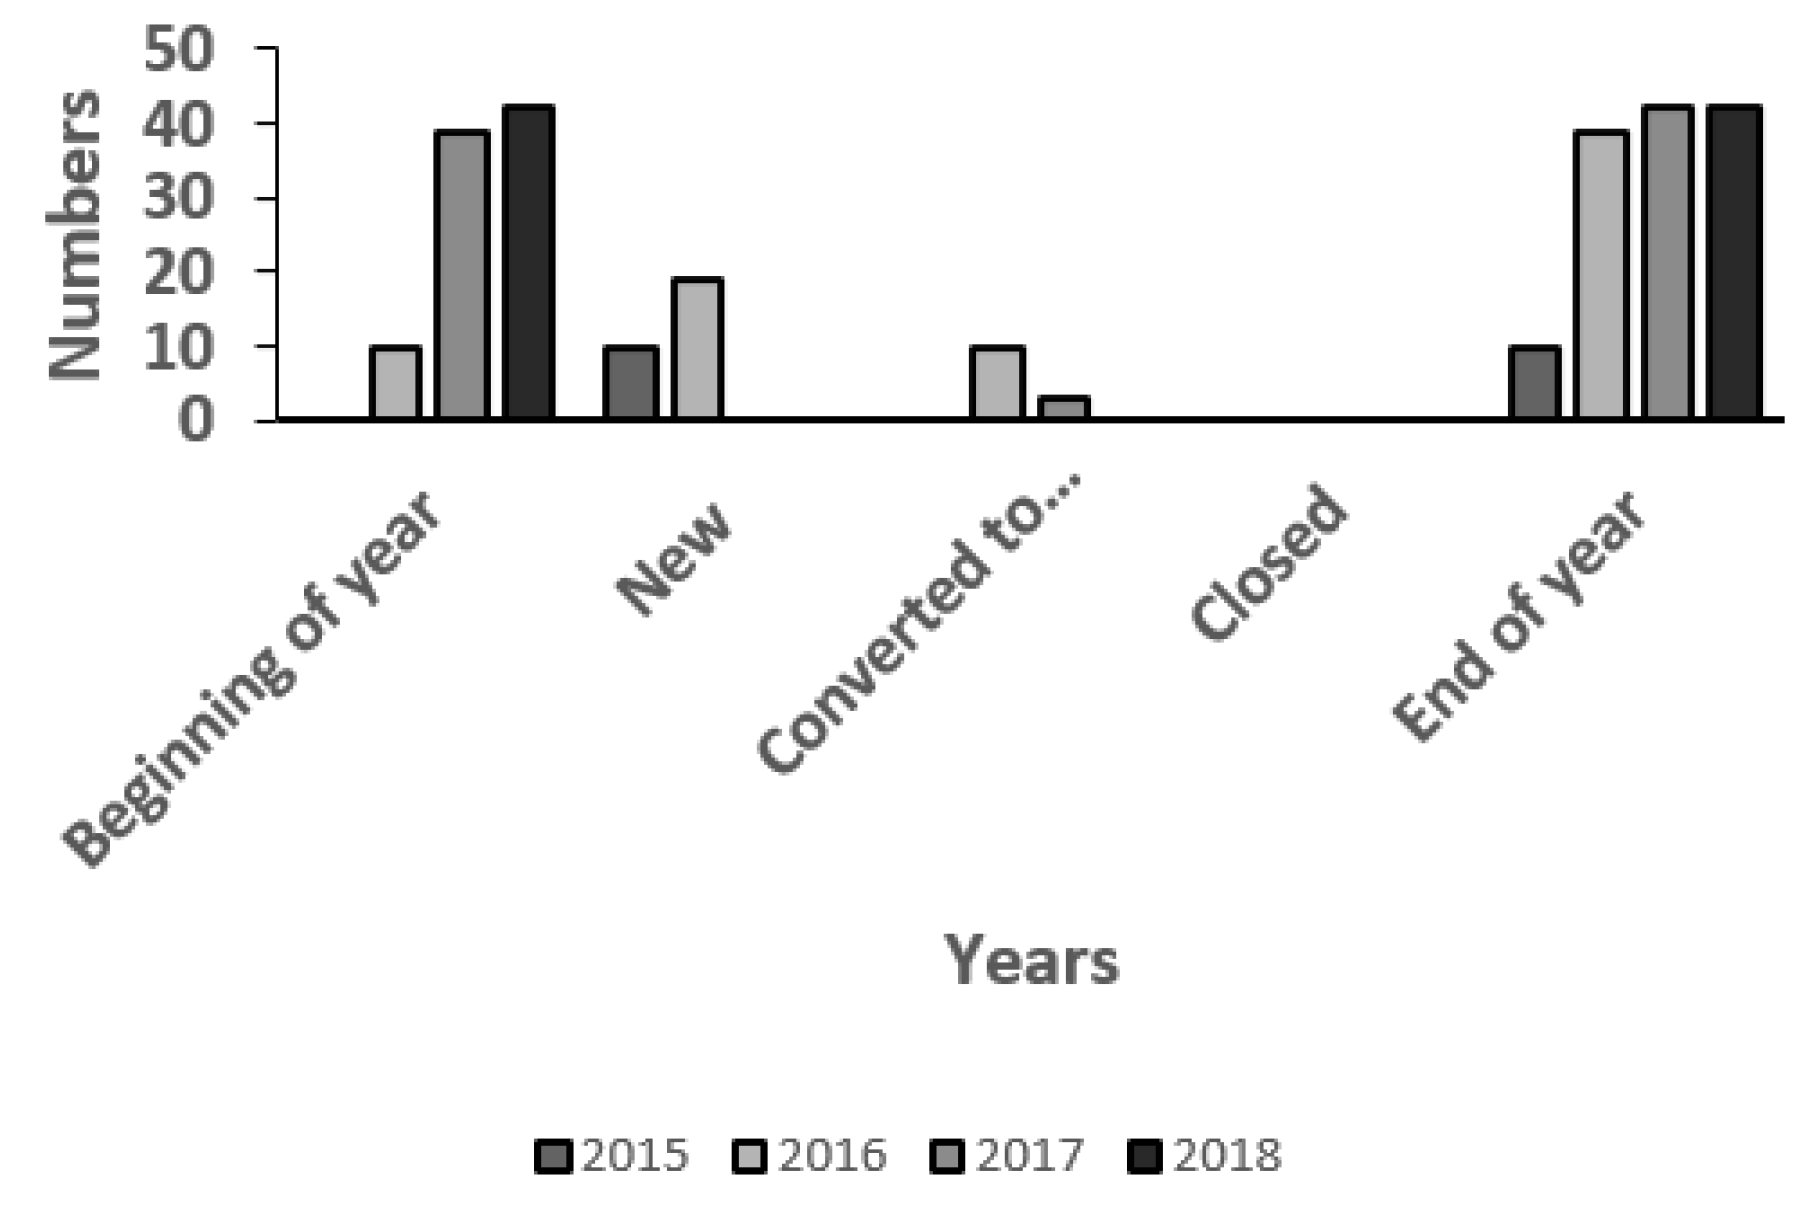
4.4. J. Crew Mercantile
4.5. Madewell
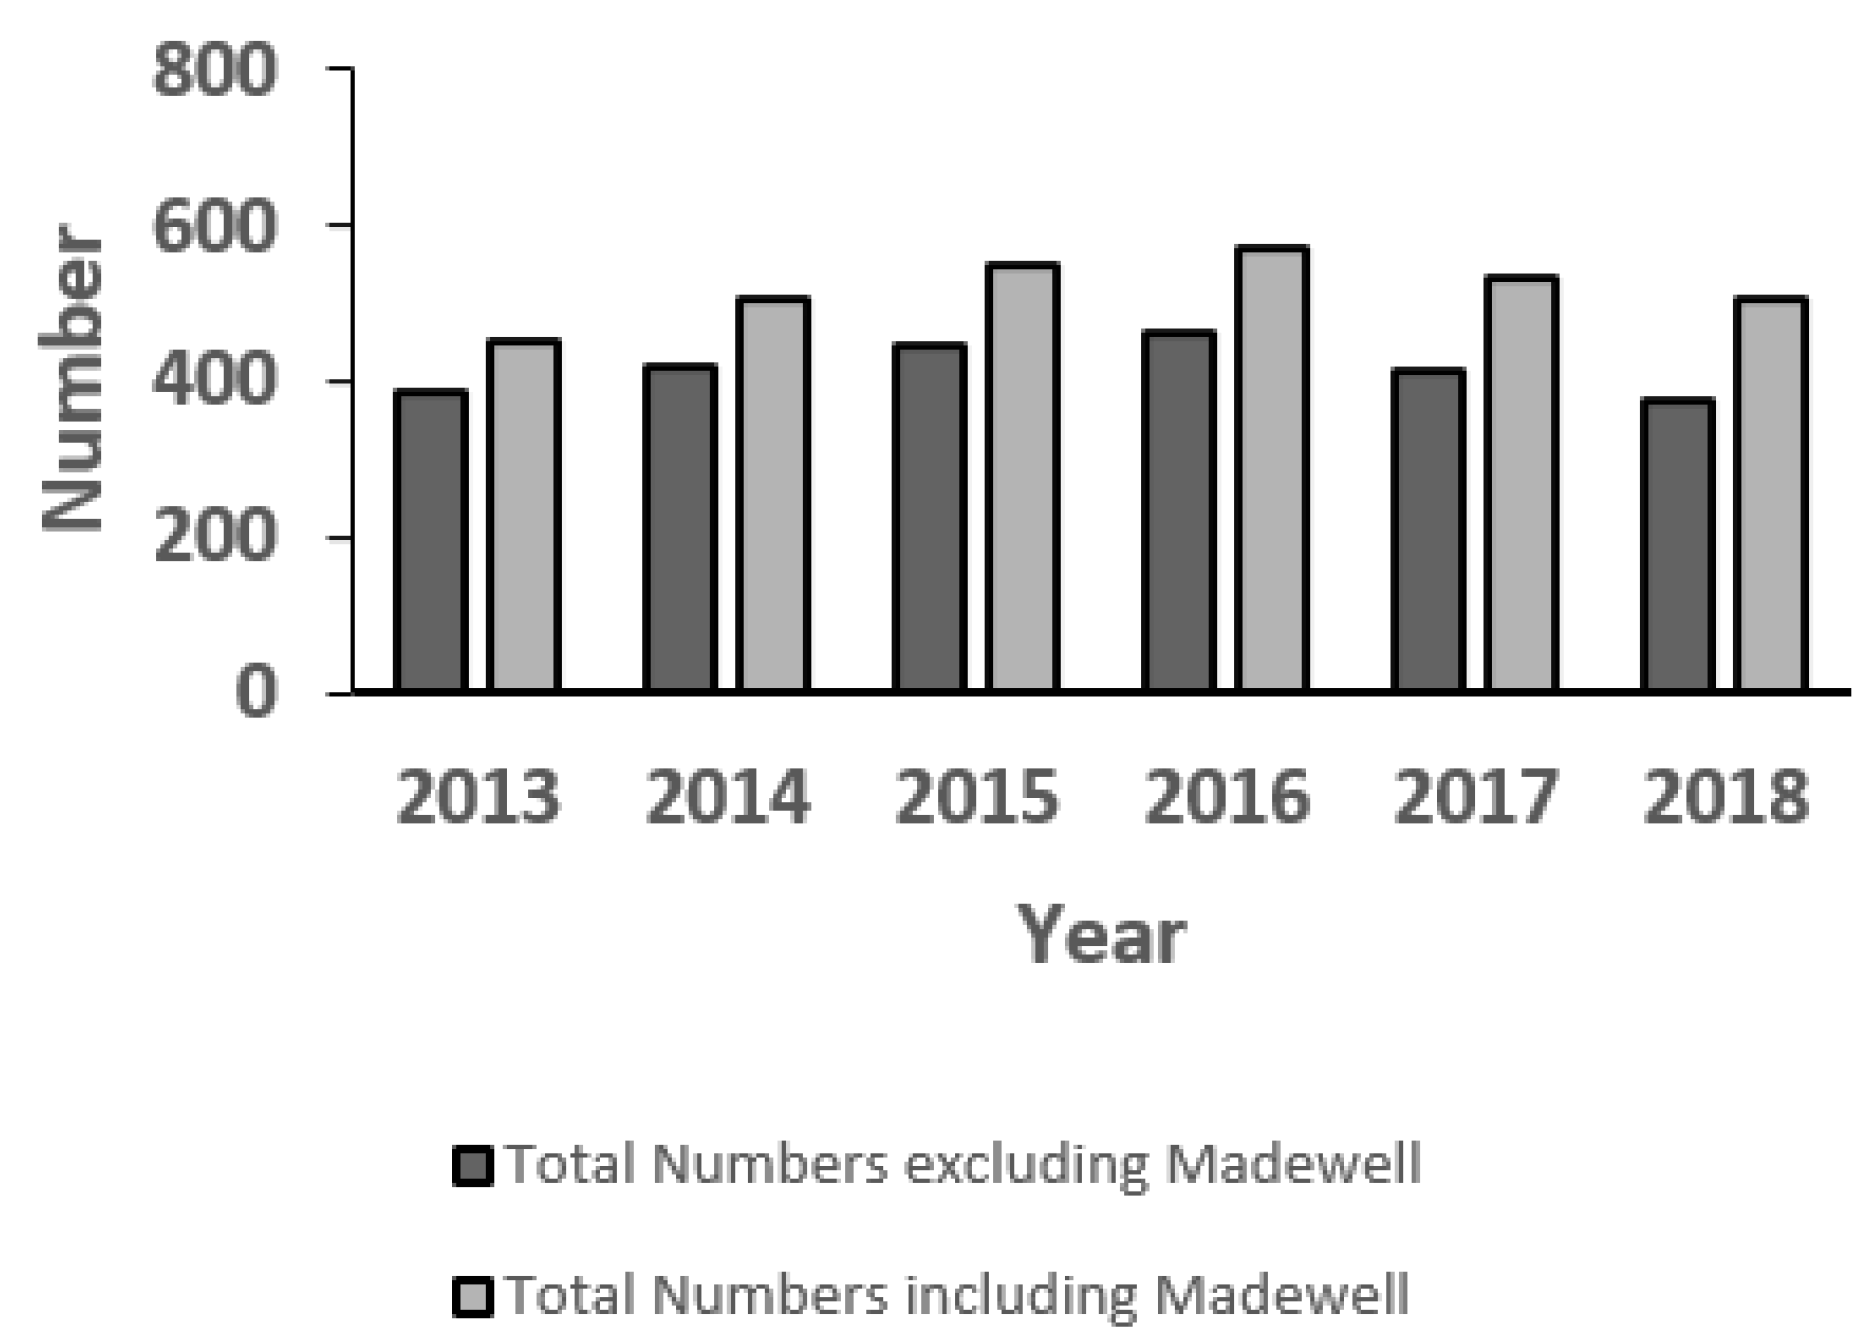
4.6. Total Establishments
4.7. Financial Analysis of J. Crew Group Inc.
4.8. Horizontal Analysis of J. Crew Group Inc.’s Financial Statements from 2013–2019
4.8.1. Horizontal Analysis of Consolidated Income Statement of J. Crew Group Inc.
4.8.2. Horizontal Analysis of Consolidated Balance Sheet
4.9. Vertical Analysis of J. Crew Group Inc.’s Financial Statements from 2013 to 2019
4.9.1. Vertical Analysis Income Statement
4.9.2. Vertical Analysis of Balance Sheet of J. Crew Group Inc.
4.10. Trend Analysis of J. Crew Group Inc. Financial Statements from 2013 to 2019
4.11. Ratio Analysis of J. Crew Group Inc. from 2013 to 2019
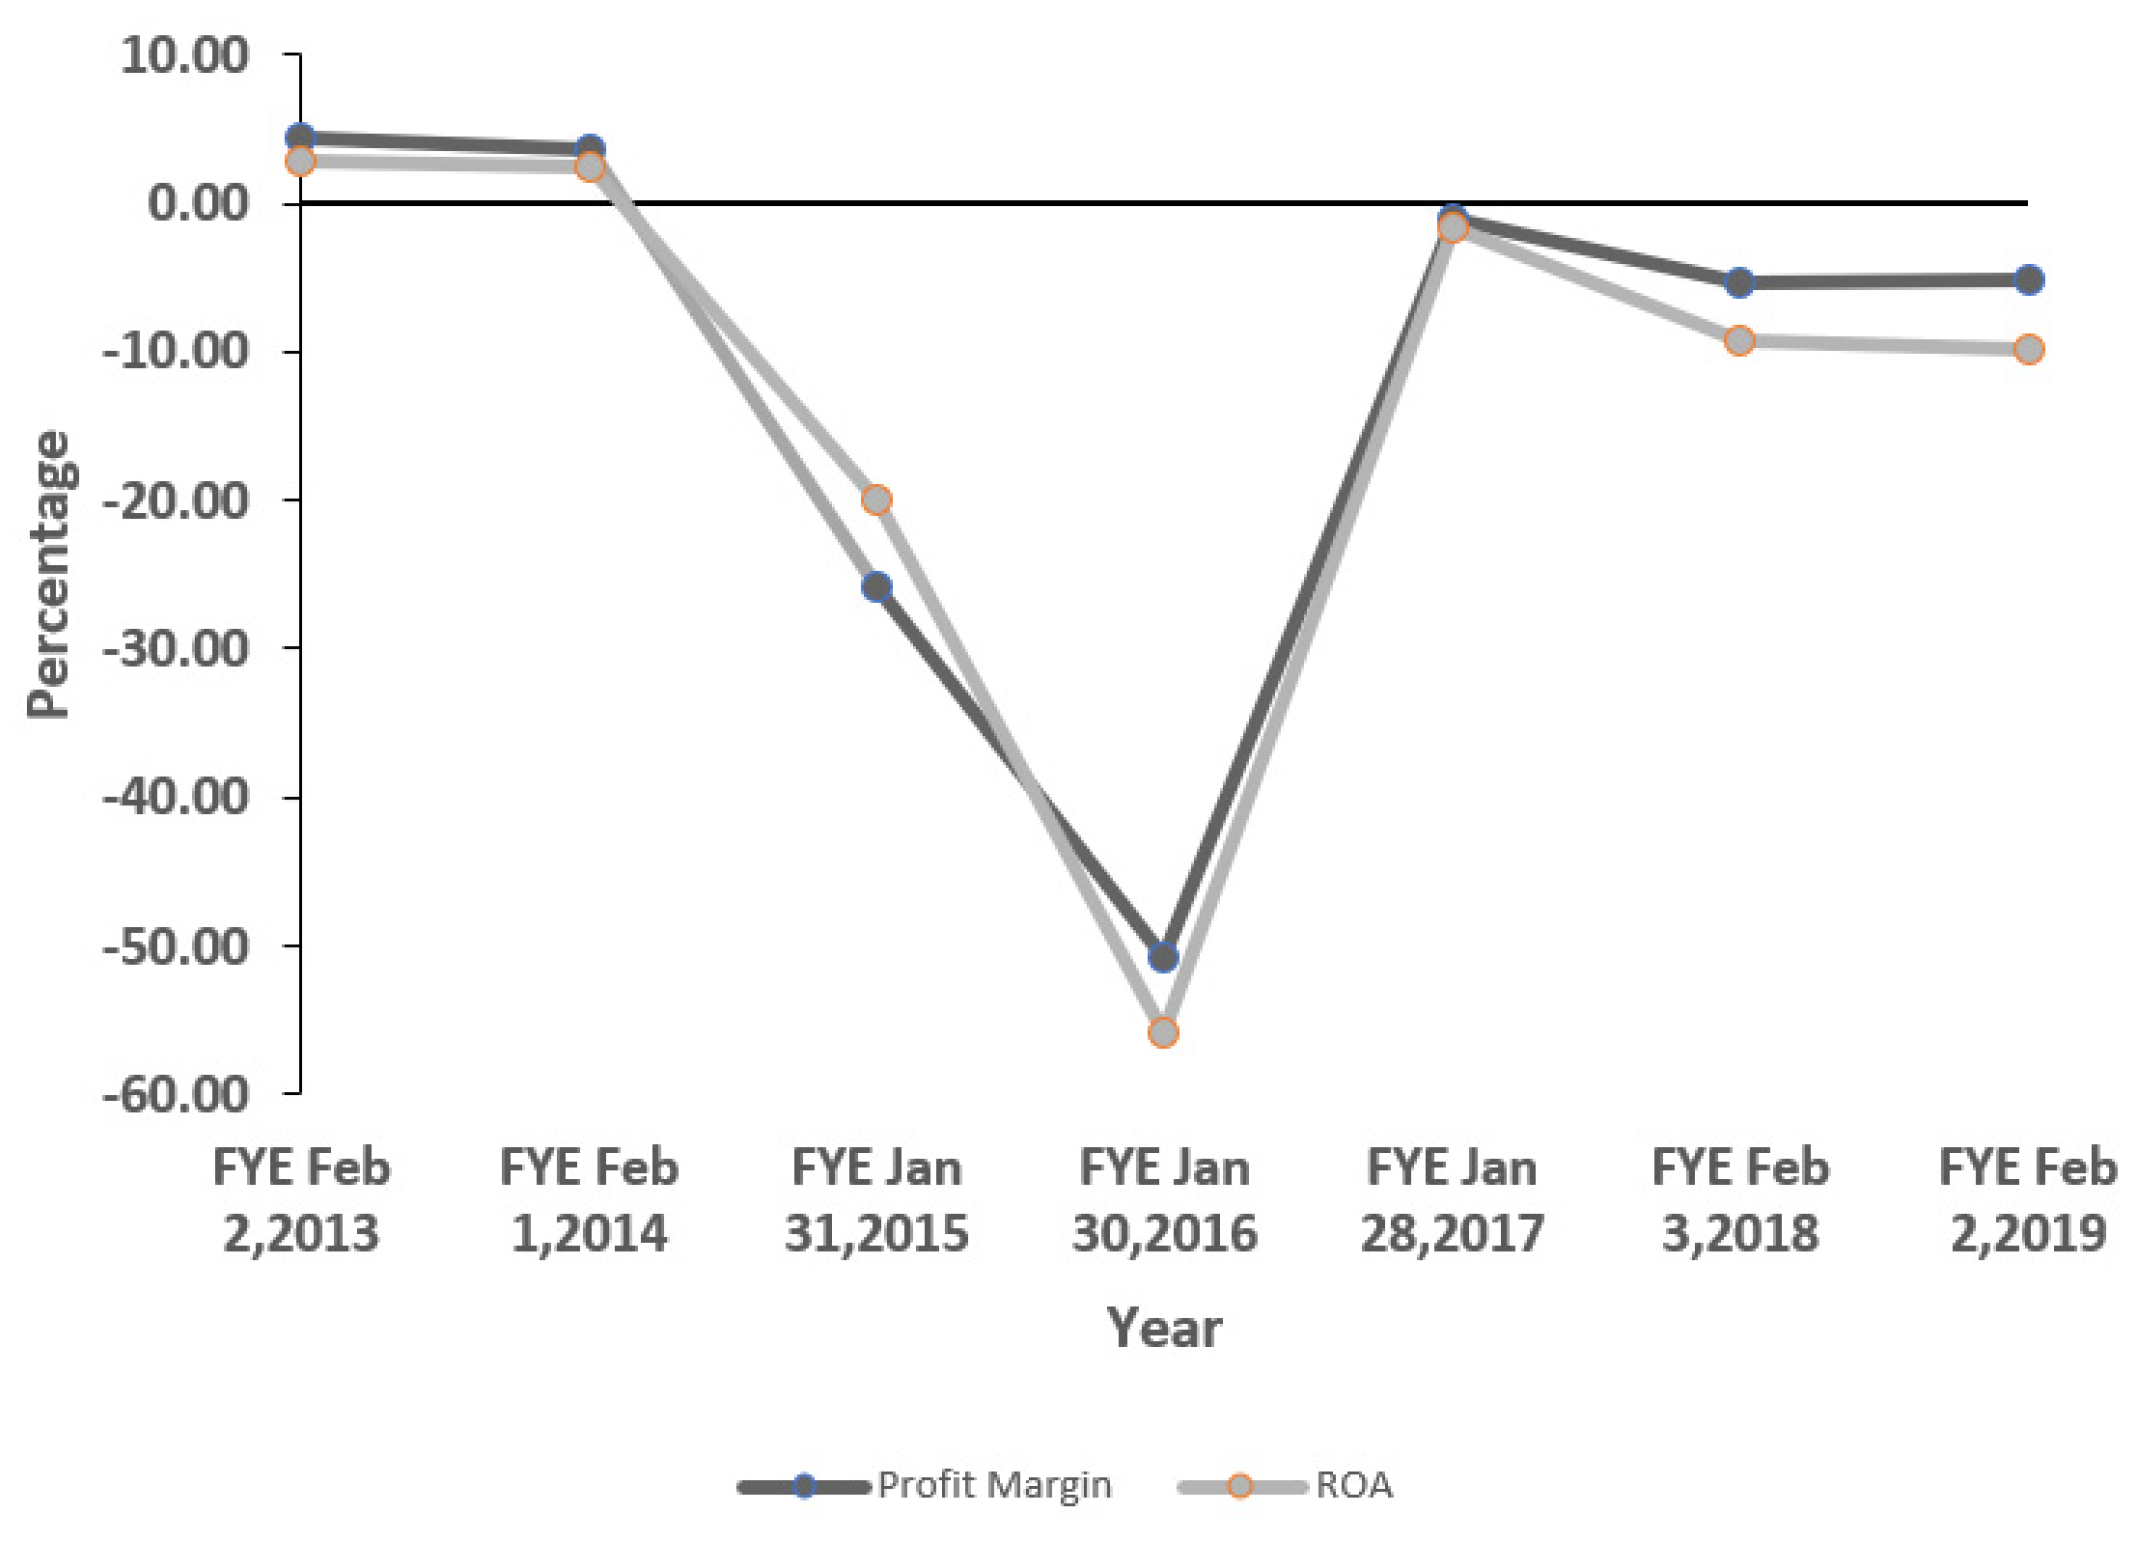
4.11.1. Profitability Ratios
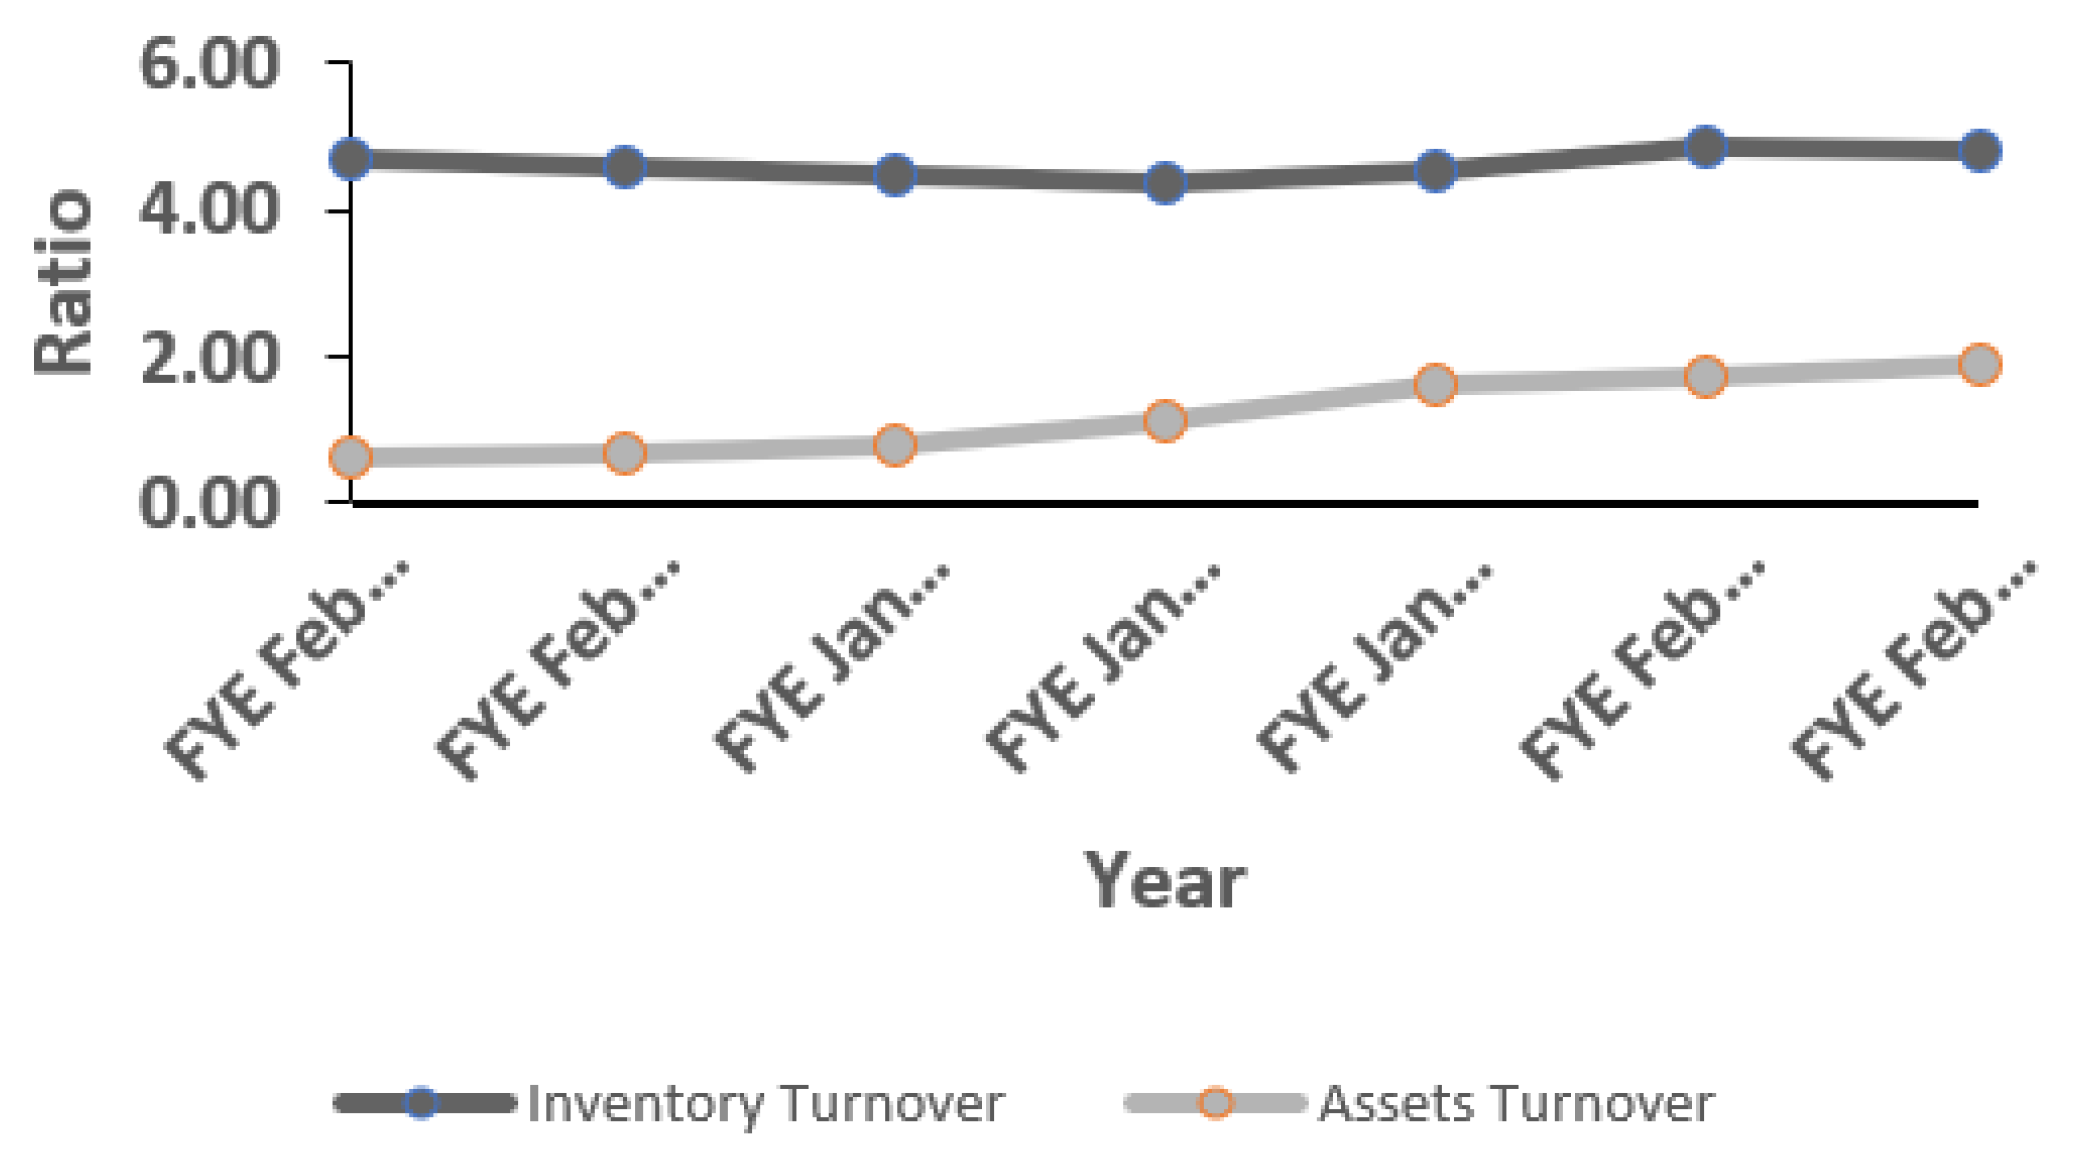
4.11.2. Activity and Efficiency Ratios
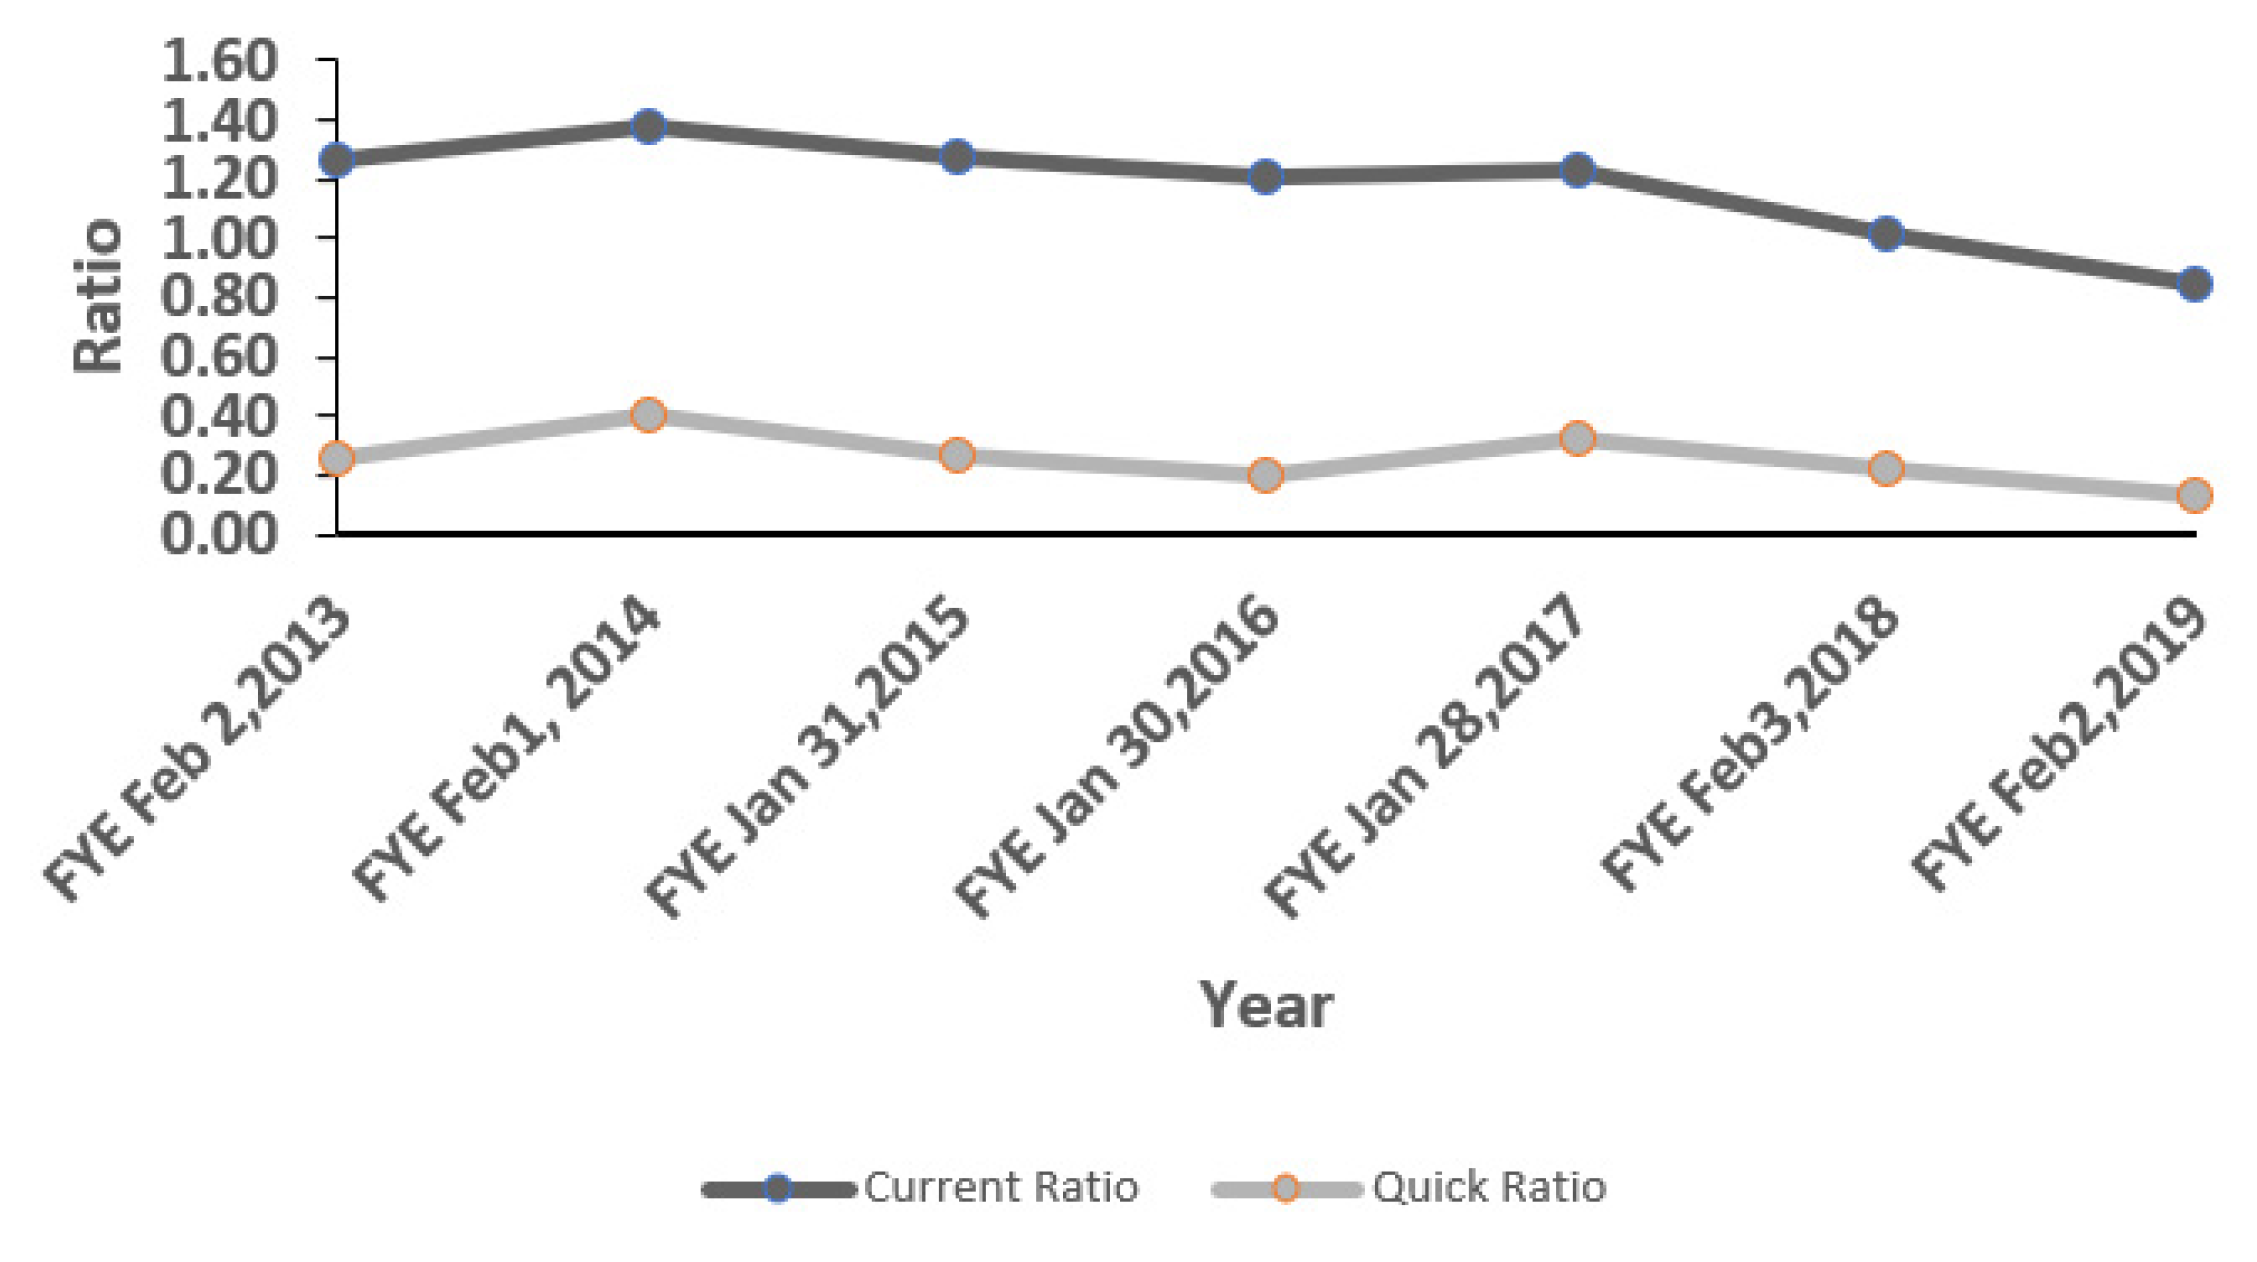
4.11.3. Liquidity Ratios
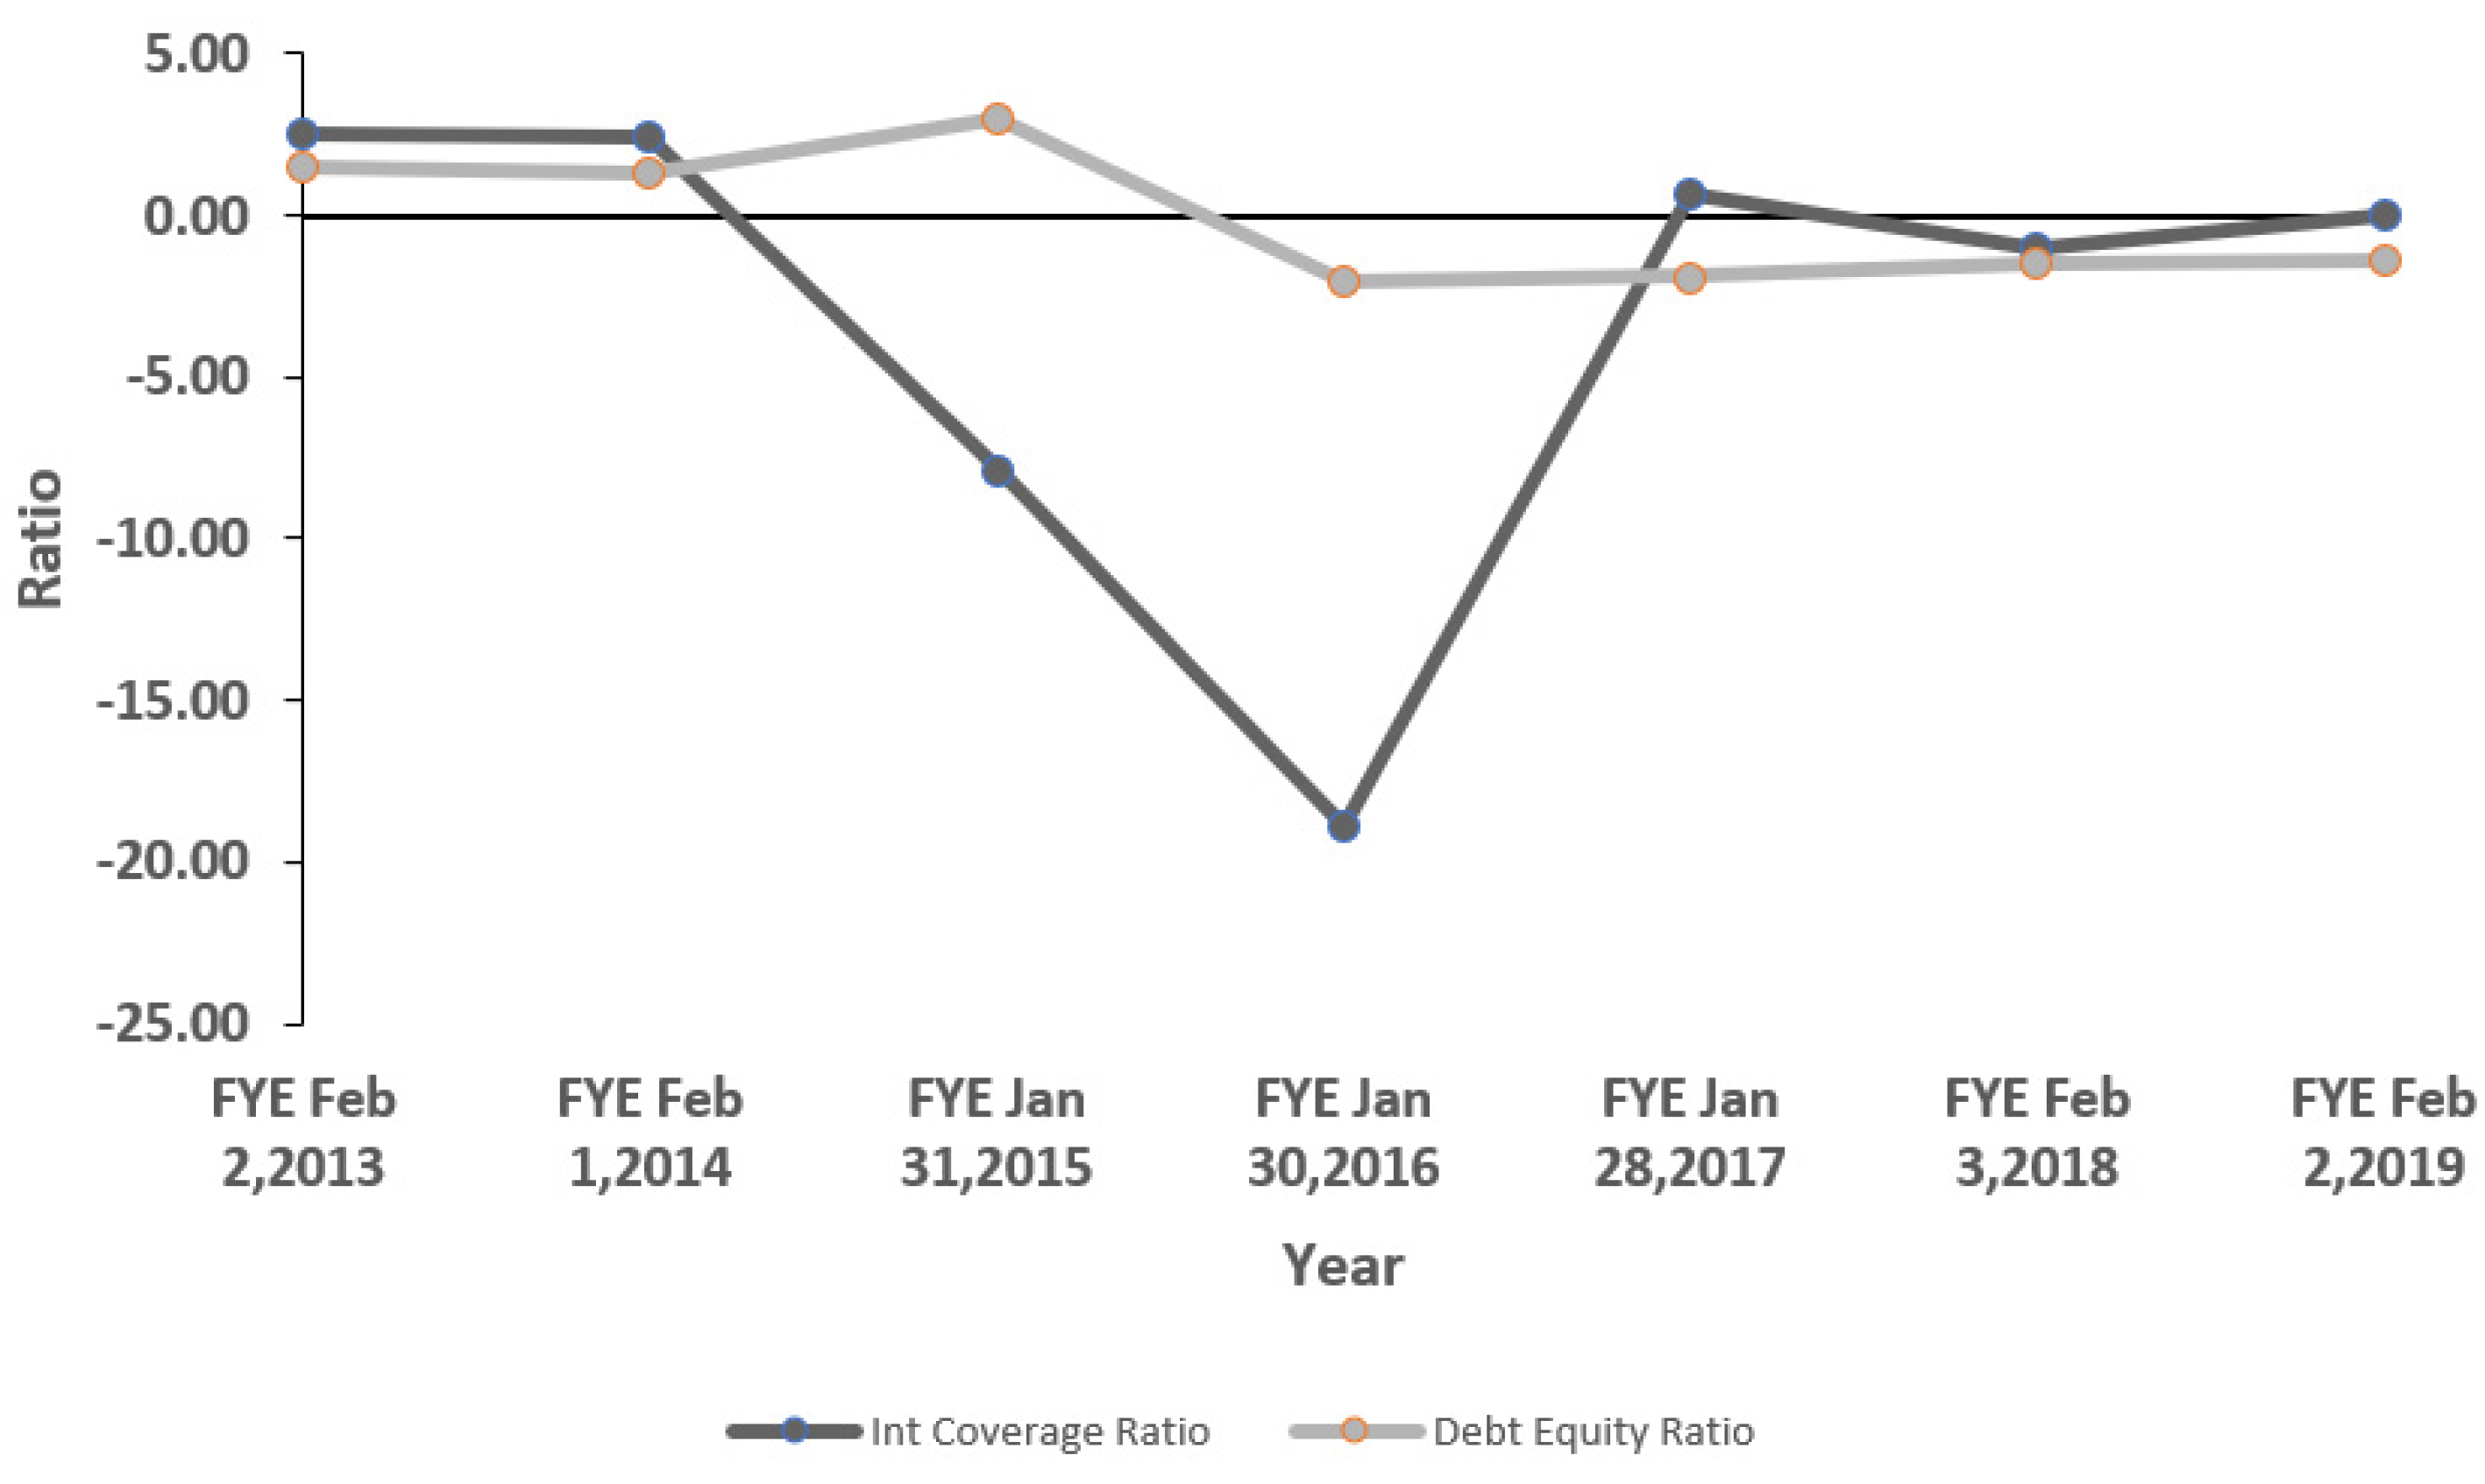
4.11.4. Solvency Ratios
5. Discussion
5.1. Part 1: Signals from Horizontal, Vertical, and Trend Analysis of J. Crew Group Inc. from 2013 to 2019
5.2. Part 2: Signals from Ratios Analysis of J. Crew Group Inc. from 2014 to 2019
6. Conclusions
Author Contributions
Funding
Institutional Review Board Statement
Informed Consent Statement
Data Availability Statement
Conflicts of Interest
References
- Akram, Umair, Melinda Timea Fülöp, Adriana Tiron-Tudor, Dan Ioan Topor, and Sorinel Căpuşneanu. 2021. Impact of digitalization on customers’ wellbeing in the pandemic period: Challenges and opportunities for the retail industry. International Journal of Environmental Research and Public Health 18: 7533. [Google Scholar] [CrossRef]
- Altman, Edward I. 1968. Financial Ratios, Discriminant Analysis and the Prediction of Corporate Bankruptcy. Journal of Finance 23: 589–609. [Google Scholar] [CrossRef]
- Amankwah-Amoah, Joseph, Zaheer Khan, and Geoffrey Wood. 2020. COVID-19 and business failures: The paradoxes of experience, scale, and scope for theory and practice. European Management Journal 39: 179–84. [Google Scholar] [CrossRef]
- Appel, Alexandra, and Sina Hardaker. 2021. Strategies in Times of Pandemic Crisis—Retailers and Regional Resilience in Würzburg, Germany. Sustainability 13: 2643. [Google Scholar] [CrossRef]
- Azadinamin, Amir Saleh. 2012. The Bankruptcy of Lehman Brothers: Causes of Failure & Recommendations Going Forward. Zug: Swiss Management Center (SMC) University. [Google Scholar] [CrossRef]
- Bilgihan, Anil. 2016. Gen Y customer loyalty in online shopping: An integrated model of trust, user experience and branding. Computing Human Behaviour 61: 103–13. [Google Scholar] [CrossRef]
- Brodie, Roderick J., Ana Ilic, Biljana Juric, and Linda Hollebeek. 2013. Consumer engagement in a virtual brand community: An exploratory analysis. Journal of Business Research 66: 105–14. [Google Scholar] [CrossRef]
- Burt, Steve, John Dawson, and Leigh Sparks. 2003. Failure in international retailing: Research propositions. The International Review of Retail, Distribution and Consumer Research 13: 355–73. [Google Scholar] [CrossRef]
- Choi, Daeheon, Chune Young Chung, and Jason Young. 2019. Sustainable Online Shopping Logistics for Customer Satisfaction and Repeat Purchasing Behavior: Evidence from China. Sustainability 11: 5626. [Google Scholar] [CrossRef]
- Claessens, Stijn, and M. Ayhan Kose. 2013. Introduction and Description of Financial. CAMA Working Paper 06/2013. Available online: https://doi.org/10.2139/ssrn.2295201 (accessed on 7 July 2020).
- Dance, Mesak, and Sukartha Imade. 2019. Financial ratio analysis in predicting financial conditions distress in Indonesia Stock. Exchang Russian Journal of Agricultural and Socio-Economic Sciences 86: 114–31. [Google Scholar]
- Drucker, Peter. 1998. Managing for Results. London: Routledge, pp. 29–53. (In Russian) [Google Scholar]
- Ejaz, Abdullah, Ramona Birau, Cristi Spulbar, Ramona Buda, and Andrei Cosmin Tenea. 2020. The impact of domestic portfolio diversification strategies in Toronto stock exchange on Canadian textile manufacturing industry. Industria Textila 71: 215–22. [Google Scholar] [CrossRef]
- Ghasemi, Peiman, Amir Mehdiabadi, Cristi Spulbar, and Ramona Birau. 2021. Ranking of Sustainable Medical Tourism Destinations in Iran: An Integrated Approach Using Fuzzy SWARA-PROMETHEE. Sustainability 13: 683. [Google Scholar] [CrossRef]
- Giannopoulos, Georgios, and Sindre Sigbjørnsen. 2019. Prediction of Bankruptcy Using Financial Ratios in the Greek Market. Theoretical Economics Letters 9: 1114–28. [Google Scholar] [CrossRef][Green Version]
- Hayat, Muhammad A., Huma Ghulam, Maryam Batool, Muhammad Z. Naeem, Abdullah Ejaz, Cristi Spulbar, and Ramona Birau. 2021. Investigating the Causal Linkages among Inflation, Interest Rate, and Economic Growth in Pakistan under the Influence of COVID-19 Pandemic: A Wavelet Transformation Approach. Journal of Risk and Financial Management 14: 277. [Google Scholar] [CrossRef]
- J. Crew Annual Report. 2014. J. Crew Annual Report for FY Ending 2014. Available online: http://www.annualreports.com/HostedData/AnnualReportArchive/j/NYSE_JCG_2012.pdf (accessed on 7 July 2020).
- J. Crew Annual Report. 2015. J. Crew Annual Report for FY Ending 2015. Available online: http://www.annualreports.com/HostedData/AnnualReportArchive/j/NYSE_JCG_2014.pdf (accessed on 7 July 2020).
- J. Crew Annual Report. 2016. J. Crew Annual Report for FY Ending 2016. Available online: http://www.annualreports.com/HostedData/AnnualReportArchive/j/NYSE_JCG_2015.pdf (accessed on 7 July 2020).
- J. Crew Annual Report. 2017. J. Crew Annual Report for FY Ending 2017. Available online: http://www.annualreports.com/HostedData/AnnualReportArchive/j/NYSE_JCG_2016.pdf (accessed on 7 July 2020).
- J. Crew Annual Report. 2018. J. Crew Annual Report for FY Ending 2018. Available online: http://www.annualreports.com/HostedData/AnnualReportArchive/j/NYSE_JCG_2017.pdf (accessed on 7 July 2020).
- J. Crew Annual Report. 2019. J. Crew Annual Report for FY Ending 2019. Available online: http://www.annualreports.com/HostedData/AnnualReports/PDF/NYSE_JCG_2018.pdf (accessed on 7 July 2020).
- Kaka, Fakhru Abdulla. 1965. Analysis of the Causes of Small Business Failure. Ph.D. dissertation, Kansas State University, Manhattan, KS, USA. Available online: https://krex.k-state.edu/dspace/handle/2097/15231 (accessed on 11 July 2020).
- Kevin, M. Lewis. 2018. Bankruptcy Basics: A Primer. CRS Report. Available online: https://sgp.fas.org/crs/misc/R45137.pdf (accessed on 15 October 2021).
- Kleemann, Florian C., and Andreas H. Glas. 2020. Einkauf 4.0: Digitale Transformation der Beschaffung—2 Auflage. Wiesbaden: Springer. [Google Scholar]
- Kücher, Alexander, Stefan Mayr, Christine Mitter, Christine Duller, and Birgit Feldbauer-Durstmüller. 2020. Firm age dynamics and causes of corporate bankruptcy: Age dependent explanations for business failure. Review of Managerial Science 14: 633–61. [Google Scholar] [CrossRef]
- Laitinen, Erkki K., and H. Gin Chong. 1999. Early-warning system for crisis in SMEs: Preliminary evidence from Finland and the UK. Journal of Small Business and Enterprise Development 6: 89–102. [Google Scholar] [CrossRef]
- Mellahi, Kamel, Paul Jackson, and Leigh Sparks. 2002. An exploratory study into failure in successful organizations: The case of Marks & Spencer. British Journal of Management 13: 15–29. [Google Scholar]
- Norita. 2016. An Analysis of Telecommunication Vendor Company Bankruptcy Potency Based on the Problematic Financial Ratio with Altman, Springate And Zmijewski Methods. The International Journal of Organizational Innovation 8: 234–50. [Google Scholar]
- Oncioiu, Ionica, Sorinel Căpușneanu, Dan Ioan Topor, Attila Szora Tamaș, Alina-Georgiana Solomon, and Tatiana Dănescu. 2021. Fundamental Power of Social Media Interactions for Building a Brand and Customer Relations. Journal of Theoretical and Applied Electronic Commerce Research 16: 1702–17. [Google Scholar] [CrossRef]
- Ooghe, Hubert, and Sofie De Prijcker. 2008. Failure processes and causes of company bankruptcy: A typology. Management Decision 46: 223–42. [Google Scholar] [CrossRef]
- Philosophov, Leonid V., Jonathan A. Batten, and Vladimir L. Philosophov. 2006. Multi-period Bayesian Bankruptcy Prediction Using Financial Ratios and the Maturity Schedule of Long-Term Debt. Available online: http://www.aha.ru/~soliton/english/articles/MBPT.pdf (accessed on 7 December 2020).
- Qin, Xuelian, Zhixue Liu, and Lin Tian. 2020. The Strategic Analysis of Logistics Service Sharing in an e-Commerce Platform. Omega 92: 102153. [Google Scholar] [CrossRef]
- Qaiser Gillani, Durdana, Syed A. S. Gillani, Muhammad Z. Naeem, Cristi Spulbar, Elizabeth Coker-Farrell, Abdullah Ejaz, and Ramona Birau. 2021. The Nexus between Sustainable Economic Development and Government Health Expenditure in Asian Countries Based on Ecological Footprint Consumption. Sustainability 13: 6824. [Google Scholar] [CrossRef]
- Ropega, Jaroslaw. 2011. The reasons and symptoms of failure in SME. International Advances in Economic Research 17: 476–83. [Google Scholar] [CrossRef]
- Sharma, Subhash, and Vijay Mahajan. 1980. Early warning indicators of business failure. Journal of Marketing 44: 80–9. [Google Scholar] [CrossRef]
- Sheth, Jagdish. 2020. Impact of Covid-19 on consumer behavior: Will the old habits return or die? Journal of Business Research 117: 280–83. [Google Scholar] [CrossRef] [PubMed]
- Svirina, Anna. 2010. Measuring managerial efficiency: A balanced approach. Global Journal of Business Research 4: 97–104. Available online: http://www.theibfr.com/ARCHIVE/GJBR-V4-N1-2010.pdf#page=99 (accessed on 23 July 2021).
- Townsend, William R. 2010. Innovation and the value of failure. International Journal of Management and Marketing Research 3: 75–84. [Google Scholar]
- Ullal, Mithun S., Cristi Spulbar, Iqbal Thonse Hawaldar, Virgil Popescu, and Ramona Birau. 2021. The impact of online reviews on e-commerce sales in India: A case study. Economic Research-Ekonomska Istraživanja 34: 2408–22. [Google Scholar] [CrossRef]
- US Courts. 2020. Chapter 11-Bankruptcy Basics. Available online: https://www.uscourts.gov/services-forms/bankruptcy/bankruptcy-basics/chapter-11-bankruptcy-basics (accessed on 15 October 2020).
- Walter, James E. 1957. The Determination of Technical Solvency. Journal of Business 30: 30–45. [Google Scholar] [CrossRef]
- White, Michelle J. 2011. Corporate and Personal Bankruptcy Law. Annual Review of Law and Social Science 7: 139–64. [Google Scholar] [CrossRef]
- Zhang, Hongxu, Joseph Amankwah-Amoah, and Jonathan Beaverstock. 2019. Toward a construct of dynamic capabilities malfunction: Insights from failed Chinese entrepreneurs. Journal of Business Research 98: 415–29. [Google Scholar] [CrossRef]


| Retail (a) | Factory (b) | Mercantile (c) | Total (a + b + c) | Madewell (d) | Total (a + b + c + d) | |
|---|---|---|---|---|---|---|
| Fiscal 2013: | ||||||
| Beginning of year | 247 | 106 | 0 | 353 | 48 | 401 |
| New | 19 | 15 | 0 | 34 | 17 | 51 |
| Closed | −1 | 0 | 0 | −1 | 0 | −1 |
| End of year | 265 | 121 | 0 | 386 | 65 | 451 |
| Fiscal 2014: | ||||||
| Beginning of year | 265 | 121 | 0 | 386 | 65 | 451 |
| New | 17 | 18 | 0 | 35 | 20 | 55 |
| Closed | −2 | 0 | 0 | −2 | 0 | −2 |
| End of year | 280 | 139 | 0 | 419 | 85 | 504 |
| Fiscal 2015: | ||||||
| Beginning of year | 280 | 139 | 0 | 419 | 85 | 504 |
| New | 9 | 12 | 10 | 31 | 18 | 49 |
| Closed | −4 | 0 | 0 | −4 | 0 | −4 |
| End of year | 285 | 151 | 10 | 446 | 103 | 549 |
| Fiscal 2016: | ||||||
| Beginning of year | 285 | 151 | 10 | 446 | 103 | 549 |
| New | 3 | 2 | 19 | 24 | 10 | 34 |
| Converted to J. Crew Mercantile | −1 | −9 | 10 | 0 | 0 | 0 |
| Closed | −8 | −2 | 0 | −10 | 0 | −10 |
| End of year | 279 | 142 | 39 | 460 | 113 | 573 |
| Fiscal 2017: | ||||||
| Beginning of year | 279 | 142 | 39 | 460 | 113 | 573 |
| New | 1 | 1 | 0 | 2 | 8 | 10 |
| Converted to J. Crew Mercantile | −3 | 0 | 3 | 0 | 0 | 0 |
| Closed | −42 | −9 | 0 | −51 | 0 | −51 |
| End of year | 235 | 134 | 42 | 411 | 121 | 532 |
| Fiscal 2018: | ||||||
| Beginning of year | 235 | 134 | 42 | 411 | 121 | 532 |
| New | 1 | 0 | 0 | 1 | 8 | 9 |
| Closed | −32 | −2 | 0 | −35 | 0 | −35 |
| End of year | 204 | 132 | 42 | 377 | 129 | 506 |
| % Change between 2018–2019 | % Change between 2017–2018 | % Change between 2016–2017 | % Change between 2015–2016 | % Change between 2014–2015 | % Change between 2013–2014 | |
|---|---|---|---|---|---|---|
| Net Sales Revenues | 1.80 | −3.91 | −3.58 | −3.65 | 5.84 | 8.57 |
| Other Revenues | 65.56 | 47.92 | 23.14 | 48.13 | 40.16 | 64.71 |
| Total Revenues | 4.65 | −2.38 | −2.96 | −2.86 | 6.24 | 9.00 |
| Cost of goods sold, including buying and occupancy costs | 11.67 | −4.79 | −3.72 | 0.09 | 13.12 | 14.60 |
| Gross Profit | −6.90 | 1.85 | −1.59 | −7.76 | −3.50 | 1.96 |
| Selling and Administrative Expenses | −5.57 | 5.87 | −1.18 | −1.40 | 12.14 | 2.99 |
| Impairment losses | −92.38 | 1721.30 | −99.44 | 94.60 | 37786.07 | 196.99 |
| Income (loss) from operations | −100.75 | −336.02 | −103.73 | 125.67 | −334.11 | −1.48 |
| Interest expense, net | 24.42 | 39.26 | 13.69 | −6.12 | −28.66 | 2.49 |
| Benefit for income taxes | −84.02 | 1419.46 | −95.37 | 143.29 | −205.23 | 2.98 |
| Net Profit/Loss | −2.53 | 419.15 | −98.09 | 88.92 | −846.42 | −8.29 |
| % Change between 2018–2019 | % Change between 2017–2018 | % Change between 2016–2017 | % Change between 2015–2016 | % Change between 2014–2015 | % Change between 2013–2014 | |
|---|---|---|---|---|---|---|
| ASSETS | ||||||
| Current assets: | ||||||
| Cash and cash equivalents | −75.96 | −19.03 | 50.58 | −20.96 | −29.08 | 129.02 |
| Merchandise inventories, net | 33.50 | −7.00 | −15.55 | 1.24 | 3.92 | 33.26 |
| Prepaid expenses and other current assets | −8.02 | 44.18 | −2.37 | 8.02 | 7.62 | −10.03 |
| Refundable income taxes | 351.97 | −64.76 | − | − | −100.00 | −0.50 |
| Total Current Assets | 13.99 | −4.24 | −1.99 | −2.57 | −7.22 | 41.38 |
| Property and equipment, net | −15.83 | −20.09 | −9.05 | −1.53 | 7.83 | 15.73 |
| Intangible assets, net | −2.37 | −31.43 | −2.29 | −44.93 | −15.73 | 1.77 |
| Goodwill | 0.00 | 0.00 | 0.00 | −90.41 | −33.33 | 0.00 |
| Other assets | −3.29 | 2.69 | −73.66 | −12.33 | −41.33 | −48.38 |
| Total Assets | 1.30 | −16.36 | −4.91 | −48.29 | −20.37 | 5.61 |
| LIABILITIES AND STOCKHOLDERS’ DEFICIT | ||||||
| Current liabilities: | ||||||
| Accounts payable | 11.71 | 19.53 | −21.68 | 1.63 | 3.10 | 67.96 |
| Other current liabilities | 38.18 | 6.50 | 5.47 | 1.33 | 0.58 | 0.68 |
| Interest payable | 8.91 | 174.71 | 51.11 | −2.39 | −70.06 | −3.97 |
| Current portion of long-term debt | 104.66 | 0.00 | 0.00 | 0.00 | 30.58 | 0.00 |
| Total Current Liabilities | 37.75 | 16.14 | −3.72 | 2.31 | 0.58 | 29.54 |
| Long-term debt, net | −1.44 | 13.60 | −1.56 | −0.95 | −1.43 | −0.77 |
| Lease-related deferred credits, net | −9.90 | −11.22 | 0.57 | 17.53 | 19.58 | 31.82 |
| Deferred income taxes, net | −39.20 | −80.87 | −2.54 | −51.12 | −21.81 | −0.91 |
| Other liabilities | −4.08 | −30.11 | −17.42 | 22.80 | 34.15 | −17.41 |
| Total liabilities | 5.72 | 5.63 | −2.28 | −5.42 | −3.03 | 4.03 |
| Stockholders’ Deficit: | ||||||
| Additional paid-in capital | 0.02 | #DIV/0! | −100.00 | −3.51 | 0.59 | 0.58 |
| Accumulated other comprehensive loss | −24.43 | #DIV/0! | −100.00 | 67.02 | −33.79 | −24.79 |
| Accumulated deficit | 6.38 | #DIV/0! | −100.00 | 254.20 | −348.63 | 81.22 |
| Total Stockholders’ Deficit | 10.35 | 45.69 | 2.91 | −249.02 | −56.65 | 9.06 |
| Total liabilities and Stockholders’ Deficit | 1.30 | −16.36 | −4.91 | −48.29 | −20.37 | 5.61 |
| Common Size Statement 2019 | Common Size Statement 2018 | Common Size Statement 2017 | Common Size Statement 2016 | Common Size Statement 2015 | Common Size Statement 2014 | Common Size Statement 2013 | |
|---|---|---|---|---|---|---|---|
| Total Revenues | 100 | 100 | 100 | 100 | 100 | 100 | 100 |
| Cost of goods sold, including buying and occupancy costs | 66.36 | 62.18 | 63.76 | 64.26 | 62.36 | 58.57 | 55.71 |
| Gross Profit | 33.64 | 37.82 | 36.24 | 35.74 | 37.64 | 41.43 | 44.29 |
| Selling, general and administrative expenses | 33.17 | 36.76 | 33.90 | 33.29 | 32.79 | 31.07 | 32.88 |
| Impairment losses | 0.43 | 5.95 | 0.32 | 55.14 | 27.52 | 0.08 | 0.03 |
| Income (loss) from operations | 0.03 | −4.90 | 2.03 | −52.69 | −22.68 | 10.29 | 11.39 |
| Interest expense, net | 5.54 | 4.66 | 3.26 | 2.79 | 2.88 | 4.29 | 4.56 |
| Benefit for income taxes | −0.67 | −4.36 | −0.28 | −5.88 | −2.35 | 2.37 | 2.51 |
| Net Profit/ Loss | −4.83 | −5.19 | −0.98 | −49.59 | −25.50 | 3.63 | 4.31 |
| Common Size Statement 2019 | Common Size Statement 2018 | Common Size Statement 2017 | Common Size Statement 2016 | Common Size Statement 2015 | Common Size Statement 2014 | Common Size Statement 2013 | |
|---|---|---|---|---|---|---|---|
| ASSETS | |||||||
| Current Assets: | |||||||
| Cash and Cash Equivalents | 2.11 | 8.88 | 9.17 | 5.79 | 3.79 | 4.25 | 1.96 |
| Restricted cash | 1.13 | 0.00 | 0.00 | 0.00 | 0.00 | 0.00 | 0.00 |
| Accounts receivable, net | 3.30 | 1.92 | 0.00 | 0.00 | 0.00 | 0.00 | 0.00 |
| Merchandise inventories, net | 31.96 | 24.25 | 21.81 | 24.56 | 12.54 | 9.61 | 7.62 |
| Prepaid expenses and other current assets | 6.95 | 6.58 | 4.44 | 4.33 | 2.07 | 1.53 | 1.80 |
| Refundable income taxes | 0.60 | 0.13 | 0.32 | 0.00 | 0.00 | 0.40 | 0.42 |
| Property and equipment, net | 19.94 | 24.00 | 25.12 | 26.26 | 13.79 | 10.19 | 9.30 |
| Intangible assets, net | 24.67 | 25.60 | 31.22 | 30.39 | 28.53 | 26.96 | 27.98 |
| Goodwill | 8.83 | 8.10 | 7.48 | 7.12 | 38.36 | 45.81 | 48.38 |
| Other Assets | 0.50 | 0.53 | 0.43 | 1.55 | 0.92 | 1.24 | 2.54 |
| Total Assets | 100.00 | 100.00 | 100.00 | 100.00 | 100.00 | 100.00 | 100.00 |
| LIABILITIES AND STOCKHOLDERS’ DEFICIT | |||||||
| Current Liabilities: | |||||||
| Accounts Payable | 21.26 | 19.28 | 13.49 | 16.38 | 8.33 | 6.44 | 4.05 |
| Other current liabilities | 20.04 | 14.69 | 11.54 | 10.40 | 5.31 | 4.20 | 4.41 |
| Borrowings under the ABL Facility | 5.80 | 0.00 | 0.00 | 0.47 | 0.11 | 0.00 | 0.00 |
| Due to Parent | 3.07 | 3.17 | 2.32 | 0.00 | 0.00 | 0.00 | 0.00 |
| Interest payable | 1.95 | 1.82 | 0.55 | 0.35 | 0.18 | 0.49 | 0.54 |
| Current portion of long-term debt | 2.63 | 1.30 | 1.09 | 1.03 | 0.53 | 0.33 | 0.34 |
| Long-term debt, net | 136.97 | 140.79 | 103.65 | 100.13 | 52.27 | 42.23 | 44.94 |
| Lease-related deferred credits, net | 8.68 | 9.76 | 9.19 | 8.69 | 3.82 | 2.55 | 2.04 |
| Deferred income taxes, net | 1.38 | 2.30 | 10.06 | 9.81 | 10.38 | 10.58 | 11.27 |
| Other liabilities | 2.37 | 2.50 | 2.99 | 3.45 | 1.45 | 0.86 | 1.10 |
| Stockholders’ Deficit: | |||||||
| Additional paid-in Capital | 60.02 | 60.79 | 61 | 64.59 | 34.61 | 27.40 | 28.77 |
| Accumulated other comprehensive loss | −0.16 | −0.22 | 0.24 | −1.11 | −0.34 | −0.41 | −0.58 |
| Accumulated Deficit | −164.00 | −156.18 | −120.11 | −114.20 | −16.67 | 5.34 | 3.11 |
| Total Liabilities and Stockholders’ Deficit | 100.00 | 100.00 | 100.00 | 100.00 | 100.00 | 100.00 | 100.00 |
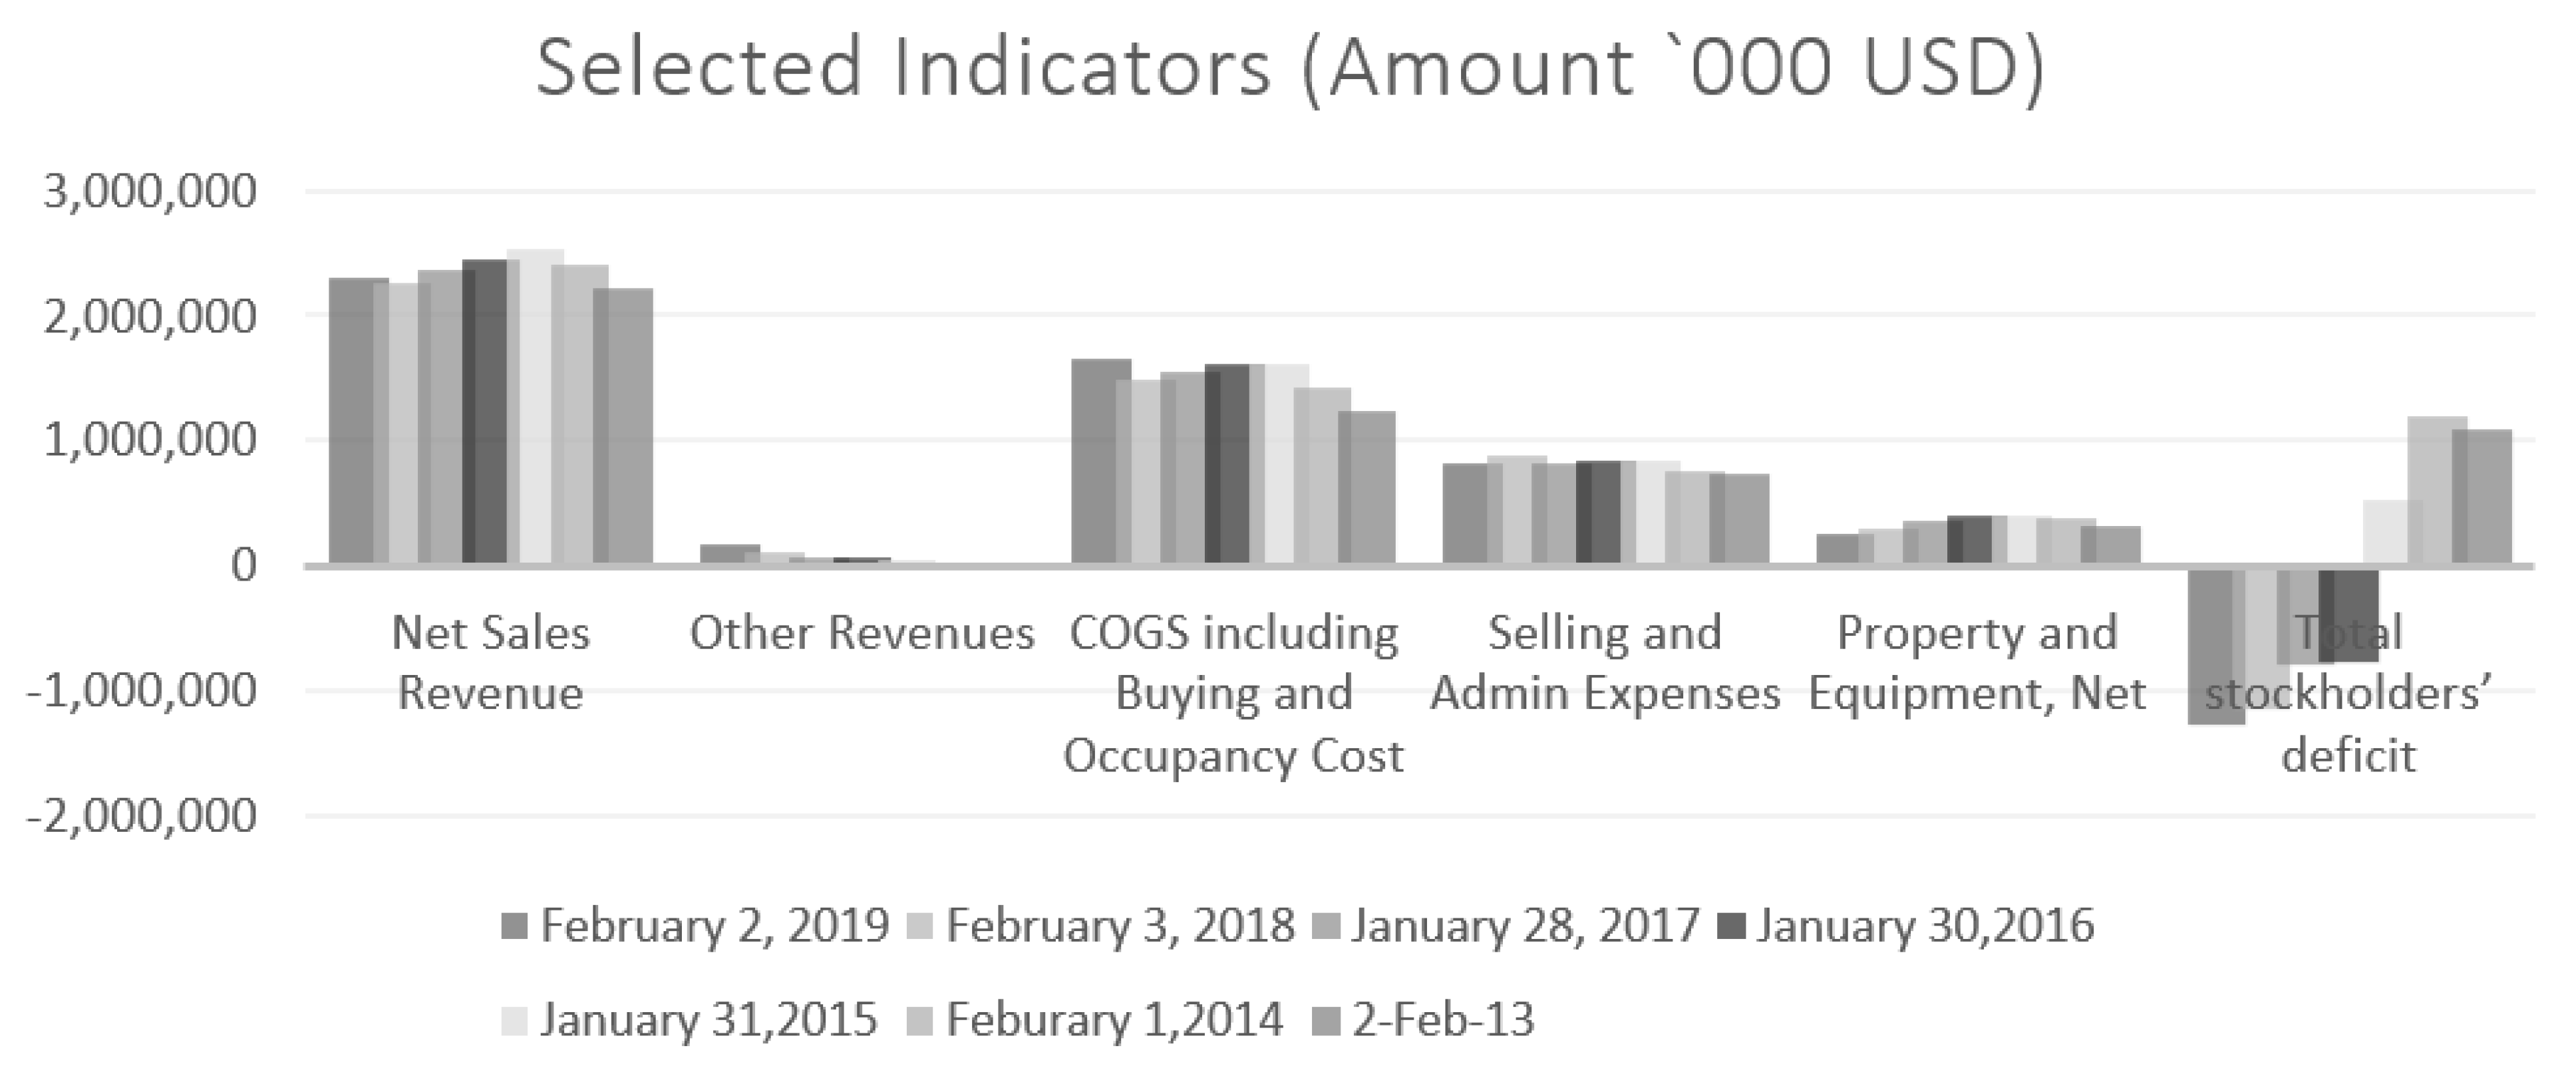
| Panel A | |||||||
| J. Crew Group, Inc. | |||||||
| Selected Financial Indicators from 2013–2019 (Base Year 2013) | |||||||
| FY Ending 2 February 2019 | FY Ending 3 February 2018 | FY Ending 28 January 2017 | FY Ending 30 January 2016 | FY Ending 31 January 2015 | FY Ending 1 February 2014 | FY Ending 2 February 2013 | |
| Net Sales Revenue | 2,308,695 | 2,267,810 | 2,360,010 | 2,447,692 | 2,540,449 | 2,400,257 | 2,210,717 |
| Other Revenues | 175,299 | 105,885 | 71,585 | 58,135 | 39,246 | 28,000 | 17,000 |
| COGS including Buying and Occupancy Cost | 1,648,330 | 1,476,064 | 1,550,305 | 1,610,256 | 1,608,777 | 1,422,143 | 1,240,989 |
| Selling and Admin Expenses | 824,031 | 872,681 | 824,290 | 834,137 | 845,953 | 754,345 | 732,439 |
| Property and Equipment, Net | 243,620 | 289,441 | 362,187 | 398,244 | 404,452 | 375,092 | 324,111 |
| Total Stockholders’ Deficit | −1,272,243 | −1,152,958 | −791,395 | −768,987 | 516,024 | 1,190,420 | 1,091,491 |
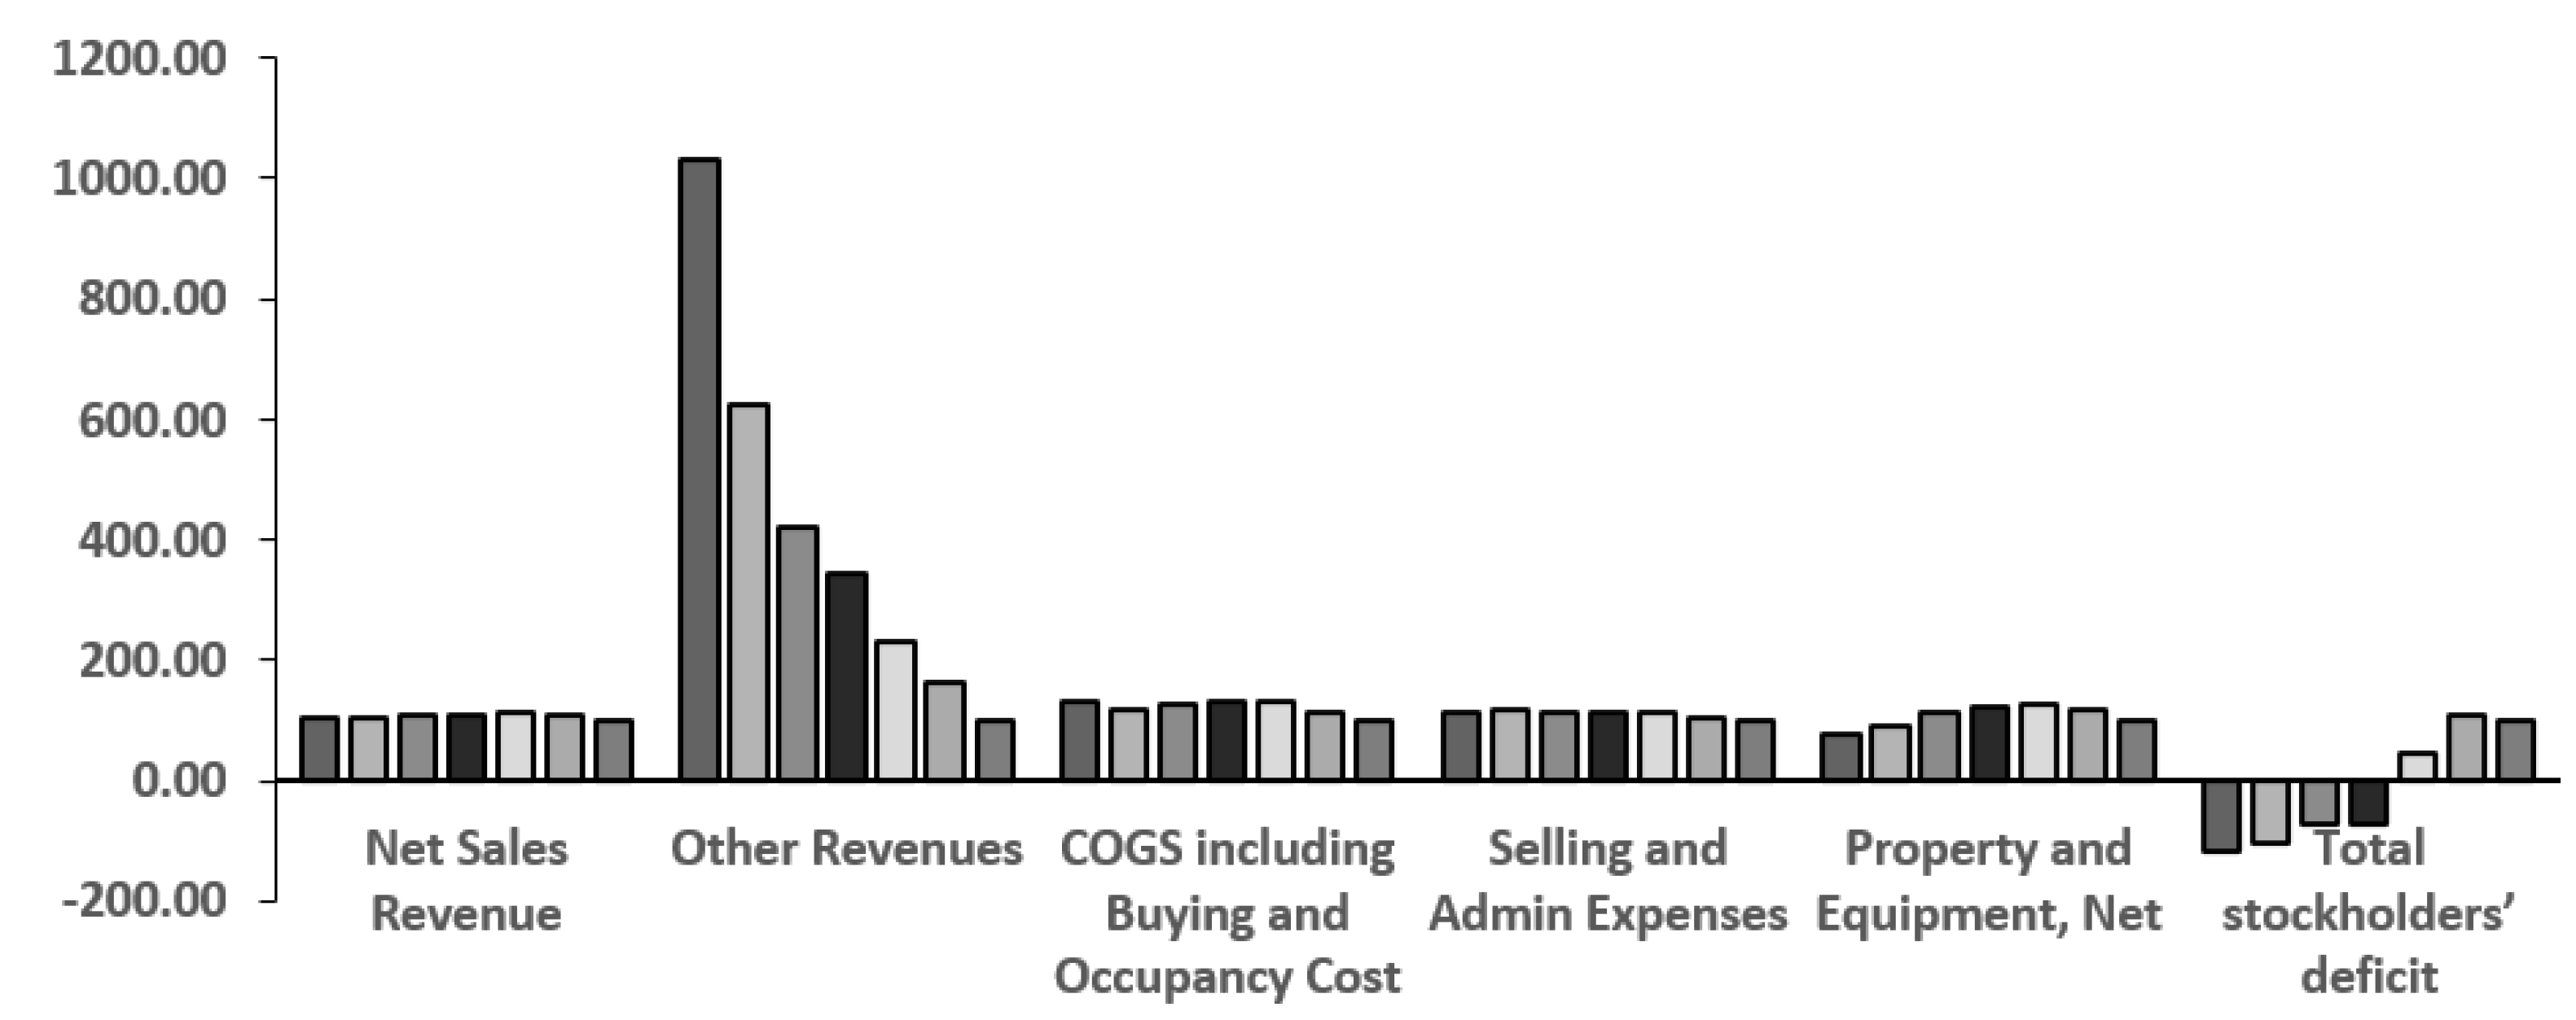
| Panel B | |||||||
| J. Crew Group, Inc. | |||||||
| Trend Analysis from 2013–2019 (Base Year 2013) | |||||||
| 2 February 2019 | 3 February 2018 | 28 January 2017 | 30 January 2016 | 31 January 2015 | 1 February 2014 | 2 February 2013 | |
| Net Sales Revenue | 104.43 | 102.58 | 106.75 | 110.72 | 114.92 | 108.57 | 100 |
| Other Revenues | 1031.17 | 622.85 | 421.09 | 341.97 | 230.86 | 164.71 | 100 |
| COGS including Buying and Occupancy Cost | 132.82 | 118.94 | 124.92 | 129.76 | 129.64 | 114.60 | 100 |
| Selling and Admin Expenses | 112.51 | 119.15 | 112.54 | 113.88 | 115.50 | 102.99 | 100 |
| Property and Equipment, Net | 75.17 | 89.30 | 111.75 | 122.87 | 124.79 | 115.73 | 100 |
| Total stockholders’ deficit | −117 | −106 | −73 | −70 | 47 | 109 | 100 |
| FYE 2 February 2013 | FYE 1 February 2014 | FYE 31 January 2015 | FYE 30 January 2016 | FYE 28 January 2017 | FYE 3 February 2018 | FYE 2 February 2019 | |
|---|---|---|---|---|---|---|---|
| Inventory Turnover | 4.67 | 4.59 | 4.46 | 4.35 | 4.51 | 4.86 | 4.83 |
| Assets Turnover | 0.63 | 0.67 | 0.77 | 1.10 | 1.60 | 1.71 | 1.90 |
| FYE 2 February 2013 | FYE 1 February 2014 | FYE 31 January 2015 | FYE 30 January 2016 | FYE 28 January 2017 | FYE 3 February 2018 | FYE 2 February 2019 | |
|---|---|---|---|---|---|---|---|
| Current Ratio | 1.26 | 1.38 | 1.27 | 1.21 | 1.23 | 1.02 | 0.84 |
| Quick Ratio | 0.26 | 0.41 | 0.26 | 0.20 | 0.33 | 0.22 | 0.13 |
| FYE 2 February 2013 | FYE 1 February 2014 | FYE 31 January 2015 | FYE 30 January 2016 | FYE 28 January 2017 | FYE 3 February 2018 | FYE 2 February 2019 | |
|---|---|---|---|---|---|---|---|
| Interest Coverage Ratio | 2.49 | 2.40 | −7.87 | −18.91 | 0.62 | −1.05 | 0.01 |
| Debt Equity Ratio | 1.45 | 1.32 | 3.01 | −2.00 | −1.91 | −1.49 | −1.40 |
Publisher’s Note: MDPI stays neutral with regard to jurisdictional claims in published maps and institutional affiliations. |
© 2021 by the authors. Licensee MDPI, Basel, Switzerland. This article is an open access article distributed under the terms and conditions of the Creative Commons Attribution (CC BY) license (https://creativecommons.org/licenses/by/4.0/).
Share and Cite
Bhavani, G.; Agrawal, R.; Mendon, S.; Spulbar, C.; Birau, R. An Empirical Investigation into Alarming Signals Ignored by the U.S. Multi-Brand Retailer J. Crew Incorporation during COVID-19 Pandemic. J. Risk Financial Manag. 2021, 14, 539. https://doi.org/10.3390/jrfm14110539
Bhavani G, Agrawal R, Mendon S, Spulbar C, Birau R. An Empirical Investigation into Alarming Signals Ignored by the U.S. Multi-Brand Retailer J. Crew Incorporation during COVID-19 Pandemic. Journal of Risk and Financial Management. 2021; 14(11):539. https://doi.org/10.3390/jrfm14110539
Chicago/Turabian StyleBhavani, Ganga, Reena Agrawal, Suhan Mendon, Cristi Spulbar, and Ramona Birau. 2021. "An Empirical Investigation into Alarming Signals Ignored by the U.S. Multi-Brand Retailer J. Crew Incorporation during COVID-19 Pandemic" Journal of Risk and Financial Management 14, no. 11: 539. https://doi.org/10.3390/jrfm14110539
APA StyleBhavani, G., Agrawal, R., Mendon, S., Spulbar, C., & Birau, R. (2021). An Empirical Investigation into Alarming Signals Ignored by the U.S. Multi-Brand Retailer J. Crew Incorporation during COVID-19 Pandemic. Journal of Risk and Financial Management, 14(11), 539. https://doi.org/10.3390/jrfm14110539