
Financial Stability of European Insurance Companies during the COVID-19 Pandemic


Accounting Departament, Kozminski University, ul. Jagiellońska, 5903-301 Warsaw, Poland
J. Risk Financial Manag. 2021, 14(6), 266; https://doi.org/10.3390/jrfm14060266
Submission received: 28 April 2021
/
Revised: 3 June 2021
/
Accepted: 8 June 2021
/
Published: 12 June 2021
(This article belongs to the Special Issue Banking during the COVID-19 Pandemia)
Abstract
:The European Insurance and Occupational Pensions Authority suggests that as the coronavirus disease 2019 (COVID-19) pandemic has caused significant disruption to the economy, businesses, and people’s lives, national supervisory authorities should mitigate the pandemic’s impact on the European insurance sector. The functioning of insurance companies is in danger as they must balance a drastic increase in the number of claims with their capital and solvency stability. In this study, we evaluate the effects of the COVID-19 pandemic on insurance companies using European insurance companies’ financial statement data from 2010 to 2020. The results unambiguously demonstrate that the pandemic has negatively affected the functioning of the insurance sector. In particular, the return on assets decreased in German and Italian insurance companies during the pandemic. Furthermore, the solvency ratio decreased in the Belgian, French, and German insurance sectors. Conversely, the Polish insurance sector was unaffected. Moreover, we did not find any effects on the Z-score ratio in our sample. Lastly, the value of receivables owed to Belgian insurance companies increased. Based on this evidence, we argue that European legislators should discuss how to manage the probable financial problems of insurance companies during the COVID-19 pandemic.
1. Introduction
The coronavirus disease 2019 (COVID-19) pandemic has significantly affected people’s lives worldwide as well as the economy. Consequently, concerns have been raised regarding the solvency of insurance companies. Therefore, the European Insurance and Occupational Pensions Authority (EIOPA) has been working in close cooperation with national supervisory authorities to mitigate the pandemic’s impact on the insurance and occupational pensions sectors in Europe. In line with this, Gabriel Bernardino, EIOPA’s chairman, stated the following: “The insurance sector must deal with challenging market conditions and maintain operations, while at the same time protecting employees and policyholders” (EIOPA 2020a). Further, the pandemic may have seriously affected the operation of European insurance companies, placing them in the delicate position of having to balance a large volume of claims with their capital and solvency stability (Karlsson 2020). Thus, the risk exposure of the European insurance sector has increased as a result of the pandemic. Market developments point to a “double-hit” scenario that may negatively affect insurers’ assets and liabilities, as reported by previous stress test exercises (Moody’sAnalytics 2020). The recent negative market developments in the context of the pandemic mean that we may expect a decrease in assets relative to liabilities, driven by declines in asset liquidity and an increase in overdue liabilities (EIOPA 2020b).
In this study, we evaluate the effects of the COVID-19 pandemic on insurance companies. We analyze data from 27 Belgian, French, German, Italian, and Polish listed insurance companies (826 observations in total) corresponding to the years 2010–2020. This includes quarterly data from before and during the pandemic.
We employ fixed-effects estimation with standard errors clustered at the country level. We use return on assets (ROA) as the dependent variable. As a measure of financial institutional risk, we use the Z-score. We also check the pandemic’s impact on the solvency ratio and the book value of account receivables of insurance companies.
The results unambiguously demonstrate that the COVID-19 pandemic has negatively affected the European insurance sector’s functioning. We argue that the lockdown imposed in most European countries negatively impacted the insurance sector. This is very distressing information because insurance companies are important for the stability of financial systems, as they are large investors in financial markets, while insurers safeguard the financial stability of households and firms by insuring their risks (European Central Bank 2009). Therefore, it is especially important to analyze how the COVID-19 pandemic has affected insurance companies in Europe. Preliminary analyses indicate that the risk exposure of the European insurance sector increased as the outbreak of COVID-19 strongly affected European citizens’ lives, the financial sector, and all economic activities (EIOPA 2020b). This study will examine whether the COVID-19 pandemic has negatively impacted the insurance sector.
Academic literature on the effects of the COVID-19 pandemic on the insurance sector is limited. Babuna et al. (2020) describe the impact of COVID-19 on the insurance industry in Ghana, noting that insurance companies are reporting poorer financial results. Shevchuk et al. (2020) found that COVID-19 may be the catalyst for innovation in insurance, as far-reaching customer relationship changes in the Ukrainian insurance market have occurred. Most importantly, as the COVID-19 pandemic has caused direct adverse effects on the global economy, researchers have called for papers on the pandemic’s effect on the insurance sector (Goodell 2020).
This research makes several important contributions to the literature that may be relevant to policymakers. It contributes to the growing literature on the impact of the COVID-19 pandemic on the economy, as the pandemic has drawn significant attention from financial economists. Numerous papers have investigated COVID-19′s impact on financial markets (Corbet et al. 2020; Halling et al. 2020; Nozawa and Qiu 2020; Yilmazkuday 2020) or the effects of COVID-19 on the stock returns of insurance companies (Farooq et al. 2021). However, to the best of our best knowledge, this is the first study to comprehensively analyze the effect of the COVID-19 pandemic on the performance of European insurance companies.
The remainder of this paper proceeds as follows. Section 2 presents the literature review and hypothesis development. Section 3 introduces the dataset and presents the empirical methodology. Section 4 and Section 5 present the summary statistics and results, respectively. Section 6 describes the robustness check of the results. Section 7 discusses the results. Section 8 presents the conclusions of this paper.
2. Literature Review and Hypothesis Development
A well-developed insurance industry is fundamental to a nation’s economic development. The financial performance of insurance companies has direct implications on the public, extending from policyholders to shareholders, from company employees to intermediaries, and from regulatory authorities to potential investors. Insolvency within the insurance industry has become an issue of public debate and concern. Further, the identification of potentially troubled firms has become a major regulatory research objective (May 2007). This is because the insurance sector in the Eurozone manages more than seven trillion in assets in Euros, it directly employs approximately one million people (in addition to many outsourced employees and independent intermediaries) and has nearly every household and firm as a client (European Central Bank 2009). The findings of Din et al. (2020) show that there exists a positive and significant relationship between life insurance and economic growth in the long-term and short-term for all analyzed countries. Additionally, the relationship between insurance and economic development has increased in recent years due to the greater share of the insurance market in the financial sector, as evidenced by the fact that since 1950 the global insurance market has been growing at a rate of over 10% per year, which significantly exceeded the rate of global economic growth (Ostrowska-Dankiewicz and Simionescu 2020). Furthermore, just as other pandemics in the past (e.g., SARS, Spanish influenza, etc.) have had negative economic effects on countries, the current COVID-19 pandemic might cause the beginning of another economic crisis (Oravský et al. 2020). In addition, given the long-term nature of insurance, and high level of integration of the global financial system (Chevallier 2020), insurance companies are important long-term investors in global financial markets.
Extensive discussions about the performance of insurance companies gained attention following the failure of American International Group (AIG) insurance company in 2008 (McDonald and Paulson 2015), and as a result of the generalized stress in the sector caused by the financial crisis (Koijen and Yogo 2015). Traditionally, insurance companies have been considered less risky than banks because they are less exposed to liquidity risk (Caporale et al. 2017). However, the increasing interactions among the insurance sector, financial markets, and other financial intermediaries, as well as the financial innovation, globalization, and deregulation of the financial system, have made the operations of financial intermediaries over the last decades more complex and potentially riskier (Sharpe and Stadnik 2007). Furthermore, Baluch et al. (2011) found that life insurers, global composite insurers, global reinsurers, and other European insurers were the most affected and had the worst performance during the 2007–2008 crisis. They also reported that the crisis affected certain lines of insurance to a greater extent, including financial guarantee, credit, and liability insurers, as well as those that deviated from their core insurance business, such as AIG and Swiss Re. Moreover, research shows that the financial crisis 2007–2008 caused financial guarantee insurers to enter financial distress, with negative effects spreading to entities and markets that relied on this insurance (Drake et al. 2017). Therefore, as the 2007–2008 crisis negatively affected insurers, consumers and business, in the euro area, compared with other regions, were the most pessimistic about the impact of COVID-19 pandemic (Teresiene et al. 2021), we formulate the following hypothesis:
Hypothesis 1 (H1).
Insurance companies’ performance is worse during a pandemic, rather than before it.
The financial crisis of 2007–2008 tested the financial stability of financial institutions and other companies. Kestens et al. (2012) showed that the value of trade receivables and payables were affected by the financial crisis. Here, we investigate whether the value of receivables of insurance companies also increases during a turbulent period such as the COVID-19 pandemic.
According to Brennan et al. (2013), insurance companies, as credit-bearing institutions, may fail to pay claims if receivables are not managed adequately. This indicates that mechanisms for collecting debts should be the focus of the management of insurance companies. Therefore, appropriate receivable management may be particularly important. Studies shows that since receivables are a significant part of working capital management, they impact firm performance (Tauringana and Afrifa 2013). Moreover, several studies that explore the impact of receivable management on profitability all point out that proper receivables management positively influences the profitability of the companies (Lazaridis and Tryfonidis 2006; Samiloglu and Demirgunes 2008). Researchers also present a positive influence of decreasing the time duration for collecting receivables on companies’ performance (García-Teruel and Martínez-Solano 2007; Raheman and Nasr 2007; Nwude et al. 2018). Moreover, a high level of receivables might characterize companies with the aggressive strategy (Zimon 2020a; Zimon and Dankiewicz 2020). Therefore, reducing receivables from customers is a feature of the conservative strategy (Zimon 2020b).
However, there remains a view that the company has limited options for its management because the receivables are more affected by external conditions of the economy (Zhong 2014). Furthermore, according to data from Thomson Reuters, we see that commercial insurance prices increased on average in the first quarter of 2020 by 14%, which is the strongest increase since 2012. Moreover, the latest research on insurance sector shows that insurers seems to be focused on optimizing internal costs rather than improving their value delivery to customers (Pugnetti and Seitz 2021). On the other hand, Zimon and Tarighi (2021) shows that some companies during the COVID-19 pandemic might try to attract more new customers in the market by increasing the due date of accounts receivable so they can improve their sales performance, and also reduce the liabilities turnover to be able to work with more suppliers in the market. Therefore, we formulate the following hypothesis:
Hypothesis 2 (H2).
Insurance companies have a larger receivables position during a pandemic, rather than before it.
3. Sample, Data Collection and Methodology
3.1. Sample and Data Collection
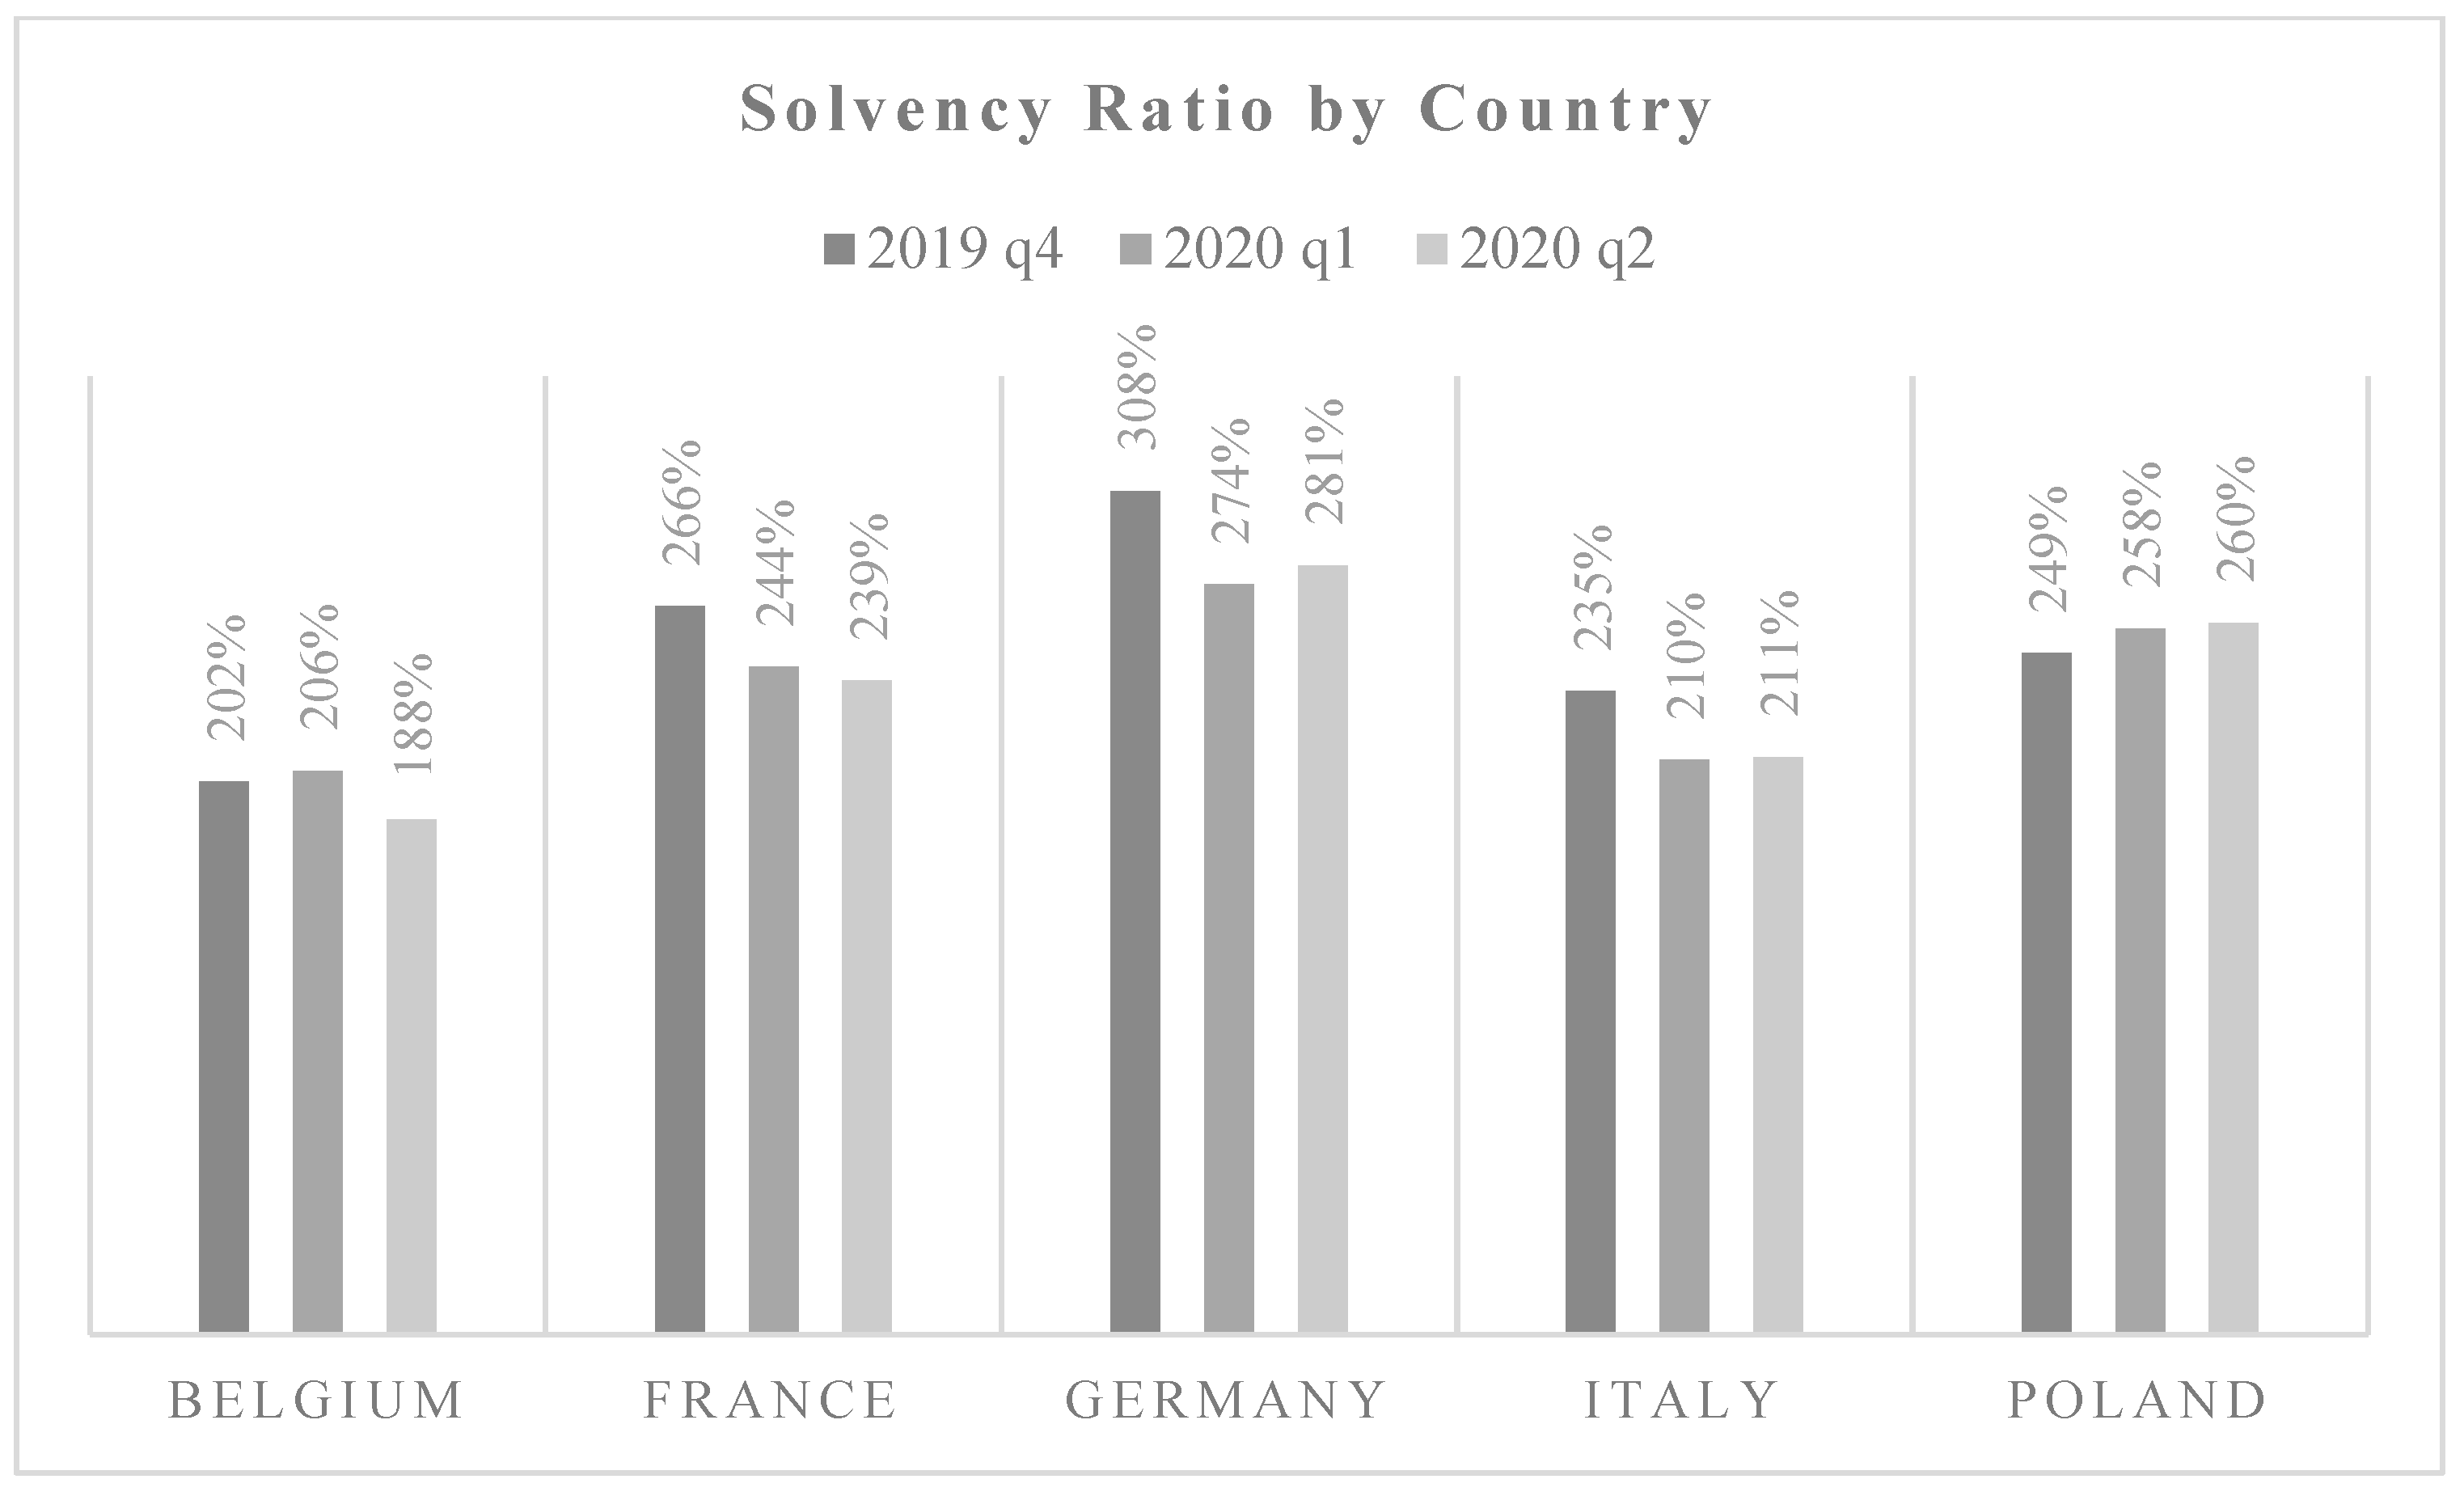
We use quarterly financial data extracted from the financial statements of European (Belgian, French, German, Italian, and Polish) insurance companies. Data were retrieved from Bloomberg, comprising the period from 2010 to 2020. This means that both pre-pandemic and pandemic quarters are considered. We collect data from insurance companies in these five countries as business interruption of insurance coverage and insurance companies’ problems were topics of legislative debate at the beginning of the lockdown in Europe (around March 2020). First, governments in these countries were in discussions or had proposed legislation that required insurers who provide business interruption insurance coverage to also cover COVID-19 related claims, despite virus exclusions in many policies. Moreover, in these countries, legislators discussed allowing the insurers and reinsurers to consider schemes that transferred insurance risk to a government. Later on, EIOPA, in the Supervisory Statement on the Solvency II recognition of schemes based on reinsurance with regard to COVID-19 and credit insurance, included the recommendation that all European competent authorities should allow insurers and reinsurers to consider schemes that transfer insurance risk to a Member State’s government based on the Temporary Framework, while having the same consequences as reinsurance, as defined in the Directive 2009/138/EC (Solvency II) (EIOPA 2020d). Consequently, the sample consists of 27 listed companies with 826 corresponding observations. Figure 1 shows how the average solvency ratio of the analyzed insurance companies has changed (EIOPA 2021).
The reduction in solvency ratio is not observed across all countries. Across the whole European Union, in the first quarter, the average solvency ratio across all insurance undertakings reduced by 17% to 225%. By Q2 of 2020, the solvency ratio increased slightly to 226%. There was a considerable difference between different countries. In Belgium, France, Germany, and Italy, we observed a decreasing trend.
3.2. Methodology
To investigate the first research question, we aim to identify whether the COVID-19 pandemic impacted the insurance sector negatively. We use the following model:
(1) Performancejt = β0 + β1 COVID-19 pandemict + β2 Sizejt + β3 FinLeveragejt + β4 Profitabilityjt + β5 Liquidityjt + β6 EquityRatiojt + β7 CapitalRatiojt + εjt
β0 = Intercept term
β1 = Coefficient for the variable from a given hypothesis (H1)
β2–β7 = Coefficients for the control variables
j = Firm’s identifier
t = Time as year
εjt = Error term
To test the first hypothesis, the dependent variable (Performance) is determined using ROA as the dependent variable. ROA shows how profitable a company’s assets are in generating revenue. It indicates the company’s capital intensity. Furthermore, ROA is comparable for companies in a similar industry (Boyjoo and Ramesh 2017; Kusi et al. 2019).
Next, we use a Z-score. Despite the most sophisticated regulatory regime established in Solvency II, analysts should consider other less complex indicators of soundness of insurers. The Z-score measure, which has traditionally been used as a proxy of individual risk for the banking sector (Hryckiewicz 2014; Laeven and Levine 2009; Altunbas et al. 2018), may also be a useful tool for the insurance sector (Gavira-Durón et al. 2020; Moreno et al. 2019). The Z-score relates the insurers’ capital level to variability in its ROA, revealing how much variability in returns can be absorbed by capital without the bank becoming insolvent (Li et al. 2017). This ratio is predictive of the bankruptcy risk that financial institutions are exposed to. Its high accuracy level has been demonstrated by previous empirical studies (Altman et al. 2013; Lepetit and Strobel 2013).
To investigate the second research question, that is, whether there has been an increase in receivables held by insurance companies because of the COVID-19 pandemic, we use the following model:
(2) Receivables = β0 + β1 COVID-19 pandemict + β2 Sizejt + β3 FinLeveragejt + β4 Profitabilityjt + β5 Liquidityjt + β6 EquityRatiojt + β7 CapitalRatiojt + εjt
β0 = Intercept term
β1 = Coefficient for the variable from a given hypothesis (H2)
β2–β7 = Coefficients for the control variables
j = Firm’s identifier
t = Time as year
εjt = Error term
To test the second hypothesis, the dependent variable (Receivables) is determined by using the value of receivables at the end of the quarter. We use three measures: receivables measured by the natural logarithm of the book value of receivables at the end of the quarter, receivables to total assets ratio, and receivables growth. Receivables show an asset account on the balance sheet representing money due to an insurance company in the short term.
Our main explanatory variable intends to measure the COVID-19 pandemic’s impact on insurance companies. To test this effect, we use a dummy variable (COVID-19 pandemic) that takes the value of one for the quarters during the pandemic (Q1of 2020 and Q2 of 2020), and zero otherwise (for other quarters). A dummy variable that points to the moment of the significant event has been used in previous studies, such as for introducing new regulation (Devereux et al. 2019) or for the COVID–19 pandemic (Chen et al. 2020; Ferraresi et al. 2020; Hauser et al. 2021). Table 1 summarizes the other variables presented in both models.
To investigate both hypotheses, we run panel data analysis. We use a fixed-effects model to run the regression with fixed model parameters. This model allows us to capture the unobserved heterogeneity among companies with respect to the policies, standards, or financial reporting changes of the analyzed companies (Wooldridge 2013). The advantage of using the fixed-effect model is to control for firms’ unobserved individual characteristics. The model choice under the current specification is dictated by Hausman’s (1978) specification test. Moreover, we are aware of other regulatory changes that occurred during the analyzed period as well as anomalies in financial markets (Podgórski 2018). Therefore, we also modify the standard errors in all regressions to be clustered at the country level for analyzing the full sample. When we analyze each country separately, we cluster errors at the company level. Following Petersen (2009), we assume that clustered standard errors are unbiased, as they account for the residual dependence created by the institution effect. Furthermore, in panel datasets, clustered standard errors correctly account for the dependence in the data and produce unbiased estimates.
4. Summary Statistics
Table 2 presents summary statistics of the financial statements of insurance companies for the entire sample period (2010–2020).
The average value of ROA during the investigated period was 1.821%, the Z-score ratio was 17.377, and the average Solvency II ratio was 190.317%. We only consider the data for Belgium, France, Germany, Italy, and Poland; therefore, this is the average for all these countries.
5. Results
Here, we perform several tests to see if the COVID-19 pandemic influences the performance of European insurance companies in Europe. Table 3 presents the regression results for the entire sample.
The estimation results demonstrate that the COVID-19 pandemic negatively affected the insurance sector’s stability. According to Table 3, the COVID-19 pandemic decreased the average insurance’s ROA 0.574 times, and these results are statistically significant. Moreover, R2 of model (1) shows that independent variables explain about 60.2% of the variation in ROA. Therefore, lockdowns because of the COVID-19 pandemic negatively impacted the insurance sector, which confirms the first hypothesis. However, we did not see the effect of the COVID-19 pandemic on the Z-score ratio. We noticed that an insurer’s capital is conditioned to meet its obligations, as the correlation between the COVID-19 pandemic and Solvency II ratio was positive and statistically significant. However, R2 of model (3) shows that independent variables explain about 10.01% of the variation in the Solvency II ratio.
Following previous research, we want to check if trade receivables are affected because of the COVID-19 pandemic (Kestens et al. 2012). Therefore, in Table 4 below, we present the influence of the COVID-19 pandemic on receivables (model 1), receivables to total asset ratio (model 2), and receivables’ growth (model 3):
The estimation results demonstrate that the COVID-19 pandemic increased the value of receivables owed to the insurance companies. According to Table 4, the COVID-19 pandemic increased the value of book value receivables, and these results are statistically significant. Therefore, we confirm the second hypothesis, which states that the value of receivables would increase because of the COVID-19 pandemic. However, due to the value of R2, we can conclude that independent variables of all above models explain less than 30% of the variation in dependent variables.
Based on the data shown in Figure 1, we can observe that the solvency ratio in each country reacted differently. Therefore, we present the regression results for each country: Belgium, France, Germany, Italy, and Poland.
5.1. Belgium
In this subsection, we perform several tests to see if the COVID-19 pandemic influenced the performance of Belgian insurance companies. Table 5 presents the regression results.
The estimation results demonstrate that the COVID-19 pandemic negatively affected the Belgian insurance sector’s stability. The pandemic did not impact the average Belgian insurer’s ROA or Z-score ratio. However, the Solvency II ratio decreased. Additionally, model (3) shows that independent variables explain about 75.5% of the variation in Solvency II ratio. Moreover, the value of receivables owed to the insurance companies increased. According to the R2 of model (4), independent variables explain about 81.7% of the variation in Solvency II ratio.
5.2. France
In this subsection, we perform several tests to see if the COVID-19 pandemic influenced the performance of French insurance companies. Table 6 presents the regression results.
The estimation results demonstrate that the COVID-19 pandemic negatively affected the French insurance sector’s stability. While the pandemic did not impact the average French insurer’s ROA, Z-score and value of receivables, the Solvency II ratio decreased significantly by 13%. Furthermore, model (3) shows that independent variables explain about 85.9% of the variation in Solvency II ratio.
5.3. Germany
In this subsection, we perform several tests to see if the COVID-19 pandemic influenced the performance of German insurance companies. Table 7 presents the regression results.
The estimation results demonstrate that the COVID-19 pandemic had a harmful effect on the German insurance sector’s stability. The pandemic impacted the average German insurer’s ROA, which decreased 0.761 times. These results are statistically significant. Furthermore, this tendency was observable for 65% of the sampled German companies. However, we found no impact on their Z-score ratio. Still, the Solvency II ratio decreased by 32%. Moreover, model (3) shows that independent variables explain about 65.5% of the variation in Solvency II ratio in Germany. Lastly, there is no impact on the value of receivables owed to the insurance companies.
5.4. Italy
In this subsection, we perform several tests to see if the COVID-19 pandemic influenced the performance of Italian insurance companies. Table 8 presents the regression results.
The estimation results demonstrate that the COVID-19 pandemic negatively and significantly affected the ROA of Italian insurance companies. The average Italian insurer’s ROA decreased 2.002 times. R2 of model (1) shows that independent variables explain about 72.1% of the variation in the ROA. However, we did not find any effect on the Z-score ratio, the Solvency II ratio, and the value of receivables owed to the insurance companies.
5.5. Poland
In this subsection, we perform several tests to see if the COVID-19 pandemic influenced the performance of Polish insurance companies. Table 9 presents the regression results.
The estimation results demonstrate that the COVID-19 pandemic did not affect the Polish insurance sector’s stability. Furthermore, the Solvency II ratio was positive and statistically significant, and of model (3) shows that independent variables explain about 66.9% of the variation in Solvency II ratio. This indicates that the insurer had sufficient capital to meet its obligations.
6. Robustness Check
To check the robustness of our main findings, we verified that outliers did not affect our results (and the conclusions in terms of hypotheses verification). We did this by ranking the values of the variables with the most asymmetric distributions (Size, FinLeverage, and EquityRatio) and constructed models with these ranked variables instead of the unranked values included in the models. We report our results in Appendix A and Appendix B. We found that the regression results are consistent with our main findings.
7. Discussion
The recent recognition of insurers by policymakers, who state that insurers are systematically important, further underlines insurers’ importance in the financial system. Recently, the International Association of Insurance Supervisors finalized and later updated its assessment methodology and policy framework for Global Systemically Important Insurers, or G-SIIs (FSB 2016). The Financial Stability Board subsequently published a list of nine identified G-SIIs that will be subjected to measures to enhance supervision, promote effective resolutions, and to achieve higher loss absorption capability. Banks and insurers are presently the only two sectors in the financial system for which such policies exist globally (Engle et al. 2015). Therefore, the contagion effects from the failures of insurers in the insurance sector may have a potential to disrupt the financial system and negatively impact the economy (Das et al. 2003). Therefore, the soundness of insurance firms is of major importance not only for the welfare of the insurance sector and its various stakeholders (Pasiouras and Gaganis 2013) but for the economy’s stability as a whole.
Meanwhile, actions to prevent the spread of COVID-19 have stifled production, consumption, recreation, travel, and overall well-being, leading to global socioeconomic disruption (Evans 2020). In this research, we show that the current economic situation caused by the COVID-19 pandemic has significantly affected the functioning of insurance companies in Europe. We show that the pandemic has negatively affected the European insurance sector’s stability, decreasing the average insurer’s ROA and Solvency II ratio for the full sample. Further country-level analyses allow us to identify the pandemic’s effect on individual countries. We observe that ROA decreased in German and Italian insurance companies during the pandemic. Meanwhile, the Solvency ratio decreased in the Belgian, French, and German insurance sectors. However, the Polish sector was not affected by the pandemic.
Similar to previous crises, we expected that the Z-score would increase significantly, however, we did not find any effect of the COVID-19 pandemic on the Z-score ratio. Moreover, our estimation results demonstrate that the pandemic increased the value of receivables owed only among Belgian insurance companies. However, in line with EIOPA’s reports, insurance companies should focus more on liquidity to mitigate losses during crises, such as the COVID-19 pandemic (EIOPA 2020c).
We also found that the Solvency II ratio decreased significantly in Belgium, France, and Germany. However, these insurers are generally well capitalized. For most insurers, solvency ratios will likely decrease because volatile financial markets can impact insurers’ assets and liabilities. However, a decrease in solvency ratios does not mean that there is a big problem in the insurance industry. It is the regulators’ reaction that is important when the solvency ratios decrease to such an extent that some insurance companies will reach regulatory action levels. First, regulators should identify the reason for this decrease. These reasons may include: (1) a decrease in interest rates, as low rates for both government and corporate bonds are being observed worldwide; (2) downgraded bonds; and (3) equity market volatility, which we assume is the reason for the decrease in solvency ratios during the first quarter of 2020 (EIOPA 2020c).
8. Conclusions
The results unambiguously demonstrate that the COVID-19 pandemic has negatively affected the European insurance sector’s functioning, as evidenced by a decrease in the average insurer’s ROA. Furthermore, a country-level analysis revealed that ROA decreased in German and Italian insurance companies during the pandemic. Further, solvency ratio decreased in the Belgian, French, and German insurance sectors. We were unable to identify the pandemic’s effect on the Z-score ratio in our sample. Moreover, our estimation results demonstrate that the pandemic increased the value of receivables in all countries. However, only the increase in receivables owed to Belgian insurance companies was statistically significant. We also found that the Polish sector was not affected by the pandemic.
Considering this, even though our results show that the COVID-19 pandemic has not significantly affected the solvency of insurance companies, regulators should consider implementing interventions if solvency ratios decrease enough for some companies to reach regulatory action levels.
Therefore, our research results are of particular interest to regulators, as they show that Belgium, France, and Germany may have solvency problems in the future. Conversely, legislators’ aim should be to help insurance companies. For instance, an insurer’s default can cause financial distress in this sector, as exemplified by the failure of HIH Insurance Company (the second-largest non-life insurer in Australia) in 2001, which led to the bankruptcy of some companies that had purchased insurance coverage from HIH. An insurer’s default or the withdrawal of insurance coverage can also make it highly difficult for firms to conduct transactions in which insurance coverage is needed (Rochet et al. 2007).
This study has some limitations. First, we focused only on quarterly data and some insurance companies may be exempt from quarterly reporting. This means that the sample of insurance companies may not be identical between annual and quarterly publications. For consistency, we analyzed all ratios were analyzed over the following reporting periods: 2019 Q4, 2020 Q1, and 2020 Q2, rather than YE2019, 2020 Q1, and 2020 Q2. Therefore, it might be necessary to analyze yearly data in future research. Second, we only used a dummy for the pandemic as the main study variable. In future studies, it might be necessary to capture another effect of the pandemic-related turbulence.
Funding
This research received no external funding. The APC was funded by Kozminski University.
Institutional Review Board Statement
Not applicable.
Informed Consent Statement
Not applicable.
Data Availability Statement
The data presented in this study are available on request from the corresponding author. The data are not publicly available due to agreement with data provider.
Conflicts of Interest
The authors declare no conflict of interest.
Appendix A. Has the COVID-19 Pandemic Impacted Negatively on the Insurance Sector?

| ROA | Z-Score | Solvency II Ratio | |
|---|---|---|---|
| VARIABLES | (1) | (2) | (3) |
| COVID-19 pandemic | −0.585 ** | 4.203 | 4.946 * |
| (0.280) | (6.313) | (10.38) | |
| SizeRank | −0.006 *** | −0.00141 | 0.338 *** |
| (0.00164) | (0.0156) | (0.0645) | |
| FinLeverageRank | −0.002 | −0.0113 | −0.228 *** |
| (0.002) | (0.0219) | (0.0484) | |
| Profitability | 0.535 *** | 3.588 * | −2.734 |
| (0.103) | (1.906) | (3.857) | |
| Liquidity | 26.18 *** | −26.40 | 18.34 |
| (2.877) | (49.49) | (355.7) | |
| EquityRatioRank | 0.005 *** | −0.00131 | 0.207 *** |
| (0.002) | (0.0216) | (0.0550) | |
| CapitalRatio | −1.435 * | 4.572 | −125.2 *** |
| (0.795) | (9.573) | (35.33) | |
| Constant | −0.249 | 7.143 | 40.89 |
| (1.451) | (21.24) | (52.59) | |
| Observations | 826 | 788 | 194 |
| R2 | 0.449 | 0.155 | 0.287 |
| Country FE | YES | YES | YES |
Note: The symbols ***, **, and * represent statistical significance at 1%, 5%, and 10%, respectively.
Appendix B. Have the Value of Receivables Increases Because of the COVID-19 Pandemic?
| Receivables | Receivables to Total Assets | Receivables Growth | |
|---|---|---|---|
| VARIABLES | (1) | (2) | (3) |
| COVID-19 pandemic | 10.830 * | 0.013 * | 341.3 ** |
| (10.312) | (0.017) | (150.4) | |
| SizeRank | 0.004 * | 0.001 | 3.458 |
| (0.002) | (0.001) | (2.600) | |
| FinLeverageRank | −0.005 *** | −0.001 | −1.512 |
| (0.001) | (0.001) | (1.101) | |
| Profitability | −0.142 *** | −0.013 ** | −88.85 * |
| (0.045) | (0.005) | (50.31) | |
| Liquidity | 2.079 | 0.403 | 437.8 |
| (2.578) | (0.449) | (506.9) | |
| EquityRatioRank | 0.001 ** | 0.001 | −0.523 |
| (0.001) | (0.001) | (0.983) | |
| CapitalRatio | 0.514 | 0.001 | −470.7 |
| (0.674) | (0.023) | (747.5) | |
| Constant | 5.141 *** | 0.050 | 1056 |
| (0.940) | (0.069) | (905.8) | |
| Observations | 486 | 486 | 486 |
| R2 | 0.054 | 0.165 | 0.060 |
| Country FE | YES | YES | YES |
Note: The symbols ***, **, and * represent statistical significance at 1%, 5%, and 10%, respectively.
References
- Altman, Edward I., Alessandro Danovi, and Alberto Falini. 2013. Z-Score Models’ application to Italian companies subject to extraordinary administration. Journal of Applied Finance 23: 128–37. [Google Scholar]
- Altunbas, Yener, Mahir Binici, and Leonardo Gambacorta. 2018. Macroprudential policy and bank risk. Journal of International Money and Finance 81: 203–20. [Google Scholar] [CrossRef] [Green Version]
- Babuna, Pius, Xiaohua Yang, Amatus Gyilbag, Doris Abra Awudi, David Ngmenbelle, and Dehui Bian. 2020. The impact of Covid-19 on the insurance industry. International Journal of Environmental Research and Public Health 17: 5766. [Google Scholar] [CrossRef] [PubMed]
- Baluch, Faisal, Stanley Mutenga, and Chris Parsons. 2011. Insurance, systemic risk and the financial crisis. The Geneva Papers on Risk and Insurance-Issues and Practice 36: 126–63. [Google Scholar] [CrossRef] [Green Version]
- Boyjoo, Teenoosha, and Vani Ramesh. 2017. A study on factors influencing performance of general insurance companies in Mauritius: An empirical evidence. International Journal of Conceptions on Management and Social Sciences 5: 19–23. [Google Scholar]
- Brennan, Michelle, Rodney Clark, and Michael Vine. 2013. What May Cause Insurance Companies to Fall- And How This Influancess Our Criteria. Standar & Poors’s, 1–17. Available online: https://www.yumpu.com/en/document/view/43017028/what-may-cause-insurance-companies-to-fail-standard-poors (accessed on 20 May 2021).
- Caporale, Guglielmo Maria, Mario Cerrato, and Xuan Zhang. 2017. Analysing the determinants of insolvency risk for general insurance firms in the UK. Journal of Banking & Finance 84: 107–22. [Google Scholar]
- Chen, Haiqiang, Wenlan Qian, and Qiang Wen. 2020. The Impact of the COVID-19 Pandemic on Consumption: Learning from High Frequency Transaction Data. Available online: https://papers.ssrn.com/sol3/papers.cfm?abstract_id=3568574 (accessed on 20 May 2021).
- Chevallier, Julien. 2020. COVID-19 pandemic and financial contagion. Journal of Risk and Financial Management 13: 309. [Google Scholar] [CrossRef]
- Corbet, Shaen, Charles Larkin, and Brian Lucey. 2020. The contagion effects of the COVID-19 pandemic: Evidence from Gold and Cryptocurrencies. Finance Research Letters 35: 101554. [Google Scholar] [CrossRef]
- Das, Udaibir, Nigel Davies, and Richard Podpiera. 2003. Insurance and issues in financial soundness. IMF Working Paper WP03/ 138: 1–44. [Google Scholar] [CrossRef]
- Devereux, Michael, Niels Johannesen, and John Vella. 2019. Can taxes tame the banks? Evidence from the European bank levies. The Economic Journal 129: 3058–91. [Google Scholar] [CrossRef]
- Din, Sajid Mohy Ul, Angappan Regupathi, Arpah Abu-Bakar, Chee-Chee Lim, and Zeeshan Ahmed. 2020. Insurance-growth nexus: A comparative analysis with multiple insurance proxies. Economic Research-Ekonomska Istraživanja 33: 604–22. [Google Scholar] [CrossRef]
- Drake, Pamela Peterson, Faith Roberts Neale, Patrick J. Schorno, and Elias Semaan. 2017. Risk during the financial crisis: The role of the insurance industry. Journal of Insurance Issues 40: 181–214. [Google Scholar]
- EIOPA. 2020a. EIOPA’s Response to the Coronavirus Crisis. Available online: https://www.eiopa.europa.eu/content/eiopas-response-coronavirus-crisis_en (accessed on 20 May 2021).
- EIOPA. 2020b. European Insurers Face Increased Risk Exposures Due to Covid-19, but Market Perceptions and Imbalances Remained at Medium Level. Available online: https://www.eiopa.europa.eu/content/european-insurers-face-increased-risk-exposures-due-covid-19-market-perceptions-and_en (accessed on 19 May 2020).
- EIOPA. 2020c. Impact of Ultra Low Yields on the Insurance Sector, Including First Effects of COVID-19 CRISIS. Available online: https://doi.org/10.2854/942851 (accessed on 10 May 2020).
- EIOPA. 2020d. Supervisory Statement on the Solvency II Recognition of Schemes Based on Reinsurance with Regard to COVID-19 and Credit Insurance. Available online: https://www.eiopa.europa.eu/content/supervisory-statement-solvency-ii-recognition-schemes-based-reinsurance-regard-covid-19-and_en (accessed on 15 May 2021).
- EIOPA. 2021. Insurance Statistics. Available online: https://www.eiopa.europa.eu/tools-and-data/insurance-statistics_en (accessed on 15 May 2021).
- Engle, Robert, Eric Jondeau, and Michael Rockinger. 2015. Systemic risk in Europe. Review of Finance 19: 145–90. [Google Scholar] [CrossRef]
- European Central Bank. 2009. The importance of insurance companies for financial stability. Financial Stability Review. Available online: https://www.ecb.europa.eu/pub/pdf/fsr/art/ecb.fsrart200912en_05.pdf?d92c521966d4230d00f941821cb4e1cc (accessed on 10 May 2020).
- Evans, Olaniyi. 2020. Socio-economic impacts of novel coronavirus: The policy solutions. BizEcons Quarterly 7: 3–12. [Google Scholar]
- Farooq, Umar, Adeel Nasir, Bilal, and Muhammad Umer Quddoos. 2021. The impact of COVID-19 pandemic on abnormal returns of insurance firms: A cross-country evidence. Applied Economics, 1–21. [Google Scholar] [CrossRef]
- Ferraresi, Massimiliano, Christos Kotsogiannis, Leonzio Rizzo, and Riccardo Secomandi. 2020. The ‘Great Lockdown’and its determinants. Economics Letters 197: 109628. [Google Scholar] [CrossRef]
- FSB. 2016. 2016 List of Global Systemically Important Insurers (G-SIIs), 2015 (October 2015), 2016–18. Available online: https://www.fsb.org/wp-content/uploads/2016-list-of-global-systemically-important-insurers-G-SIIs.pdf (accessed on 10 June 2021).
- García-Teruel, Pedro Juan, and Pedro Martínez-Solano. 2007. Effects of working capital management on SME profitability. International Journal of Managerial Finance 3: 164–77. [Google Scholar] [CrossRef]
- Gavira-Durón, Nora, Daniel Mayorga-Serna, and Alberto Bagatella-Osorio. 2020. The financial impact of the implementation of Solvency II on the Mexican insurance sector. The Geneva Papers on Risk and Insurance-Issues and Practice, 1–26. [Google Scholar] [CrossRef]
- Goodell, John W. 2020. COVID-19 and finance: Agendas for future research. Finance Research Letters 35: 101512. [Google Scholar] [CrossRef]
- Halling, Michael, Jin Yu, and Josef Zechner. 2020. Bond and Equity Issuance Activity during COVID-19. Available online: https://papers.ssrn.com/sol3/papers.cfm?abstract_id=3596114 (accessed on 10 June 2021).
- Hauser, Philipp, David Schönheit, Hendrik Scharf, Carl-Philipp Anke, and Dominik Möst. 2021. Covid-19′s Impact on European Power Sectors: An Econometric Analysis. Energies 14: 1639. [Google Scholar] [CrossRef]
- Hausman, Jerry A. 1978. Specification tests in econometrics. Econometrica: Journal of the Econometric Society 46: 1251–71. [Google Scholar] [CrossRef] [Green Version]
- Hryckiewicz, Aneta. 2014. What do we know about the impact of government interventions in the banking sector? An assessment of various bailout programs on bank behavior. Journal of Banking & Finance 46: 246–65. [Google Scholar] [CrossRef]
- Karlsson, Fredrik. 2020. Time for a Rethink? the Insurance Industry Faces Up to COVID-19. Available online: https://latinlawyer.com/article/1225838/time-for-a-rethink-the-insurance-industry-faces-up-to-covid-19 (accessed on 12 May 2020).
- Kestens, Katrien, Philippe Van Cauwenberge, and Heidi Vander Bauwhede. 2012. Trade credit and company performance during the 2008 financial crisis. Accounting & Finance 52: 1125–51. [Google Scholar]
- Koijen, Ralph S. J., and Motohiro Yogo. 2015. The cost of financial frictions for life insurers. American Economic Review 105: 445–75. [Google Scholar] [CrossRef] [Green Version]
- Kusi, Baah Aye, Abdul Latif Alhassan, Daniel Ofori-Sasu, and Rockson Sai. 2019. Insurance regulations, risk and performance in Ghana. Journal of Financial Regulation and Compliance 28: 74–96. [Google Scholar] [CrossRef]
- Laeven, Luc, and Ross Levine. 2009. Bank governance, regulation and risk taking. Journal of Financial Economics 93: 259–75. [Google Scholar] [CrossRef] [Green Version]
- Lazaridis, Ioannis, and Dimitrios Tryfonidis. 2006. Relationship between working capital management and profitability of listed companies in the Athens stock exchange. Journal of Financial Management and Analysis 19: 26–35. [Google Scholar]
- Lepetit, Laetitia, and Frank Strobel. 2013. Bank insolvency risk and time-varying Z-score measures. Journal of International Financial Markets, Institutions and Money 25: 73–87. [Google Scholar] [CrossRef] [Green Version]
- Li, Xiping, David W. L. Tripe, and Christopher B. Malone. 2017. Measuring Bank Risk: An Exploration of Z-Score. Available online: https://papers.ssrn.com/sol3/papers.cfm?abstract_id=2823946 (accessed on 11 June 2021).
- May, Peter J. 2007. Regulatory regimes and accountability. Regulation & Governance 1: 8–26. [Google Scholar]
- McDonald, Robert, and Anna Paulson. 2015. AIG in Hindsight. Journal of Economic Perspectives 29: 81–106. [Google Scholar] [CrossRef]
- Moody’sAnalytics. 2020. EIOPA Risk Assessment Shows Increase in Credit and Market Risks. Available online: https://www.moodysanalytics.com/regulatory-news/May-18-20-EIOPA-Risk-Assessment-Shows-Increase-in-Credit-and-Market-Risks (accessed on 11 June 2021).
- Moreno, Ignacio, Purificación Parrado-Martínez, and Antonio Trujillo-Ponce. 2019. Available online: https://papers.ssrn.com/sol3/papers.cfm?abstract_id=3491667 (accessed on 11 June 2020).
- Nozawa, Yoshio, and Yancheng Qiu. 2020. The Corporate Bond Market Reaction to the COVID-19 Crisis. Available online: https://papers.ssrn.com/sol3/papers.cfm?abstract_id=3579346 (accessed on 9 June 2020).
- Nwude, E. Chuke, Elias Igwebuike Agbo, and Christian Ibe-Lamberts. 2018. Effect of cash conversion cycle on the profitability of public listed insurance companies. International Journal of Economics and Financial Issues 8: 111–17. [Google Scholar]
- Oravský, Róbert, Peter Tóth, and Anna Bánociová. 2020. The ability of selected European countries to face the impending economic crisis caused by COVID-19 in the context of the global economic crisis of 2008. Journal of Risk and Financial Management 13: 179. [Google Scholar] [CrossRef]
- Ostrowska-Dankiewicz, Anna, and Mihaela Simionescu. 2020. Relationship between the insurance market and macroeconomic indicators in the eu member states. Transformations in Business & Economics 19: 175–87. [Google Scholar]
- Pasiouras, Fotios, and Chrysovalantis Gaganis. 2013. Regulations and soundness of insurance firms: International evidence. Journal of Business Research 66: 632–42. [Google Scholar] [CrossRef]
- Petersen, Mitchell A. 2009. Estimating standard errors in finance panel data sets: Comparing approaches. The Review of Financial Studies 22: 435–80. [Google Scholar] [CrossRef] [Green Version]
- Podgórski, Błażej. 2018. Impact of the January Effect on Return Rates in the Markets of the 2004 EU Enlargement. Journal of Management and Business Administration. Central Europe 26: 27–48. [Google Scholar] [CrossRef]
- Pugnetti, Carlo, and Mischa Seitz. 2021. Data-Driven Services in Insurance: Potential Evolution and Impact in the Swiss Market. Journal of Risk and Financial Management 14: 227. [Google Scholar] [CrossRef]
- Raheman, Abdul, and Mohamed Nasr. 2007. Working capital management and profitability—Case of Pakistani firms. International Review of Business Research Papers 3: 279–300. [Google Scholar]
- Rochet, Jean-Charles, Guillaume Plantin, and Hyun Song Shin. 2007. When Insurers Go Bust: An Economic Analysis of the Role and Design of Prudential Regulation. Princeton: Princeton University Press. [Google Scholar]
- Samiloglu, Famil, and Kartal Demirgunes. 2008. The effect of working capital management on firm profitability: Evidence from Turkey. The International Journal of Applied Economics and Finance 2: 44–50. [Google Scholar] [CrossRef]
- Shevchuk, Oleksandra, Iryna Kondrat, and Jolanta Stanienda. 2020. Pandemic as an accelerator of digital transformation: Evidence from Ukraine. Insurance Markets and Companies 11: 30–41. [Google Scholar] [CrossRef]
- . Sharpe, Ian G., and Andrei Stadnik. 2007. Financial Distress in Australian General Insurers. Journal of Risk and Insurance 74: 377–99. [Google Scholar] [CrossRef]
- Tauringana, Venancio, and Godfred Adjapong Afrifa. 2013. The relative importance of working capital management and its components to SMEs’ profitability. Journal of Small Business and Enterprise Development 20: 453–69. [Google Scholar] [CrossRef]
- Teresiene, Deimante, Greta Keliuotyte-Staniuleniene, Yiyi Liao, Rasa Kanapickiene, Ruihui Pu, Siyan Hu, and Xiao-Guang Yue. 2021. The Impact of the COVID-19 Pandemic on Consumer and Business Confidence Indicators. Journal of Risk and Financial Management 14: 159. [Google Scholar] [CrossRef]
- Wooldridge, Jeffrey M. 2013. Introductory Econometrics. A Modern Approach. East Lansing: Michigan State University: South-Western Cengage Learning. [Google Scholar]
- Yilmazkuday, Hakan. 2020. Covid-19 Effects on the s&p 500 Index. Available online: https://papers.ssrn.com/sol3/papers.cfm?abstract_id=3555433 (accessed on 10 June 2021).
- Zhong, Genyuan. 2014. Simple Discussion on The Problems Existed in the Enterprise Receivables Management and Countermeasures. Paper presented at the 4th International Conference on Education and Education Management (EEM 2014), Singapore, December 8–9; pp. 231–37. [Google Scholar]
- Zimon, Grzegorz. 2020a. An Analysis of Working Capital Management Strategy in Small Enterprises Operating Within Group Purchasing Organizations. In Eurasian Economic Perspectives. New York City: Springer, pp. 103–11. [Google Scholar]
- Zimon, Grzegorz. 2020b. Issues of financial liquidity of small and medium-sized trading companies: A case study from Poland. Entrepreneurship and Sustainability Issues 8: 363. [Google Scholar] [CrossRef]
- Zimon, Grzegorz, and Robert Dankiewicz. 2020. Trade Credit Management Strategies in SMEs and the COVID-19 Pandemic—A Case of Poland. Sustainability 12: 6114. [Google Scholar] [CrossRef]
- Zimon, Grzegorz, and Hossein Tarighi. 2021. Effects of the COVID-19 global crisis on the working capital management policy: Evidence from Poland. Journal of Risk and Financial Management 14: 169. [Google Scholar] [CrossRef]
Table 1.
Explanation and construction of all variables used.
| Label | Measurement |
|---|---|
| Dependent variables | |
| ROA | Insurance company’s return on assets measured by dividing a company’s net income by total assets at the end of each quarter. |
| Z-score | Z-score is defined as the ratio of the sum of the insurer’s average capitalization to the standard deviation of the return on assets. Z-scores are estimated as four-year moving averages. |
| Solvency II ratio | The solvency ratio of an insurance company is the size of its capital relative to all risks it has taken. Calculated based on the Solvency II Directive. |
| Receivables | Accounts’ receivables are measured by the natural logarithm of the book value of receivables at the end of the quarter. |
| Receivables to total assets | Receivables to total assets ratio at the end of the quarter. |
| Receivables growth | Receivables’ growth measured as a quarter-to-quarter ratio. |
| Independent variables | |
| COVID-19 pandemic | Dummy variable that takes the value of one if we investigate a quarter during the coronavirus pandemic (Q1of 2020 and Q2 of 2020) and zero otherwise. |
| Size | Insurance company size measured by the natural logarithm of the book value of the firm’s total assets at the end of the quarter. |
| FinLeverage | Financial leverage measured by the sum of long-term debt and current liabilities of the firm at the end of the analyzed year deflated by total assets of firm j at the start of year t. |
| Profitability | Insurance company profitability measured by the natural logarithm of the net income at the end of the quarter. |
| Liquidity | Insurance company liquidity measured by the ratio of liquid assets to total assets at the end of the quarter. |
| EquityRatio | Equity to total assets ratio. |
| CapitalRatio | Capital to total assets ratio. |
Table 2.
Summary statistics.
| Variable | Obs. | Mean | Std. Dev. | Min | Max |
|---|---|---|---|---|---|
| Dependent variables | |||||
| ROA | 917 | 1.821 | 4.019 | −8.287 | 26.802 |
| Z-score | 867 | 17.377 | 40.154 | −110.718 | 853.739 |
| Solvency II ratio | 420 | 190.317 | 75.094 | 0.000 | 406.000 |
| Receivables | 398 | 4.713 | 3.499 | −3.423 | 9.460 |
| Independent variables | |||||
| COVID-19 pandemic | 1080 | 0.025 | 0.156 | 0.000 | 1.000 |
| Size | 994 | 10.939 | 2.561 | 3.434 | 14.736 |
| FinLeverage | 935 | 13.691 | 8.267 | 1.673 | 40.797 |
| Profitability | 928 | 4.806 | 1.888 | −2.604 | 8.375 |
| Liquidity | 993 | 0.035 | 0.043 | 0.000 | 0.366 |
| EquityRatio | 994 | 0.143 | 0.136 | 0.022 | 0.602 |
| CapitalRatio | 994 | 0.344 | 0.250 | 0.000 | 0.994 |
Table 3.
Has the COVID-19 pandemic negatively impacted the insurance sector?
| ROA | Z-Score | Solvency II Ratio | |
|---|---|---|---|
| VARIABLES | (1) | (2) | (3) |
| COVID-19 pandemic | −0.574 * | 4.247 | 23.34 * |
| (0.311) | (4.238) | (13.83) | |
| Size | 0.668 | −0.355 | 16.60 |
| (0.513) | (0.817) | (17.24) | |
| FinLeverage | 0.123 *** | −0.258 | 3.528 |
| (0.0364) | (0.485) | (8.205) | |
| Profitability | 0.210 | 3.801 *** | 12.83 ** |
| (0.179) | (0.673) | (5.975) | |
| Liquidity | 15.00 *** | −34.55 | 215.3 |
| (2.803) | (31.18) | (670.2) | |
| EquityRatio | 52.91 *** | 6.649 | 1367 |
| (1.346) | (30.97) | (1127) | |
| CapitalRatio | −2.503 *** | 3.501 | −212.4 |
| (0.906) | (9.180) | (335.5) | |
| Constant | −15.33 *** | 6.720 | −217.0 |
| (4.652) | (14.27) | (380.7) | |
| Observations | 826 | 788 | 194 |
| R2 | 0.602 | 0.169 | 0.101 |
| Country FE | YES | YES | YES |
Note: The symbols ***, **, and * represent statistical significance at 1%, 5%, and 10%, respectively.
Table 4.
Has the value of receivables increased because of the COVID-19 pandemic?
| Receivables | Receivables to Total Assets | Receivables Growth | |
|---|---|---|---|
| VARIABLES | (1) | (2) | (3) |
| COVID-19 pandemic | 361.000 ** | 0.011 * | 428.6 ** |
| (172.9) | (0.00659) | (183.4) | |
| Size | 306.9 ** | −0.0704 | 334.7 ** |
| (120.7) | (0.0384) | (135.0) | |
| FinLeverage | −31.29 | 0.000847 | −32.66 |
| (21.90) | (0.00135) | (23.50) | |
| Profitability | −91.37 ** | −0.00558 | −92.14 ** |
| (40.44) | (0.00746) | (39.37) | |
| Liquidity | 891.6 *** | 0.219 | 822.1 *** |
| (286.5) | (0.370) | (259.4) | |
| EquityRatio | 1764 *** | 0.551 *** | 1778 *** |
| (570.8) | (0.0547) | (540.7) | |
| CapitalRatio | 217.9 | 0.178 * | 217.5 |
| (635.0) | (0.0642) | (646.3) | |
| Constant | −1680 *** | 0.649 | −1941 *** |
| (483.3) | (0.337) | (597.8) | |
| Observations | 486 | 486 | 486 |
| R2 | 0.260 | 0.180 | 0.0673 |
| Country FE | YES | 0.180 | YES |
Note: The symbols ***, **, and * represent statistical significance at 1%, 5%, and 10%, respectively.
Table 5.
Has the COVID-19 pandemic impacted Belgian insurance companies negatively?
| ROA | Z-Score | Solvency II Ratio | Account Receivables to Total Assets | |
|---|---|---|---|---|
| VARIABLES | (1) | (2) | (3) | (4) |
| COVID-19 pandemic | −0.0660 | 6.298 | −16.29 * | 0.001 * |
| (0.152) | (3.884) | (11.64) | (0.002) | |
| Size | 1.601 ** | 44.98 ** | −85.08 | 0.026 * |
| (0.633) | (17.95) | (76.22) | (0.013) | |
| FinLeverage | −0.0484 *** | −0.279 | 4.904 | 0.0035 *** |
| (0.0162) | (0.478) | (4.162) | (0.001) | |
| Profitability | 0.0431 | −0.228 | −1.370 | −0.000 |
| (0.0389) | (0.992) | (2.145) | (0.000) | |
| Liquidity | −0.782 | 153.0 ** | −881.3 | −0.416 *** |
| (1.924) | (57.70) | (843.4) | (0.144) | |
| EquityRatio | 9.725 | 304.8 * | −2839 *** | −0.518 *** |
| (6.271) | (178.6) | (875.9) | (0.150) | |
| CapitalRatio | −0.180 | −207.1 *** | 3425 *** | 0.398 *** |
| (1.729) | (68.57) | (608.1) | (0.104) | |
| Constant | −18.89 ** | −516.2 ** | 947.8 | −0.313 ** |
| (7.409) | (211.0) | (879.2) | (0.150) | |
| Observations | 67 | 66 | 31 | 31 |
| R2 | 0.446 | 0.613 | 0.755 | 0.817 |
| Company FE | YES | YES | YES | YES |
Note: The symbols ***, **, and * represent statistical significance at 1%, 5%, and 10%, respectively.
Table 6.
Has the COVID-19 pandemic negatively impacted French insurance companies?
| ROA | Z-Score | Solvency II Ratio | Account Receivables to Total Assets | |
|---|---|---|---|---|
| VARIABLES | (1) | (2) | (3) | (4) |
| COVID-19 pandemic | 0.107 | −7.407 | −13.28 ** | 0.0273 |
| (0.0726) | (7.918) | (4.672) | (0.0557) | |
| Size | −0.785 ** | 37.72 | 140.3 *** | −0.0250 |
| (0.386) | (45.40) | (39.16) | (0.243) | |
| FinLeverage | 0.0551 ** | 3.042 | −18.72 | −0.0107 |
| (0.0216) | (2.514) | (10.97) | (0.123) | |
| Profitability | 0.0897 *** | 2.383 | −9.383 *** | −0.00148 |
| (0.0341) | (3.787) | (2.707) | (0.0293) | |
| Liquidity | 2.300 * | 277.9 * | −489.0 ** | 1.085 |
| (1.364) | (153.8) | (173.7) | (1.980) | |
| EquityRatio | 37.91 *** | 1339 * | −347.3 | −3.908 |
| (6.173) | (676.3) | (506.7) | (5.639) | |
| CapitalRatio | 0.204 | 71.90 *** | 755.4 *** | 1.608 |
| (0.235) | (26.01) | (195.5) | (2.812) | |
| Constant | 5.643 | −693.7 | −1195 ** | 0.844 |
| (5.195) | (609.0) | (421.6) | (2.785) | |
| Observations | 122 | 118 | 18 | 41 |
| R2 | 0.463 | 0.157 | 0.859 | 0.051 |
| Company FE | YES | YES | YES | YES |
Note: The symbols ***, **, and * represent statistical significance at 1%, 5%, and 10%, respectively.
Table 7.
Has the COVID-19 pandemic negatively impacted German insurance companies?
| ROA | Z-Score | Solvency II Ratio | Account Receivables to Total Assets | |
|---|---|---|---|---|
| VARIABLES | (1) | (2) | (3) | (4) |
| COVID-19 pandemic | −0.761 * | −5.384 | −32.22 ** | 0.005 |
| (0.397) | (18.17) | (15.51) | (0.018) | |
| Size | 2.686 *** | 8.256 | 92.52 ** | −0.046 ** |
| (0.460) | (21.18) | (45.90) | (0.020) | |
| FinLeverage | 0.232 *** | −1.565 | −2.174 | −0.000 |
| (0.0633) | (2.983) | (10.67) | (0.003) | |
| Profitability | −0.396 ** | 5.179 | −11.18 | −0.022 ** |
| (0.186) | (8.528) | (7.661) | (0.009) | |
| Liquidity | 33.50 *** | 22.95 | 1919 | −0.771 *** |
| (5.115) | (234.7) | (1626) | (0.236) | |
| EquityRatio | 45.33 *** | −191.4 | 4055 *** | 0.879 *** |
| (4.662) | (215.0) | (1033) | (0.207) | |
| CapitalRatio | −3.926 ** | −0.533 | 7.869 | 0.099 |
| (1.691) | (77.93) | (547.0) | (0.068) | |
| Constant | −34.43 *** | −30.13 | −1277 ** | 0.492 ** |
| (4.321) | (198.4) | (621.9) | (0.189) | |
| Observations | 259 | 253 | 148 | 221 |
| R2 | 0.652 | 0.007 | 0.655 | 0.144 |
| Company FE | YES | YES | YES | YES |
Note: The symbols ***, **, and * represent statistical significance at 1%, 5%, and 10%, respectively.
Table 8.
Has the COVID-19 pandemic negatively impacted Italian insurance companies?
| ROA | Z-Score | Solvency II Ratio | Account Receivables to Total Assets | |
|---|---|---|---|---|
| VARIABLES | (1) | (2) | (3) | (4) |
| COVID-19 pandemic | −2.002 * | 8.776 | −7.555 | 0.024 |
| (1.067) | (9.431) | (15.05) | (0.056) | |
| Size | −2.253 ** | 3.255 | 131.1 *** | −0.382 *** |
| (0.958) | (8.567) | (36.07) | (0.079) | |
| FinLeverage | 0.0982 | 1.126 | −7.105 *** | 0.020 *** |
| (0.126) | (1.120) | (2.283) | (0.007) | |
| Profitability | 2.110 *** | 6.020 | 10.85 | 0.036 |
| (0.528) | (4.754) | (7.853) | (0.031) | |
| Liquidity | 10.71 | −39.15 | −501.0 | 0.238 |
| (8.208) | (73.04) | (622.6) | (0.347) | |
| EquityRatio | 47.90 *** | 57.49 | 1332 *** | −0.683 * |
| (5.537) | (50.32) | (173.7) | (0.404) | |
| CapitalRatio | 3.730 | −20.09 | −80.27 ** | 0.293 ** |
| (2.807) | (24.94) | (34.30) | (0.123) | |
| Constant | −0.516 | −43.96 | −1419 *** | 2.999 *** |
| (7.446) | (67.50) | (396.6) | (0.654) | |
| Observations | 107 | 104 | 39 | 73 |
| R2 | 0.721 | 0.078 | 0.942 | 0.535 |
| Company FE | YES | YES | YES | YES |
Note: The symbols ***, **, and * represent statistical significance at 1%, 5%, and 10%, respectively.
Table 9.
Has the COVID-19 pandemic negatively impacted Polish insurance companies?
| ROA | Z-Score | Solvency II Ratio | Account Receivables to Total Assets | |
|---|---|---|---|---|
| VARIABLES | (1) | (2) | (3) | (4) |
| COVID-19 pandemic | −0.012 | 14.53 | 13.26 * | 0.001 |
| (0.221) | (10.74) | (7.650) | (0.006) | |
| Size | 0.233 | 4.691 | 33.88 *** | 0.002 |
| (0.382) | (16.15) | (9.227) | (0.004) | |
| FinLeverage | 0.090 *** | −1.130 | −3.363 *** | −0.001 |
| (0.024) | (1.039) | (1.189) | (0.001) | |
| Profitability | 0.199 *** | 3.437 | 1.333 | −0.002 * |
| (0.0710) | (3.110) | (2.373) | (0.009) | |
| Liquidity | 21.75 *** | −71.73 | −815.6 *** | 0.063 ** |
| (3.292) | (139.3) | (172.6) | (0.026) | |
| EquityRatio | 68.62 *** | −32.01 | 703.0 *** | 0.036 |
| (5.179) | (221.6) | (231.8) | (0.040) | |
| CapitalRatio | −1.627 * | 13.08 | 80.62 | −0.004 |
| (0.866) | (36.79) | (78.04) | (0.026) | |
| Constant | −10.08 ** | −37.52 | −213.2 * | −0.011 |
| (4.545) | (191.0) | (113.6) | (0.043) | |
| Observations | 271 | 247 | 100 | 120 |
| R2 | 0.432 | 0.030 | 0.669 | 0.076 |
| Company FE | YES | YES | YES | YES |
Note: The symbols ***, **, and * represent statistical significance at 1%, 5%, and 10%, respectively.
Publisher’s Note: MDPI stays neutral with regard to jurisdictional claims in published maps and institutional affiliations. |
© 2021 by the author. Licensee MDPI, Basel, Switzerland. This article is an open access article distributed under the terms and conditions of the Creative Commons Attribution (CC BY) license (https://creativecommons.org/licenses/by/4.0/).
Share and Cite
MDPI and ACS Style
Puławska, K. Financial Stability of European Insurance Companies during the COVID-19 Pandemic. J. Risk Financial Manag. 2021, 14, 266. https://doi.org/10.3390/jrfm14060266
AMA Style
Puławska K. Financial Stability of European Insurance Companies during the COVID-19 Pandemic. Journal of Risk and Financial Management. 2021; 14(6):266. https://doi.org/10.3390/jrfm14060266
Chicago/Turabian StylePuławska, Karolina. 2021. "Financial Stability of European Insurance Companies during the COVID-19 Pandemic" Journal of Risk and Financial Management 14, no. 6: 266. https://doi.org/10.3390/jrfm14060266