
Estimation of Surface Soil Moisture at the Intra-Plot Spatial Scale by Using Low and High Incidence Angles TerraSAR-X Images †


Abstract
:1. Introduction
2. Experiments
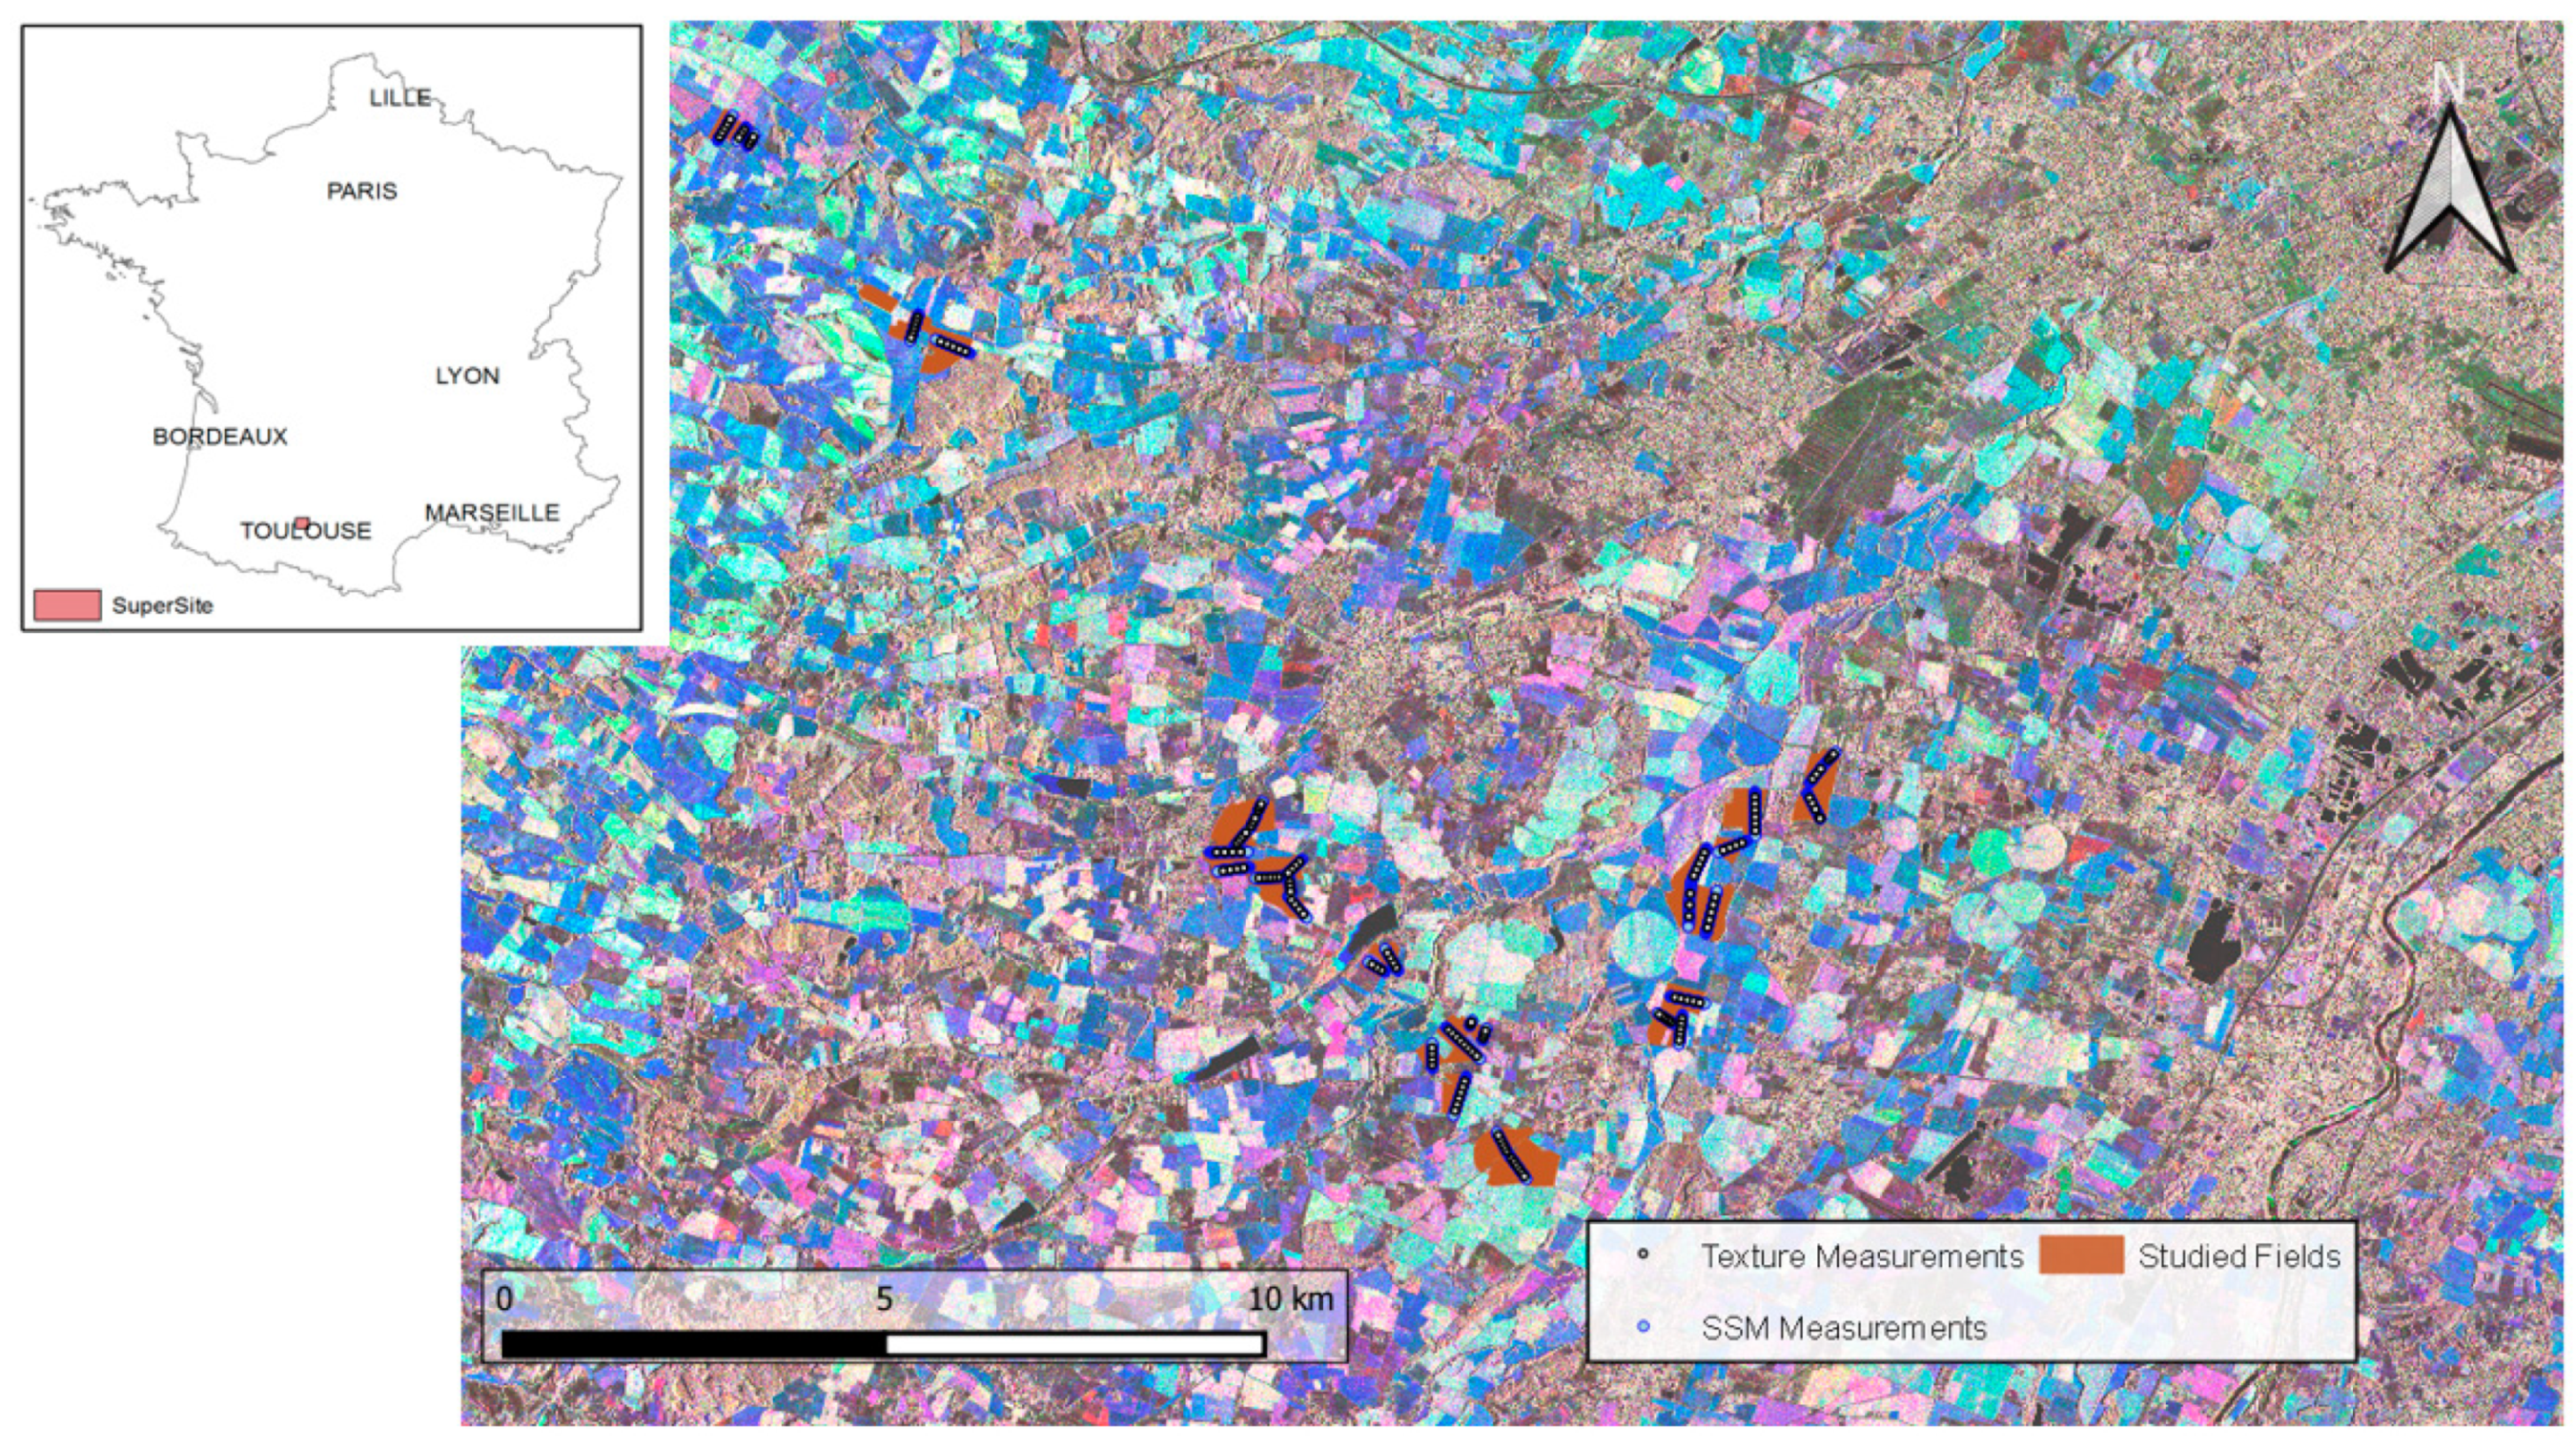
2.1. Study Site
2.2. Materials
2.2.1. In Situ Data
2.2.2. TerraSAR-X Satellite Data
2.3. Method
3. Results and Discussion
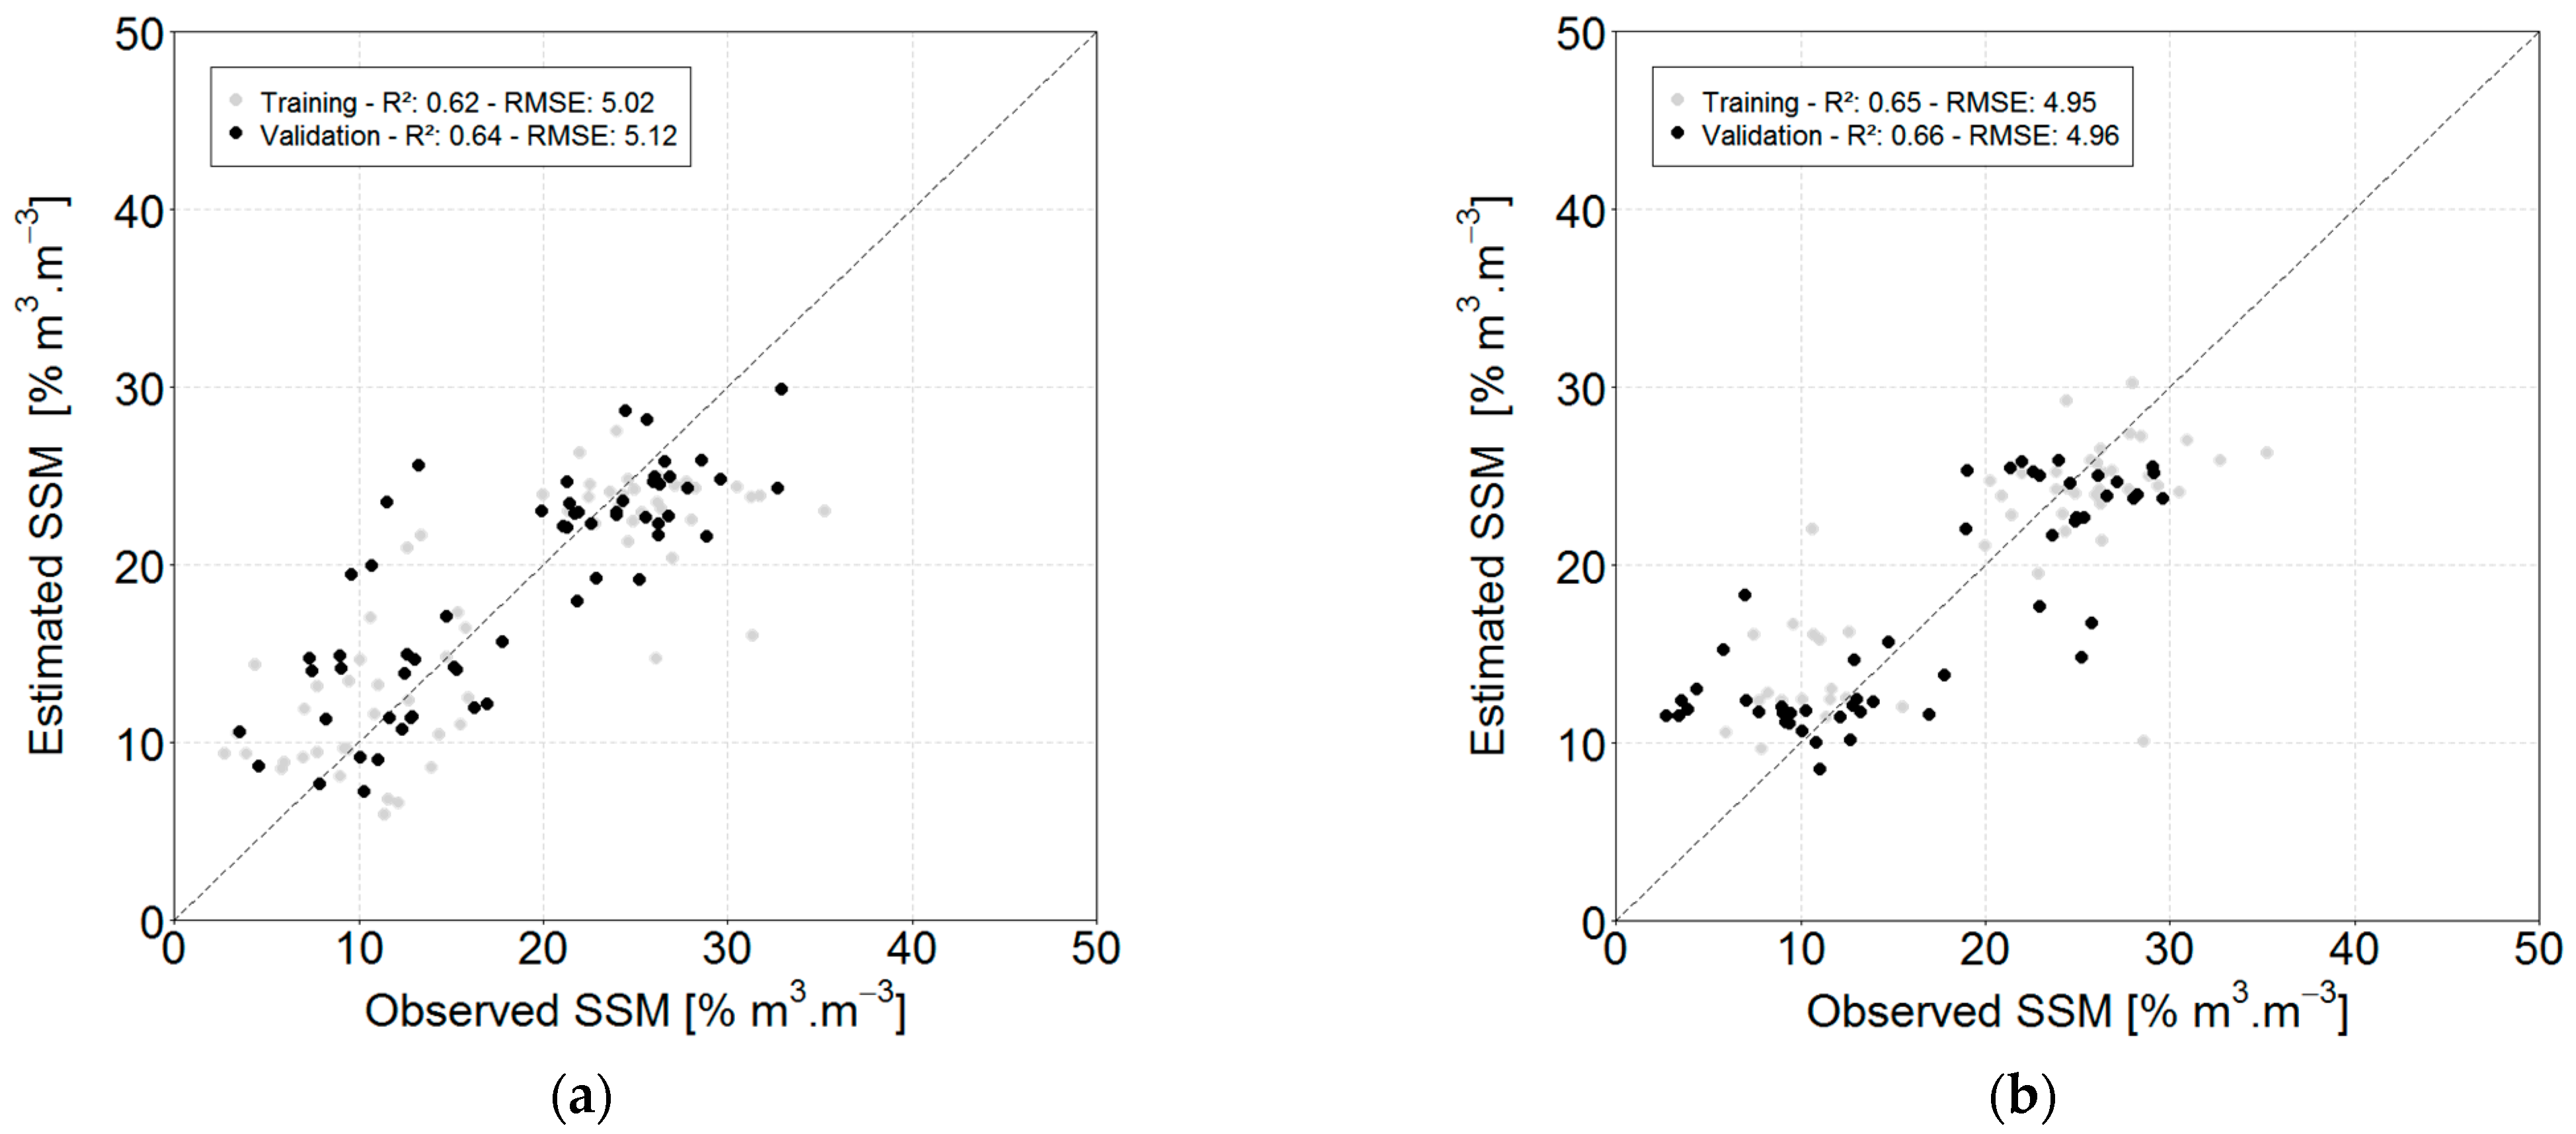
3.1. Overall Performances Obtained at the Plot Spatial Scale
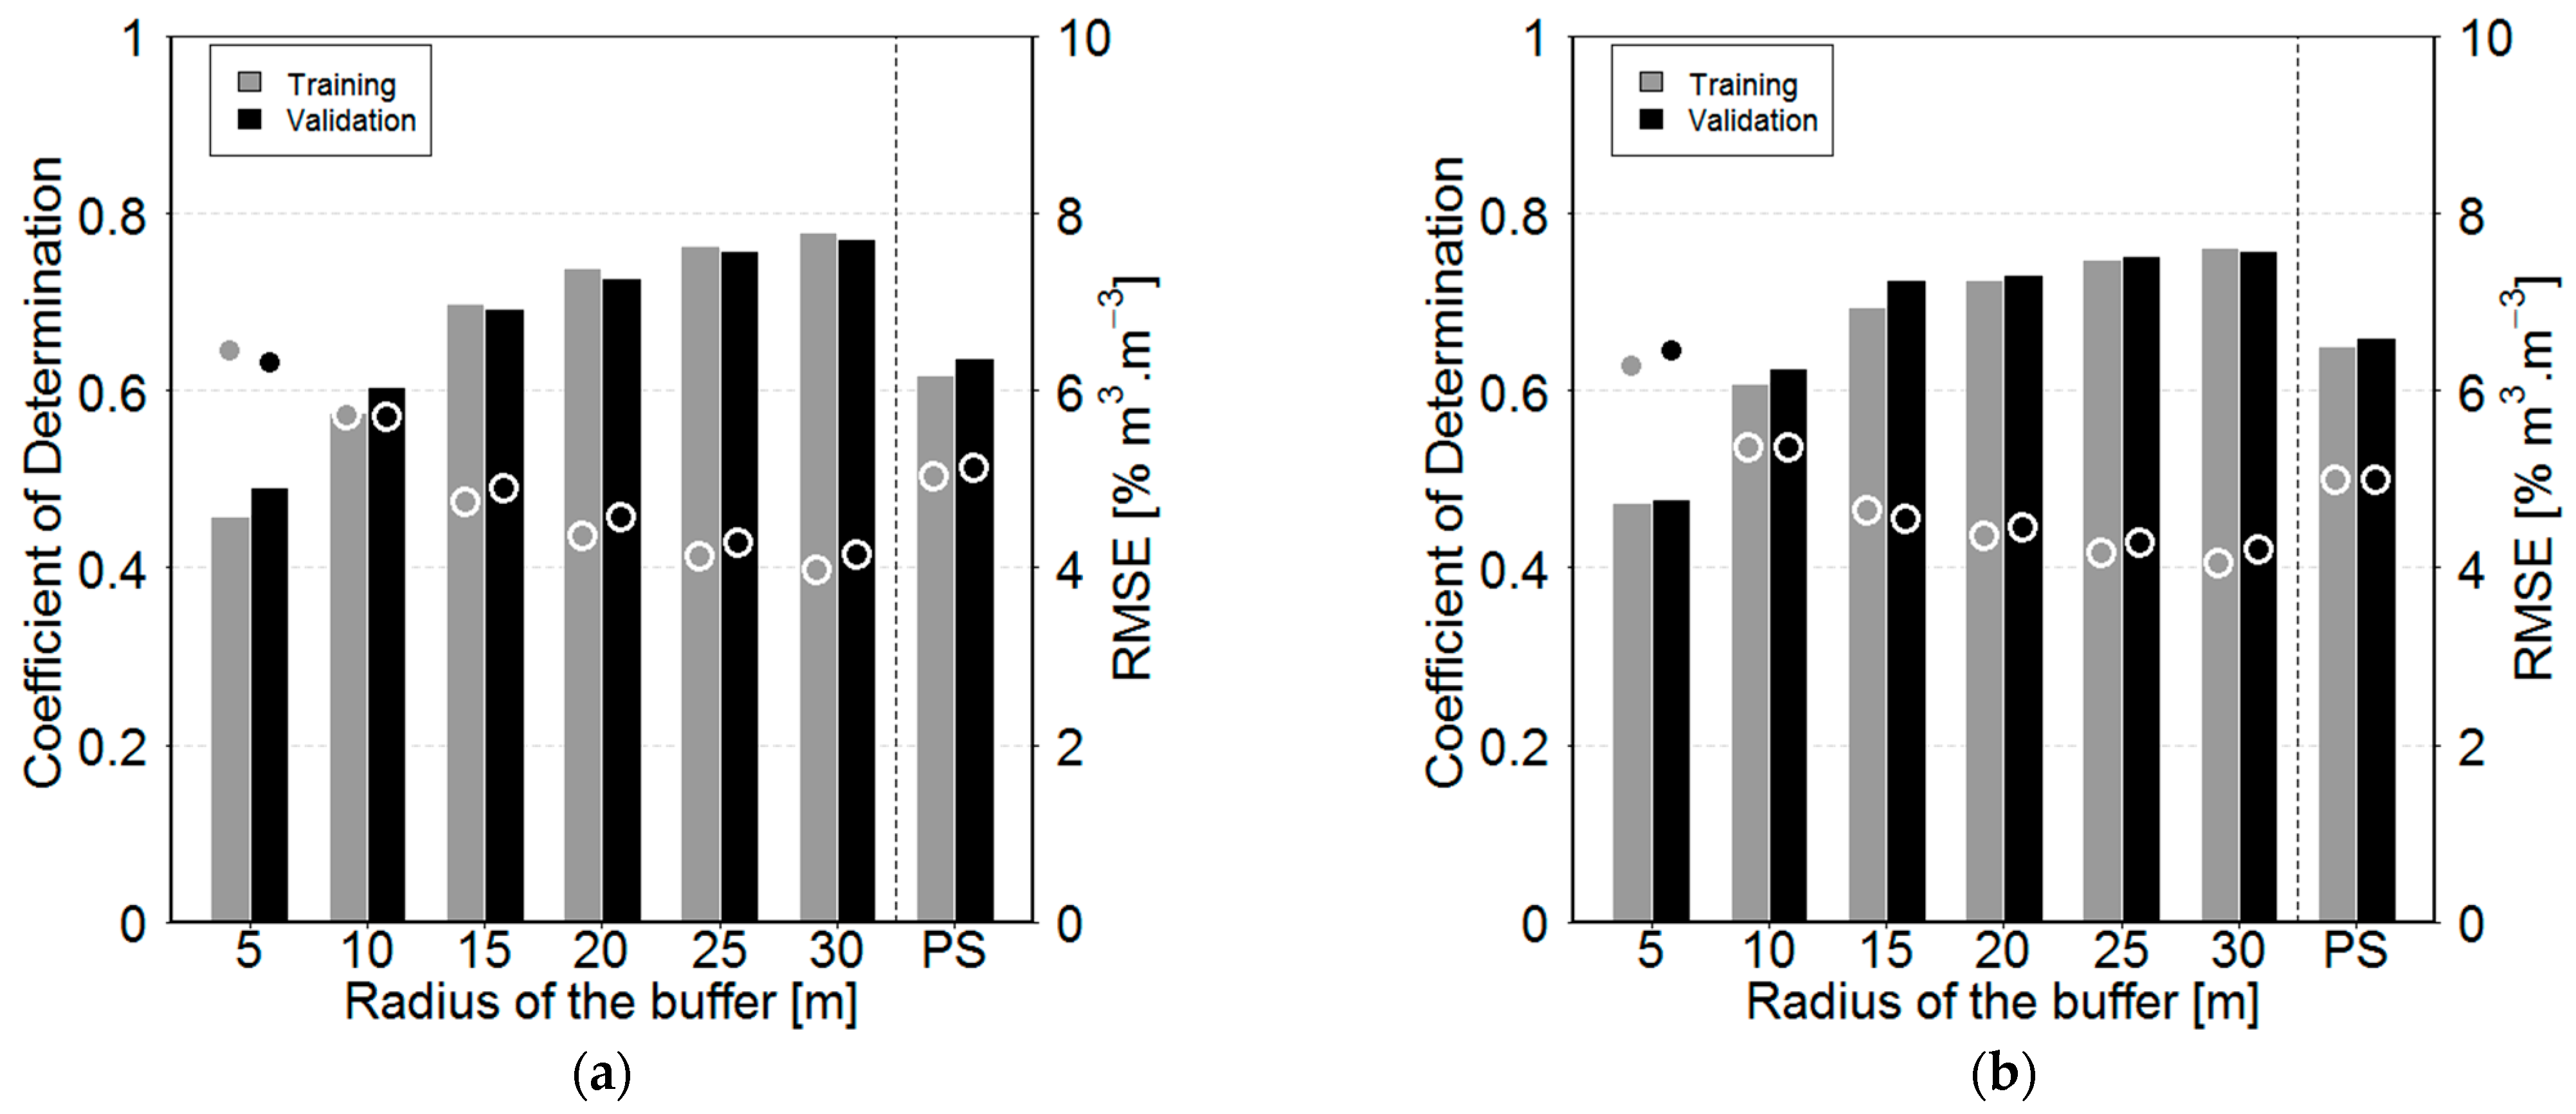
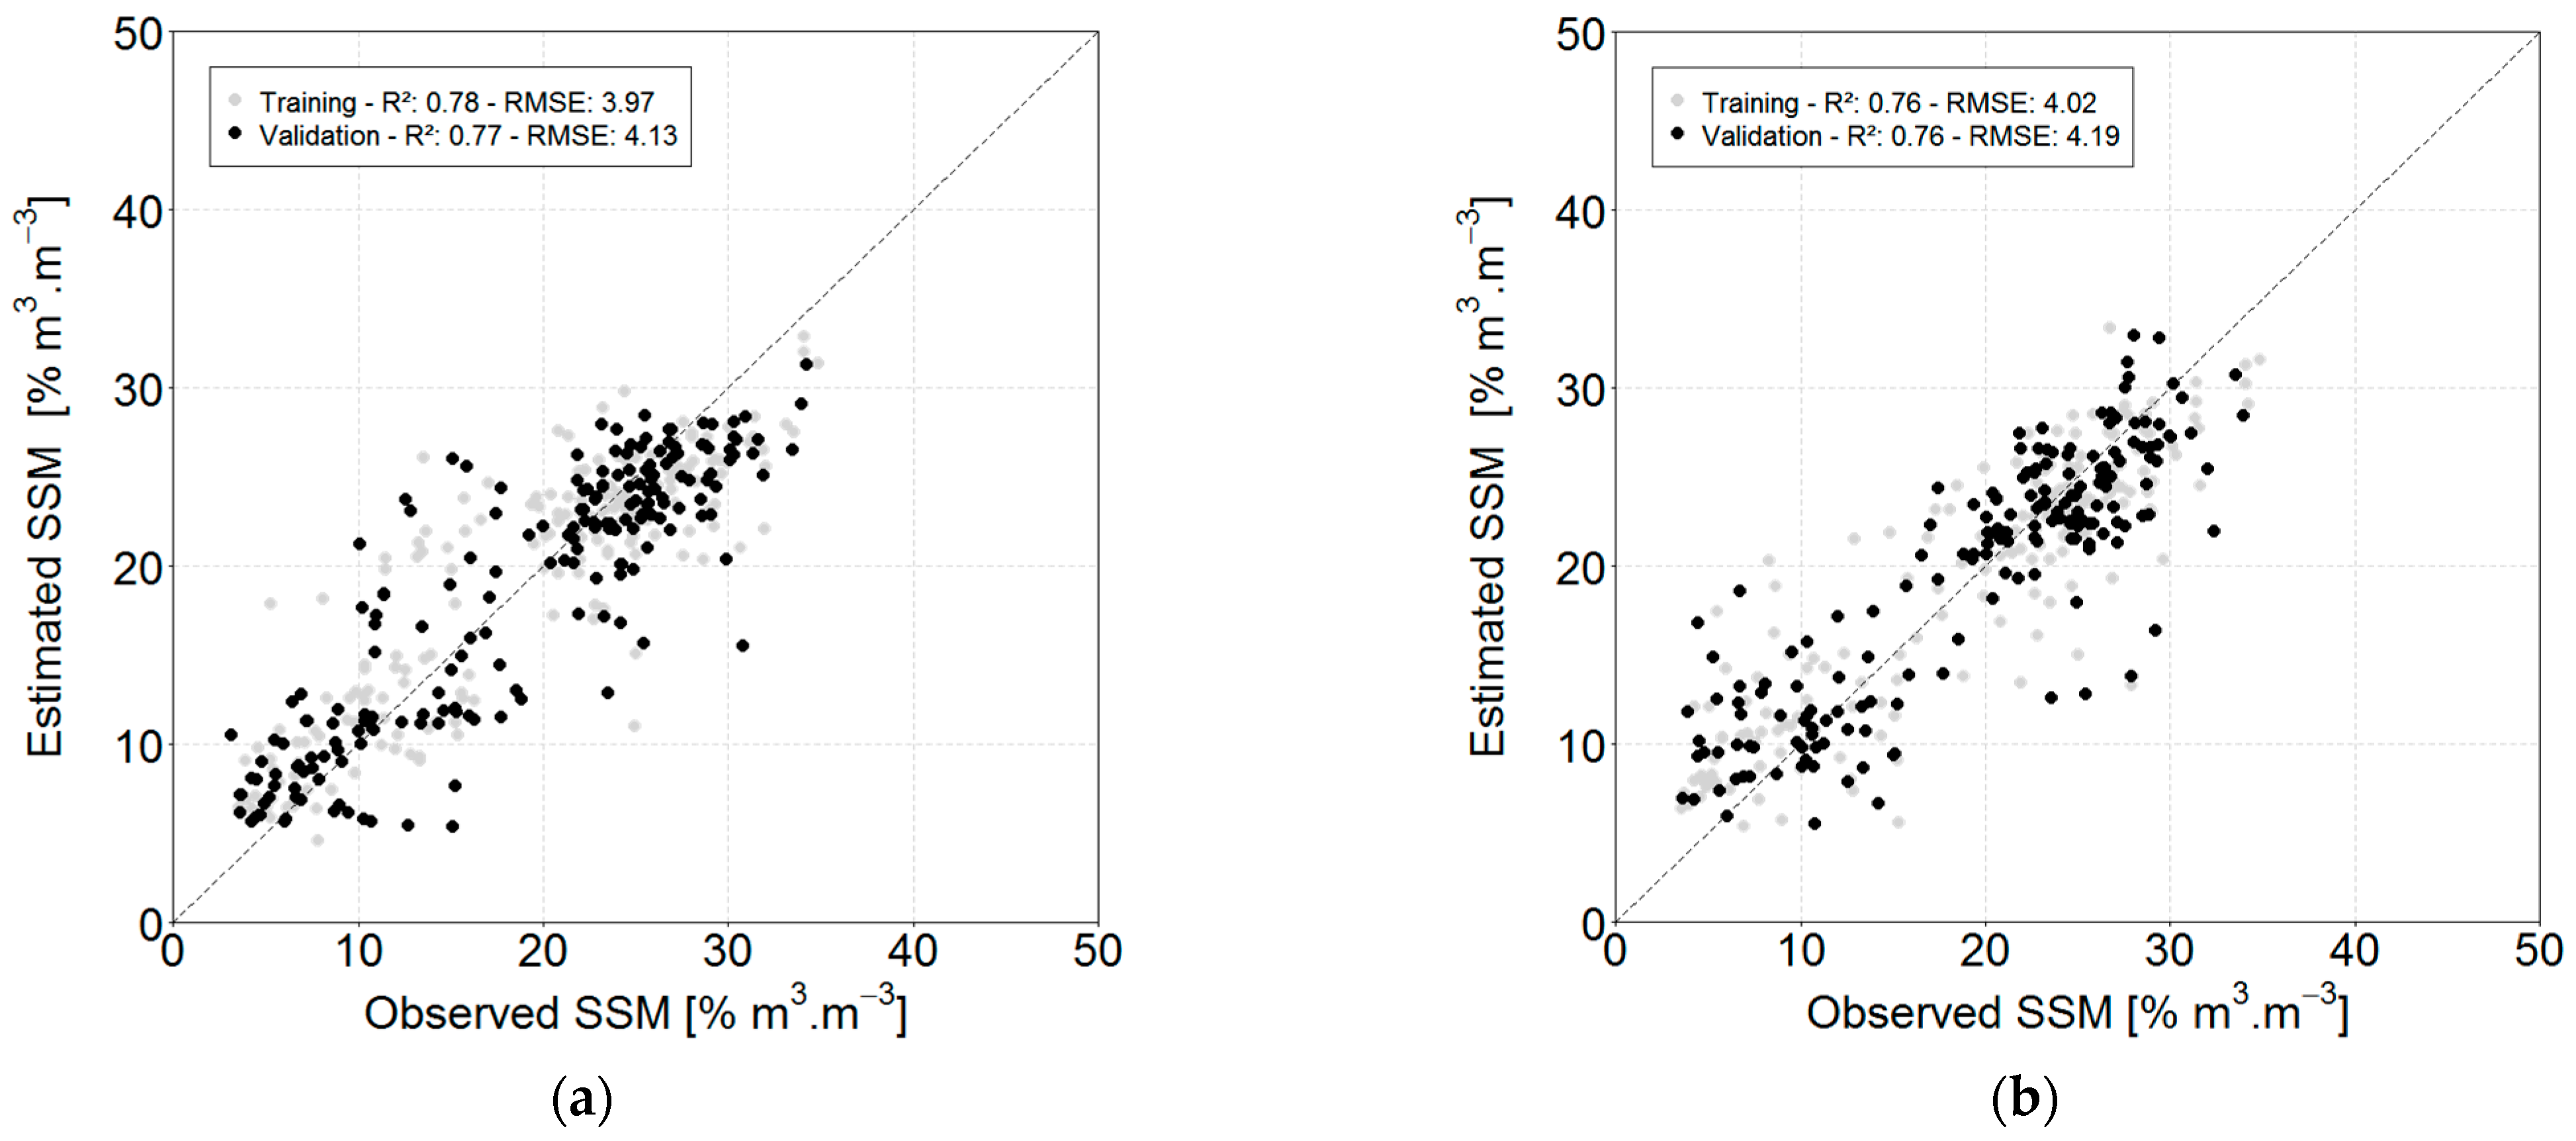
3.2. Evolution of the Statistical Performance at the Intra-Plot Spatial Scale
4. Conclusions
Author Contributions
Institutional Review Board Statement
Informed Consent Statement
Data Availability Statement
Acknowledgments
Conflicts of Interest
References
- Baghdadi, N.; Aubert, M.; Zribi, M. Use of TerraSAR-X data to retrieve soil moisture over bare soil agricultural fields. IEEE Trans. Geosci. Remote Sens. Lett. 2012, 9, 512–516. [Google Scholar] [CrossRef]
- Maleki, M.; Amini, J.; Notarnicola, C. Soil roughness retrieval from TerraSar-X data using neural network and fractal method. Adv. Space Res. 2019, 64, 1117–1129. [Google Scholar] [CrossRef]
- Zribi, M.; Kotti, F.; Lili-Chabaane, Z.; Baghdadi, N.; Ben Issa, N.; Amri, R.; Amri, B.; Chehbouni, A. Soil texture estimation over a semiarid area using TerraSAR-X radar data. IEEE Trans. Geosci. Remote Sens. Lett. 2012, 9, 353–357. [Google Scholar] [CrossRef]
- Aubert, M.; Baghdadi, N.; Zribi, M.; Douaoui, A.; Loumagne, C.; Baup, F.; El Hajj, M.; Garrigues, S. Analysis of TerraSAR-X data sensitivity to bare soil moisture, roughness, composition and soil crust. Remote Sens. Environ. 2011, 115, 1801–1810. [Google Scholar] [CrossRef]
- Gorrab, A.; Zribi, M.; Baghdadi, N.; Mougenot, B.; Chabaane, Z.L. Potential of X-Band TerraSAR-X and COSMO-SkyMed SAR data for the assessment of physical soil parameters. Remote Sens. 2015, 7, 747–766. [Google Scholar] [CrossRef]
- Mirsoleimani, H.R.; Sahebi, M.R.; Baghdadi, N.; El Hajj, M. Bare soil surface moisture retrieval from Sentinel-1 SAR data based on the calibrated IEM and Dubois models using neural networks. Sensors 2019, 19, 3209. [Google Scholar] [CrossRef] [PubMed]
- El Hajj, M.; Baghdadi, N.; Zribi, M.; Belaud, G.; Cheviron, B.; Courault, D.; Charron, F. Soil moisture retrieval over irrigated grassland using X-band SAR data. Remote Sens. Environ. 2016, 176, 202–218. [Google Scholar] [CrossRef]
- Oh, Y.; Sarabandi, K.; Ulaby, F.T. An empirical model and an inversion technique for radar scattering from bare soil surfaces. IEEE Trans. Geosci. Remote Sens. 1992, 30, 370–381. [Google Scholar] [CrossRef]
- Dubois, P.C.; van Zyl, J.; Engman, T. Measuring soil moisture with imaging radars. IEEE Trans. Geosci. Remote Sens. 1995, 33, 915–926. [Google Scholar] [CrossRef]
- Fung, A.K.; Li, Z.; Chen, K.-S. Backscattering from a randomly rough dielectric surface. IEEE Trans. Geosci. Remote Sens. 1992, 30, 356–369. [Google Scholar] [CrossRef]
- Attema, E.P.W.; Ulaby, F.T. Vegetation modeled as a water cloud. Radio Sci. 1978, 13, 357–364. [Google Scholar] [CrossRef]
- Fieuzal, R.; Baup, F. Improvement of bare soil semiempirical radar backscattering models (Oh and Dubois) with SAR multi-spectral satellite data (at X, C and L bands). Adv. Remote Sens. 2016, 5, 296–314. [Google Scholar] [CrossRef]
- Fieuzal, R.; Baup, F. Statistical estimation of backscattering coefficients in X-band over bare agricultural aoils. In Proceedings of the 2020 Mediterranean and Middle-East Geoscience and Remote Sensing Symposium (M2GARSS), Tunis, Tunisia, 9–11 March 2020; pp. 302–305. [Google Scholar]
- Baup, F.; Fieuzal, R.; Marais-Sicre, C.; Dejoux, J.-F.; le Dantec, V.; Mordelet, P.; Claverie, M.; Hagolle, O.; Lopes, A.; Keravec, P.; et al. MCM’10: An experiment for satellite multi-sensors crop monitoring from high to low resolution observations. In Proceedings of the 2012 IEEE International Geoscience and Remote Sensing Symposium, Munich, Germany, 22–27 July 2012; pp. 4849–4852. [Google Scholar]
- Breit, H.; Fritz, T.; Balss, U.; Lachaise, M.; Niedermeier, A.; Vonavka, M. TerraSAR-X SAR processing and products. IEEE Trans. Geosci. Remote Sens. 2010, 48, 27–40. [Google Scholar] [CrossRef]
- Breiman, L. Random Forests. Mach. Learn. 2001, 45, 5–32. [Google Scholar] [CrossRef]
- Fieuzal, R.; Marais, S.C.; Baup, F. Estimation of corn yield using multi-temporal optical and radar satellite data and artificial neural networks. Int. J. Appl. Earth Obs. Geoinf. 2017, 57, 14–23. [Google Scholar] [CrossRef]


| Mode | Acquisition Date | Orbit Pass | Incidence | Pixel |
|---|---|---|---|---|
| Angle | Size | |||
| (°) | (m) | |||
| Spotlight | 03/05/10; 05/21/10; 07/15/10; 08/17/10; 09/30/10 | D | 53.3 | 1.5 |
| 10/11/10; 10/22/10; 11/02/10; 11/13/10; 11/24/10 | ||||
| StripMap | 02/21/10; 03/26/10; 05/09/10; 05/20/10; 07/14/10 | D | 27.3 | 2.75 |
| 08/16/10; 09/29/10; 10/10/10; 10/21/10; 11/12/10; 11/23/10 |
Publisher’s Note: MDPI stays neutral with regard to jurisdictional claims in published maps and institutional affiliations. |
© 2022 by the authors. Licensee MDPI, Basel, Switzerland. This article is an open access article distributed under the terms and conditions of the Creative Commons Attribution (CC BY) license (https://creativecommons.org/licenses/by/4.0/).
Share and Cite
Fieuzal, R.; Baup, F. Estimation of Surface Soil Moisture at the Intra-Plot Spatial Scale by Using Low and High Incidence Angles TerraSAR-X Images. Environ. Sci. Proc. 2021, 5, 6. https://doi.org/10.3390/IECG2020-08528
Fieuzal R, Baup F. Estimation of Surface Soil Moisture at the Intra-Plot Spatial Scale by Using Low and High Incidence Angles TerraSAR-X Images. Environmental Sciences Proceedings. 2021; 5(1):6. https://doi.org/10.3390/IECG2020-08528
Chicago/Turabian StyleFieuzal, Rémy, and Frédéric Baup. 2021. "Estimation of Surface Soil Moisture at the Intra-Plot Spatial Scale by Using Low and High Incidence Angles TerraSAR-X Images" Environmental Sciences Proceedings 5, no. 1: 6. https://doi.org/10.3390/IECG2020-08528
APA StyleFieuzal, R., & Baup, F. (2021). Estimation of Surface Soil Moisture at the Intra-Plot Spatial Scale by Using Low and High Incidence Angles TerraSAR-X Images. Environmental Sciences Proceedings, 5(1), 6. https://doi.org/10.3390/IECG2020-08528