Article

Online User Review Analysis for Product Evaluation and Improvement

1
College of Creativity and Art Design, Zhejiang University City College, Hangzhou 310015, China
2
College of Computer Science and Technology, Zhejiang University, Hangzhou 310058, China
*
Author to whom correspondence should be addressed.
J. Theor. Appl. Electron. Commer. Res. 2021, 16(5), 1598-1611; https://doi.org/10.3390/jtaer16050090
Submission received: 11 April 2021 / Revised: 8 May 2021 / Accepted: 11 May 2021 / Published: 13 May 2021
(This article belongs to the Section e-Commerce Analytics)

Abstract

:
Traditional user research methods are challenged for the decision-making in product design and improvement with the updating speed becoming faster, considering limited survey scopes, insufficient samples, and time-consuming processes. This paper proposes a novel approach to acquire useful online reviews from E-commerce platforms, build a product evaluation indicator system, and put forward improvement strategies for the product with opinion mining and sentiment analysis with online reviews. The effectiveness of the method is validated by a large number of user reviews for smartphones wherein, with the evaluation indicator system, we can accurately predict the bad review rate for the product with only 9.9% error. And improvement strategies are proposed after processing the whole approach in the case study. The approach can be applied for product evaluation and improvement, especially for the products with needs for iterative design and sailed online with plenty of user reviews.

1. Introduction

To improve enterprises’ competitiveness and satisfy the increasing consumer demands, the updating speed of products has become faster [1,2]. A novel way of product innovation—Iterative Design of Product (IDP) [3]—is created. IDP refers to the process of dividing a product’s update design process into multiple iterative short-term phases, and through multiple-round improvements based on user feedback to update the product more quickly to meet the user needs [4,5]. Therefore, the period of product design and manufacture is much shorter than before, and the analysis of user feedback is becoming a vital step.
Traditional user research and product planning take a long stage, and due to the restrictions of time and effort, traditional methods have their limitations, e.g., limited survey scope, insufficient user feedback, and time-consuming. And after long-term research/planning, unpredictable problems can arise in the development process. Furthermore, when the product goes on the market, market reaction is also difficult to predict. Therefore, it is critical to excavate and analyze the feedback and demands of consumers in a fast and effective manner for IDP [6].
With the rise of E-commerce and social networks, both the types and sizes of data associated with human society are increasing at an unprecedented rate. These data are more and more influential in research and industrial fields, such as health care, financial services, and business advice [7,8,9]. Numerous online reviews related to products are becoming an effective data stream of user research. Accordingly, the approach that relies on small-scale data to discover the rules of unknown areas tends to be replaced with big data analysis [10]. Compared with traditional user research methods, big-data-driven methods are more efficient, cost-effective, and with wider survey scope. Moreover, online reviews are spontaneously generated by users without interference, thus more reliable and precise to represent the user needs [9,11]. With online reviews, designers no longer need to act passively to user feedback but can explore the potential value of the user data spontaneously.

1.1. Theoretical Framework

Recent studies have found that manufacturers can make use of online review data to make favorable decisions and gain competitive advantages [12,13]. And there are plenty of studies applying nature language techniques or machine learning techniques to mining user requirements from online reviews, such as review cleaning, information extraction, and sentiment analysis [14].
For review cleaning, it is to remove noise reviews including advertisements, meaningless reviews, malicious reviews, etc. Although big data analysis has many advantages over traditional user research, the usefulness analysis of data is becoming more and more important due to the continuous increase in the volume and generation speed of data [15]. By eliminating useless data, the data can become more valuable [16]. Banerjee et al. [17] believe that the characteristics of reviewers (e.g., enthusiasm, participation, experience, reputation, competence, and community) has a direct impact on the usefulness of reviews. Karimi et al. [18] believe that visual cues are useful for the identification of online reviews. Forman et al. [19] study the usefulness of reviews in the e-commerce environment, taking the professional knowledge and attractiveness of the reviewers as the two criteria for evaluating the usefulness of reviews.
Obtaining valuable information from useful reviews is another valuable research direction. These studies focus on automatically review comprehension aiming to reduce labor costs. Dave et al. [20] conduct a systematic study on opinion extraction and semantic classification, and the experimental results are better than machine learning methods. Based on Chinese reviews, Zhang et al. [21] detect the shortcomings of different brands of cosmetics through the method of feature extraction algorithm, helping manufacturers improve product quality and competitiveness. Novgolodov et al. [22] extract product descriptions from user reviews using deep multi-task learning.
Sentiment analysis for online reviews is the method to figure out users’ attitudes and opinions for certain aspects. And the method is widely implemented for public opinion monitoring, marketing, customer services, etc. Jing et al. [23] establish a two-stage verification model and compare the data analysis results of the two stages, proving that the sentiment analysis method is more effective than traditional user research. In addition, Kang et al. [24] use the sentiment analysis method to analyze six features of mobile applications, such as speed and stability, achieving good results. Yang et al. [25] proposed a novel approach for Chinese E-Commerce product reviews based on deep learning.
These studies mostly solve the online review issues from the technique perspective aimed at improving accuracy and obtaining better results for different situations. However, few studies systematically consider the application of these techniques, i.e., how can the results contribute to product design and improvement process for manufacturers. As the enterprise resources are limited, mass information or user requirements derived from online reviews cannot be implemented completely. Therefore, it is important to analyze the improvement priority for different aspects of the product. Moreover, enterprises require specific suggestions for product design and improvement, and information extraction or sentiment analysis can somehow help but is not enough.

1.2. Aims and Research Questions

In this study, we propose a novel approach for product evaluation and improvement based on online review text mining and sentiment analysis. The approach aims at solving the strategy orientated issue for product design and improvement based on online user reviews. Concretely, with the approach we can analyze the usefulness of online reviews by extracting product attributes and user emotion, evaluate the priority of product attributes to improve by evaluation indicator system, and provide improvement strategies.
To validate the effectiveness of the method, we take the smartphone as an example for the case study as the smartphone is one of the products that have varieties of types with fast iteration rate. The specific research questions (RQ) for the case study are:
  • RQ1 What are the results for product attribute acquisition and useful review analysis?
  • RQ2 Does the evaluation indicator system works for product evaluation and what’s the accuracy for evaluation system for priority?
  • RQ3 What are the results for product improvement strategies, i.e., what’s the valuable improvement ideas refined?
Although the case study takes the smartphone as an example, the method can definitely be applied to other products as long as to adjust the product attributes for different products. Thus, the research can generally contribute to manufacturers for product design and improvement with applying systematical strategy suggestions.

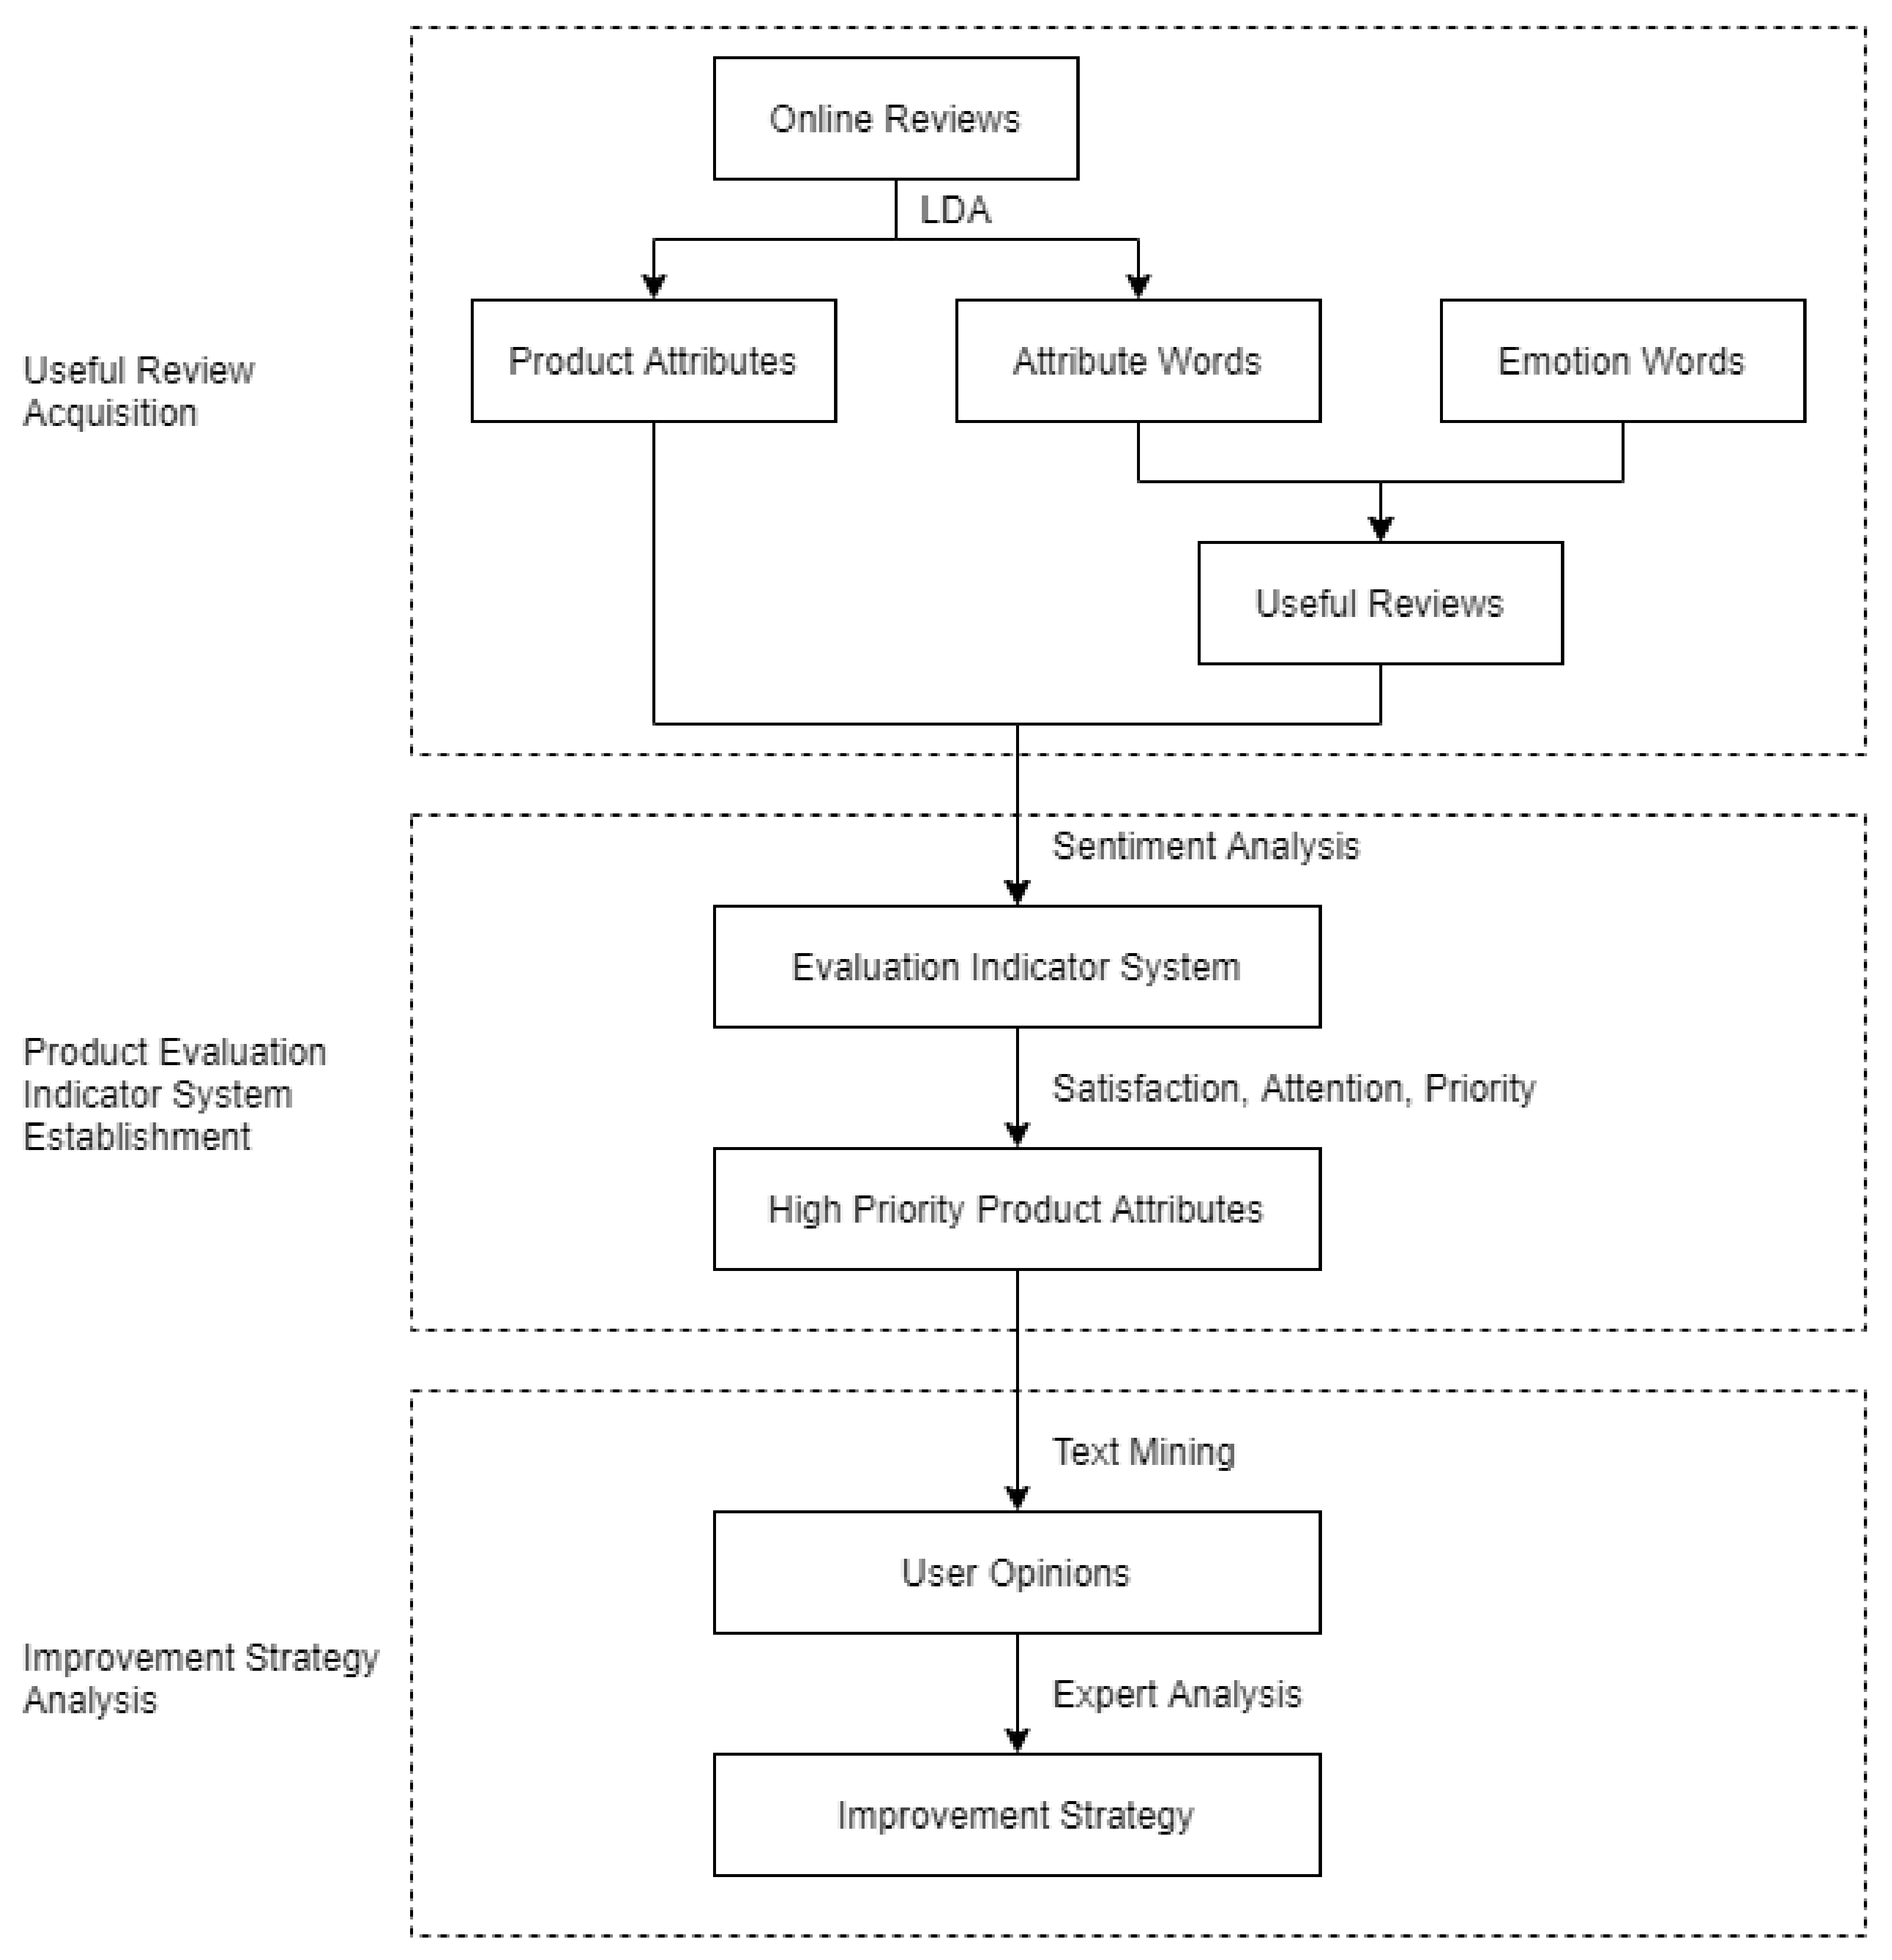
2. Materials and Methods

In this section, we introduce the main steps of the proposed method to systematically analyze online user reviews and provide improvement ideas for products. The overall framework of the method is shown in Figure 1, which mainly contains three steps:
  • Useful review acquisition. We apply a web crawler system to collect online reviews and preprocess the reviews with Latent Dirichlet Allocation (LDA) [26] to obtain product attributes and user emotion. Those reviews that contain both attribute words and emotion words are considered as useful reviews.
  • Product evaluation indicator system establishment. With the product attributes and user emotion, we establish multi-dimensional indicators (e.g., users’ satisfaction and attention) to evaluate the priority of product attributes for improvement.
  • Improvement strategy analysis. By selecting negative reviews for target product attributes, with the technology of text mining, we can find the dissatisfaction and propose improvement strategies.

2.1. Useful Review Acquisition

The first step is to acquire product attributes from reviews and conduct useful review analysis. A product attribute is extracted and summarized from reviews to reflect a series of related attribute words. For example, the product attribute of appearance may contain attribute words, such as colors, shapes, materials, sizes, etc.

2.1.1. Product Attribute Acquisition

To get product attributes, the current tends to select attribute words with higher statistic word frequencies artificially according to existing knowledge. These product attributes are considered to be the ones users are concerned about. However, in some reviews, the attribute words will appear more than once, which will mislead the statistics of word frequencies. Therefore, it is necessary to add an artificial screening method, but the results may be subjective.
To solve the problems, LDA topic extraction method is applied. LDA is a topic extraction method that can summarize the topic for one document, representing the product attribute for one review, so it is used to extract product attributes after tokenization for reviews. The main idea of LDA is to regard each review as a mixed probability distribution of all topics, in which the topics are subjected to a probability distribution based on words. Based on this idea, the LDA model can be acquired by adding the Dirichlet priority. The LDA module from scikit-learn—a Python package—is used in our research. However, the results from the LDA module have noises. For example, some topics only contain adjectives, adverbs, and verbs, and they are deleted manually. The rest of the topics are user-concerned and represent product attributes. Each topic is constituted by a series of words describing one of the product attributes, and these words are defined as attribute words.
By setting different numbers of product attributes (K), the similarities among different product attributes are calculated. The smaller the similarity value, the smaller the quantity of repeated words among the product attributes, and the corresponding K is more appropriate [27]. With the method, we can determine the appropriate number of topics to represent product attributes.

2.1.2. Useful Review Analysis

Whether a review is useful is determined by if the review contains both attribute words and the user’s emotional inclination towards the product attributes (emotion words). The attribute words are obtained in the previous step of product attribute acquisition, while emotion words are obtained with HowNet [28], which is a common sense knowledge base to reveal the meaning for concepts and relationship between concepts in Chinese and English established by a famous expert in machine translation Mr. Dong Zhendong, with decades of efforts. HowNet has been many scholars used in the study of Chinese text, and the emotion word thesaurus in HowNet is now one of the most famous thesauri for Chinese emotion words. In this paper, attribute words obtained above and emotion words in HowNet are used as the basis to evaluate the usefulness of reviews.
The method for review usefulness analysis is formulated in (1):
r i = r i a × r i e ,
where r i is the evaluation result for the i-th review, r i a represents if the i-th review contains attribute words, and r i e represents if the i-th review contains emotion words. The three parameters are all binary that 1 means ‘yes’ and 0 means ‘no’. And if the i-th review both contains attribute words and emotion words, r i equals to 1 representing the review is useful.

2.2. Product Evaluation Indicator System

Based on the attribute words in product attributes, the useful reviews are annotated with one or several product attributes if the reviews contain corresponding attribute words, since in one review, the user can express multiple product attributes.
To figure out how the users evaluate the product, we apply the sentiment analysis tool TextBlob [29] to calculate the sentiment score of an individual review expressing user emotion, and the result represents the individual user satisfaction. The sentiment score of the i-th review in the j-th product attribute is marked as s i j , which is ranged from [ 1 , 1], where 1 means extreme dissatisfaction, while 1 means extreme satisfaction.
We construct three indicators for product evaluation—User satisfaction (S), User Attention (A) and Priority (P). As the three indicators demonstrate concrete product attributes, each product attribute will have the three indicators. And to distinguish the overall indicators and concrete indicators for each product attributes, we add subscript for the abbreviations (e.g., for the 1st product attribute, User satisfaction is marked as S 1 ). And details are as follows:
  • To understand users’ satisfaction ( S j ) with the j-th product attribute, the average emotion value is calculated as Equation (2), where N j means the number of reviews in the j-th product attribute group. High S j represents that the users are generally satisfied with the j-th product attribute.
    S j = i = 1 N j s i j N j .
  • The second indicator for product evaluation is users’ attention to individual product attributes. If a review comments on one product attribute, then it is considered that the reviewer is concerned about the product attribute. To measure the user attention ( A j ) on the j-th product attribute, we calculate the proportion of reviews in the corresponding product attribute group as Equation (3), where N is the total number of useful reviews. High A j represents that the j-th product attribute is hotly discussed in user reviews and gains high user attention.
    A j = N j N .
  • For one product attribute, the manufacturer aims to make more users more satisfied, which is measured by maximizing S j × A j . However, due to the limited resources of the enterprise, the decision that maximizes the benefits of the enterprise is the optimal decision. Therefore, it is important to select several high-priority product attributes for product improvement first. And the priority ( P j ) is calculated by the evaluation promotion space measurement as Equation (4), which means that lower satisfaction and higher user attention make higher evaluation promotion space.
    P j = ( 1 S j ) × A j .

2.3. Improvement Strategy Analysis

Through the evaluation indicator system, we can roughly determine the directions (product attributes) for product improvement. However, it is not enough since lacking concrete improvement strategies. To mine the details for the improvement of product attributes, we refine the opinions of negative reviews on related attributes with Baidu’s AipNlp, which is a leading NLP (Natural Language Processing) toolkit for Chinese, so as to analyze the dissatisfaction of users. The specific analysis steps of negative review mining are as follows:
  • Obtain related reviews in the target product attribute groups.
  • Select negative reviews with s i j < 0 .
  • Apply text mining methods to extract users’ opinions and then manually adjust the results.

3. Case Study and Result Discussion

In this section, we conduct a case study on the smartphone with online user reviews applying the proposed approach and discuss the results for the three main research questions. For the structure of the section, we firstly introduce the review datasets used and then discuss the research questions.

3.1. Data Collection and Preprocessing

In China, Jingdong (JD.com) and Taobao (taobao.com) are the most well-known E-commerce platforms. As Jingdong adopts a B2C (Business to Costomer) model, there is less internal competition than Taobao—a C2C (Consumer to Consumer) platform. Thus, Jingdong has fewer fake reviews, and the data is more reliable for analysis.
We crawl a total of 1,257,482 online reviews from the top 60 best-sold smartphones. To ensure the accuracy of review data, we preprocess the crawled reviews by deleting duplicated reviews, reviews containing advertisements, and reviews with punctuation marks, and, finally, get 1,189,357 reviews.

3.2. Results for Useful Review Acquisition (RQ1)

For RQ1, we firstly analyze the product attributes for the smartphone. For determine the K parameter of LDA to obtain appropriate number of topics, we increase K one by one, and find that (1) when K is less than 18, the similarity decreases with K; and (2) when K is greater than 18, the similarity increases with K. Therefore, when K equals 18, the similarity among the product attributes is the lowest. Therefore, We set K to 18 and get 18 topics from the LDA outputs, and each topic represents one product attribute. However, three of them only contain adjectives, adverbs, and verbs. These three topics cannot represent product attributes, thus being removed manually.
And for the aim of topic interpretation, we invited two professional smartphone designers from Huawei to discuss the product attributes for smartphones and interpret attribute words in each topic with one of the product attributes. Combined with the classification standards of smartphone attributes on the official websites of well-known enterprises, such as Apple [30] and Huawei [31], the remaining 15 topics are finally interpreted with product attributes. And the explanations for the 15 product attributes are list in Table 1. The number of attribute words corresponding to each product attribute is shown in Table 2.
After getting product attributes and attribute words for the smartphone, we process the useful review analysis and finally get 808,426 useful reviews based on Equation (1).

3.3. Product Evaluation Indicator System Establishment and Validation (RQ2)

As a result, we establish an evaluation indicator system for the smartphone with 15 (product attributes) × 3 (indicators) parameters, and the three indicators are S (User Satisfaction), A (User Attention), and P (Priority).
To answer RQ2, it is to examine the effectiveness of the evaluation indicator system about the accuracy of the evaluation for the product. In Jingdong, users can give an overall evaluation of the product with good/medium/bad reviews. The bad review rate is an important indicator to demonstrate the urgency of improvement for the product that high bad review rate means that there is much room for improvement.
The bad review rate thus can be regarded as the ground truth for the evaluation indicator system. Based on the principal component analysis (PCA) [32], we apply multiple linear regression analysis between evaluation indicators and bad review rate. If the model can accurately predict the bad review rate with evaluation indicators, the effectiveness of the evaluation system is verified.

3.3.1. Principle Component Analysis

We choose the comprehensive indicator P for the validation as the validation for P can demonstrate the value of S and A. Firstly, we apply the Pearson correlation coefficient [33] to measure the correlation between the P of 15 product attributes and the bad review rate on 60 smartphones. If the coefficient value >0.3, it is considered that there is a correlation between the two sets of data, and if the value >0.5, the correlation is strong. The result for the Pearson correlation coefficient is shown in Table 3, and we can conclude that P for 7 product attributes—battery, service, price, durability, screen, data connection, and operating system have correlation with bad review rate.
Then, we apply PCA to decompose the 7 product attributes to reduce the complexity of linear regression analysis. The result of PCA is shown in Table 4. The variance contribution of the first principle component (PC) and second PC is high and the cumulative variance contribution of the two PC reaches 76.889%. With the analysis of eigenvector in Table 5, we find the first PC mainly represents operating system, data connection, service, battery, screen, and durability, while the second PC mainly represents price. The two PC are in line with the ‘performance’ and ‘cost’ pursued by customers, therefore, we select the two PC for linear regression.

3.3.2. Multiple Linear Regression Analysis

After the dimension reduction process for the 7 product attributes, we apply multiple linear regression with the 2 PC and bad review rate. In 60 smartphone samples of the first and second PC with the bad review rate, we randomly choose 2/3 samples for linear model training and the rest 1/3 for testing. The result for the multiple linear regression equation is:
y = 0.002 + 0.032 x 1 + 0.028 x 2 ( R 2 = 0.537 , p = 0.017 ( < 0.05 ) ) ,
where y is the predicted bad review rate, and x 1 and x 2 are the first and second PC. Generally, if 0.5 < R 2 < 0.7 , it is indicating that the effect size is moderate, and if R 2 > 0.7 , it is considered strong effect size [34]. We believe that the R 2 indicates that the model has a good fitting effect with the data. And the p-value for the significance test of the overall regression effect of the model demonstrates the statistical significance for the multiple linear regression.
For model testing, we calculate the predicted bad review rate for the rest 20 smartphone samples and then compare the predicted results with ground truth data, which is listed in Table 6. The difference between the predicted bad review rate and true value is small, with the mean absolute percentage error (MAPE) of 9.9%. According to the interpretation of MAPE values by Montaño et al. [35], if MAPE is less than 10%, the model is highly accurate predicting. The result shows that with multiple linear regression model based on evaluation indicators has good predictability for the bad review rate, which validates the effectiveness of the evaluation indicator system.

3.4. Improvement Strategy Analysis for Smartphones (RQ3)

In this part, we firstly analyze the evaluation indicators for smartphones to figure out those product attributes that need the most improvement and then propose concrete improvement ideas.

3.4.1. The Analysis of Evaluation Indicators for Overall Smartphones

To understand the general evaluation for the smartphones on the market, we analysis the overall review data for 60 smartphones, and calculate S , A , P by Equations (2)–(4). Table 7 shows the results of overall evaluation indicators.
By analyzing the results, it is found that users are most satisfied with appearance, price, and processor, while least satisfied with data connection, packaging list, and audio & video. For user attention, operating system and appearance are the most concerning attributes, while packaging list, size & weight, and data connection are the least. The result may be due to the fact that appearance and operating system are the two product attributes that users are most exposed to, which has the greatest impact on user experience. For the priority, the most urgent product attribute for improvement is the operating system, followed by appearance and service.

3.4.2. The Analysis of Evaluation Indicators for Individual Smartphones

The evaluation indicator system can also be applied for one smartphone as long as filtering reviews for the target smartphone. Here, we choose iPhone X for the case study. As a product commemorating the tenth anniversary of Apple’s iPhone, iPhone X sets a direction for the development of smartphones with its full display screen, innovative interactive mode, and unique Face ID, which sparked heated discussion among users.
The results of the evaluation indicators for iPhone X are shown in Table 8. It is found that iPhone X users are most satisfied with size & weight, price, and appearance, while least satisfied with audio & video and packaging list. And Users are most concerned about operating system and service, while least concerned about storage and packaging list. Finally, the most urgent product attribute for improvement is the operating system, followed by appearance and service, which is as same as the overall results.

3.4.3. Improvement Idea Refining

Taking iPhone X as an example, the three product attributes with the highest priority are operating system, service, and appearance, so we apply the three steps on the three product attributes, and the results are shown in Table 9.
With the combined analysis of mining results and corresponding reviews, the users’ dissatisfaction with operating system lies in: the system is easy to collapse, unstable, bugs, slow boot, frozen, crash, overheating, slow response, insensitive, few functions, slow App download speed, poor software compatibility, etc.
The main opinions of dissatisfaction with service are poor customer service attitude, unprofessional, slow user event processing speed, slow delivery speed, poor courier service, poor after-sale service, cumbersome steps, etc. And the main problem is with the customer service, which is accounted for more than half of the negative reviews.
The dissatisfaction with appearance mainly lies in: the notch screen is not comfortable, ugly appearance, not good-looking, small size, dull color, no personality, less color for choice, general workmanship, defects, etc.
After finding out the users’ dissatisfaction, we put forward specific improvement strategies based on the opinions of experts. The specific improvement strategies for iPhone X are as follows:
  • Enhance the user experience of operating system: improve the stability, fluency, and compatibility of various App versions; Optimize speed and response speed of operating system, accelerate boot speed; Implement features to optimize the temperature control system; Enhance user experience for the game environment to improve the efficiency and fluency of games; Increase the construction of domestic server of App Store to speed up App updating and downloading.
  • Enhance customer service professionalism: improve customer service attitude, accelerate user event processing speed, simplify customer service process, and increase the staff of customer service; Improve the delivery services: speed up the delivery of products and transport speed, improve the delivery service attitude of couriers.
  • Enhance the personality of the smartphone: enrich the color of the product to provide a wealth of choices; Improve the standard of smartphone styling design in line with the current consumer aesthetic, reduce or eliminate the notch screen; Provide large size models to give consumers a variety of choices; Improve the workmanship of products: improve the production quality of OEM factories and reduce defects of smartphones.

3.5. Discussion

Overall, this study combined the techniques of big data, text mining, and sentiment analysis to acquire useful information from online user reviews for product evaluation and improvement. And the main contribution is that we establish a systematical approach to guide the manufacturers to analyze online user reviews, determine high priority product attributes to be improved, and propose concrete improvement strategies. The study is based on various finding in other studies like the validation of value of online user reviews for product development [36], product feature extraction methods and sentiment analysis of online reviews [37], and review helpfulness ranking [38]. These studies provide adequate technical and theoretical support for the establishment of product evaluation indicator system. And the product evaluation indicator system is validated with a linear regression model to predict true user satisfaction (bad review rate). As a consequence, we get the R 2 of 0.537 and MAPE of 9.9% and compared to Zhao et al. [39] that, likewise using online reviews to predict user satisfaction (rating) and getting 0.385 R 2 , we believe our product evaluation indicator system can accurately reflect users’ evaluation on the product. For other studies aiming at extract improvement ideas from online reviews [40,41], our approach consider the resource limitation of manufacturers and thus analyze the priority of different product attributes for improvement. Therefore, the improvement ideas acquired are the most urgent and important for product improvement based on our algorithm and have more practical meanings.

4. Conclusions and Future Work

Traditional product design uses questionnaires and interviews to obtain user feedback. However, these survey methods take a longer time, have smaller survey scope, and higher research costs, resulting in a longer design cycle. The advent of the big data era has provided a new idea for user opinion mining for product improvement. Designers can better understand user needs and make decisions through big data analysis and sentiment analysis. This paper proposes a product evaluation indicator system to support product improvement with combined methods of big data analysis and sentiment analysis. The proposed method can make a comprehensive and validated evaluation of the indicators of the products based on big data, get more user feedback within a shorter period, chase the users’ preferences more efficiently, and find the improvement strategies for the products.
Nevertheless, there are a few limitations for our study. Firstly, there are many manual steps in product attribute acquisition that will influence the results. Secondly, the improvement strategy mainly derives from user opinions which neglects the innovation of products due to the big data analysis is based on mass users. In addition, the cost for the product improvement is not considered in the strategy, but, practically, it is a factor that enterprises must take into account. Future studies can focus on the following directions:
  • Improve the automation of review analysis so that the method can be quickly migrated to other products.
  • Consider the tradeoff computing for the pursuit of user opinions, innovation, and cost.
  • Apply the improvement strategies to real production practice to validate the methods.

Author Contributions

Conceptualization, C.Y. (Cheng Yang) and L.W.; methodology, C.Y. (Cheng Yang); software, L.W. and K.T.; validation, K.T., C.Y. (Chunyang Yu), and Y.Z.; writing—original draft preparation, L.W.; writing—review and editing, L.W., Y.T. and Y.S. All authors have read and agreed to the published version of the manuscript.

Funding

This research is supported by the National Natural Science Foundation of China (No. 62002321), and Zhejiang Provincial Natural Science Foundation of China (No. Y18E050014).

Institutional Review Board Statement

Not applicable.

Informed Consent Statement

Not applicable.

Data Availability Statement

The data are not publicly available due to privacy or ethical.

Conflicts of Interest

The authors declare no conflict of interest. The funders had no role in the design of the study; in the collection, analyses, or interpretation of data; in the writing of the manuscript, or in the decision to publish the results.

References

  1. Eisenhardt, K.M.; Tabrizi, B.N. Accelerating Adaptive Processes: Product Innovation in the Global Computer Industry. Adm. Sci. Q. 1995, 40, 84–110. [Google Scholar] [CrossRef]
  2. Kessler, E.H.; Chakrabarti, A.K. Speeding up the pace of new product development. J. Prod. Innov. Manag. 1999, 16, 231–247. [Google Scholar] [CrossRef]
  3. Spanos, Y.E.; Vonortas, N.S.; Voudouris, I. Antecedents of innovation impacts in publicly funded collaborative R&D projects. Technovation 2015, 36, 53–64. [Google Scholar] [CrossRef]
  4. Tao, X.; Xianqiang, Z. Iterative innovation design methods of internet products in the era of big data. Packag. Eng. 2016, 37, 1–5. [Google Scholar]
  5. Dou, R.; Zhang, Y.; Nan, G. Customer-oriented product collaborative customization based on design iteration for tablet personal computer configuration. Comput. Ind. Eng. 2016, 99, 474–486. [Google Scholar] [CrossRef] [Green Version]
  6. Wang, C.; Zhao, W.; Wang, H.J.; Chen, L. Multidimensional customer requirements acquisition based on ontology. Jisuanji Jicheng Zhizao Xitong/Comput. Integr. Manuf. Syst. 2016, 22, 908–916. [Google Scholar]
  7. Lv, Z.; Song, H.; Member, S.; Basanta-val, P.; Steed, A.; Jo, M.; Member, S. Next-generation big data analytics: State of the art, challenges, and future research topics. IEEE Trans. Ind. Inform. 2017, 13, 1891–1899. [Google Scholar] [CrossRef] [Green Version]
  8. Erevelles, S.; Fukawa, N.; Swayne, L. Big Data consumer analytics and the transformation of marketing. J. Bus. Res. 2016, 69, 897–904. [Google Scholar] [CrossRef]
  9. Gharajeh, M.S. Biological Big Data Analytics. Adv. Comput. 2017, 1–35. [Google Scholar] [CrossRef]
  10. Roh, S. Big Data Analysis of Public Acceptance of Nuclear Power in Korea. Nucl. Eng. Technol. 2017, 49, 850–854. [Google Scholar] [CrossRef]
  11. Jin, J.; Liu, Y.; Ji, P.; Kwong, C.K. Review on recent advances in information mining from big consumer opinion data for product design. J. Comput. Inf. Sci. Eng. 2019, 19, 010801. [Google Scholar] [CrossRef]
  12. Hu, N.; Zhang, J.; Pavlou, P.A. Overcoming the J-shaped distribution of product reviews. Commun. ACM 2009, 52, 144–147. [Google Scholar] [CrossRef]
  13. Korfiatis, N.; García-Bariocanal, E.; Sánchez-Alonso, S. Evaluating content quality and helpfulness of online product reviews: The interplay of review helpfulness vs. review content. Electron. Commer. Res. Appl. 2012, 11, 205–217. [Google Scholar] [CrossRef]
  14. Lim, S.; Henriksson, A.; Zdravkovic, J. Data-Driven Requirements Elicitation: A Systematic Literature Review. SN Comput. Sci. 2021, 2, 1–35. [Google Scholar] [CrossRef]
  15. Baizhang, M.; Zhijun, Y. Product features extraction of online reviews based on LDA model. Comput. Integr. Manuf. Syst. 2014, 20, 96–103. [Google Scholar]
  16. Lycett, M. ‘Datafication’: Making sense of (big) data in a complex world. Eur. J. Inf. Syst. 2013, 22, 381–386. [Google Scholar] [CrossRef] [Green Version]
  17. Banerjee, S.; Bhattacharyya, S.; Bose, I. Whose online reviews to trust? Understanding reviewer trustworthiness and its impact on business. Decis. Support Syst. 2017, 96, 17–26. [Google Scholar] [CrossRef]
  18. Karimi, S.; Wang, F. Online review helpfulness: Impact of reviewer profile image. Decis. Support Syst. 2017, 96, 39–48. [Google Scholar] [CrossRef]
  19. Forman, C.; Ghose, A.; Wiesenfeld, B. Examining the relationship between reviews and sales: The role of reviewer identity disclosure in electronic markets. Inf. Syst. Res. 2008, 19, 291–313. [Google Scholar] [CrossRef]
  20. Dave, K.; Lawrence, S.; Pennock, D.M. Mining the peanut gallery: Opinion extraction and semantic classification of product reviews. In Proceedings of the 12th International Conference on World Wide Web, WWW 2003, Budapest, Hungary, 20–24 May 2003; pp. 519–528. [Google Scholar] [CrossRef]
  21. Zhang, W.; Xu, H.; Wan, W. Weakness Finder: Find product weakness from Chinese reviews by using aspects based sentiment analysis. Expert Syst. Appl. 2012, 39, 10283–10291. [Google Scholar] [CrossRef]
  22. Novgorodov, S.; Guy, I.; Elad, G.; Radinsky, K. Generating product descriptions from user reviews. In Proceedings of the World Wide Web Conference, San Francisco, CA, USA, 13–17 May 2019; pp. 1354–1364. [Google Scholar]
  23. Jing, R.; Yu, Y.; Lin, Z. How Service-Related Factors Affect the Survival of B2T Providers: A Sentiment Analysis Approach. J. Organ. Comput. Electron. Commer. 2015, 25, 316–336. [Google Scholar] [CrossRef]
  24. Kang, D.; Park, Y. Review-based measurement of customer satisfaction in mobile service: Sentiment analysis and VIKOR approach. Expert Syst. Appl. 2014, 41, 1041–1050. [Google Scholar] [CrossRef]
  25. Yang, L.; Li, Y.; Wang, J.; Sherratt, R.S. Sentiment analysis for E-commerce product reviews in Chinese based on sentiment lexicon and deep learning. IEEE Access 2020, 8, 23522–23530. [Google Scholar] [CrossRef]
  26. Blei, D.M.; Ng, A.Y.; Jordan, M.I. Latent dirichlet allocation. J. Mach. Learn. Res. 2003, 3, 993–1022. [Google Scholar]
  27. Juan, C. A Method of Adaptively Selecting Best LDA Model Based on Density. Chin. J. Comput. 2008, 31, 1781–1787. [Google Scholar]
  28. Dong, Z.; Dong, Q. Hownet and the Computation of Meaning (with Cd-rom); World Scientific: Beijing, China, 2006. [Google Scholar]
  29. Textblob Documentation. Available online: https://buildmedia.readthedocs.org/media/pdf/textblob/latest/textblob.pdf (accessed on 13 May 2021).
  30. iPhone—Apple. Available online: https://www.apple.com/iphone/ (accessed on 20 March 2021).
  31. HUAWEI Phones. Available online: https://consumer.huawei.com/cn/phones/?ic_medium=hwdc&ic_source=corp_header_consumer (accessed on 20 March 2021).
  32. Wold, S.; Esbensen, K.; Geladi, P. Principal component analysis. Chemom. Intell. Lab. Syst. 1987, 2, 37–52. [Google Scholar] [CrossRef]
  33. Benesty, J.; Chen, J.; Huang, Y.; Cohen, I. Pearson correlation coefficient. In Noise Reduction in Speech Processing; Springer: Berlin, Heidelberg, 2009; pp. 1–4. [Google Scholar]
  34. Moore, D.S.; Kirkland, S. The Basic Practice of Statistics; WH Freeman: New York, NY, USA, 2007; Volume 2. [Google Scholar]
  35. Montaño, J.; Palmer, A.; Sesé, A.; Cajal, B. Using the R-MAPE index as a resistant measure of forecast accuracy. Psicothema 2013, 25, 500–506. [Google Scholar] [CrossRef]
  36. Ho-Dac, N.N. The value of online user generated content in product development. J. Bus. Res. 2020, 112, 136–146. [Google Scholar] [CrossRef]
  37. Fan, Z.P.; Li, G.M.; Liu, Y. Processes and methods of information fusion for ranking products based on online reviews: An overview. Inf. Fusion 2020, 60, 87–97. [Google Scholar] [CrossRef]
  38. Wang, J.N.; Du, J.; Chiu, Y.L. Can online user reviews be more helpful? Evaluating and improving ranking approaches. Inf. Manag. 2020, 57, 103281. [Google Scholar] [CrossRef]
  39. Zhao, Y.; Xu, X.; Wang, M. Predicting overall customer satisfaction: Big data evidence from hotel online textual reviews. Int. J. Hosp. Manag. 2019, 76, 111–121. [Google Scholar] [CrossRef]
  40. Zhang, H.; Rao, H.; Feng, J. Product innovation based on online review data mining: A case study of Huawei phones. Electron. Commer. Res. 2018, 18, 3–22. [Google Scholar] [CrossRef]
  41. Ibrahim, N.F.; Wang, X. A text analytics approach for online retailing service improvement: Evidence from Twitter. Decis. Support Syst. 2019, 121, 37–50. [Google Scholar] [CrossRef] [Green Version]
Figure 1. Overall framework of the approach.
Jtaer 16 00090 g001
Table 1. The explanation of the product attributes.
Product AttributeExplanation
packaging listList of items available for smartphone packaging.
size & weightThe length, width, height and weight of the smart phone.
processorThe CPU and GPU of the smartphone.
storageMemory capacity, read/write speed, etc.
batteryCapacity and endurance of the battery.
servicePre-sale consultation, after-sales service, etc.
sensorSensors, such as gyroscopes, light sensors, barometric pressure sensors, humidity sensors, etc.
priceThe price of the smartphone.
durabilityProduct durability and product quality.
shootCamera number, image accuracy, aperture size, image stabilization performance, etc.
screenScreen size, resolution, color gamut, and so on.
data connectionThe network performance of the smartphone.
appearanceThe shape, color, and material of the smartphone.
operating systemiOS or Android, and some applications and functions in system.
audio & videoAudio and video playback quality.
Table 2. Product attributes and the number of attribute words for each product attribute.
Product Attribute#Attribute WordProduct Attribute#Attribute Word
packaging list18durability15
size & weight12shoot24
processor13screen38
storage11data connection21
battery21appearance67
service17operating system56
sensor10audio & video22
price17
Table 3. Pearson correlation coefficient for P and bad review rate.
Product AttributePearson Correlation Coefficientp-Value
packaging list0.0260.843
size & weight0.0810.539
processor0.1570.230
storage0.1060.418
battery0.542 (>0.3)0.000 (<0.05)
service0.401 (>0.3)0.001 (<0.05)
sensor0.1290.324
price0.344 (>0.3)0.007 (<0.05)
durability0.329 (>0.3)0.010 (<0.05)
shoot0.1900.145
screen0.397 (>0.3)0.002 (<0.05)
data connection0.412 (>0.3)0.001 (<0.05)
appearance0.2250.084
operating system0.434 (>0.3)0.001 (<0.05)
audio & video0.2540.051
Table 4. Result for PCA.
No. PCEigenvalueVariance Contribution (%)Cumulative Variance Contribution (%)
14.27461.06361.063
21.10815.82576.889
30.6989.97186.860
40.3384.82391.682
50.2443.48495.167
60.2143.05098.218
70.1251.783100.000
Table 5. Eigenvector for the first two PC.
Product Attribute v 1 v 2
operating system0.435−0.053
data connection0.4250.015
service0.397−0.374
battery0.3960.304
screen0.3860.240
durability0.376−0.436
price0.1620.718
Table 6. True and predicted bad review rate with prediction error.
No.True Bad Reivew RatePredicted Bad Review RateError (%)
10.0070.007710.2
20.0130.01225.9
30.0070.00674.6
40.0130.01253.7
200.0080.006716.5
Table 7. Evaluation indicators for the overall 60 smartphones.
Product AttributeS (Satisfaction)A (Attention)P (Priority)
packaging list0.3660.0440.028
size & weight0.6820.0470.015
processor0.6890.0700.022
storage0.6500.0530.018
battery0.5670.1640.071
service0.6090.2110.083
sensor0.5880.0540.022
price0.7190.2070.058
durability0.6280.1480.055
shoot0.5320.1060.050
screen0.5370.1740.080
data connection0.3540.0470.030
appearance0.7400.3870.101
operating system0.6430.4520.161
audio & video0.4210.0720.041
Table 8. Evaluation indicators for iPhone X.
Product AttributeS (Satisfaction)A (Attention)P (Priority)
packaging list0.1740.0260.021
size & weight0.6370.0390.014
processor0.4700.0420.022
storage0.4360.0230.013
battery0.4480.1090.060
service0.5130.2960.144
sensor0.3370.0480.032
price0.6210.1460.056
durability0.5780.2540.107
shoot0.2200.0840.066
screen0.3740.1570.098
data connection0.2000.0530.042
appearance0.5990.2820.113
operating system0.5280.4420.209
audio & video0.0570.0470.044
Table 9. Opinion mining in negative reviews for iPhone X.
Product AttributeKeywordOpinion#Review
operating systemsystemcrash, unstable, poor compatibility, reboot, bug, frozen, etc.207
overheatsevere, etc.93
responselaggy, slow, insensitive, etc.48
gamelaggy, overheating, bad experience, etc.36
functionfew, poor, etc.31
Appslow download speed, poor compatibility, etc.23
servicecustomer servicepoor attitude, slight over, many excuses, passive, etc.155
serviceslow, bad, barely satisfactory, etc.62
deliveryslow, wordless, poor packaging, etc.37
after-salepoor service, cumbersome, etc.25
attitudepoor, scurviness, etc.18
appearancenotch screennot look well, etc.83
shapeugly, small, not goodlooking, etc.42
colordull, less, no personality, etc.25
workmanshipdefects, etc.24
designugly, unreasonable, etc.17
Publisher’s Note: MDPI stays neutral with regard to jurisdictional claims in published maps and institutional affiliations.

