1. Introduction
Hydrogen energy is gaining more recognition for its vital part in promoting sustainability and addressing worldwide energy issues. In specific scenarios such as hydrogen refueling stations, utilizing hydrogen in its liquid form during transportation and storage may be imperative, as the mass density of liquid hydrogen (LH
2) at one atmosphere pressure is approximately 800 times greater than that of gaseous hydrogen [
1,
2]. As the essential component of hydrogen refueling stations with liquid-stored hydrogen, reciprocating LH
2 pumps pressurize the cryogenic LH
2 for higher delivery efficiency [
3]. Compared to gaseous hydrogen compressors, reciprocating LH
2 pumps offer several advantages such as lower power consumption, reduced investment costs, and higher pumping capacity [
4].
Some researchers have tested the performance of reciprocating LH
2 pumps in the hydrogen refueling system. Petitpas et al. [
3,
5] conducted repetitive refueling experiments to test the cycling performance of a LH
2 pump rated for 100 kg/h and 87.5 MPa maximum pressure. Li et al. [
6,
7] tested the performance of a liquid pump-enabled hydrogen refueling system mounted on a trailer for heavy-duty vehicles in which a single-acting submerged LH
2 pump driven by a hydraulic unit was used to achieve a high pressure of up to 45 MPa and maximum flow rate of 285 kg/h. Qiu et al. [
8] conducted tests on the pressurization and vaporization of a reciprocating LH
2 pump, which achieved a maximum pressure of 50.6 MPa. These investigations mainly focused on the output performance of reciprocating LH
2 pumps, and the internal mechanisms of the pump have rarely been studied.
Due to the complexity of cryogenic experimental systems and the safety concerns associated with LH
2, conducting LH
2 pump experiments proves challenging. Some studies utilize modeling and simulation methods to investigate the internal mechanisms of reciprocating LH
2 pumps. Stefano et al. [
9] conducted a steady-state CFD simulation to evaluate the effect of different suction geometry features on the performance of a cryogenic piston pump. The results suggest that increasing the cross-sectional area of the head channel and throat can decrease the static pressure losses and mitigate the risk of cavitation. Kim et al. [
10] constructed a laboratory-scale cryogenic liquid pump and performed liquid nitrogen experiments to investigate the influence of subcooling degree and discharge pressure on the duty cycle of exhaust duration. Additionally, they established a numerical model that predicts the pump operation, and the results suggest that the subcooling degree can enhance the cryogenic liquid pump performance. Qiu et al. [
11,
12] performed a numerical analysis on the unsteady heat transfer and fluid flow inside a closed LH
2 pump cylinder using the gas spring model. Based on the results and relevant parameters of the Linde two-stage LH
2 pump, a simulation model was developed. The effects of piston movement frequency and pump outlet pressure on valve motion and pump performance were examined.
The movement of valves serves as the connection between the thermodynamic and dynamic characteristics of the reciprocating pump, which is affected by several factors, including the valve parameters, operating conditions of the pump, and the properties of the working fluid. The valve lift directly quantifies its motion patterns, reflecting real-time dynamic responses during operation. Wang et al. [
13] established a mathematical model of discharge valve motion. The valve lift, velocity, and acceleration were analyzed and compared to the experimental results. The closing lag angle of the valve significantly impacts the pump’s volumetric efficiency by inducing reverse flow. Ma et al. [
14] studied the influence of working pressure and the gas volume fraction on the valve’s closing lag angle of a reciprocating multiphase pump. The results show that the suction and discharge valves exhibit different lag characteristics during the process of opening and closing. The valve dynamics also affects its flow characteristics. Pinho et al. [
15] demonstrated through experiments that the flow coefficient of the valve under single-phase flow conditions is independent of the working fluids. Dong et al. [
16] conducted computational fluid dynamics simulations to study the movement of the pump valve and found that the flow coefficient is related to the opening of the valve port. Knutson et al. [
17] constructed a lumped parameter model for a check valve and verified it through experiments. The results show that the effects of stiction and flow forces on valve motion were negligible, and the error between predicted and measured flow rates is less than 3%. Furthermore, the vibrations induced by fluid–structure interaction during the valve-opening process have been investigated both experimentally and theoretically [
18,
19,
20].
According to the above references, the thermodynamic and dynamic processes within the reciprocating LH2 pump are connected through the movement of pump valves. However, the numerical model of reciprocating LH2 pumps used to analyze the valve motion remains unclear. Therefore, this paper aims to investigate the operation and the valve disc dynamics of the reciprocating LH2 pump.
This paper presents a comprehensive model to simulate the whole working cycle of the reciprocating LH2 pump, which includes two main sub-models: one for the pump’s thermodynamics and another for the dynamics of the pump valves. The dynamic cylinder pressure of the reciprocating LH2 pump is acquired and analyzed. The motion characteristics of suction and discharge valves in the reciprocating LH2 pump are obtained. Moreover, the influences of maximum lift, rotation speed, and subcooling degree on the valve motion are discussed.
2. Pump and Valves Configuration
The simulations performed in this work are carried out on a single-piston LH
2 pump model. The pump is designed to achieve a flow rate of 708 kg/h with an outlet pressure of 0.8 MPa. The operational mechanism of the pump is illustrated in
Figure 1a. The motor drives the piston to perform reciprocating motion through the crank-link mechanism. The crank-link mechanism transforms rotational motion into linear reciprocating motion by linking the rotating crankshaft to the oscillating connecting rod and linearly driven piston. The piston reciprocates between top dead center (TDC) and bottom dead center (BDC). During the reciprocating movement of the piston, the low-pressure LH
2 enters through the suction valve and flows out through the discharge valve after it is compressed to high pressure. The pump is a prototype currently in the final stages of design. The schematic diagram of the reciprocating LH
2 pump test system is shown in
Figure 1b. The hydraulic end of the pump is placed inside a LH
2 storage tank, which stores LH
2 from an inlet pipe with a certain subcooling degree. There is an exhaust pipe for draining the evaporated hydrogen in the LH
2 storage tank. The LH
2 storage tank is housed in the cold box and insulated by a vacuum environment. The specific structure of the pump valves is shown in
Figure 2. The suction and discharge valves are spring-loaded, equipped with limit nuts to constrain the spool’s maximum lift, and opened or closed by the pressure difference on each valve’s sides. During the movement of the valve disc, it is mainly affected by gravity, spring force, and differential pressure force.
3. Numerical Model
To simplify the analysis process, the following assumptions are made when building the numerical model:
(1) The state of LH2 in the cylinder is uniform;
(2) The leakage at the piston and the valves is ignored;
(3) The heat transfer rate is considered as a constant.
(4) The compressibility of LH2 is not considered in the governing equations.
3.1. Piston Motion Equations
During the operation of the reciprocating pump, the motion of the piston is driven by the motor through the crank-link mechanism, as shown in
Figure 1a. The corresponding displacement of the piston and the volume of the cylinder could be expressed as
where
is the piston displacement,
is the crank radius,
is the crank angle,
is the link ratio that represents the ratio of the length of the crankshaft to the length of the connecting rod,
is the cylinder volume,
is the clearance volume of the cylinder, and
is the cross-sectional area of the piston.
3.2. Continuity Equations
The LH
2 in the cylinder is considered as the control volume. For the compression and expansion processes, the mass of LH
2 inside the cylinder will not change under the condition of ignoring leakage at the piston and the valves.
For the suction and discharge processes, the mass increment in the cylinder is equal to the mass flowing through the valve clearance according to the conservation of mass. The flow at the valve and related parameters are shown in
Figure 2. The flow rate through the valve gap can be calculated by modeling it as an orifice, and the expression is as follows:
where
is the valve flow coefficient,
is the flow area of valve clearance,
is the pressure differential across the valve, and
is the fluid density.
The suction valve flow rate is calculated as follows:
Similarly, the discharge valve flow rate is calculated as
where
and
are the suction valve flow coefficient and discharge valve flow coefficient, respectively. The valve flow coefficient varies quite complexly with the lift. In this study, to simplify the model, the flow coefficient is set to 0.8 when the valve is fully open, and it changes linearly with the valve lift.
and
are the diameter of the suction and discharge valve discs, respectively.
and
are the lift of the suction and discharge valve discs, respectively.
and
are the inlet and outlet pressure of the reciprocating LH
2 pump, respectively.
is the cylinder pressure. The density of LH
2 flowing through the valve varies with the direction of the pressure difference, and the specific relationship is as follows:
where
,
represent the density of LH
2 at the inlet and outlet, respectively.
3.3. Energy Balance Equations
When the cylinder is considered as the control volume, the energy balance equations can be expressed as follows:
where
,
,
,
and
are the mass flow rate, specific internal energy, specific enthalpy, piston work, and heat transfer rate, respectively. The piston work could be calculated by the expression as follows:
Since the LH2 flow through the valve gap can be approximated to the isentropic orifice throttling process, the flowing liquid’s enthalpy value remains unchanged during the suction and discharge processes. Specifically, the enthalpy value during the suction process is that of the inlet liquid. In contrast, during the discharge process, it represents the enthalpy value of the LH2 immediately before discharge upon completion of the compression process. This study considers the radiation heat transfer in a vacuum chamber, heat conduction of the piston rod, and frictional heat generated during the piston’s reciprocating motion, with the calculated values being 8.6 W, 6.3 W, and 39.1 W, respectively, based on the provided parameters. Since the heat transfer is assumed to be constant, the frictional heat is also a constant calculated from the average piston speed. The total heat transfer rate is calculated to be 54 W.
3.4. Valve Motion Equations
According to Newton’s law of motion, the differential equation for valve disc movement is established. Typically, only the pressure differential forces, gravity, and spring forces acting on the disc are considered, as shown in
Figure 2. The valves’ motion equations could be established as follows:
where
is the valve mass,
is the valve spring preload,
is the valve spring stiffness, and
is the velocity of the valve disc.
The Euler method can be employed to solve the equations governing the motion of the valves, allowing for the determination of both lift and velocity. As shown in
Figure 2, the distance between the limit nut and the bottom end of the guide sleeve is the maximum lift when the valve is closed. When the valve reaches its maximum lift, its speed will immediately drop to zero. Then, it will start to move according to the pressure difference during the next time step. This phenomenon is elaborated upon in
Section 3.5 below. The velocity at which the valve disc impacts the seat upon valve closure is referred to as the impact velocity. Additionally, the calculation of the impact velocity is based on the movement speed of the valve disc at the moment when the valve lift is closest to 0.
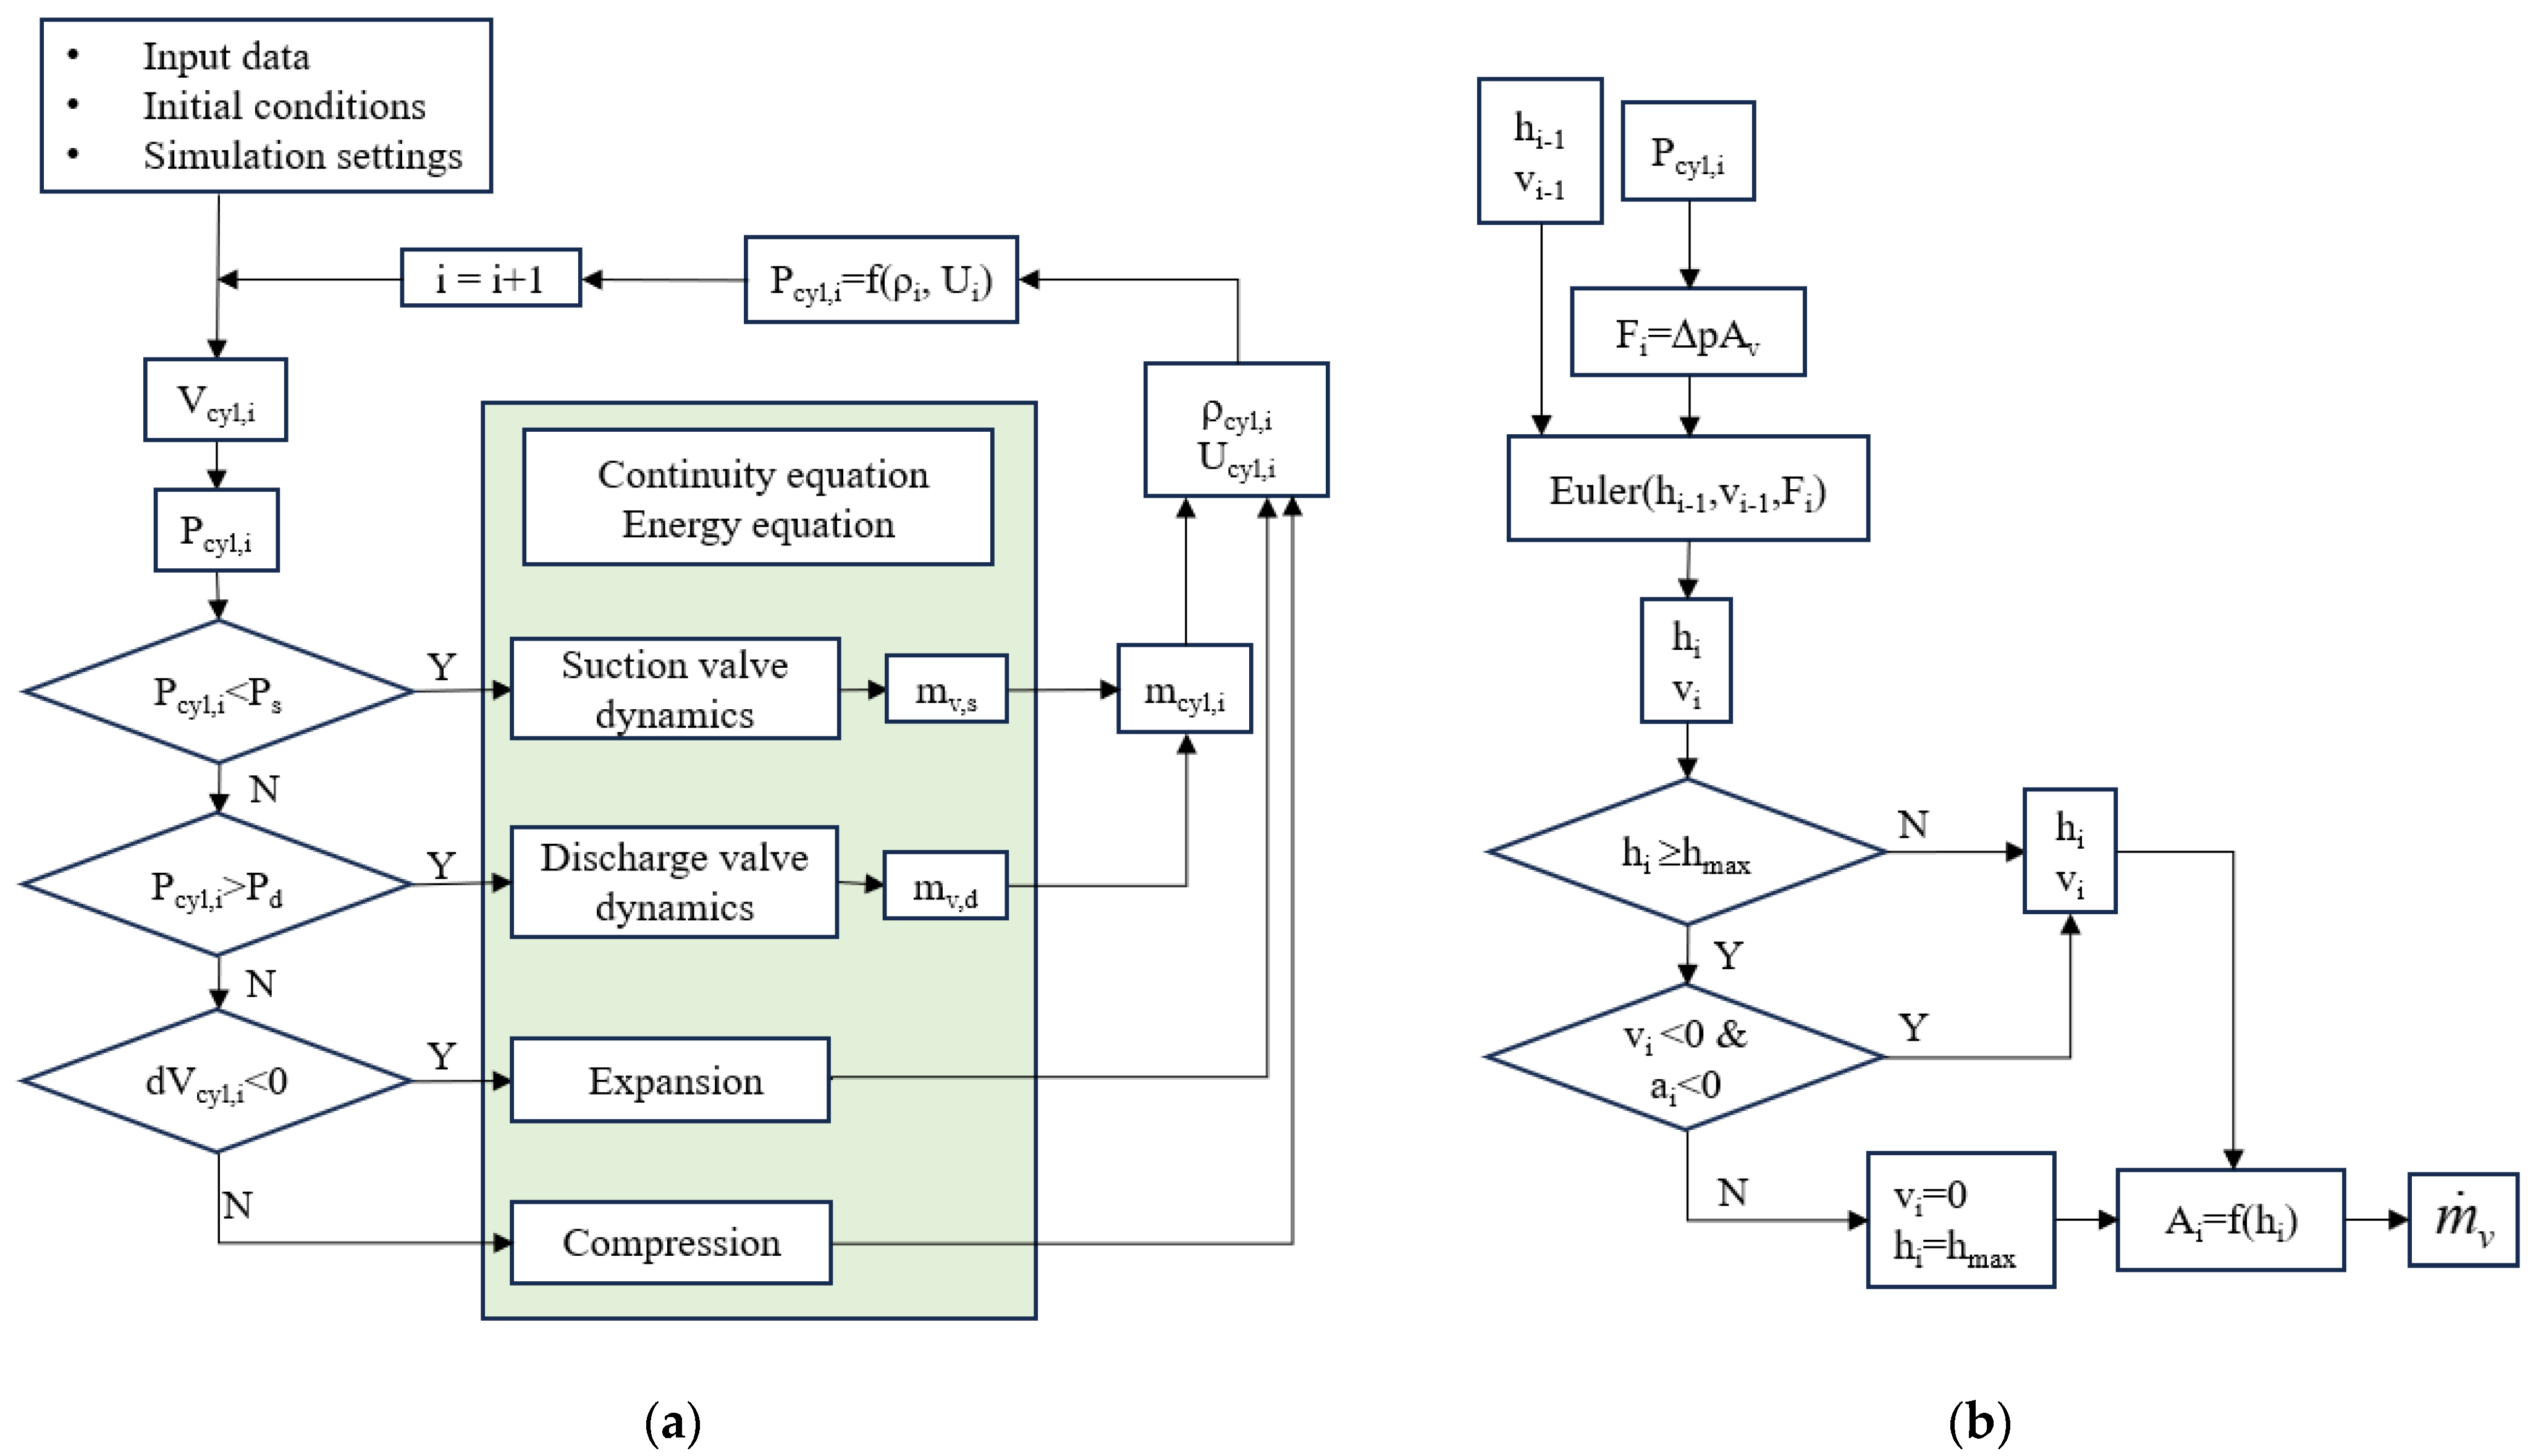
3.5. The Simulation Logic and Initial Conditions
The numerical model is established based on the schematic diagram in
Figure 3 with the following calculation logic. First, depending on the initial cylinder pressure and the direction of piston motion, the model determines in which phase (suction, compression, discharge, or expansion) the cycle is (
Figure 3a). When in the suction and discharge stages, the liquid mass flow rate at the valve (
) is calculated through valve dynamics (
Figure 3b). The movement of the piston in each time step changes the volume of the compression chamber (
), and the density of the liquid (
) also changes. At the same time, the internal energy (
) of the fluid inside the compression chamber changes due to the piston’s work, heat leakage, and fluid inflow and outflow. The mass continuity and energy equations are solved to compute the effective thermodynamic parameters inside the cylinder. Then, the cylinder pressure in the next time step is calculated through the NIST database by entering the density and internal energy as input parameters.
Appropriate initial conditions are indispensable to ensure the correct functioning of the model. The simulation starts from the piston at the end of the compression stroke without the valve opening. The cylinder clearance is filled with LH2 at around 24.5 K and 0.8 MPa. The movement of the piston causes pressure fluctuations within the compression chamber. Once the pressure reaches the valve-opening threshold, the valve opens because of the pressure differential, and the LH2 with a 0.5 K subcooling degree flows into the cylinder through the suction valve gap. The initial velocity and displacement are zero at the opening moment of the valve disc.
The pressure difference of the valve opening can be obtained by calculating the force balance of the valve disc at the moment of opening, as shown in
Figure 4. When considering the liquid film pressure on the sealing surface of a conical valve, assuming it is linearly distributed along the generatrix of the cone sealing surface, the fluid pressure on the sealing surface can be determined through integration as shown in Equation (13). The valves’ force equilibrium equation is expressed as shown in Equation (14). Based on Equations (13) and (14), the pressure difference
at the moment of valve opening can be calculated by Equation (15) [
21].
where
is the length of the generatrix, which can be calculated by valve parameters,
is the pressure of the upstream,
is the pressure of the downstream,
is the diameter of the valve port, and β is the integral variable. Therefore, the suction and discharge valves will only open when the pressure inside the compression chamber satisfies the following conditions.
The model is solved by MATLAB (version R2024b). The initial parameters required for completing the simulation are provided in
Table 1.
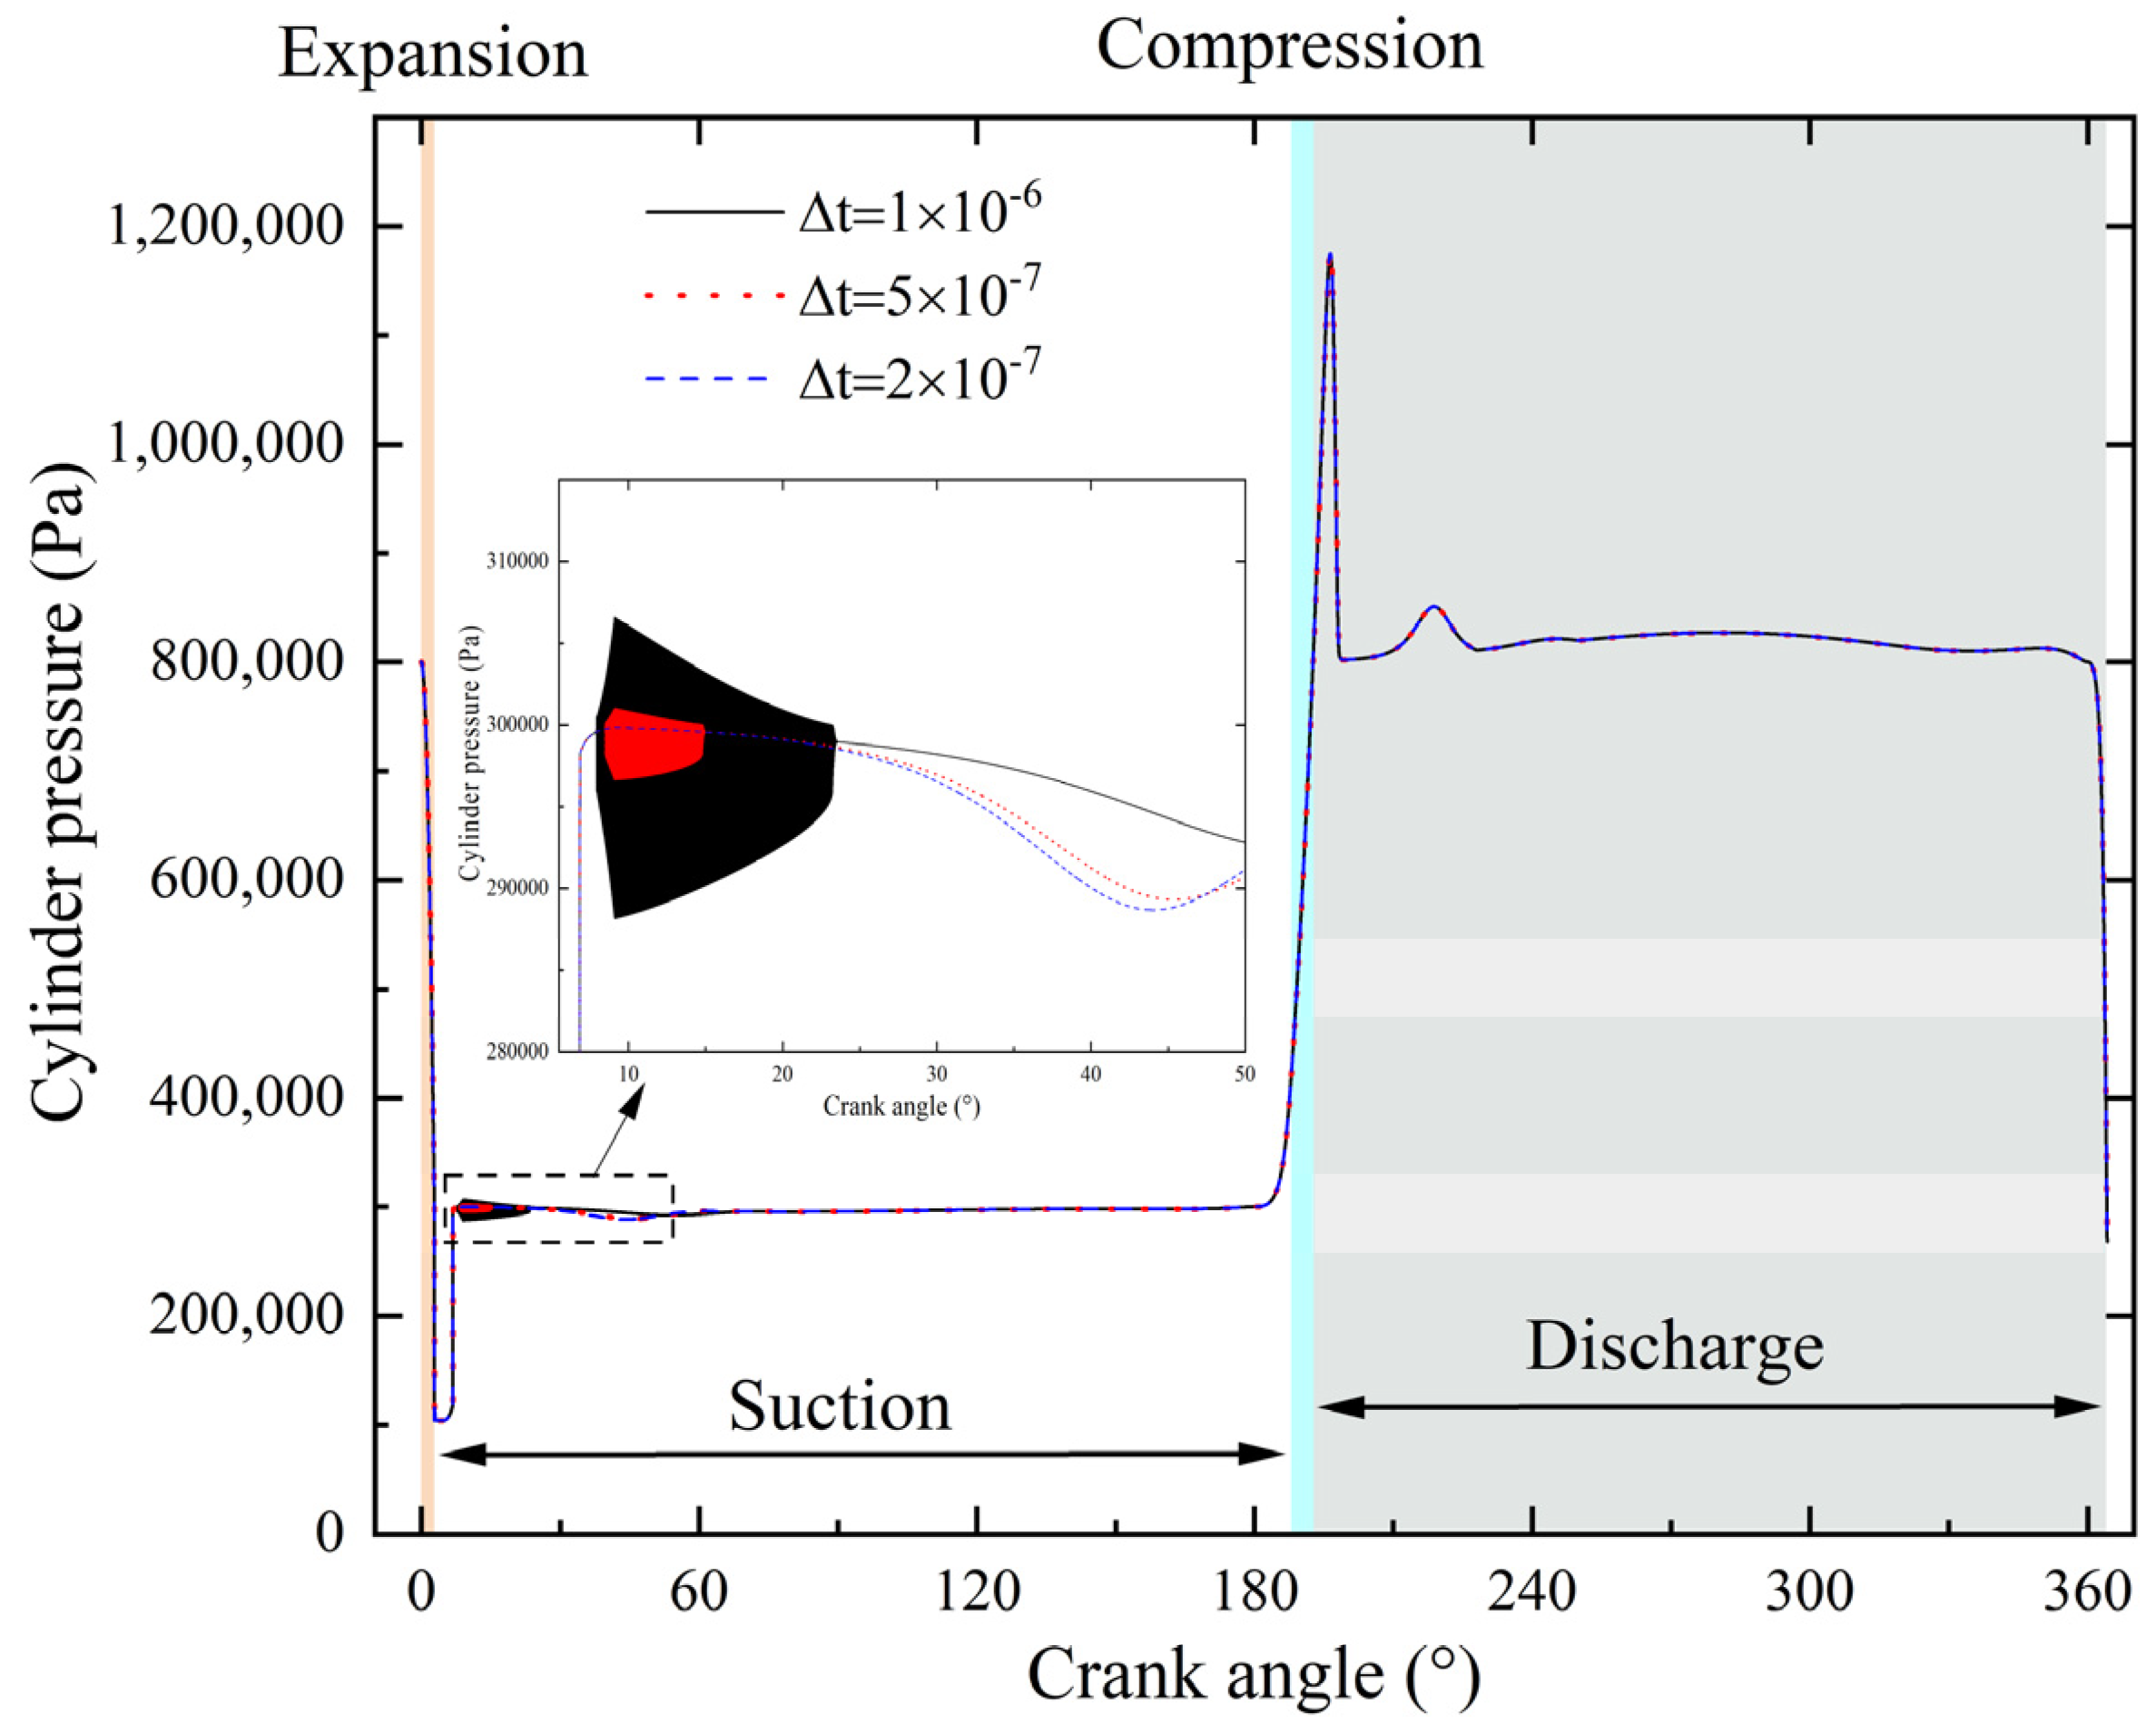
3.6. Time Step Independence Analysis
The time step independence study was performed to define the optimal time step by applying the initial conditions to the simulation. To ensure consistency in the results, a fixed time step was adopted for the reciprocating pump system with periodic motion. This approach allows for the output of data at regular time intervals, facilitating subsequent processing.
Figure 5 shows the cylinder pressure at different simulation time steps during a cycle. Since it is assumed that the state of LH
2 in the cylinder is uniform, the downstream pressure following the valve can be regarded as the cylinder pressure. Because the design outlet pressure of the pump is 0.8 MPa, its compression and expansion processes occur almost instantaneously, while the suction and discharge processes dominate most of the cycle. Throughout most of a cycle, the pressure curve remains consistent over time steps. There will be severe fluctuations in the cylinder pressure during the early stage of the suction process when the time step is 1 × 10
−6 s and 5 × 10
−7 s, which is abnormal. When the time step is 2 × 10
−7 s, the cylinder pressure does not fluctuate. This might be because the numerical error in calculating the suction valve gap flow rate will accumulate when a large time step is adopted for this nonlinear system. Therefore, considering both computational efficiency and the stability of the results, the optimal time step was ultimately determined to be 2 × 10
−7 s.
4. Results and Discussion
This section primarily investigates the influence of three factors on valve motion within the numerical model. Firstly, concerning the structural parameters of the valve, we have opted to investigate the maximum lift of the valve. Secondly, among the pump’s operating parameters, the rotation speed has been identified as the focal point of our research. Finally, concerning the thermodynamic parameters of the working medium, we have performed a comprehensive analysis of the subcooling degree of the inflow LH2. In addition, the closing lag angle is utilized to characterize hysteresis during the valve closure process. The impact velocity of the valve disc affects the lifespan of the valve seals, which is also investigated in this paper.
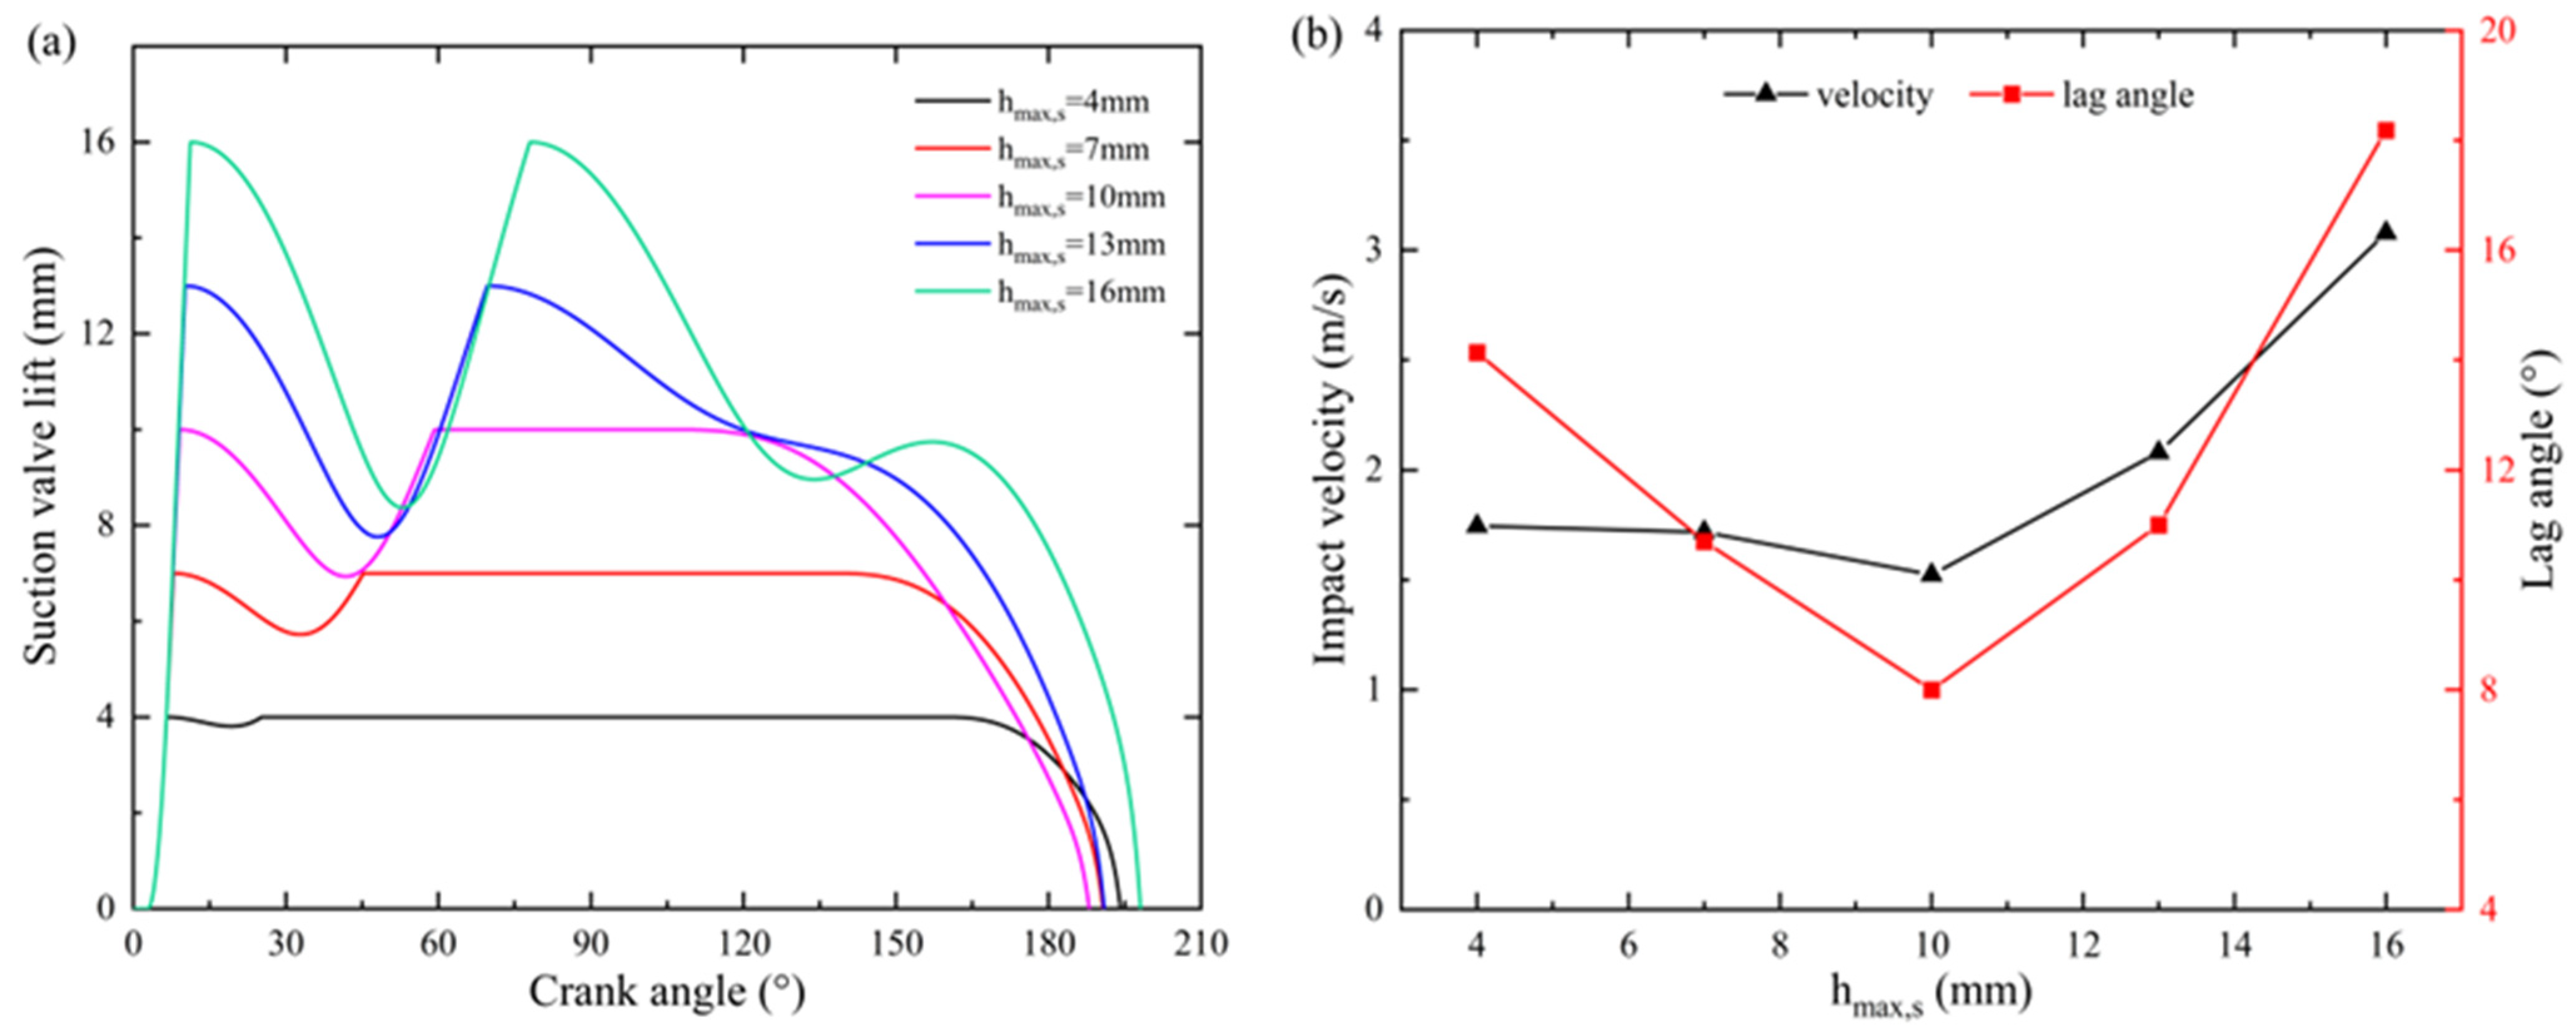
4.1. Influence of Maximum Lift
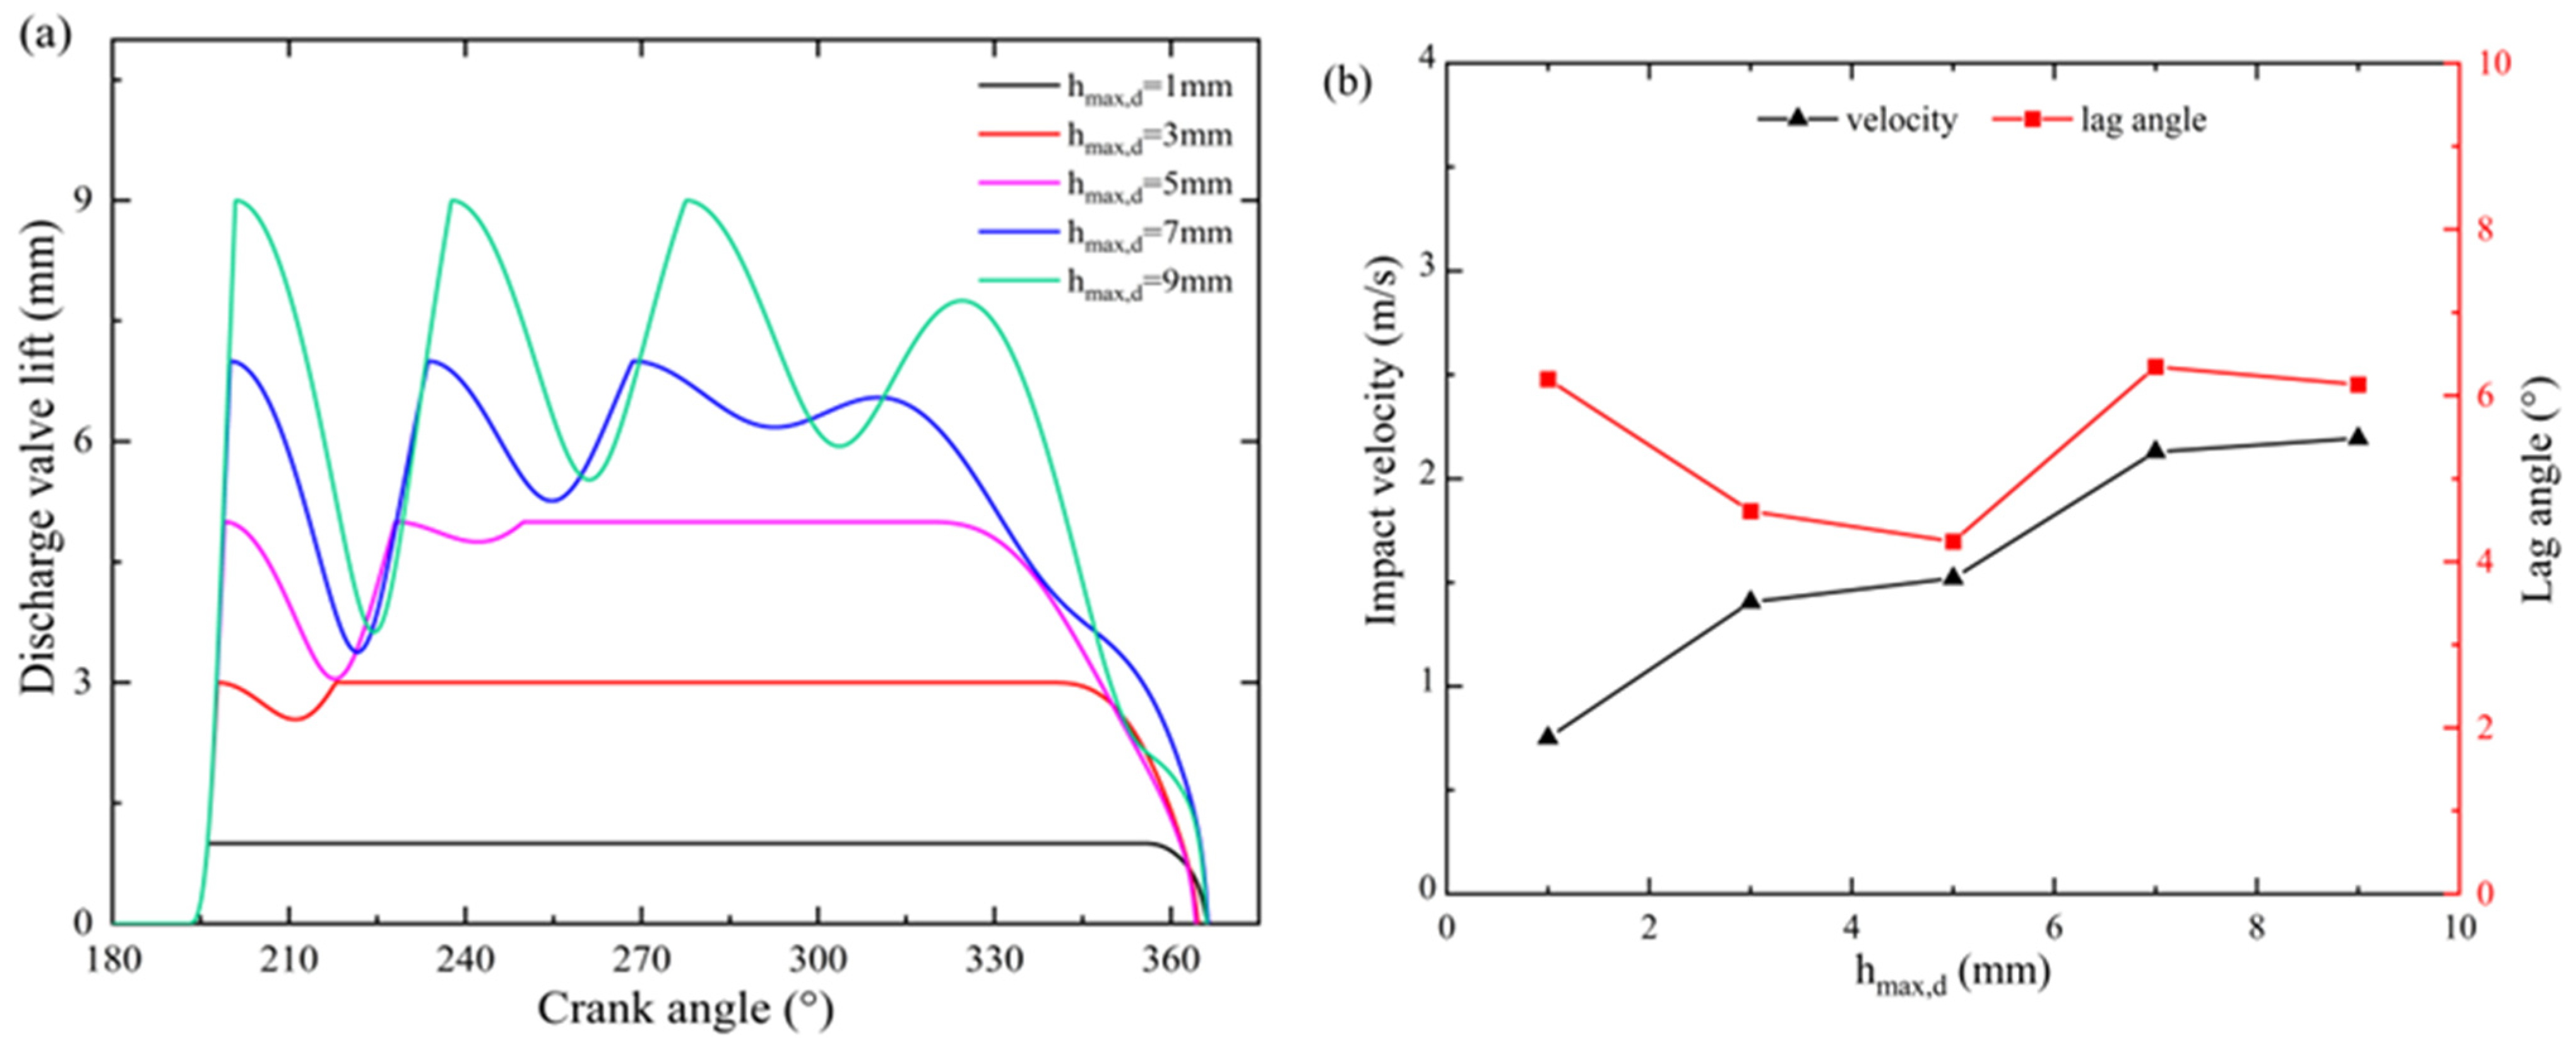
The motion of the valves affects the flow rate and pump efficiency, which can be adjusted by the maximum lift. The variations in the lifts of the suction and discharge valves with the crank angle under different maximum lifts are, respectively, presented in
Figure 6a and
Figure 7a. The valve’s lag characteristic of the reciprocating LH
2 pump could be obtained from lift curves in each working stage. It can be seen that the suction valve is still open, and the LH
2 continues to flow into the cylinder for a period of time when the piston moves to the TDC (φ = 180°). Similarly, the discharge valve is not completely closed when the next working cycle begins (φ = 360°). In addition, the increase in the maximum lift will cause the valve to stabilize at its maximum lift for a reduced period and may also induce oscillation in the valve. For the suction valve, when the maximum lift is 4 mm, the stability angle interval at maximum lift ranges from 25° to 170°. In contrast, when the maximum lift is 10 mm, the stability angle interval at maximum lift ranges from 60° to 130°. When the maximum lift is set to 13 mm or 16 mm, the valve cannot be stabilized at these maximum lift levels.
The closing lag angle and impact velocity of the suction and discharge valves under different maximum lifts are presented in
Figure 6b and
Figure 7b.
Figure 6b illustrates that the maximum lift significantly affects the closing lag angle of the suction valve. The results show that raising the maximum lift of the suction valve from 10 mm to 16 mm leads to an increase in the closing lag angle from 8° to 18°, representing a significant rise of 126%. In contrast, the closing lag angle of the discharge valve exhibits a relatively stable range, fluctuating between 4° and 6° as the maximum lift increases, as illustrated in
Figure 7b. This limited impact can be attributed to the high spring stiffness of the discharge valve, where the spring force predominantly governs the dynamics of the valve closing process. Moreover, as the maximum lift increases, the impact velocity also increases. When the maximum lift of the suction valve was increased from 4 mm to 16 mm, the impact velocity rose by 76.4%. There was a 192% increase in impact velocity for the discharge valve when the maximum lift was raised from 1 mm to 9 mm. A higher impact velocity during the valve closing process results in heavier wear on the valve sealing surface, which can lead to seal failure and leakage.
4.2. Influence of Rotation Speed
The simulation results shown in
Figure 6 and
Figure 7 are based on the design rotation speed of 300 rpm. The pump predominantly operates at the design rotation speed, which gradually increases and may exceed the design speed during operation. Therefore, the influences of the rotation speed on valve motion need to be further studied.
The lift curves of the suction and discharge valves at 100, 200, 300, and 350 rpm are shown in
Figure 8. It is evident that the rotation speed has a significant impact on the valve lift. As the rotation speed slows down, the lift of the suction and discharge valves shows variations, with both the amplitude and frequency of oscillations increasing, affecting the valves’ stability. When the rotation speed is 100 and 200 rpm, the valve lift fluctuates intensely and cannot be stabilized. As the rotation speed increases from 300 to 350 rpm, the duration that the valves stabilize at their maximum lift becomes longer.
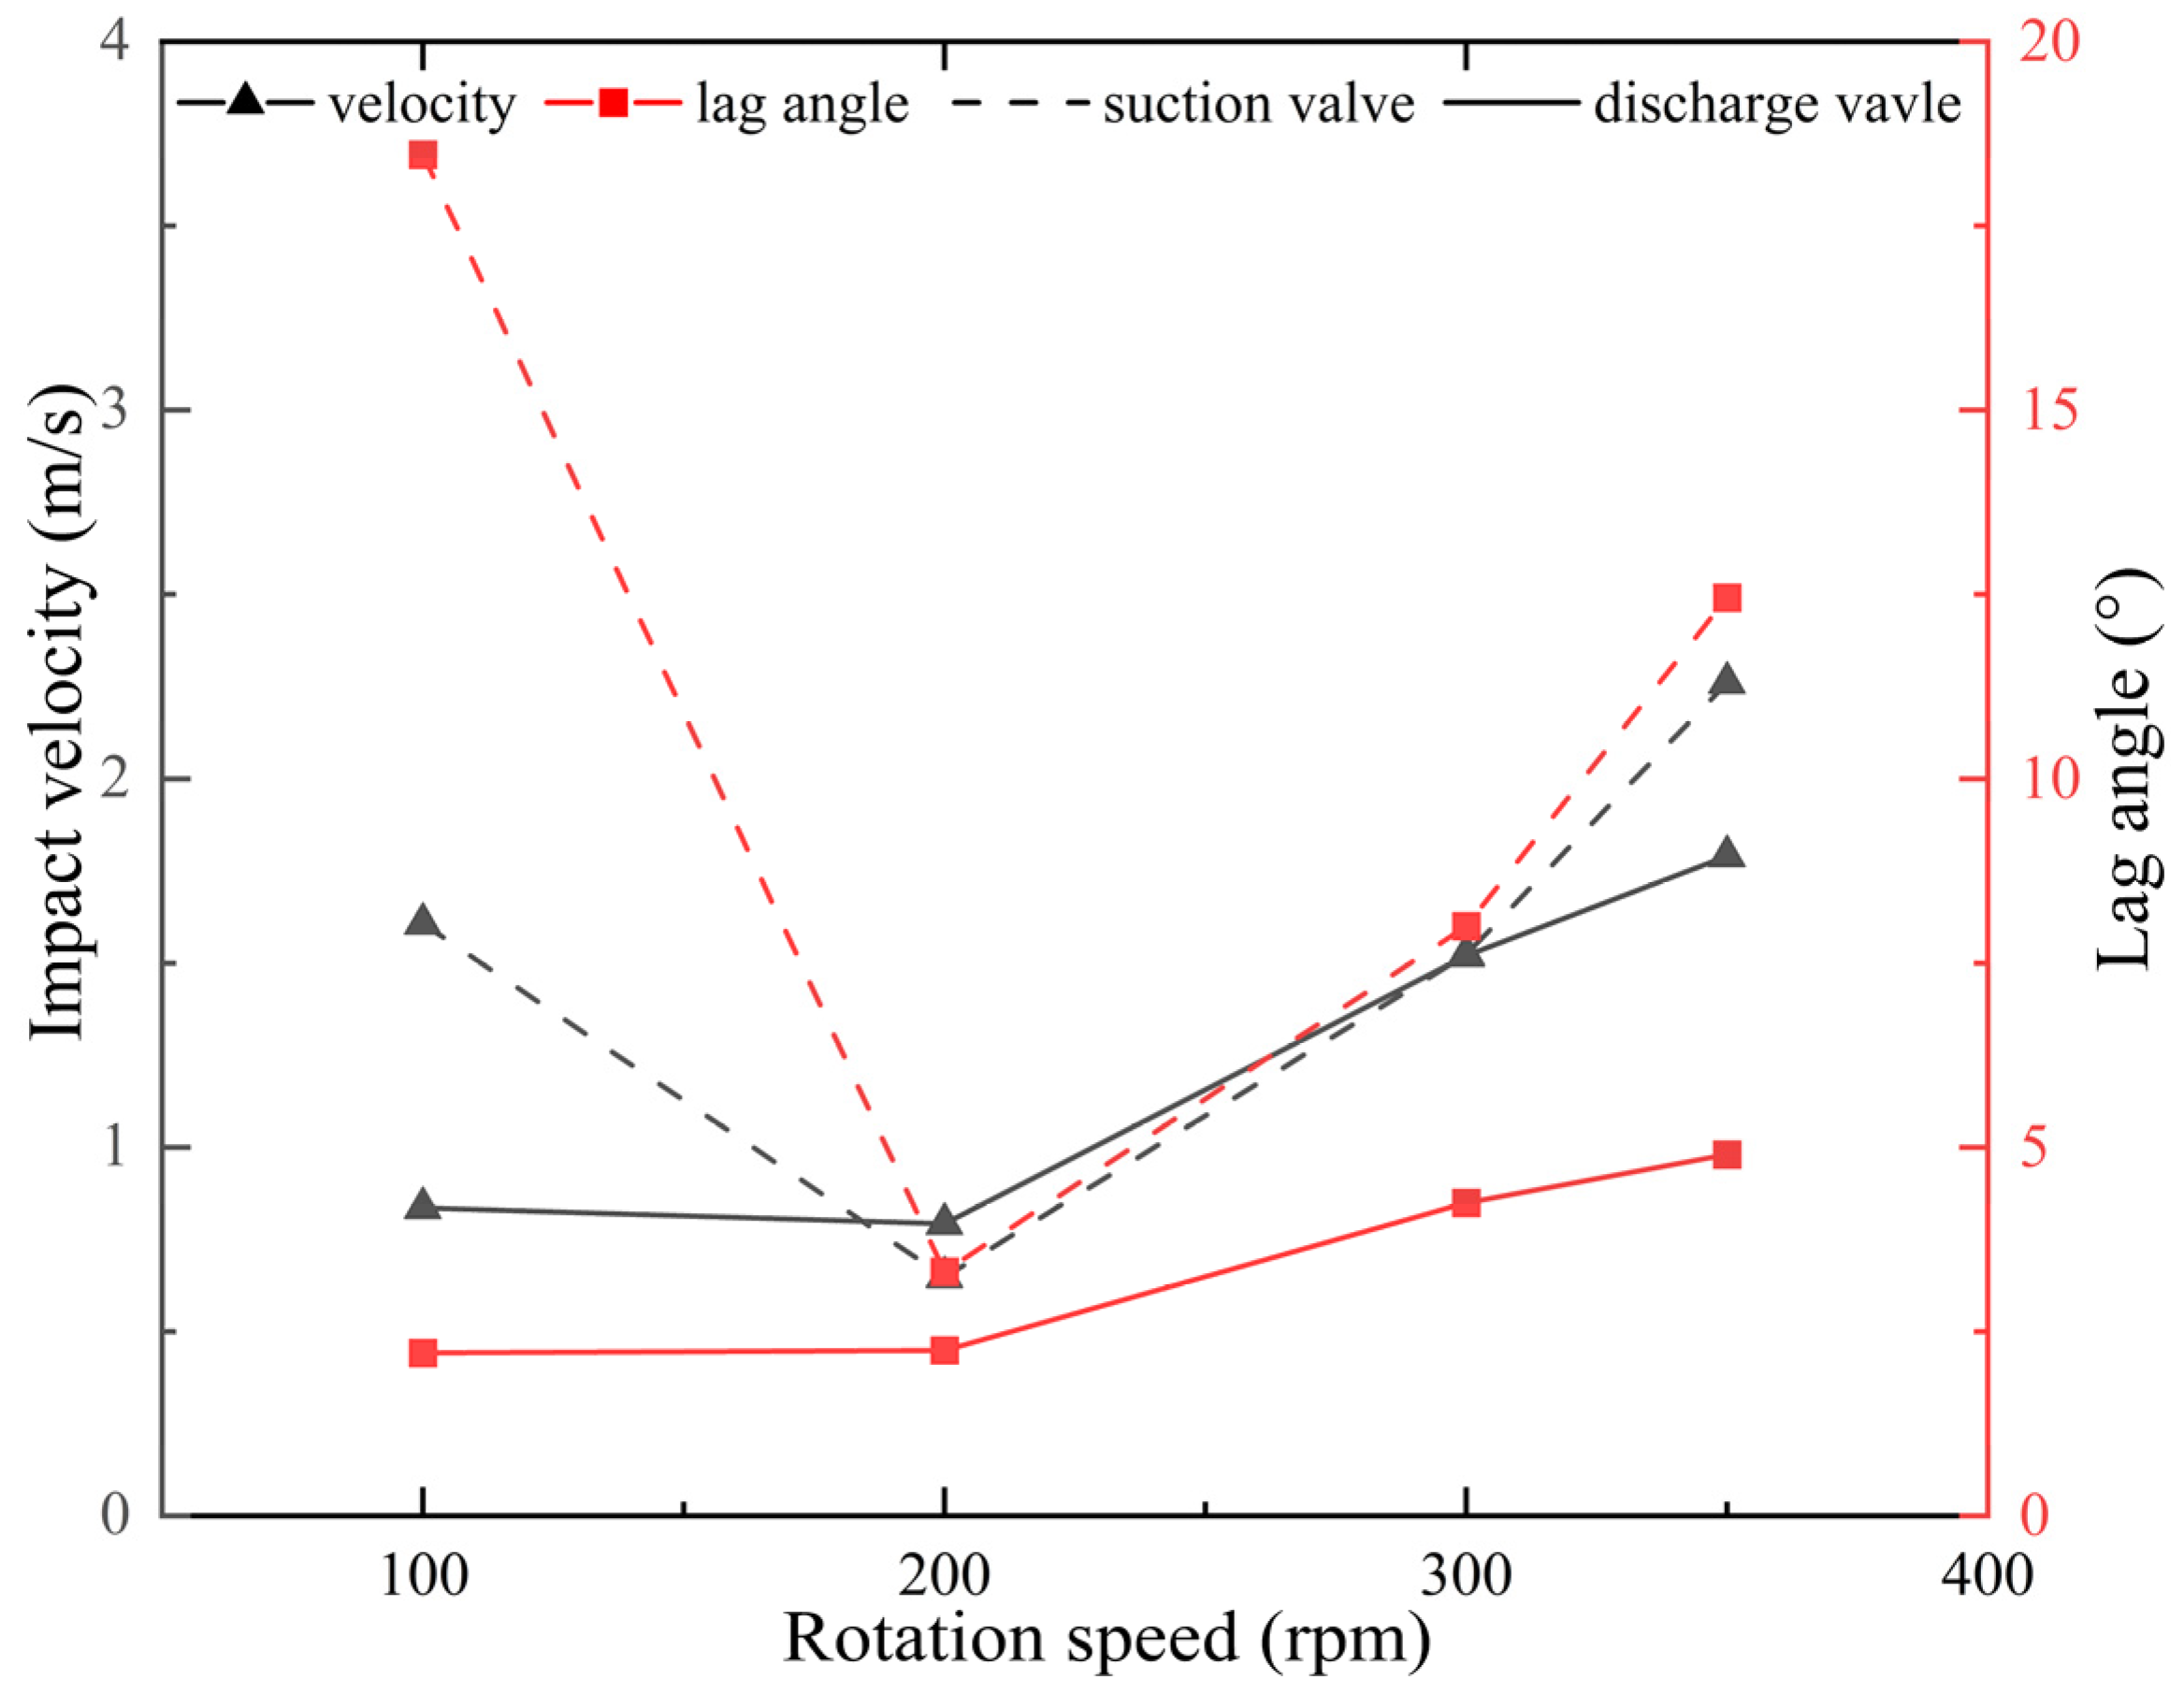
Figure 9 shows the closing lag angle and the impact velocity at the closing moment of the valves at different rotation speeds. The closing lag angle of the suction valve is typically larger than that of the discharge valve. When the rotation speed increases from 200 rpm to 350 rpm, the closing lag angle of the suction valve increases from 3.3° to 12.5°, and that of the discharge valve increases from 2.2° to 4.9°. When the rotation speed is 100 or 350 rpm, the suction valve’s impact velocity is larger than that of the discharge valve. Disregarding the unusual condition at 100 rpm, the impact velocity at which the valve closes generally rises as the rotation speed increases. Within the rotation speed range of 200 to 300 rpm, both the closing lag angle and the impact velocity of the valves are comparatively minimal, indicating that this range is optimal for the operation of the pump.
4.3. Influence of Subcooling Degree
The subcooling degree of LH2 in the storage tank enhances the net positive suction pressure for the pump immersed in LH2 and helps avoid cavitation caused by pressure drops. In this study, the subcooling degree of inflow LH2 affects the energy equation in the suction process, which subsequently influences pressure calculations and ultimately affects the overall operation of the pump.
Figure 10 shows the cylinder pressure curves under different subcooling degrees of inflow LH
2. It is evident that the pressure curves with subcooling degree exhibit a rapid increase to a maximum point, indicating the incompressibility of the LH
2. In comparison, there is a stage of gradually increasing during the compression process on the pressure curve when the subcooling degree is 0 K, which reflects the prominent compressibility characteristics of the working medium in the cylinder. Therefore, it can be inferred that vaporization occurs when the subcooling degree is 0 K. This may be due to the pressure drop caused by friction and flow resistance during the suction process, which results in the liquid pressure falling below the saturation pressure.
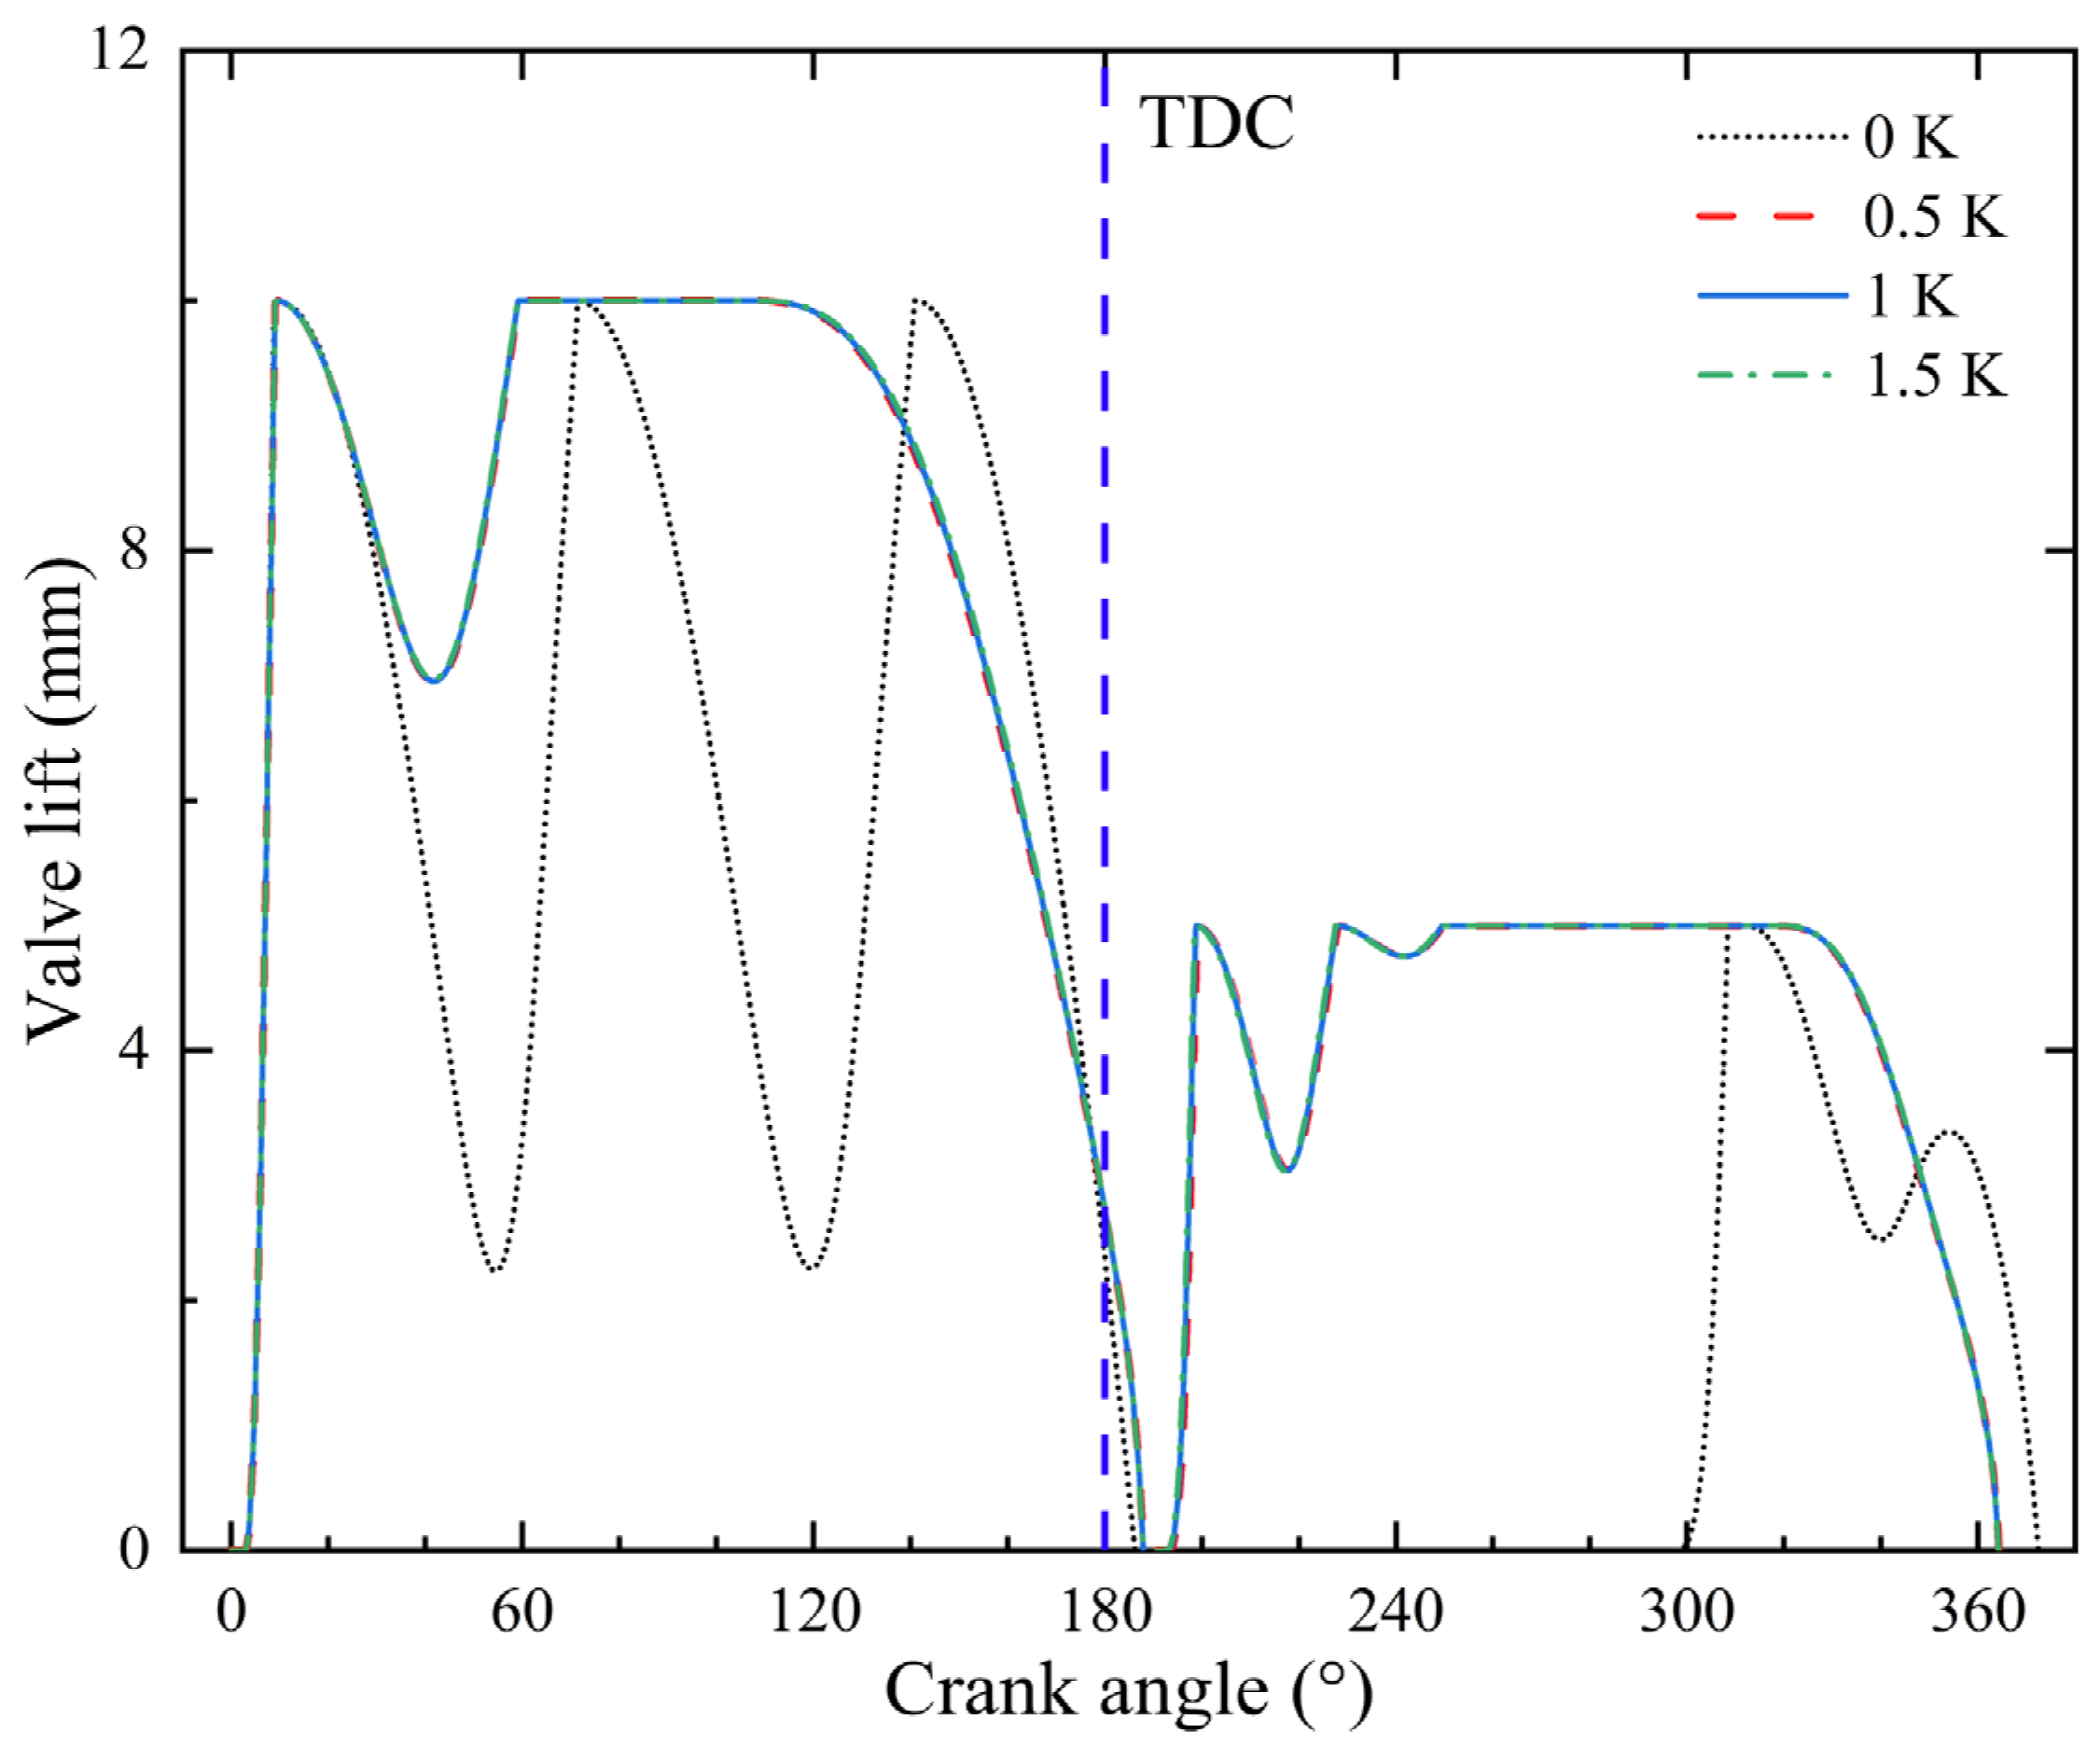
The lift curves of the suction and discharge valves under different subcooling degrees are shown in
Figure 11. When the subcooling degree is 0 K, the lift of the suction valve experiences considerable fluctuations, which in turn causes variations in the flow rate and pressure. This is demonstrated by two notable cylinder pressure fluctuations around 60° and 120° in
Figure 10. Additionally, the opening crank angle of the discharge valve is 300°, and the closing lag angle of the discharge valve reaches 12.4°, significantly exceeding that observed with the subcooling degree. When the subcooling degrees are 0.5, 1 and 1.5 K, the valve lift curves exhibit a high degree of congruence, indicating the proper functioning of the pump.
5. Conclusions
This paper develops a comprehensive model to simulate the whole working cycle of the reciprocating LH2 pump. The valve dynamics are examined as the focus of this research. The lifts of the suction and discharge valves during the cycle are analyzed. The closing lag angle and impact velocity are employed to characterize hysteresis and collisions during the valve closure process. The influences of maximum lift, rotation speed, and subcooling degree on the valve dynamics are discussed. The following conclusions can be drawn.
- (1).
The influence of maximum lift on the closing lag angle of valves is more pronounced in the suction valve. Excessive maximum lift leads to apparent oscillation and high impact velocity in valve movement. In this research, with the maximum lift of the suction valve at 10 mm and the discharge valve at 5 mm, the closing lag angle is minimal, and the impact velocity of the valve falls within an acceptable range.
- (2).
An improper rotation speed will result in valve movement fluctuations, significantly affecting the pump’s reliability. The effect of rotation speed on the closing lag angle of valves is more significant in the suction valve. The optimal rotation speed range in this research is between 200 and 300 rpm, within which both the closing lag angle and impact velocity of valves are minimized.
- (3).
The subcooling degree of inflow LH2 helps to inhibit the vaporization of LH2 in the cylinder and ensures the valves work correctly. However, implementing a subcooling degree comes with associated costs, and it is crucial to consider extra expenses and efficiency during the experiment.
In future work, the model can be expanded to predict the disc wobble and its effect on valve response and flow rate. A more accurate method for calculating valve flow coefficient and flow force, such as utilizing computational fluid dynamics, would increase confidence in the model. Furthermore, considering the compressibility of LH2 and the phase change during the pump operation, the impact on valve dynamics can better reflect the actual conditions of the reciprocating LH2 pump operation.


