Abstract
The global malnutrition crisis—marked by the simultaneous presence of hunger, undernutrition, and obesity—affects billions of people worldwide. This complex and widespread issue is deeply intertwined with today’s escalating environmental challenges, including climate change, soil degradation, and biodiversity loss. These problems are largely driven by the current food systems, which not only fail to provide adequate nutrition for all but also contribute significantly to environmental degradation. Argentina, as a major global food producer, exemplifies this paradox: despite its vast agricultural capacity, nearly 70% of its population suffers from some form of malnutrition. This paper examines the potential of organic agriculture and agroecology to transform food systems in ways that promote sustainability and health, aligning with the United Nations Sustainable Development Goals (SDGs). Focusing on Buenos Aires, the study investigates the availability, cost, and affordability of organic and agroecological diets in accordance with both international and national dietary guidelines. This is the first study in Argentina—and among the first internationally—to analyze the affordability of diets exclusively based on organic and agroecological products. Linear programming is applied to assess these diets in relation to the basic food basket, revealing economic challenges and opportunities within the city’s food landscape. The results demonstrate the validity of the model in identifying the costs and potential economic accessibility of such diets for the population, providing valuable insights for segmenting and clarifying potential pathways for scaling these diets, as well as comparing different contexts and realities.
1. Introduction
Over 820 million people worldwide suffer from hunger, while 1.9 billion adults are overweight or obese, underscoring the dual nature of the global malnutrition crisis. Nutrient-rich foods, such as fruits, vegetables, and proteins from both plant and animal sources, are among the most expensive globally. As a result, millions are forced to rely on low-quality diets, as healthy options often exceed the USD 1.90 daily international poverty line [1].
Poor diets are now the leading cause of mortality and morbidity worldwide, surpassing the health burdens posed by many other global environmental challenges [2]. The food sector, spanning from fertilizer production to packaging and distribution, is responsible for over a third of all greenhouse gas emissions, and it directly contributes to water scarcity, soil erosion, and the loss of biodiversity [3]. This alarming situation, combined with rapid population growth and inefficient food distribution, calls for a profound transformation of global food systems—an urgent need directly addressed by the United Nations Sustainable Development Goals (SDGs).
In this context, growing evidence suggests that organic agriculture and agroecology could play a crucial role in addressing challenges related to the SDGs [4,5].
The interaction between agriculture, diets, and economic access to them is a fundamental axis for understanding food systems and their territorial integration. In this regard, the focus of this article will be based on Argentina, specifically in the city of Buenos Aires.
Despite Argentina’s critical role in global agriculture, no comprehensive studies have been conducted to examine local and international processes within organic and agroecological systems, particularly their interactions and potential contributions to healthier food systems. While some economic analyses have assessed the cost of healthy diets based on the Argentine Food Guidelines (GAPA) [6], there has been no research integrating international dietary recommendations that consider environmental sustainability and focus exclusively on organic or agroecological foods from local, short, and alternative value chains [7].
Thus, the objective of this paper is to analyze the availability and cost of these products for healthy diets based on the National Guidelines for the Argentine Population (GAPA) [8] and the EAT-Lancet Commission’s guide on sustainable food systems [2]. Using linear programming [9], the study defines two types of diets, evaluating their costs and economic accessibility for the population.
1.1. Agriculture in Argentina
Argentina, the primary focus of this work, exemplifies the dysfunction of the global food phenomenon. The country ranks among the world’s leading food producers and exporters. In 2021–2022, Argentina was the sixth largest wheat exporter, the second largest for maize and sorghum, and the third largest for barley, contributing 5% of the world’s total grain production [10].
Agricultural exports are Argentina’s main source of revenue, with soybeans leading at USD 23,841 million, representing 30.6% of the country’s total revenue. Following soybeans are maize, meat, wheat, sunflower, dairy, grapes, peanuts, and barley, highlighting the critical importance of the agricultural sector to Argentina’s economy [10].
In Argentina, the 2018 National Agricultural Census [11] included, for the first time, records of organic, agroecological, and biodynamic production. According to the census, 5253 agricultural units reported using these methods, representing 2% of the total surveyed farms. However, it is important to note that the census reflects the producers’ self-identification, not their certification status. For organic production, SENASA’s annual “Overview of Organic Production in Argentina” report has been tracking the sector since 1994. As of 2021, there were 1336 certified organic operators, with Argentina’s organic land covering 3.9 million hectares, positioning the country as the second-largest globally in terms of certified organic area.
Although Argentina’s organic sector is internationally recognized, particularly in exports to the United States and the European Union, the number of certified operators remains low compared to other leading countries. A significant portion of organic land is dedicated to livestock, especially in Patagonia, with limited areas set aside for plant production. The organic export sector is dominated by cereals, oilseeds, and industrial crops, such as sugar cane and vines. On the domestic market, certified organic products represent only 1–1.5% of consumption, mostly in processed foods.
Meanwhile, agroecology, though not as extensively quantified, has gained ground in academia and social movements, especially in smallholder and family farming sectors linked with domestic markets. The sector is well-represented in research, and both organic and agroecological movements share common values, presenting an opportunity for joint efforts in creating sustainable food systems. As Argentina transitions toward more inclusive and sustainable practices, the intersection of organic and agroecological models offers a promising pathway toward achieving the Sustainable Development Goals [12].
1.2. Nutrition and Health in Argentina
However, these impressive production and export figures do not necessarily translate into healthy food systems, either globally or locally. In fact, nearly 70% of Argentina’s population suffers from malnutrition [13], and food safety remains a significant concern.
Chronic Noncommunicable Diseases (CNCDs), which are significantly influenced by nutrition, represent a global epidemic. They are the primary cause of premature death and disability, accounting for 60% of all deaths worldwide. In Argentina, CNCDs are responsible for 73.4% of deaths and 52% of years of life lost due to premature mortality.
Underweight and overweight are interrelated issues arising from the broader food system crisis. In 2019, the prevalence of underweight and wasting in children under five years old in Argentina was 1.7% and 1.6%, respectively. The national prevalence of short stature among children was 7.9%, while 1.4% of children aged 5 to 17 years were classified as thin, and 3.7% experienced short stature [13].
The Fourth National Survey of Risk Factors [14] reveals concerning health behaviors among the Argentine population, including a high prevalence of sedentary lifestyles (64.9% report low physical activity) and poor dietary patterns. Consequently, rates of overweight and obesity stand at 33.7% and 32.4%, respectively, indicating that over 66% of the population is affected by these conditions.
These unhealthy habits significantly increase health risks, as evidenced by the survey:
- -
- A total of 40.6% of the population has high blood pressure (≥140/90 mmHg).
- -
- A total of 8.4% exhibit high capillary blood glucose (≥110 mg/dL).
- -
- A total of 30.7% have high cholesterol (≥200 mg/dL).
The rise in overweight and obesity is linked to a shift towards energy-dense diets dominated by highly processed foods rich in sugars, fats, refined starches, and salt, while the consumption of nutrient-dense foods such as fresh fruits, vegetables, whole grains, pulses, nuts, and seeds—though more nutritious—remains insufficient [1]. It is important to consider that nutrient-dense foods that present better nutritional quality have less energy (kcal) per unit of weight or volume, and, on average, more essential nutrients are relatively expensive [15,16], conditioning people, especially those on low incomes, to buy less, and this increases the risk of nutrient inadequacies. Argentina takes part in a group represented by the countries where overweight and obesity kill more people than underweight [17].
Another relevant element to consider in terms of health and nutrition is related to the excess of chemical substances present in food, and the limitations of the public system in carrying out the corresponding controls. According to a recent study of a total of 135 of the most widely consumed fruits and vegetables analyzed for 35 pesticides, 65% of the total samples detected chemical residues, of which 56% were above the maximum residue limits (MRLs) according to national regulation [18].
1.3. Indigence, Poverty, and Economic Access to Food in Argentina
Health, access to food, and poverty are intrinsically interconnected. In Argentina, the National Institute of Statistics and Censuses (INDEC) defines and measures poverty lines based on the Basic Food Basket (CBA). This basket represents “the set of foods that satisfy certain nutritional requirements and whose structure reflects the consumption patterns of the reference population” [19].
Introduced in the 1980s in several Latin American countries, the CBA methodology was developed by the Institute of Nutrition of Central America and Panama (INCAP). This tool is based on a fixed basket of food and beverages reflecting the eating patterns of medium–low-income households.
In Argentina, the first CBA was established in 1988, designed to meet the normative caloric requirements essential for monthly sustenance across various household types. Foods and quantities included in the CBA were selected based on consumption habits reported in the National Household Expenditure Survey (ENGHo) 1996/97 [20]. The CBA provides a snapshot of current purchasing and spending patterns rather than prescriptive dietary recommendations.
To determine the total Basic Basket (CBT), which establishes the poverty line, the CBA is extended to include non-food goods and services. This extension is calculated using the Engel coefficient (CoE), which represents the ratio of food expenditures to total expenditures in the reference population [19].
Each province in Argentina calculates the CBA monthly, adjusting for local prices using consumer price indices, such as the IPC-BA for Buenos Aires.
The Basic Food Basket methodology has faced significant criticism, since the CBA provides a snapshot of the current purchasing and spending patterns rather than prescriptive dietary recommendations.
The current Basic Food Basket, as shown in Table 1, reflects a poor representation of recommended foods and an excess of less recommended items, underscoring ongoing concerns about its adequacy and effectiveness in addressing nutritional needs.

Table 1.
Argentinian national Basic Food Basket composition.
1.4. Main Characteristics of Buenos Aires City
The City of Buenos Aires, also known as the Autonomous City of Buenos, serves as the seat of the federal government and is the capital of Argentina.
Covering an area slightly larger than 200 square kilometers, with a perimeter of 60 km, the city is home to nearly three million residents. These residents are distributed across neighborhoods that are administratively grouped into fifteen communes, resulting in a population density of over 15,000 inhabitants per square kilometer.
Currently, poverty affects 27% of individuals and 20% of households in Buenos Aires. Over the past year, poverty rates have risen by 2.5 percentage points for households and 3.6 percentage points for individuals. More than half of the households in the southern zone earn less than the amount required to cover basic food basket expenses.
2. Materials and Methods
The methodology applied, as detailed in Figure 1, consists of three interconnected parts: (1) the identification of what constitutes healthy diets: Dietary Guidelines for the Argentine Population (GAPA) and EAT-Lancet Commission; (2) the identification of foods in relation to their sustainability characteristics: organic and agroecological; (3) thirdly, it describes how mathematical linear programming has been used to define the proposed diets and their relative costs.
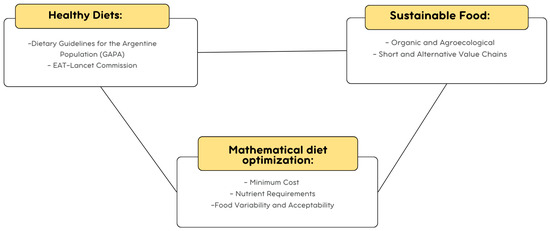
Figure 1.
Methodological approach.
2.1. Healthy Diets Identification: GAPA and Lancet
A healthy diet provides not only adequate calories but also adequate levels of all essential nutrients for a healthy and active life, through a balanced mix of carbohydrates, protein, fat, vitamins, and minerals, within the upper and lower bounds needed to prevent deficiencies and avoid toxicity.
This kind of diet helps protect against malnutrition and diet-related noncommunicable diseases such as diabetes, heart disease, stroke, and cancer [17].
Diets are based on global guidelines that are nationally adapted to a country’s individual characteristics, cultural context, locally available foods, and dietary customs through national food-based dietary guidelines (FBDGs).
At national level, the “Dietary Guidelines for the Argentine Population (GAPA)” origins from the model developed, validated, and used by INCAP in Latin America, later adapted by FAO for the Caribbean and is built through of a wide series of consultations with all interested parties, and regularly updated taking into account the evolution of dietary habits, the characteristics of the morbidity of the population, and the development of new knowledge on food and nutrition [8].
This research takes from one side the recommendations of the last update made in 2016 and involves complementing with the GAPA, the recommendations emanated from the EAT-Lancet Commission that brings together 19 Commissioners and 18 coauthors from 16 countries with an interdisciplinary approach including experts in human health, agriculture, political sciences, and environmental sustainability with the main goal to develop global scientific targets based on the best evidence available so healthy diets and sustainable food production aligned with the UN Sustainable Development Goals (SDGs) and Paris Agreement for win-win diets “healthy and environmentally sustainable” can be identified [2].
The EAT-Lancet proposal has its innovation and core element that distinguish itself from national FBDGs on providing scientific boundaries to reduce environmental degradation caused by food production at all scales at the time that insures healthy diets and environment taking into consideration six key Earth system processes: climate change, biodiversity loss, freshwater use, interference with the global nitrogen and phosphorus cycles, and land-system change.
Finally, the commission proposes a universal framework for all food cultures and production systems in the world, with a high potential for local adaptation and scalability. Taking into consideration both frameworks: GAPA and EAT-LANCET, as we can see in Table 2, a common model has been identified regardless of the differences between food aggregation and the target (female with low physical activities and male whose physical activities are moderate to high).
Table 2.
GAPA and EAT-LANCET recommended diets.
2.2. Organic and Agroecological, Short and Alternative Value Chains
Empirical evidence regarding the sustainability elements distinguishing organic agriculture and agroecology exists in various fields of knowledge, such as farm viability, income, and productivity [21,22,23]; crop protection through trophic networks and biodiversity [24,25,26]; carbon cycle and climate change [27]; ecosystem services [28]; and food security and nutrition [29,30,31], among others.
Agroecology has gained prominence in scientific, agricultural, and political discourses in recent years [32,33]. Since the 2008 world food crisis, various United Nations bodies have published important documents recognizing their role in making agricultural and food systems more sustainable and aligned with UN Sustainblae Development Goals (SDGs), confirming that the agroecological approach offers consistent responses to the exacerbation, global spread, and interlinking of food, energy, ecological, economic, social, and climate crises [3,34,35,36,37,38].
Empirical evidence from various regions of the world [39,40,41,42] also shows that agroecological practices are driving non-linear and non-hierarchical change. These practices do not aim for an abrupt transformation of the dominant regime, but instead foster complex processes that are adapted to local socio-ecological and historical contexts, contributing concretely to many of the 17 Sustainable Development Goals (SDGs), particularly SDG 1 (No Poverty), SDG 2 (Zero Hunger), SDG 3 (Good Health and Well-Being), SDG 6 (Clean Water and Sanitation), SDG 12 (Responsible Consumption and Production), SDG 13 (Climate Action), and SDG 15 (Life on Land) [29,43].
The literature related to short and alternative chains presents a broad development and touches different dimensions and fields of research [8]. The two characteristics present in most of the works are based on the proximity between the producer and the consumer, both through geographical proximity and through organizational proximity. [44,45].
In Argentina, short value chains are mainly related in most cases to the organizational aspects directly related to the social and solidarity economy [46].
During the months of January to March of 2020 (summer period), more than 60 varieties of organic and agroecological products of different food groups were identified from a representative base of short-chain distribution systems with the participation of different structures and actors that included a total of 200 delivery points distributed throughout the territory of the City of Buenos Aires.
The chains presented can be classified into three different categories:
- A.
- Producer groups/unions that jointly organize the distribution through their organization:
These groups produce in an agroecological way and in the 3 cases included belong to social and solidarity economy initiatives.
In the case of the Union of Land Workers (UTT), it gathers around 10,000 peasant families and producers from 15 provinces. Their declared reason for being is to defend these families and to fight for their access to land and for the conditions of production and life.
Their marketing strategy is based on the creation of their own agroecological greengrocers, presence at local fairs, and network organization for food basket distribution. It is organized through neighborhood nodes in its different forms—Social Organizations, Neighborhood Organizations, and Institutions (municipalities, universities, foundations, Cooperatives)—and individuals or families that receive at least 10 food baskets every week.
There are more than 200 nodes of Solidarity Consumers throughout the Greater Buenos Aires, La Plata, and the Autonomous City of Buenos Aires, to which the food baskets arrive on certain days and times.
The same methodology is implemented by “Mercado Territorial”, which is constituted as a second-level group with the participation of different organizations, groups of producers, and cooperatives from all over the country. It was promoted from its origins by the University of Quilmes. It is built in open and participatory assemblies where producers, consumers, managers of nodes and logistics, and solidarity intermediaries discuss the heterogeneity of the bag.
The same mechanisms of socialization and decision making are shared by the Bolson Soberano Initiative, which integrates different farming families mainly integrated in the association of producers called 1610, with members in this case mainly allocated in Florencio Varela Municipality in Buenos Aires Province. They are based 40 km from the city of Buenos Aires, becoming the shortest possible distance for food supply, not considering urban agriculture inside the city.
The “Sovereign food basket” initiative was strongly supported by the University of Buenos Aires Agricultural and Agrarian Faculty (FAUBA).
Most horticultural production from the three presented groups comes from the peri-urban edges of the Metropolitan Area of Buenos Aires, which contributes to the provision of fresh food for the entire population.
The three organizations are taking part in the interinstitutional “National System of Participatory Certification” (CNCP).
- B.
- Small businesses and healthy shops (“dieteticas”) that offer products from different producers or producer groups
These enterprises that have grown widely in the last 6 years are small private initiatives of buying groups or dedicated small shops. They buy from single producers, family farmers, associations, and cooperatives like those introduced before, and centers of distribution like Paralelo Organico, which is the only medium retailer up to now of organic products based on the central market.
The six initiatives are centered on the food baskets: el click orgánico, la comunidad organica, no cualquier verdura, el brote organico, como siempre orgánico, tierra orgánica and one, Fernanda, with non-fresh products.
The growth of this initiative is highly facilitated by social networks: each one of the selected six experiences has at least 40.000 followers on main social networks (Instagram and Facebook), where they advertise and organize their weekly food baskets and related product sales.
With the exception of como siempre organic, which is certified as an organic distributor guaranteeing through certification that all their products are organic, the guarantee of the other cases is completely delegated to the enterprises. Only one of them, el click, organizes visits to the producers with consumers; in most of the cases, the possibility of consumer participation is limited to making inquiries in the respective platforms.
In the case of Fernanda, who delivers non-fresh foods, they are certified organic and self-declared agroecological products.
The orders are completely organized online, and delivered in different spaces, mainly in the so-called “dieteticas” that have undergone a strong expansion from the 2000s, and that are small shops of healthy foods that recently include most of the non-fresh organic products present on the markets.
Different products present in these shops were included in the research, such as meat, honey, wheat, pasta, rice, and some agroecological products that have long-term tradition in the country like las Chozas dairy farm, which since more than 20 years ago implements biodynamic practices until now but is not yet certified, and COECO chicken and eggs.
Included in this group is a small biomarket specialized only in organic agriculture, which directly buys from producers; a medium enterprise; and finally an organic bakery chain: “Hausbrot”, which is one of the pioneers in the organic bakery sector with more than 20 shops in the city.
- C.
- Independent small-holder organic producers.
There are 2 cases of certified organic horticultural producers that mainly incorporate organic fruits from other producers in the country to complement their offers: La Anunciación and Tallo Verde; these two producers from the peri-urban area of Buenos Aires are among the starters of delivering organic and agroecological products from the 1990s.
The different products and baskets are all exclusively certified under the organic regulations, and their distribution is directed both to final consumers and to healthy stores like those seen in the previous group.
2.3. Mathematical Diet Optimization
Mathematical diet optimization, also referred to as diet modeling or diet optimization, originated in the 1940s with Georges Stigler’s seminal work. Stigler employed linear programming—a classical mathematical technique—to address complex problems, such as estimating the minimum cost of a diet while meeting various nutritional and acceptability constraints [9]. Since then, diet optimization has become a valuable tool in balancing nutritional adequacy, cultural acceptability, and economic feasibility in diet design.
A crucial component of developing a sustainable diet model is the accurate characterization of the population and their dietary habits. The parameters of the model must be carefully justified and adapted to align with the study’s objectives.
In this research, we developed a linear programming model to determine the minimum cost of a diet while adhering to nutritional recommendations, production and distribution processes, and various constraints:
Nutritional Recommendations: The model integrates guidelines from both GAPA (Guías Alimentarias para la Población Argentina) and the EAT-Lancet Commission. For food groups, GAPA recommendations are combined with EAT-Lancet limits, particularly addressing culturally significant dietary items, such as meat consumption in Argentina.
Organic and Agroecological Sources: The model includes only available food from organic and agroecological value chains.
Food Variability and Acceptability: Constraints were applied based on data from INDEC [20] to account for food preferences, limiting less acceptable items and ensuring adequate quantities of highly acceptable foods.
Nutrient Requirements: The model incorporates essential nutrients identified in Argentinian previous studies [6], including proteins; fiber; calcium; iron; zinc; potassium; and vitamins A, C, and B9. It also considers critical nutrients like sugars, sodium, saturated fatty acids, and starches. Minimum requirements for essential nutrients and maximum limits for critical nutrients are based on the European Food Safety Authority (EFSA) Dietary Reference Values (DRVs) for healthy populations.
3. Results
To assess dietary costs and affordability, two household models were used as references:
- Single Adult Household: Represented by a middle-aged woman with low physical activity, quantified as 0.77 consumer units.
- Family Household: Comprising four members—one man (35 years), one woman (31 years), one boy (6 years), and one girl (8 years)—represented by 3.09 consumer units.
Some recommended foods could not be included since they were not available when researching identified production requirements. Peanut is among them, which is recommended by the Lancet; another food that has not been considered is fish, given the fact that in the city of Buenos Aires, up to now, there are no fishery products in the market that follow organic certification processes, or that have specific characteristics of sustainable traditional fishing.
As can be seen, very few processed products have been included, given that when defining the diet, the priority was to address a majority of fresh products for homemade preparations. Table 3 shows the results obtained for the single adult household case.
Table 3.
Single adult household diet.
This diet, which had a total cost of Argentinian Pesos $8028, guarantees the minimum requirements for each essential nutrient without exceeding the maximum recommended critical intakes, as shown in Table 4:
Table 4.
Single adult diet nutritional values and cost.
For the same period, that is, March 2020, the Basic Food Basket in the City of Buenos Aires for a mononuclear family made up of a middle-aged female member $5372 (Argentinian Pesos). This means that the healthy option with organic and agroecological food from short and alternative value chains costs 49% more than the first one.
Considering the second case—a household of four members—the model included a broader range of foods, resulting in a more diverse set of ingredients suitable for preparing different dishes, as shown in Table 5.
Table 5.
Family-identified diet.
This diet, which had a total cost of Argentinian Pesos $28,857, also guarantees the minimum requirements for each essential nutrient for all members of the family without exceeding the maximum recommended critical intakes, as shown in Table 6.
Table 6.
Family diet nutritional values and cost.
In this case, in March 2020, the Basic Food Basket for a family of four with two adults and two children in the City of Buenos Aires, amounted to $21,279 (Argentinian Pesos), which means that the diet elaborated by the model presented would be 35% higher.
Table 7 is relevant for understanding the specific price differences between organic and conventional foods. It includes only those items present in both baskets, showing a notably higher price for flour and baked goods, where organic products were priced at nearly three times the cost of conventional ones. Meat, eggs, and oil were priced close to double, while the price differences for vegetables and fruits were smaller, at 4.7% and 13%, respectively.
Table 7.
Price difference between model diet—CBA.
In order to analyze the accessibility that the population of the City of Buenos Aires has to this diet, for the different economic/societal groups, the income registered in March 2020 [47] was taken as a reference, as shown in Table 8.
Table 8.
Incomes, food expenditures, and poverty rates.
The food expense % in relation to incomes (not including alcoholic beverages) was taken as a reference, according to the latest statistics available for the years 2017/2018 [20].
Analyzing the data derived from the pooling of these two factors, we can see that only part of the middle sector, the one with the highest income, and the well-off sectors could economically access this proposed diet in full. Especially, if we take the average amount attributed to this group at 21.1%, an income of $ 136,763 would be needed.
4. Discussion
The significant disparity between the food model proposed in the CBA in Buenos Aires and the recommendations of GAPA and the EAT-Lancet Commission highlights a fundamental mismatch. The methodological foundations—based on the cost of an unhealthy diet—that underpin the National Indigence Index and poverty lines are flawed and lead to distorted assessments of the population’s real nutritional needs. These findings provide evidence for redefining poverty measurements and food policy in alignment with SDG 2 (Zero Hunger) and SDG 12 (Responsible Consumption and Production). This challenge is consistent with international evidence showing that official poverty lines frequently underestimate the real cost of healthy diets [49,50].
Observing the results obtained according to the income groups, we can see that three different groups could be identified: A first group in a situation of poverty could not, in any way, access the proposed diet. A second group in a situation of economic vulnerability, or the lower segment of the middle class, could eventually have access to products with fewer price differences, that is, vegetables; fruits; legumes; and some optional foods such as honey, sugar, or cookies. But it would be extremely difficult for them to access products such as flour, bread, meat, and dairy products. Finally, a small group represented by the upper middle class and the well-off sectors could eventually choose a whole diet based on the proposed model.
Beyond cost comparisons, the results also underscore the role of short and alternative value chains in improving dietary diversity and food sovereignty [36,48,51]. The inclusion of agroecological and organic products from solidarity networks in Buenos Aires reflects broader international experiences where participatory guarantee systems have enhanced both producer resilience and consumer access. However, the persistence of price differentials—particularly in products such as meat, dairy, and cereals—reveals structural market barriers that cannot be addressed solely through consumer choice. This suggests that affordability challenges are systemic and require integrated policy interventions, such as subsidies for sustainable production, fiscal disincentives for ultra-processed foods, or targeted social protection measures that facilitate access to nutrient-dense foods.
This methodology offers valuable insights for a wide range of stakeholders. It makes it possible to calculate the cost of a healthy, organic, short-chain diet that could eventually include all foods produced within a given region. Based on this, the required budget to feed the local population with products already available in the territory can be determined. The approach also helps identify which social groups have access to such diets, providing evidence to design public policies that improve accessibility and to support market analyses from the private sector.
In this regard, it could serve as a basis to identify actions for local development and the scaling up of organic and agroecological production and consumption. This framework could very well be applied to bio-districts as an indicator to understand the economic accessibility of their inhabitants to organic and agroecological products. It can be assessed over time if applied with a temporal recurrence, measuring the variety of organic and agroecological food offerings, inflation in diet costs, and, simultaneously, the evolution of the population’s accessibility to these foods. In this sense, it could function as a monitoring tool. Furthermore, it would be possible to compare different territories across the various elements mentioned using the same methodology.
5. Conclusions
This study demonstrates that nutritionally adequate diets can be designed exclusively with organic and agroecological foods available in Buenos Aires, applying linear programming to optimize costs while ensuring cultural relevance. Despite the growing interest in healthy and sustainable diets both locally and internationally, this is the first research in the country to apply this methodology to identify the lowest-cost options that meet basic nutritional needs. Beyond its local application, the methodology provides a transferable tool for assessing the affordability of diets in other contexts, offering valuable insights for policy, research, and practice.
The findings underline the need for new approaches in food policy and poverty measurement that better reflect the real cost of sustainable and healthy diets.
In the current study, short and alternative chains were chosen, often from the perspective of the social and solidarity economy, to include an agroecological vision in the food process.
In the case of Buenos Aires, organic and agroecological foods are not widely present in large chains, so their inclusion was not deemed relevant to provide a comparative vision between large distribution and short chains in organic production. This element could be considered in other contexts where the distribution of organic products is largely carried out through these systems, and also where agroecology is less widespread in social and market networks.
On the other hand, one element that could be interesting to evaluate in some cases is self and collective production, including different systems of community support agriculture and different forms of solidarity economy systems.
Future work should incorporate the above elements, possibly expanding to year-based study to include all seasonal variations, broaden the range of food groups considered, and test policy scenarios—such as subsidies or institutional procurement—that could reduce the affordability gap and scale up access to sustainable diets.
Author Contributions
Conceptualization, J.P.S., M.D. and F.A.; methodology, J.P.S. and M.D.; software (GAMS modeling), J.P.S., M.D.; validation, J.P.S., M.D. and F.A.; formal analysis, J.P.S.; investigation, J.P.S.; resources, J.P.S.; data curation, J.P.S., M.D.; writing—original draft preparation, J.P.S.; writing—review and editing, J.P.S.; visualization, J.P.S.; supervision, F.A.; project administration, J.P.S. All authors have read and agreed to the published version of the manuscript.
Funding
This research received no external funding.
Data Availability Statement
Additional information, including data and programming details, is available upon reasonable request from the corresponding author via email (juanpablo.sciurano@unipr.it).
Conflicts of Interest
The authors declare no conflicts of interest.
Abbreviations
The following abbreviations are used in this manuscript:
| CBA | Basic Food Basket |
| CBT | Total Basic Basket |
| CNCP | National System of Participatory Certification |
| CoE | Engel Coefficient |
| CALISA | Food Sovereignty Open Course |
| DRVs | Dietary Reference Values |
| EFSA | European Food Safety Authority |
| ENGHo | National Household Expenditure Survey |
| FBDGs | Food-Based Dietary Guidelines |
| FAUBA | Buenos Aires Agricultural and Agrarian Faculty |
| GAPA | Guidelines for the Argentine Population |
| INCAP | Institute of Nutrition of Central America and Panama |
| INDEC | National Institute of Statistics and Censuses |
| IPC | Consumer Price Indices |
| PGS | Participatory Guarantee Systems |
| SDGs | Sustainable Development Goals |
| UTT | Union of Land Workers |
References
- FAO; IFAD; UNICEF; WFP; WHO. The State of Food Security and Nutrition in the World 2020; Transforming Food Systems for Affordable Healthy Diets; FAO: Rome, Italy, 2020. [Google Scholar]
- Willett, W.; Rockström, J.; Loken, B.; Springmann, M.; Lang, T.; Vermeulen, S.; Murray, C.J. Food in the Anthropocene: The EAT–Lancet Commission on healthy diets from sustainable food systems. Lancet 2019, 393, 447–492. [Google Scholar] [CrossRef] [PubMed]
- FAO. The State of the World’s Biodiversity for Food and Agriculture; Bélanger, J., Pilling, D., Eds.; FAO Commission on Genetic Resources for Food and Agriculture Assessments: Rome, Italy, 2019. [Google Scholar]
- Arbenz, M. Organic and agroecology: Synergetic approaches. Farm. Matters 2018, 3, 21. [Google Scholar]
- Migliorini, P.; Wezel, A. Converging and diverging principles and practices of organic agriculture regulations and agroecology. A Review. Agron. Sustain. Dev. 2017, 37, 63. [Google Scholar] [CrossRef]
- Britos, S.; Borg, A.; Güiraldes, C.; Simonetti, C.; Oliveri, E.; Chichizola, N. Diseño de una canasta saludable de alimentos y criterios para una evaluación comparativa de precios y densidad de nutrientes. Diaeta 2018, 36, 20–29. [Google Scholar]
- Luo, J.; O’Reilly, P.; Cao, H. Short food supply chains and alternative food networks: A review. J. Clean. Prod. 2018, 194, 201–213. [Google Scholar]
- Ministerio de Salud de la Nación Argentina. Guías Alimentarias Para la Población Argentina (GAPA). Buenos Aires, Ministerio de Salud. 2016. Available online: https://www.argentina.gob.ar/sites/default/files/bancos/2020-08/guias-alimentarias-para-la-poblacion-argentina_manual-de-aplicacion_0.pdf (accessed on 24 July 2024).
- Stigler, G.J. The cost of subsistence. J. Farm Econ. 1945, 27, 303–314. [Google Scholar] [CrossRef]
- INDEC. Anuario Estadístico de Comercio Exterior de Bienes. Año 2021; INDEC: Buenos Aires, Argentina, 2022. [Google Scholar]
- INDEC. Resultados Definitivos del Censo Nacional Agropecuario 2018; INDEC: Buenos Aires, Argentina, 2020. [Google Scholar]
- Sciurano, J.P.; Arfini, F.; Maccari, M. A methodological approach to upscale organic and agroecological–local agrifood systems: The case of the Pampa Organica Norte group in Argentina. Front. Sustain. Food Syst. 2024, 8, 1304558. [Google Scholar] [CrossRef]
- Ministerio de Salud y Desarrollo Social de la Nación Argentina. Segunda Encuesta Nacional de Nutrición y Salud (ENNyS 2), Indicadores Priorizados; Ministerio de Salud: Buenos Aires, Argentina, 2019. [Google Scholar]
- INDEC. 4° Encuesta Nacional de Factores de Riesgo. Resultados Definitivos; Secretaría de Gobierno de Salud de la Nación: Ciudad Autónoma de Buenos Aires, Argentina, 2019. [Google Scholar]
- Jones, N.R.V.; Conklin, A.I.; Suhrcke, M.; Monsivais, P. The growing price gap between more and less healthy foods: Analysis of a novel longitudinal UK dataset. PLoS ONE 2014, 9, e109343. [Google Scholar] [CrossRef]
- Darmon, N.; Ferguson, E.L.; Briend, A. A cost constraint alone has adverse effects on food selection and nutrient density: An analysis of human diets by linear programming. J. Nutr. 2002, 132, 3764–3771. [Google Scholar] [CrossRef]
- World Health Organization. Healthy Diet (No. WHO-EM/NUT/282/E); Regional Office for the Eastern Mediterranean, WHO: Geneva, Switzerland, 2019. [Google Scholar]
- Mac Loughlin, T.M.; Peluso, M.L.; Etchegoyen, M.A.; Alonso, L.L.; De Castro, M.C.; Percudani, M.C.; Marino, D.J. Pesticide residues in fruits and vegetables of the Argentine domestic market: Occurrence and quality. Food Control 2018, 93, 129–138. [Google Scholar] [CrossRef]
- INDEC. La Medición de la Pobreza y la Indigencia en la Argentina; INDEC: Buenos Aires, Argentina, 2016. [Google Scholar]
- Ministerio de Economía. Encuesta Nacional de Gastos de los Hogares 2017–2018; Instituto Nacional de Estadística y Censos—Ministerio de Economía: Ciudad Autónoma de Buenos Aires, Argentina, 2019. [Google Scholar]
- Aubron, C.; Noël, L.; Lasseur, J. Labor as a driver of changes in herd feeding patterns: Evidence from a diachronic approach in Mediterranean France and lessons for agroecology. Ecol. Econ. 2016, 127, 68–79. [Google Scholar] [CrossRef]
- D’Annolfo, A.; Gemmill-Herren, B.; Graeub, B.E.; Garibaldi, L.A.; Bambrick, H.; Brauman, K.A. A review of social and economic performance of agroecology. Int. J. Agric. Sustain. 2017, 15, 632–644. [Google Scholar] [CrossRef]
- Van der Ploeg, J.D.; Barjolle, D.; Bruil, J.; Brunori, G.; Madureira, L.M.C.; Dessein, J.; Wezel, A. The economic potential of agroecology: Empirical evidence from Europe. J. Rural Stud. 2019, 71, 46–61. [Google Scholar] [CrossRef]
- Niggli, U.; Schmidt, J.; Watson, C.; Kriipsalu, M.; Shanskiy, M.; Barberi, P.; Kowalska, J.; Schmitt, A.; Claudia, D.; Ulla, W.; et al. Organic Knowledge Network Arable—D3.1 State-of-the-Art Research Results and Best Practices. 2016. Available online: https://orgprints.org (accessed on 2 November 2022).
- Hole, D.G.; Perkins, A.J.; Wilson, J.D.; Alexander, I.H.; Grice, P.V.; Evans, A.D. Does organic farming benefit biodiversity? Biol. Conserv. 2005, 122, 113–130. [Google Scholar] [CrossRef]
- Rahmann, G. Biodiversity and organic farming: What do we know? vTI Agric. For. Res. 2011, 3, 189–208. [Google Scholar]
- Migliorini, P.; Parrott, N.; Mulligan, D.; Lühker, B.; Reganold, J.P.; Scialabba, N. Agroecology and climate change. Sustainability 2016, 8, 244. [Google Scholar]
- Palomo Campesino, S.; González, J.A.; García Llorente, M. Exploring the connections between agroecological practices and ecosystem services: A systematic literature review. Sustainability 2018, 10, 4339. [Google Scholar] [CrossRef]
- Reganold, J.P.; Wachter, J.M. Organic agriculture in the twenty-first century. Nat. Plants 2016, 2, 15221. [Google Scholar] [CrossRef]
- Raigón, M.D. Manual de la Nutrición Ecológica: De la molécula al plato. AE. Rev. Agroecol. Divulg. 2020, 39, 10. [Google Scholar]
- Kerr, R.B.; Madsen, S.; Stüber, M.; Liebert, J.; Enloe, S.; Borghino, N.; Wezel, A. Can agroecology improve food security and nutrition? A review. Glob. Food Secur. 2021, 29, 100540. [Google Scholar] [CrossRef]
- Wezel, A.; Bellon, S.; Dor, T.; Francis, C.; Vallod, D.; David, C. Agroecology as a science, a movement and a practice. A review. Agron. Sustain. Dev. 2009, 29, 503–515. [Google Scholar] [CrossRef]
- De Molina, M.G.; Petersen, P.F.; Peña, F.G.; Caporal, F.R. Political Agroecology: Advancing the Transition to Sustainable Food Systems; CRC Press: Boca Raton, FL, USA, 2019. [Google Scholar]
- International Assessment of Agricultural Knowledge, Science and Technology for Development (IAASTD), United Nations Environment Programme. Agriculture at a Crossroads: Synthesis Report. UNEP. 2009. Available online: https://wedocs.unep.org/20.500.11822/7862 (accessed on 24 July 2025).
- De Schutter, O. Agro Ecology and the Right to Food. Report Submitted to the UN Human Rights Council, A/HRC/16/49; United Nations: New York, NY, USA, 2011. [Google Scholar]
- High-Level Panel of Experts on Food Security and Nutrition (HLPE). Agroecological and Other Innovative Approaches for Sustainable Agriculture and Food Systems That Enhance Food Security and Nutrition; Committee on World Food Security, FAO, HLPE Report 14; FAO: Rome, Italy, 2019. [Google Scholar]
- United Nations Conference on Trade and Development (UNCTAD). Wake up Before It Is too Late: Make Agriculture Truly Sustainable Now for Food Security in a Changing Climate; UNCTAD Trade and Environment Review 2013; UNCTAD: Geneva, Switzerland, 2013. [Google Scholar]
- Intergovernmental Panel on Climate Change (IPCC). Climate Change and Land: An IPCC Special Report on Climate Change, Desertification, Land Degradation, Sustainable Land Management, Food Security and Greenhouse Gas Fluxes in Terrestrial Ecosystems; IPCC: Geneva, Switzerland, 2019. [Google Scholar]
- Sarandón, S.J.; Flores, C.C. (Eds.) Agroecología: Bases Teóricas Para el Diseño y Manejo de Agroecosistemas Sustentables; Universidad Nacional de La Plata, Edulp: La Plata, Argentina, 2014. [Google Scholar]
- Biovision. The Potential of Agroecology to Build Climate Resilient Livelihoods and Food Systems; Biovision & FAO Report; Biovision: Zurich, Switzerland, 2018. [Google Scholar]
- IPES Food. Breaking Away from Industrial Food and Farming Systems: Seven Case Studies of Agroecological Transition; International Panel of Experts on Sustainable Food Systems: Brussels, Belgium, 2018. [Google Scholar]
- Mier y Terán Giménez Cacho, M.; Giraldo, O.F.; Aldasoro Maya, M.; Morales, H.; Ferguson, B.G.; Khadse, A.; Campos, C. Bringing agroecology to scale: Key drivers and emblematic cases. Agroecol. Sustain. Food Syst. 2018, 42, 637–665. [Google Scholar] [CrossRef]
- Seufert, V.; Ramankutty, N.; Foley, J.A. Comparing the yields of organic and conventional agriculture. Nature 2012, 485, 229–232. [Google Scholar] [CrossRef] [PubMed]
- Aubry, C.; Kebir, L. Territorial proximity and short food supply chains: An analysis of initiatives in France. Sustainability 2013, 5, 2995–3013. [Google Scholar]
- Boschma, R. Proximity and innovation: A critical assessment. Reg. Stud. 2005, 39, 61–74. [Google Scholar] [CrossRef]
- Anello, M.C.; Rodríguez, V.; Bunge, M.M.; Wright, E.; Carballo, C. Soberanía Alimentaria y Economía Social. La Feria del Productor al Consumidor en la Facultad de Agronomía—UBA 2015–2019. Rev. Am. Empred. Inov. 2020, 2, 371–383. [Google Scholar] [CrossRef]
- Dirección General de Estadística y Censos (DGEyC). Informe de Condiciones de vida. Ciudad Autónoma de Buenos Aires—1° Trimestre de 2020; Gobierno de la Ciudad Autónoma de Buenos Aires: Ciudad Autónoma de Buenos Aires, Argentina, 2020. [Google Scholar]
- Renting, H.; Schermer, M.; Rossi, A. Building Food Democracy: Exploring Civic Food Networks and Newly Emerging Forms of Food Citizenship. Int. J. Sociol. Agric. Food 2012, 19, 289–307. [Google Scholar]
- Herforth, A.; Bai, Y.; Venkat, A.; Mahrt, K.; Ebel, A.; Masters, W.A. Cost and Affordability of Healthy Diets Across and Within Countries: Background Paper for the State of Food Security and Nutrition in the World 2020; FAO: Rome, Italy, 2020. [Google Scholar]
- FAO; IFAD; UNICEF; WFP; WHO. The State of Food Security and Nutrition in the World 2023; Urbanization, Agrifood Systems Transformation and Healthy Diets Across the Rural–Urban Continuum; FAO: Rome, Italy, 2023. [Google Scholar]
- Migliorini, P.; Gkisakis, V.; Gonzalvez, V.; Raigón, M.D.; Bàrberi, P. Agroecology in Mediterranean Europe: Genesis, State and Perspectives. Sustainability 2018, 10, 2724. [Google Scholar] [CrossRef]
Disclaimer/Publisher’s Note: The statements, opinions and data contained in all publications are solely those of the individual author(s) and contributor(s) and not of MDPI and/or the editor(s). MDPI and/or the editor(s) disclaim responsibility for any injury to people or property resulting from any ideas, methods, instructions or products referred to in the content. |
© 2025 by the authors. Licensee MDPI, Basel, Switzerland. This article is an open access article distributed under the terms and conditions of the Creative Commons Attribution (CC BY) license (https://creativecommons.org/licenses/by/4.0/).