Article

A Sensor-Enabled Smart Tray for Understanding Consumer Eating Behavior in a Restaurant

by
Benjamin Baugier
1,2,*,†,
Charles Boreux
1,2,†,
Simon De Jaeger
1,
Nathan Codutti
1,
François-Xavier Barbet
1,
Antoine Barbaut
1,
Uzeir Joomun
1,
Sébastien Joseph Guna Rajan
1,
Dorothée Goffin
1 and
Eric Haubruge
1
1
Faculty of Gembloux Agro-Bio Tech, University of Liège, 5030 Gembloux, Belgium
2
Multitel, 7000 Mons, Belgium
*
Author to whom correspondence should be addressed.
These authors contributed equally to this work.
Gastronomy 2025, 3(2), 9; https://doi.org/10.3390/gastronomy3020009
Submission received: 25 February 2025 / Revised: 16 May 2025 / Accepted: 27 May 2025 / Published: 4 June 2025

Abstract

:
This preliminary study explores the use of a smart tray prototype equipped with a weight sensor to analyze consumer eating behavior in real-life conditions. Conducted in 2022, at the restaurant “La Confluence” in Namur, with 60 participants, the experiment involved tracking the progression of a standardized meal, “Scallops in sauce with vegetables”. The collected data allowed for the calculation of variables such as bite count, applied force, meal duration, and quantity consumed. Through mathematical processing, insights into individual and group eating patterns were developed, with 39 usable datasets analyzed. Our first results show that the smart tray is capable of estimating the weight consumed and the number of bites with over 97% accuracy. Statistical analysis enabled the identification of four distinct groups of individuals based on five behavioral variables related to eating behavior. The smart tray could be used in hospitality establishments including cafeterias, restaurants, or brasseries, where it could serve as a valuable tool for monitoring meal nutrition. Further improvements will aim to enhance utensil and action recognition through artificial intelligence, which will also support a more detailed characterization of eating behavior.

1. Introduction

Understanding consumer eating behavior is a fundamental aspect of disciplines such as nutrition science, product development, and marketing strategy development. Insights into eating habits not only aid in designing healthier food products, but also help professionals and decision-makers to address public health challenges, such as obesity and malnutrition.
Manual methods based on observations for studying food consumption and eating behaviors are time-consuming, require manual data entry, and are prone to errors [1]. These approaches often lead to inconsistencies and inefficiencies in data collection and analysis. Traditional approaches, such as surveys like the Mini Nutritional Assessment (MNA®) [2], provide valuable data, but are also prone to biases such as under-reporting or over-reporting. The MNA highlights specific dietary deficiencies; however, it does not directly provide the solutions to be implemented. Low-scoring items need to be investigated [3].
Recent advancements in sensory and digital technologies have paved the way for innovative methodologies that overcome these barriers. Wearable devices, mobile applications, and sensor-based systems are increasingly being employed to gather objective, real-time data on eating behaviors in diverse contexts. These technologies allow researchers to study dynamic and situational factors influencing eating habits, such as social interactions, food presentation, and environmental conditions, which are difficult to replicate in controlled settings [4]. However, these devices often introduce an intrusive element that can alter participants’ natural eating behavior. This reactivity to observation can skew results and undermine the reliability of findings.
These limitations highlight the need for innovative, non-intrusive approaches to studying eating behavior that can capture real-time, high-resolution data without disrupting natural habits. A promising solution lies in the use of tools such as weight-sensitive plates or trays, which can continuously monitor consumption patterns without interfering with the dining experience. An innovative system, such as a smart tablecloth, incorporates a fine-grained pressure textile matrix and a weight-sensitive tablet. This setup enables the detection of food-related actions (e.g., cutting, scooping, stirring), the identification of the plates or containers involved, and the tracking of weight changes in these containers [5].
A research group developed a stationary weighing sensor and a related algorithm capable of detecting and measuring the weight of individual bites during unrestricted eating. Using an instrumented table with four trays placed on food scales, the algorithm identifies stable weight periods and analyzes surrounding weight changes. It compares these patterns to distinguish between food bites and sips [6].
Some studies have utilized portable weighing sensor systems, such as a smart plate equipped with three load cells embedded in its compartments. One study identified bites by detecting sharp force increases caused by food scooping and developed a bite detection algorithm using a random forest decision tree classifier [7].
Another study introduced a portable device, the Mandometer, for automatically processing continuous in-meal weight measurements to detect eating indicators, such as total food intake; this device is linked with a smartphone app [8].
This study introduces a sensor-enabled smart tray designed to provide a scalable and contextually applicable tool for monitoring eating behaviors. Equipped with a weight sensor, the smart tray tracks meal weight progression and the work on the plate in real-life conditions, offering data on parameters such as bite frequency, meal duration, and portion consumed.
The smart tray’s utility not only lies in its ability to capture quantitative metrics, but also in its potential to uncover patterns and insights into consumer eating behaviors. By processing the data collected by the tray, key behavioral indicators can be identified which can be useful for designing better products, providing personalized dietary recommendations, and establishing relevant marketing strategies. In this context, this study aims to explore the eating behaviors of random users in a real-life setting—specifically, a restaurant environment. Unlike controlled laboratory settings, restaurants provide a dynamic and socially rich context where various factors, such as menu choices, ambient conditions, and interactions with other diners, can influence consumer behavior. Previous research has shown that various environmental and contextual factors can significantly influence eating behaviors in real-life settings. For instance, a study emphasized how non-food-related environmental elements—such as the time of day, distractions, and the presence of others—can subtly but powerfully affect food intake [9]. Another study demonstrated that modifying restaurant ambience through softer lighting and music can lead to reduced calorie consumption and increased satisfaction, suggesting that sensory cues can shape both the quantity consumed and perceived meal quality [10]. Weber investigated how different contextual enhancements, such as the physical environment and freedom of choice, impact consumption, highlighting that people tend to eat more in socially and physically enriched settings [11]. Stroebele reviewed the broader concept of ambience, consolidating evidence that external factors like sound, temperature, and color substantially influence food choices and intake, though their implications for nutritional health remain underexplored [12]. Lastly, Brindal explored the complex role of social dynamics, showing that gender and group composition can simultaneously exert opposing effects on food intake, further supporting the importance of real-world observational studies in diverse dining environments [13]. This interdisciplinary approach bridges the gap between technology and behavioral science, contributing to the development of innovative tools for better understanding and influencing eating behaviors.

2. Materials and Methods

The study was conducted at the restaurant “La Confluence” in Namur, during the KIKK festival in 2022, to assess the performance of the developed connected tray. It was held during dinner time. A contemporary design was applied for the trays according to the style and architecture of the restaurant, in order to fit with the environment, cf. Figure 1a. Prior to the experiment, 60 smart trays were positioned at the dining tables before the serving of a standardized dish of “Scallops in sauce with vegetables”, cf. Figure 1b. These trays were used simultaneously, ensuring the collection of data from all participants in real-life conditions. Participants were informed about the study’s objectives and provided their consent before participating.
The connected trays recorded weight data continuously throughout the meal, capturing temporal variations in weight as participants consumed their meals. These data were anonymized post-collection to ensure participant privacy. Out of the 60 datasets collected, 39 were validated and retained for analysis. The exclusion conditions are further examined in the discussion section.
The raw weight data recorded by the trays were pre-processed using a Python-based algorithm (Version: 3.9.6). This algorithm identifies activity zones, namely interactions within the plate, within the raw data and derives behavioral variables such as the number of bites, meal duration, applied force, and total weight of meal consumed. The detection of these activity zones relies on the identification of non-activity periods—defined as time intervals during which the recorded weight remains stable over a relatively long duration. By segmenting the data based on these stable periods, the algorithm can isolate moments of interaction with the plate and extract behavioral indicators. The following variables, which will be studied in detail, are derived from this activity zone analysis and provide insights into the meal consumption behavior:
  • Total meal duration (s): The time elapsed between the first and last detected action considered as a bite.
  • Activity period duration (s): The cumulative duration of all detected activity zones.
  • Weight consumed (g): The difference between the weight recorded before the first bite and the weight after the last bite.
  • Number of bites (-): The total number of detected actions identified as bites.
  • Bite weight (g): The weight difference between the beginning and end of each action identified as a bite.
  • Time interval between bites (s): The time difference between two consecutive actions considered as bites.
  • Work during action periods (N.s): The area under the curve for each activity zone, representing the intensity of an action.
  • Differentiation of action periods (with/without bite) and their duration (s): Classification of activity zones based on whether they result in a bite. An action is classified as a bite when the weight recorded before the action is greater than the weight recorded after the action. The duration of each type of activity period (with or without bite) is then calculated accordingly.
The pre-processed data were subsequently analyzed using the R software (Version: 4.4.0). Descriptive statistics were generated to identify trends and summarize key consumption metrics. Principal Component Analysis (PCA) and Hierarchical Clustering were applied to group participants into distinct consumer profiles based on the most relevant variables, enabling the identification of consumption patterns and behavioral subgroups.

3. Results

3.1. Analysis of Individual Eating Behaviors

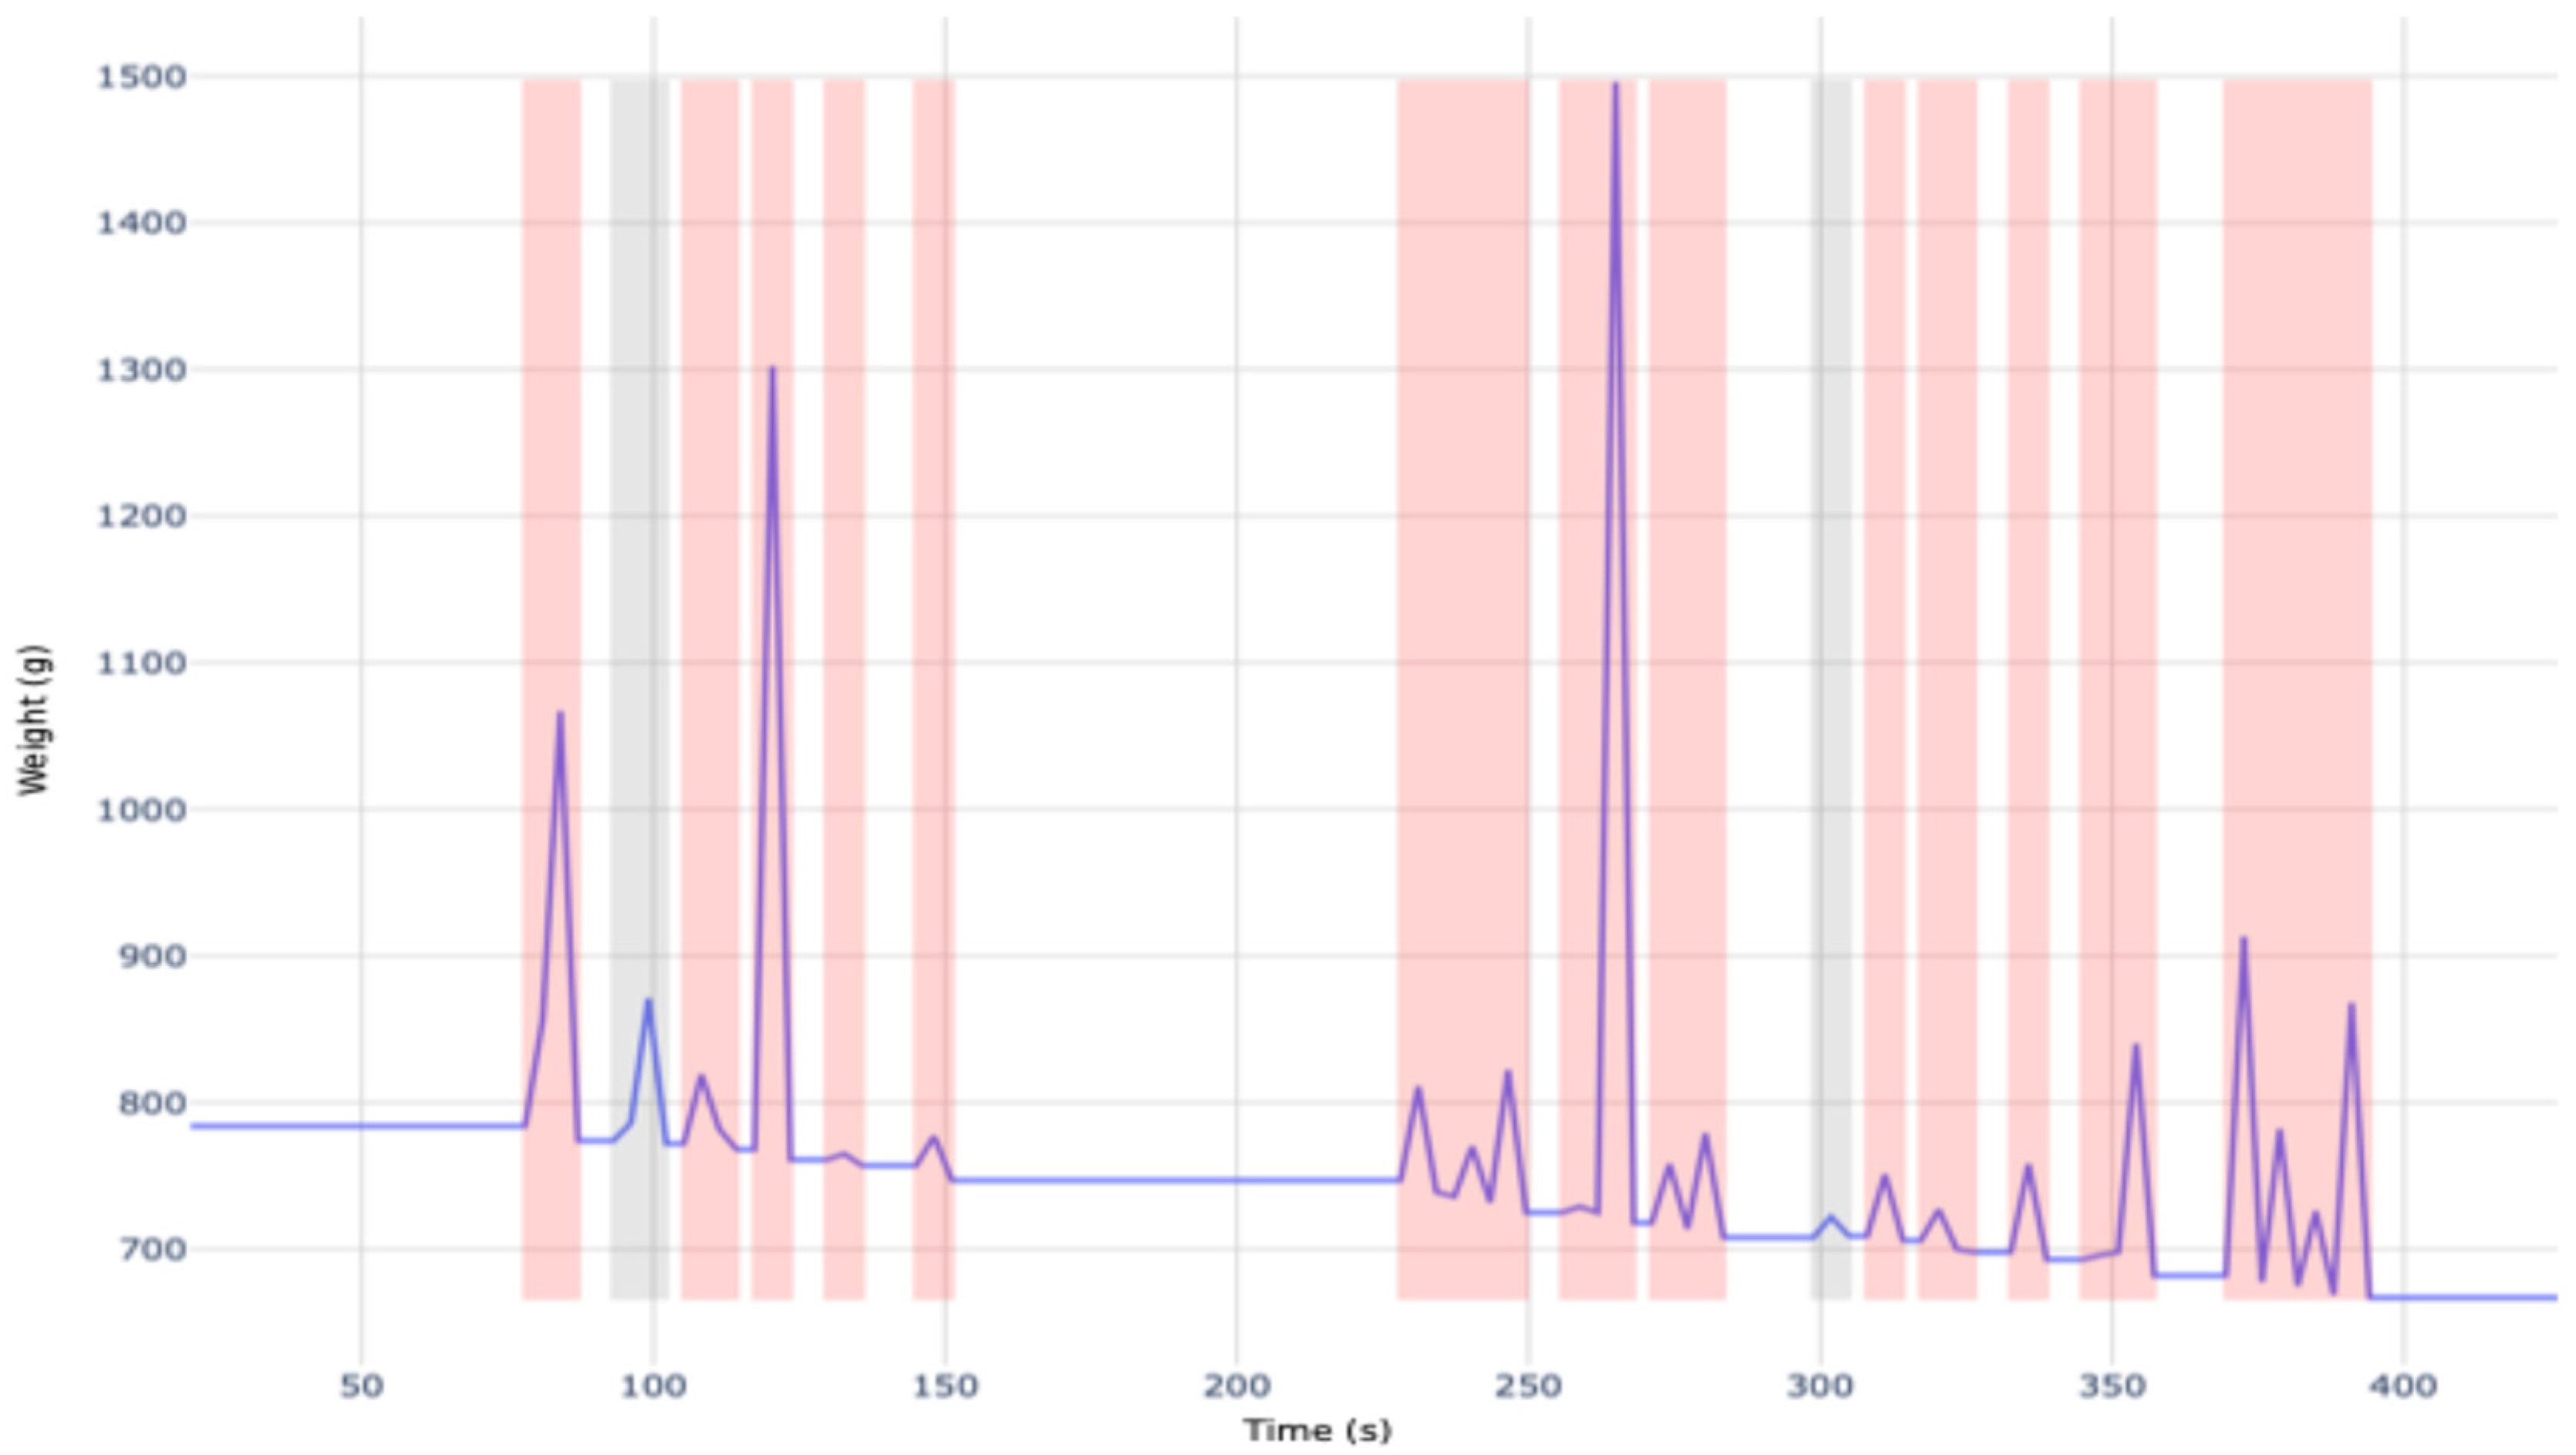
After processing the raw data using the custom Python algorithm, key variables were extracted, such as the total meal duration, total activity duration, number of bites, and weight of meal consumed. In addition to these variables, the algorithm generated an individual graph for each participant. Figure 2 provides a visual representation of temporal variations in weight during the meal, capturing active and inactive eating periods, cf. Table 1.
The processed data and graphical outputs were subsequently analyzed using R to identify trends and patterns, providing a comprehensive understanding of individual consumption behaviors. Other variables which fluctuate over the course of a meal were determined by the algorithm, allowing for the inclusion of additional behavioral variables of interest, cf. Table 2. The remaining data on the other variables can be found in Appendix A, Table A1.

3.2. Characterization of Group Eating Behaviors

Building on the insights gained from individual analyses, we expanded our focus to evaluate eating behaviors at the group level. To analyze behaviors across the 39 usable datasets, a standardized Principal Component Analysis (PCA) was performed on the following variables:
  • Total meal duration (s);
  • Activity ratio (%) 1;
  • Number of bites;
  • Average time interval between each bite (s);
  • Average work (N.s) 2.
1 Activity ratio = (Total Activity Duration ÷ Total Meal Duration) * 100; represents the percentage of activity over the meal.
2 The average area under among all activity periods; represents the intensity of an action.
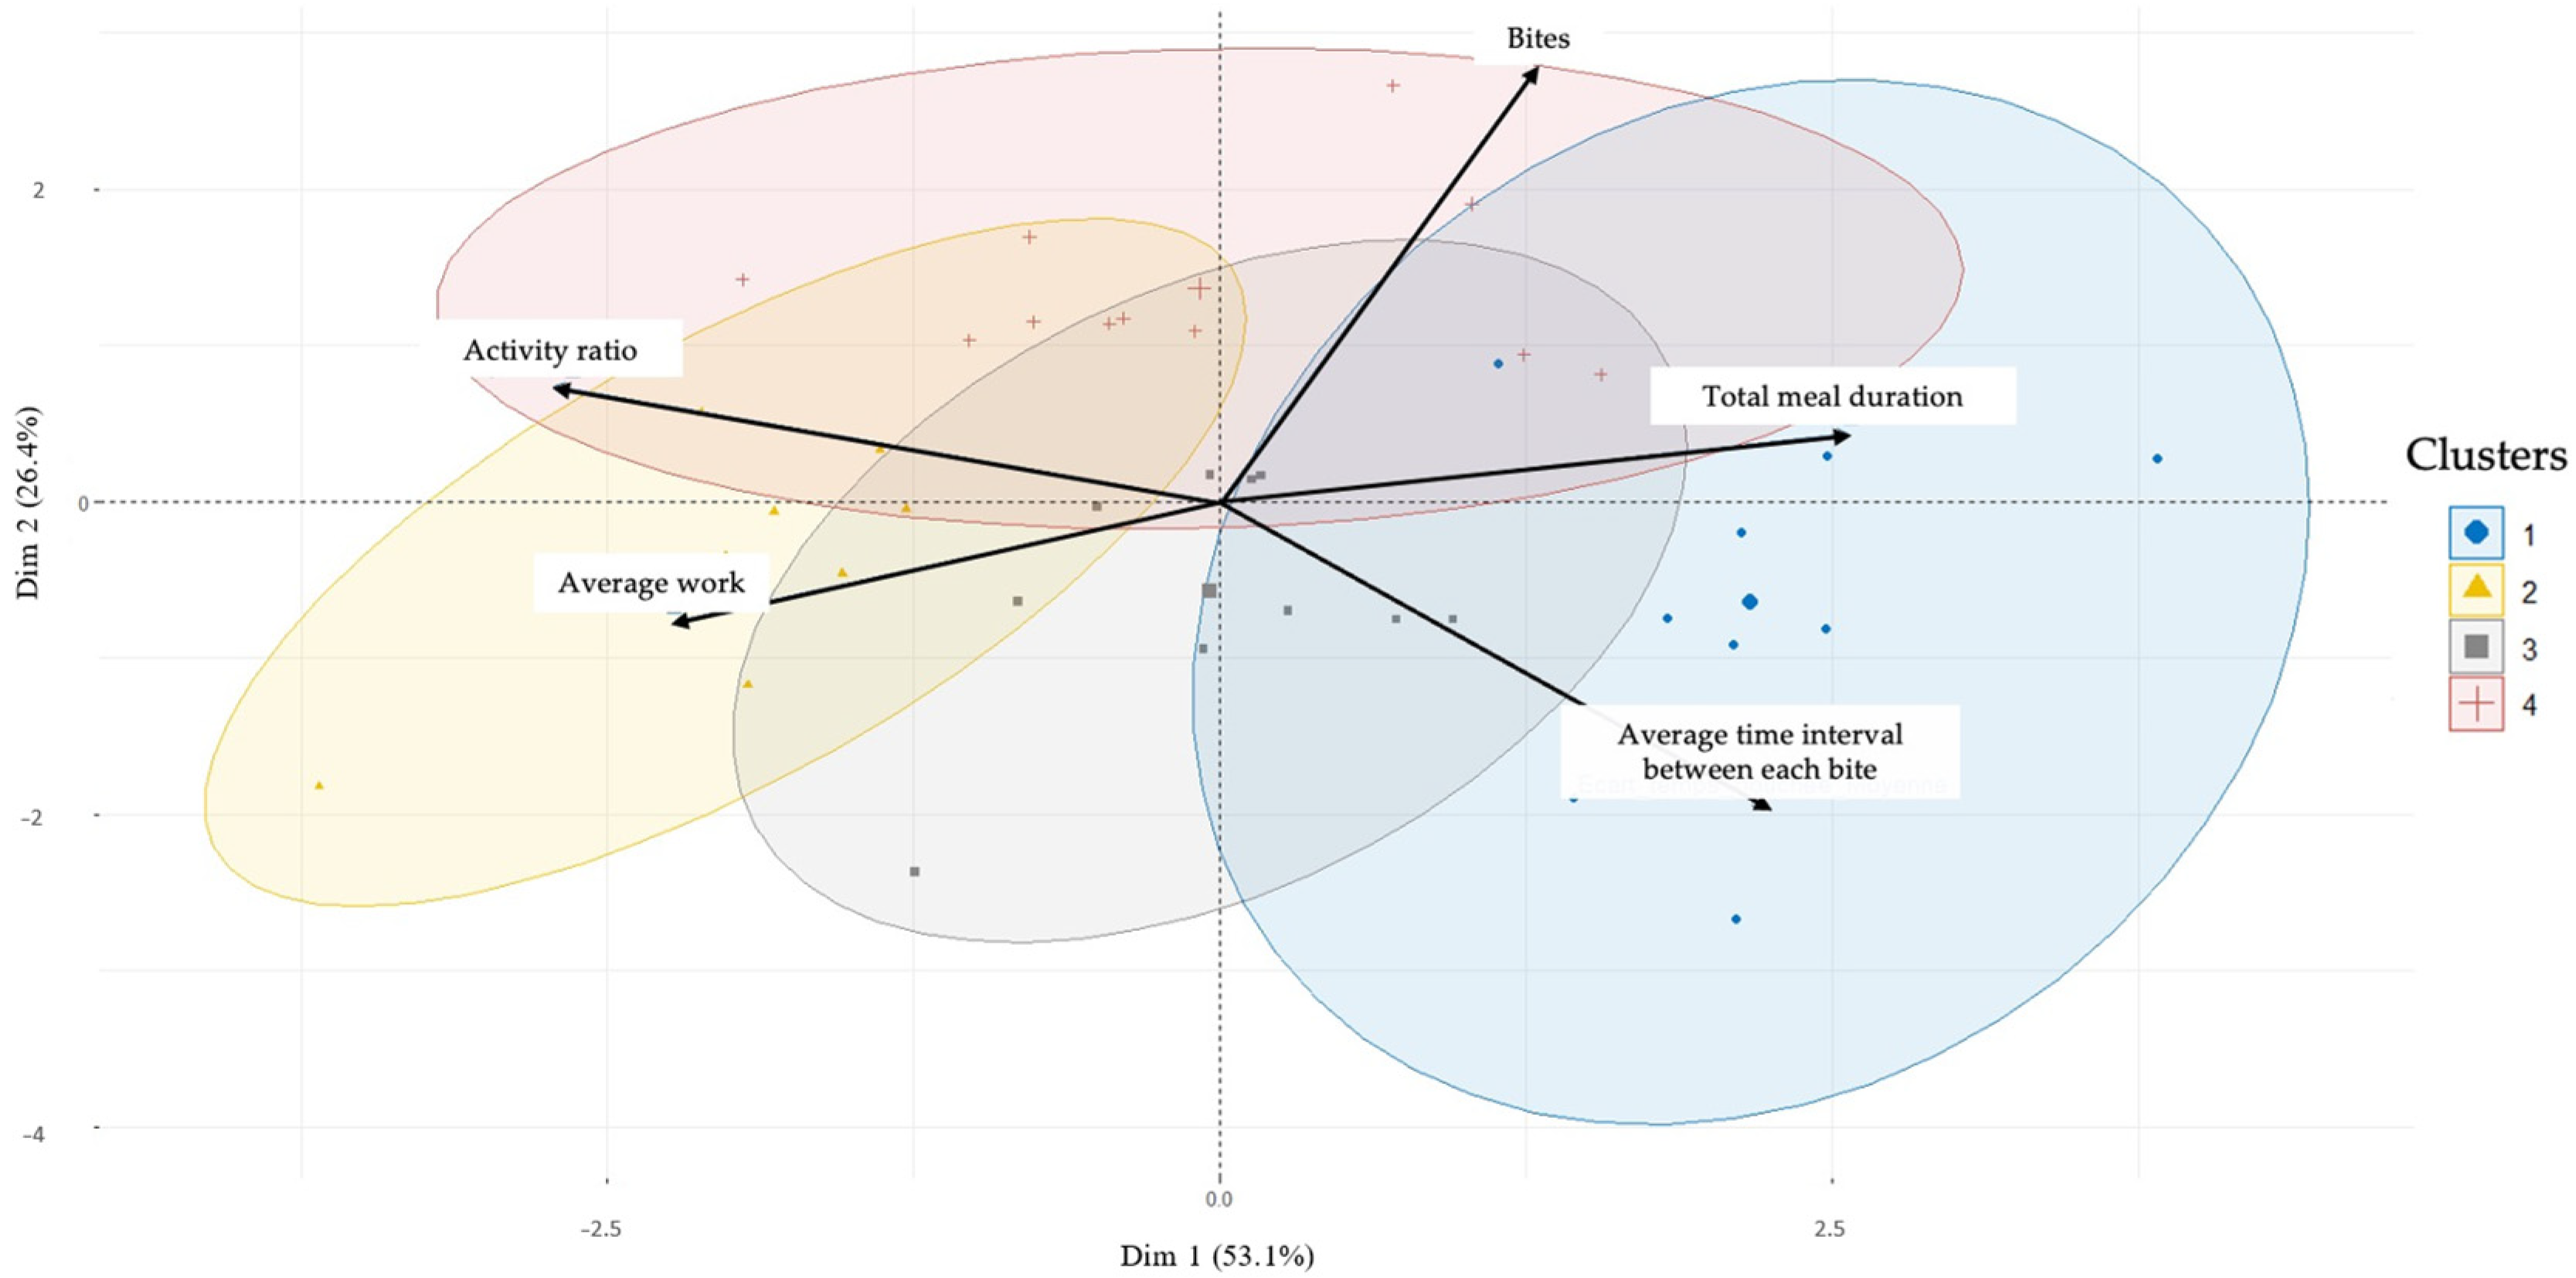
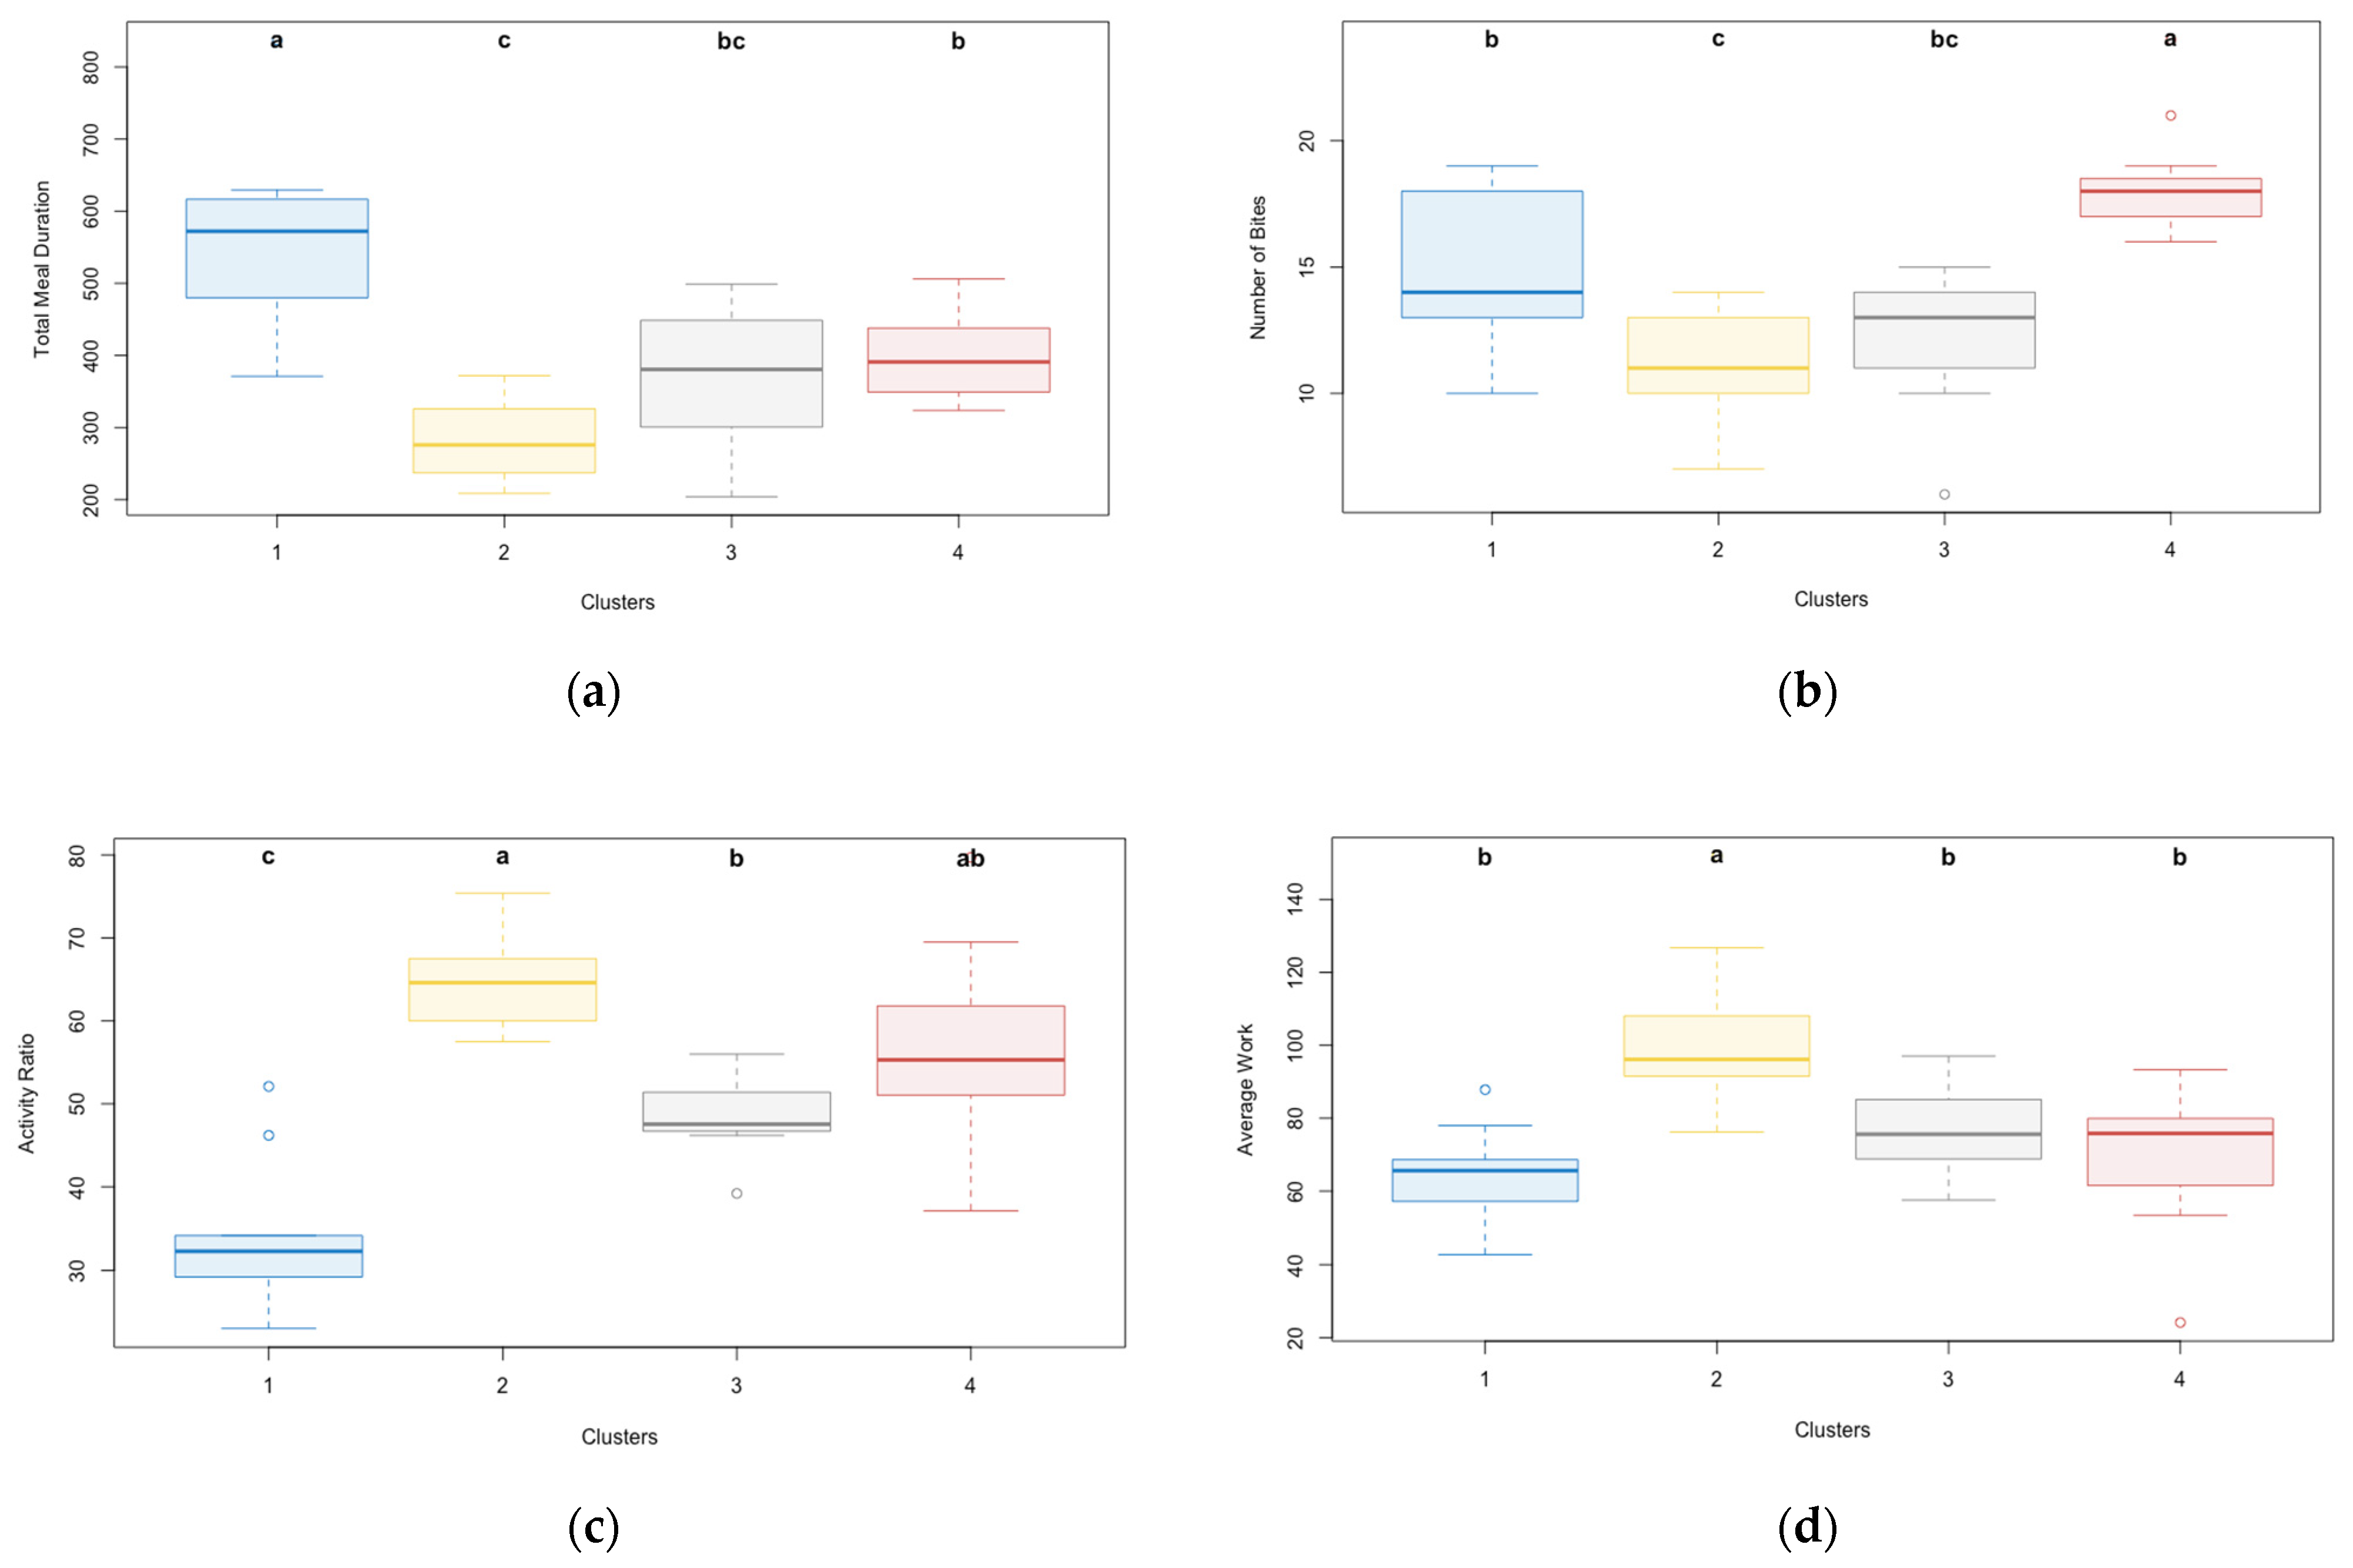
Following the PCA, an ascending hierarchical classification (AHC) method was applied to the PCA coordinates from dimension 1 and 2 to cluster participants based on their eating behavior, cf. Figure 3 and Table 3. This classification identified four groups, each corresponding to different patterns of eating behavior. In this study, Group 1 (nine individuals) is characterized as the group that took the longest to eat their meal, with a higher meal duration and the longest average interval between bites, cf. Figure 4a,e. Group 2 (nine individuals) is distinguished as those who exerted the most effort during the meal, cf. Figure 4c,d. Group 3 (10 individuals) is considered the most balanced, including those who did not demonstrate specific eating behaviors, cf. Figure 4. Finally, the last group (11 individuals) is characterized by those who took the most bites, cf. Figure 4b.

4. Discussion

This study provided valuable insights into consumer eating behavior using an innovative sensor-enabled tray, although some limitations emerged during the experimentation process. While 60 participants were initially included, only 39 datasets were usable for analysis. This reduction was primarily due to external factors affecting the sensor’s accuracy. For instance, behaviors such as leaning on the tray, removing or repositioning the plate, or other similar actions frequently disrupted data collection. Additionally, some trays exhibited weight sensor drift, rendering certain datasets unreliable. These observations highlight the need to consolidate the design of the connected trays to overcome the effect of improper use and sensor drift, as well as the need to make the algorithm more resilient to non-controlled conditions.
Despite these challenges, the tray demonstrated remarkable potential, estimating the consumed weight and bite count with an accuracy of over 97% in controlled laboratory conditions. In this setup, a known number of modeling clay pieces were removed using only a fork, solely by pricking them.
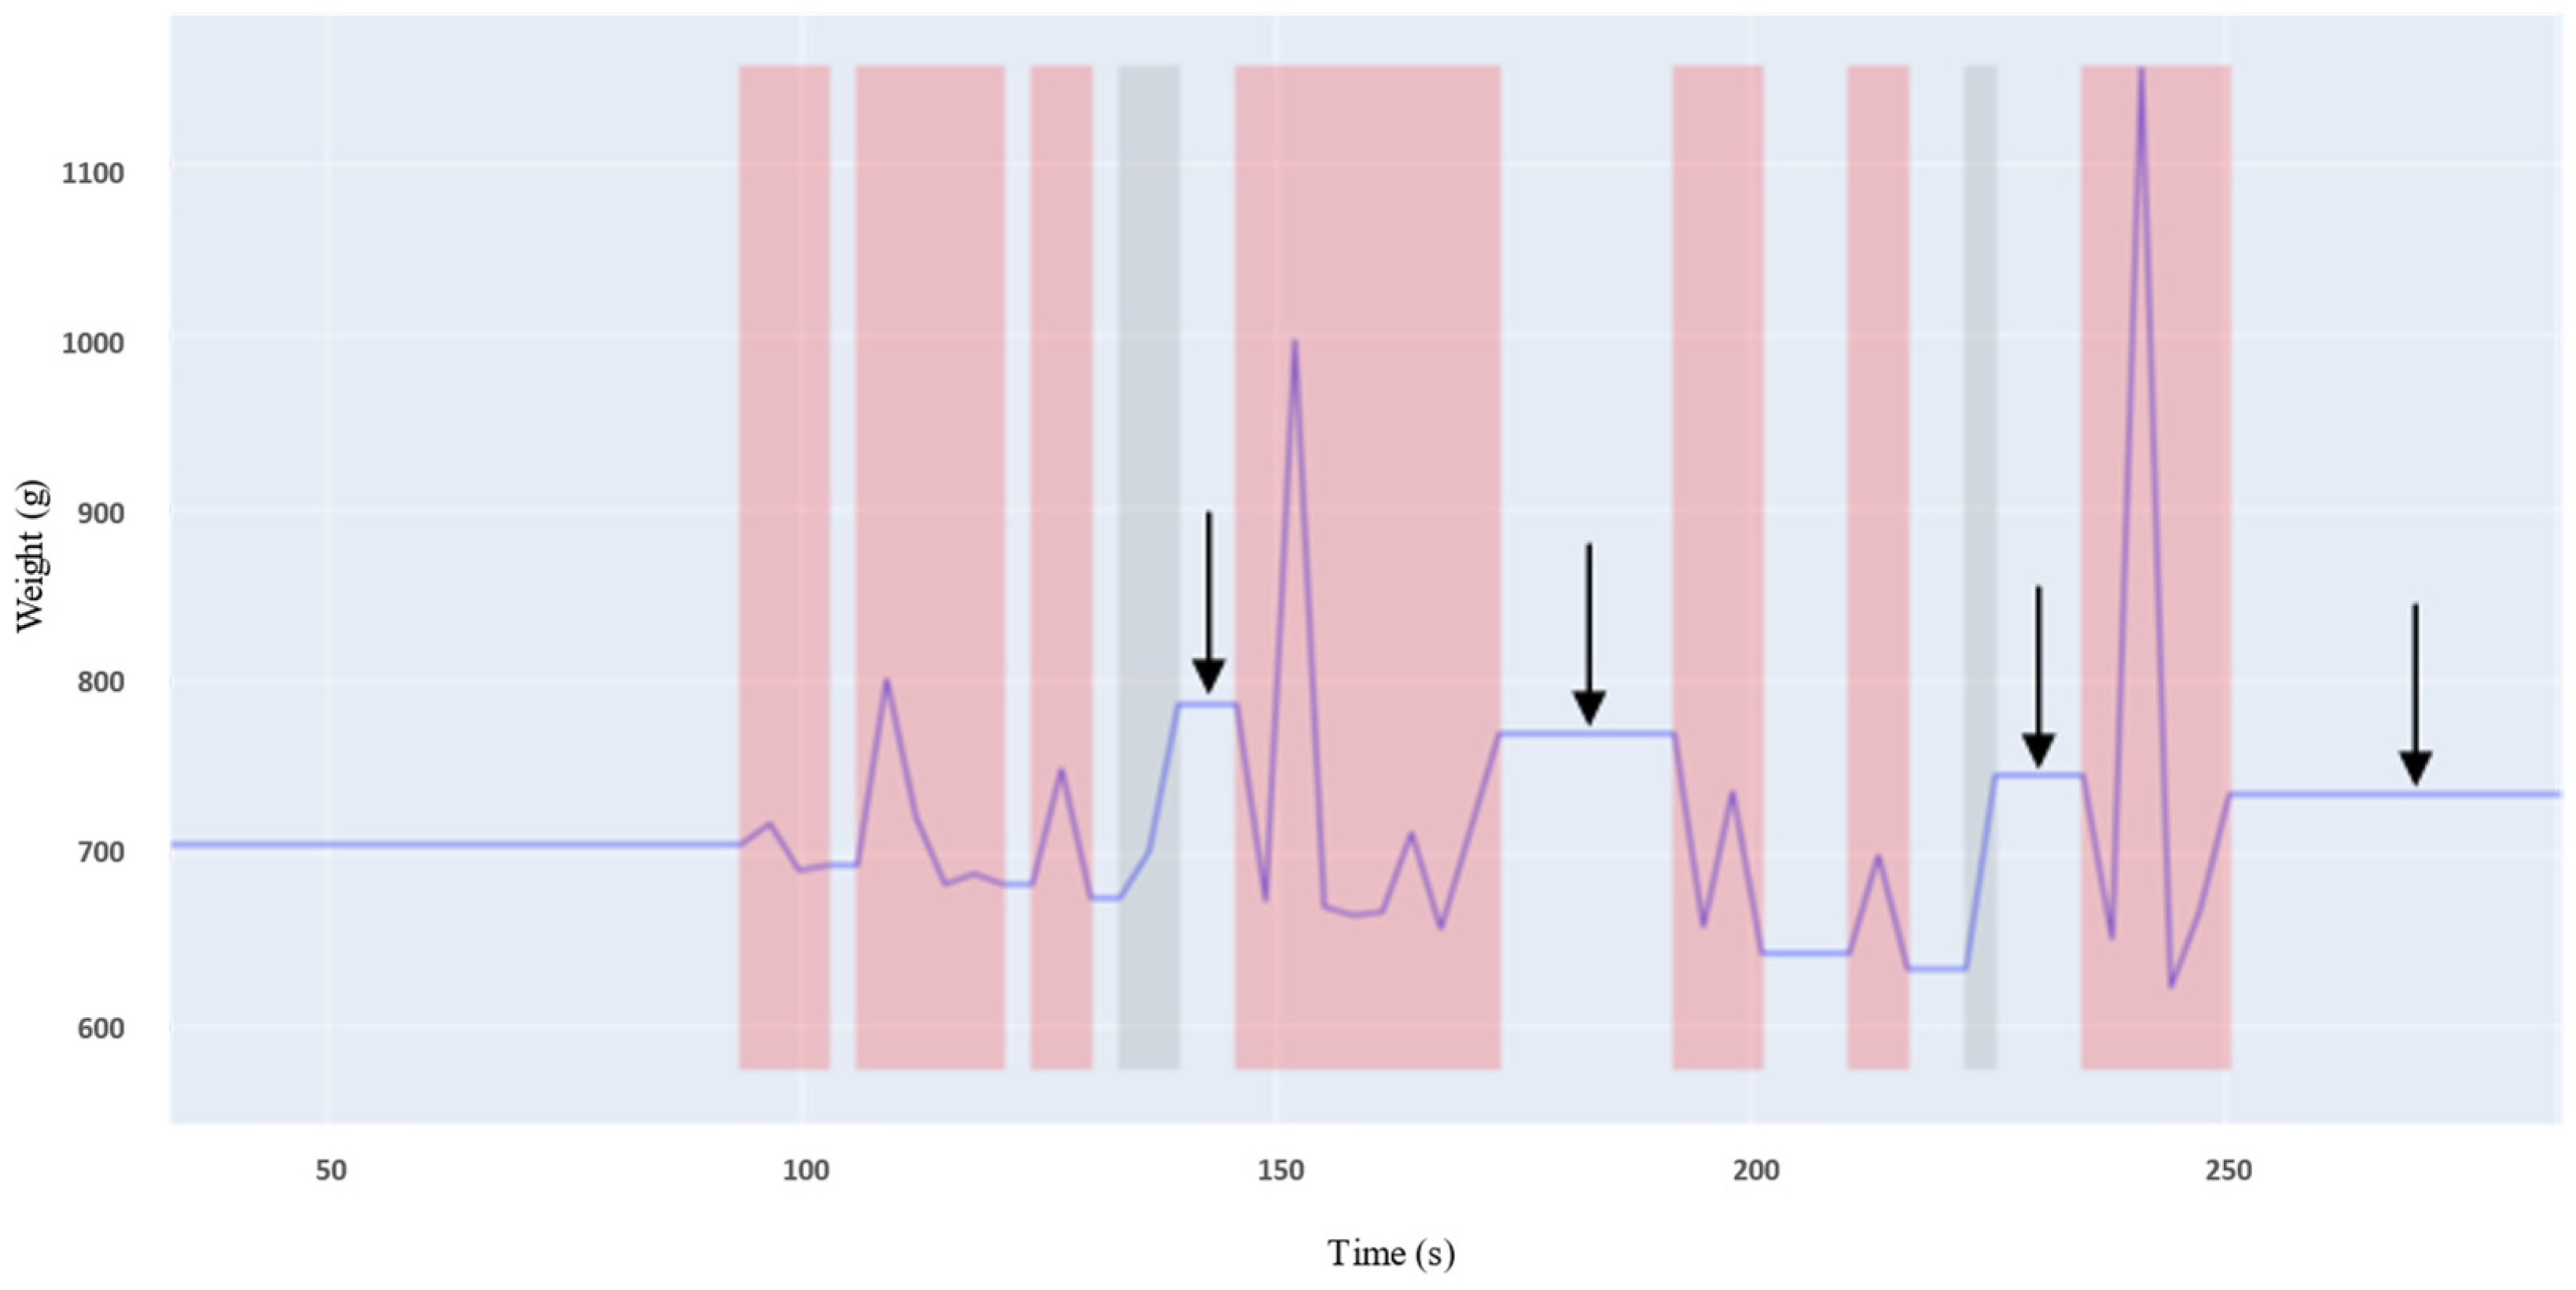
However, in natural eating conditions, additional actions are performed, which can also interfere with the bite count estimation—for example, the use of different utensils and gestures [5], accidental touches on the tray during the meal, lifting the plate, or placing utensils down. Indeed, the inability to differentiate between actual bites and actions such as placing and removing utensils from the plate is illustrated in Figure 5. This misclassification can lead to overestimations in bite count, indicating an area for further refinement. Moreover, other studies mention the use of cameras to record the meal period, allowing verification that the bites detected by the algorithm correspond to actual bites in reality [5,6,7,8]. This approach was not implemented in the present study, but is something worth exploring in future experiments. However, the final objective is to eliminate the need for cameras to avoid any form of intrusion leading to non-natural behaviors, and to rely solely on the data collected from the smart tray.
Another limitation of the present study is the lack of a collective analysis of the consumed meal weight. Plates were not weighed post meal to determine whether participants finished their servings. These data could have provided valuable insights into individual appetite levels and preferences for the dish, offering a new dimension for inclusion in Principal Component Analysis (PCA) and clustering techniques.
As discussed in the introduction, eating behavior is influenced by the surrounding environment. La Confluence is an innovative bistronomic restaurant located in the heart of Namur, offering a panoramic view of the rivers. The restaurant features a mix of seating arrangements, from intimate tables for two to larger group settings. In addition, the dish served during the study was a refined starter: scallops with vegetables. Presented elegantly, the dish required minimal cutting and was typically eaten with a spoon, which may have influenced both the pace and style of consumption. This type of experiment cannot be fully replicated due to the inherent variability of environmental factors. Each setting presents unique and dynamic interactions, influenced by elements such as the participants’ mood, the cultural context, and even subtle changes in lighting or noise levels [9,14]. While researchers can attempt to standardize certain aspects, the complex interplay between these variables means that results may vary significantly between experiments. This highlights the challenge of drawing universally applicable conclusions from studies conducted in naturalistic environments, where the controlled conditions of a laboratory are intentionally absent to better mimic real-life scenarios. Such a smart tray should thus be used in combination with complementary tools such as environmental captors to enable the specification of the real-life environment and contextualize the behaviors. The noise level, illumination, and ambient temperature are the main parameters to evaluate in the context of a restaurant [10,12]. Furthermore, the appearance of the dining room, the type and quality level of the restaurant, the service style, and the configuration of the tables and number of diners per table can also influence the diners’ behaviors in such contexts [11,13].
Despite these limitations, the data collected hold significant relevance, particularly in a restaurant context, as they provide insights that are imperceptible to the naked eye. These insights include assessing consumer preference for specific menu items, estimating the average time required to finish a meal to aid in operational planning, or evaluating the force applied during consumption to determine whether a dish is challenging to eat and, moreover, to evaluate the quality of the cooking.
Although only a few variables were used for the analysis, the connected plate algorithm stands out due to its ability to calculate additional variables derived from the weight measurements over time, such as the maximum force applied during each active period (N) and the work performed (N.s). The algorithm’s ability to compute metrics like force and work could be particularly relevant for diagnosing muscular diseases such as sarcopenia [15]. Additionally, it is valuable for product development, where determining the ideal consistency and texture of a product is crucial. For instance, the smart tray could be used for the recognition of food texture. This kind of approach has been studied with an in-ear microphone [16]. Furthermore, the smart tray could also serve as a tool for diagnosing eating disorders by analyzing patterns of food intake and behavior, offering insights that could support clinical assessments and personalized treatment plans [17]. Table 4 is inspired by a systematic review of the use of sensors for portion size estimation [4], and provides a comparative analysis of existing weighing sensors. It highlights their strengths and limitations, while positioning the proposed device within this context. The comparison focuses on key factors such as study conditions and practical constraints, emphasizing how the proposed approach addresses certain limitations observed in previous technologies.
In summary, while the sensor-enabled tray showcases promising applications for analyzing eating behavior, further refinement is necessary to enhance the accuracy and robustness of its data collection, especially the estimation of bites. Incorporating additional variables, improving sensor technology, and conducting experiments in diverse settings will further validate its potential as a versatile tool for nutritional monitoring and consumer behavior analysis.

5. Conclusions

This study demonstrates the potential of a smart tray for analyzing consumer eating behaviors in real-life conditions, such as in restaurants. The results highlight its ability to estimate key metrics, but also reveal methodological limitations. These findings prove the need for improvements in sensor technology and data processing algorithms.
Despite these challenges, the tray offers valuable insights into meal duration, consumption patterns, and the physical effort involved in eating. By detecting subtle behavioral indicators that are otherwise imperceptible, it provides a deeper understanding of eating habits at both individual and group levels.
Future research will also focus on detecting bite location. A new tray, currently under development and equipped with multiple weight sensors, will enable this detection. Additionally, future research should focus on enhancing action recognition through artificial intelligence, testing the tray in diverse environments, and incorporating additional variables such as post-meal plate weighing and social interactions. While further refinement is necessary, this technology holds significant potential for applications in personalized nutrition, public health, market research, and food service operations.

Author Contributions

Conceptualization, C.B., S.D.J., F.-X.B., D.G. and E.H.; methodology, C.B., S.D.J., F.-X.B., D.G. and E.H.; software, B.B., N.C., C.B., S.D.J., A.B., U.J. and S.J.G.R.; validation, B.B., D.G. and E.H.; formal analysis, B.B.; data curation, B.B. and C.B.; writing—original draft preparation, B.B.; writing—review and editing, B.B., D.G. and E.H.; supervision, D.G. and E.H. All authors have read and agreed to the published version of the manuscript.

Funding

This research received no external funding.

Institutional Review Board Statement

Ethical review and approval were waived for this study due to its exclusion from the scope of the Belgian Law of 7 May 2004, as the research did not involve experiments on the human person aimed at developing medical or biological knowledge.

Informed Consent Statement

Informed consent was obtained from all subjects involved in the study.

Data Availability Statement

The raw data supporting the conclusions of this article will be made available by the authors on request.

Acknowledgments

We would like to thank the KIKK Festival organizers for their support and for making this project possible. We are also grateful to the restaurant “La Confluence” in Namur and its staff for welcoming us and providing ideal conditions for conducting the experiment.

Conflicts of Interest

The authors declare no conflict of interest.

Appendix A

Table A1. Summary of all meal metrics for 39 individuals.
Total Meal Duration (s)Activity Period Duration (s)Weight Consumed (g)BitesAverage Bite Weight (g) *Time Interval Between Bites (s)Average Action Period with Bite (s) *Average Action Period Without Bite (s) *Maximum Force Applied (N)Average Work (N.s) *
Minimum203.892.897.065.47.26.63.1318.024.1
Maximum837.1327.8191.02447.750.620.318.33538.0151.8
Mean399.6194.4127.414.314.118.711.58.4942.677.5
Median374.1184.5126.014.010.816.110.98.0859.076.2
Standard deviation132.756.617.33.99.39.32.93.1633.822.2
* The average value is calculated because these variables fluctuate throughout the course of a meal.

References

  1. Burke, L.E.; Warziski, M.; Starrett, T.; Choo, J.; Music, E.; Sereika, S.; Stark, S.; Sevick, M.A. Self-Monitoring Dietary Intake: Current and Future Practices. J. Ren. Nutr. 2005, 15, 281–290. [Google Scholar] [CrossRef] [PubMed]
  2. Guigoz, Y. The Mini Nutritional Assessment (MNA) review of the literature—What does it tell us? J. Nutr. Health Aging 2006, 10, 466–485; discussion 485–487. [Google Scholar] [PubMed]
  3. Hugonot-Diener, L. Présentation du MNA ou Mini Nutritional Assessment. Gérontol. Soc. 2010, 33, 133–141. [Google Scholar] [CrossRef]
  4. Raju, V.B.; Sazonov, E. A Systematic Review of Sensor-Based Methodologies for Food Portion Size Estimation. IEEE Sens. J. 2021, 21, 12882–12899. [Google Scholar] [CrossRef]
  5. Zhou, B.; Cheng, J.; Sundholm, M.; Reiss, A.; Huang, W.; Amft, O.; Lukowicz, P. Smart table surface: A novel approach to pervasive dining monitoring. In Proceedings of the 2015 IEEE International Conference on Pervasive Computing and Communications (PerCom), St. Louis, MO, USA, 23–27 March 2015; pp. 155–162. [Google Scholar]
  6. Mattfeld, R.S.; Muth, E.R.; Hoover, A. Measuring the Consumption of Individual Solid and Liquid Bites Using a Table-Embedded Scale During Unrestricted Eating. IEEE J. Biomed. Health Inform. 2017, 21, 1711–1718. [Google Scholar] [CrossRef] [PubMed]
  7. Mertes, G.; Christiaensen, G.; Hallez, H.; Verslype, S.; Chen, W.; Vanrumste, B. Measuring weight and location of individual bites using a sensor augmented smart plate. In Proceedings of the 2018 40th Annual International Conference of the IEEE Engineering in Medicine and Biology Society (EMBC), Honolulu, HI, USA, 17–21 July 2018; pp. 5558–5561. [Google Scholar]
  8. Papapanagiotou, V.; Diou, C.; Ioakimidis, I.; Sodersten, P.; Delopoulos, A. Automatic Analysis of Food Intake and Meal Microstructure Based on Continuous Weight Measurements. IEEE J. Biomed. Health Inform. 2019, 23, 893–902. [Google Scholar] [CrossRef] [PubMed]
  9. Bellisle, F. L’environnement du mangeur affecte sa consommation alimentaire: Des effets sous-estimés. Méd. Nutr. 2008, 44, 9–15. [Google Scholar] [CrossRef]
  10. Wansink, B.; van Ittersum, K. Fast food restaurant lighting and music can reduce calorie intake and increase satisfaction. Psychol. Rep. 2012, 111, 228–232. [Google Scholar] [CrossRef] [PubMed]
  11. Weber, A.J.; King, S.C.; Meiselman, H.L. Effects of social interaction, physical environment and food choice freedom on consumption in a meal-testing environment. Appetite 2004, 42, 115–118. [Google Scholar] [CrossRef] [PubMed]
  12. Stroebele, N.; De Castro, J.M. Effect of ambience on food intake and food choice. Nutr. Burbank Los Angel. Cty. Calif 2004, 20, 821–838. [Google Scholar] [CrossRef] [PubMed]
  13. Brindal, E.; Wilson, C.; Mohr, P.; Wittert, G. Eating in groups: Do multiple social influences affect intake in a fast-food restaurant? J. Health Psychol. 2015, 20, 483–489. [Google Scholar] [CrossRef] [PubMed]
  14. Stien, É. L’impact de la Culture Sur le Comportement de Consommation: Modélisation d’un Comportement de Consommation Éthique Ethnique. Ph.D. Thesis, Université d’Artois, Arras, France, 2012. [Google Scholar]
  15. Cruz-Jentoft, A.J.; Baeyens, J.P.; Bauer, J.M.; Boirie, Y.; Cederholm, T.; Landi, F.; Martin, F.C.; Michel, J.-P.; Rolland, Y.; Schneider, S.M.; et al. Sarcopenia: European consensus on definition and diagnosis. Age Ageing 2010, 39, 412–423. [Google Scholar] [CrossRef] [PubMed]
  16. Papapanagiotou, V.; Diou, C.; van den Boer, J.; Mars, M.; Delopoulos, A. Recognition of food-texture attributes using an in-ear microphone. In Pattern Recognition. ICPR International Workshops and Challenges; Springer: Berlin/Heidelberg, Germany, 2021; Volume 12665, pp. 558–570. [Google Scholar]
  17. Zeanandin, G. Comment Identifier un Trouble du Comportement Alimentaire (TCA) en Consultation d’HGE? POST’U. 2024, pp. 303–312. Available online: https://www.fmcgastro.org/wp-content/uploads/2023/08/Comment-identifier-un-trouble-du-comportement-alimentaire-TCA-en-consultation-dHGE.pdf (accessed on 24 May 2025).
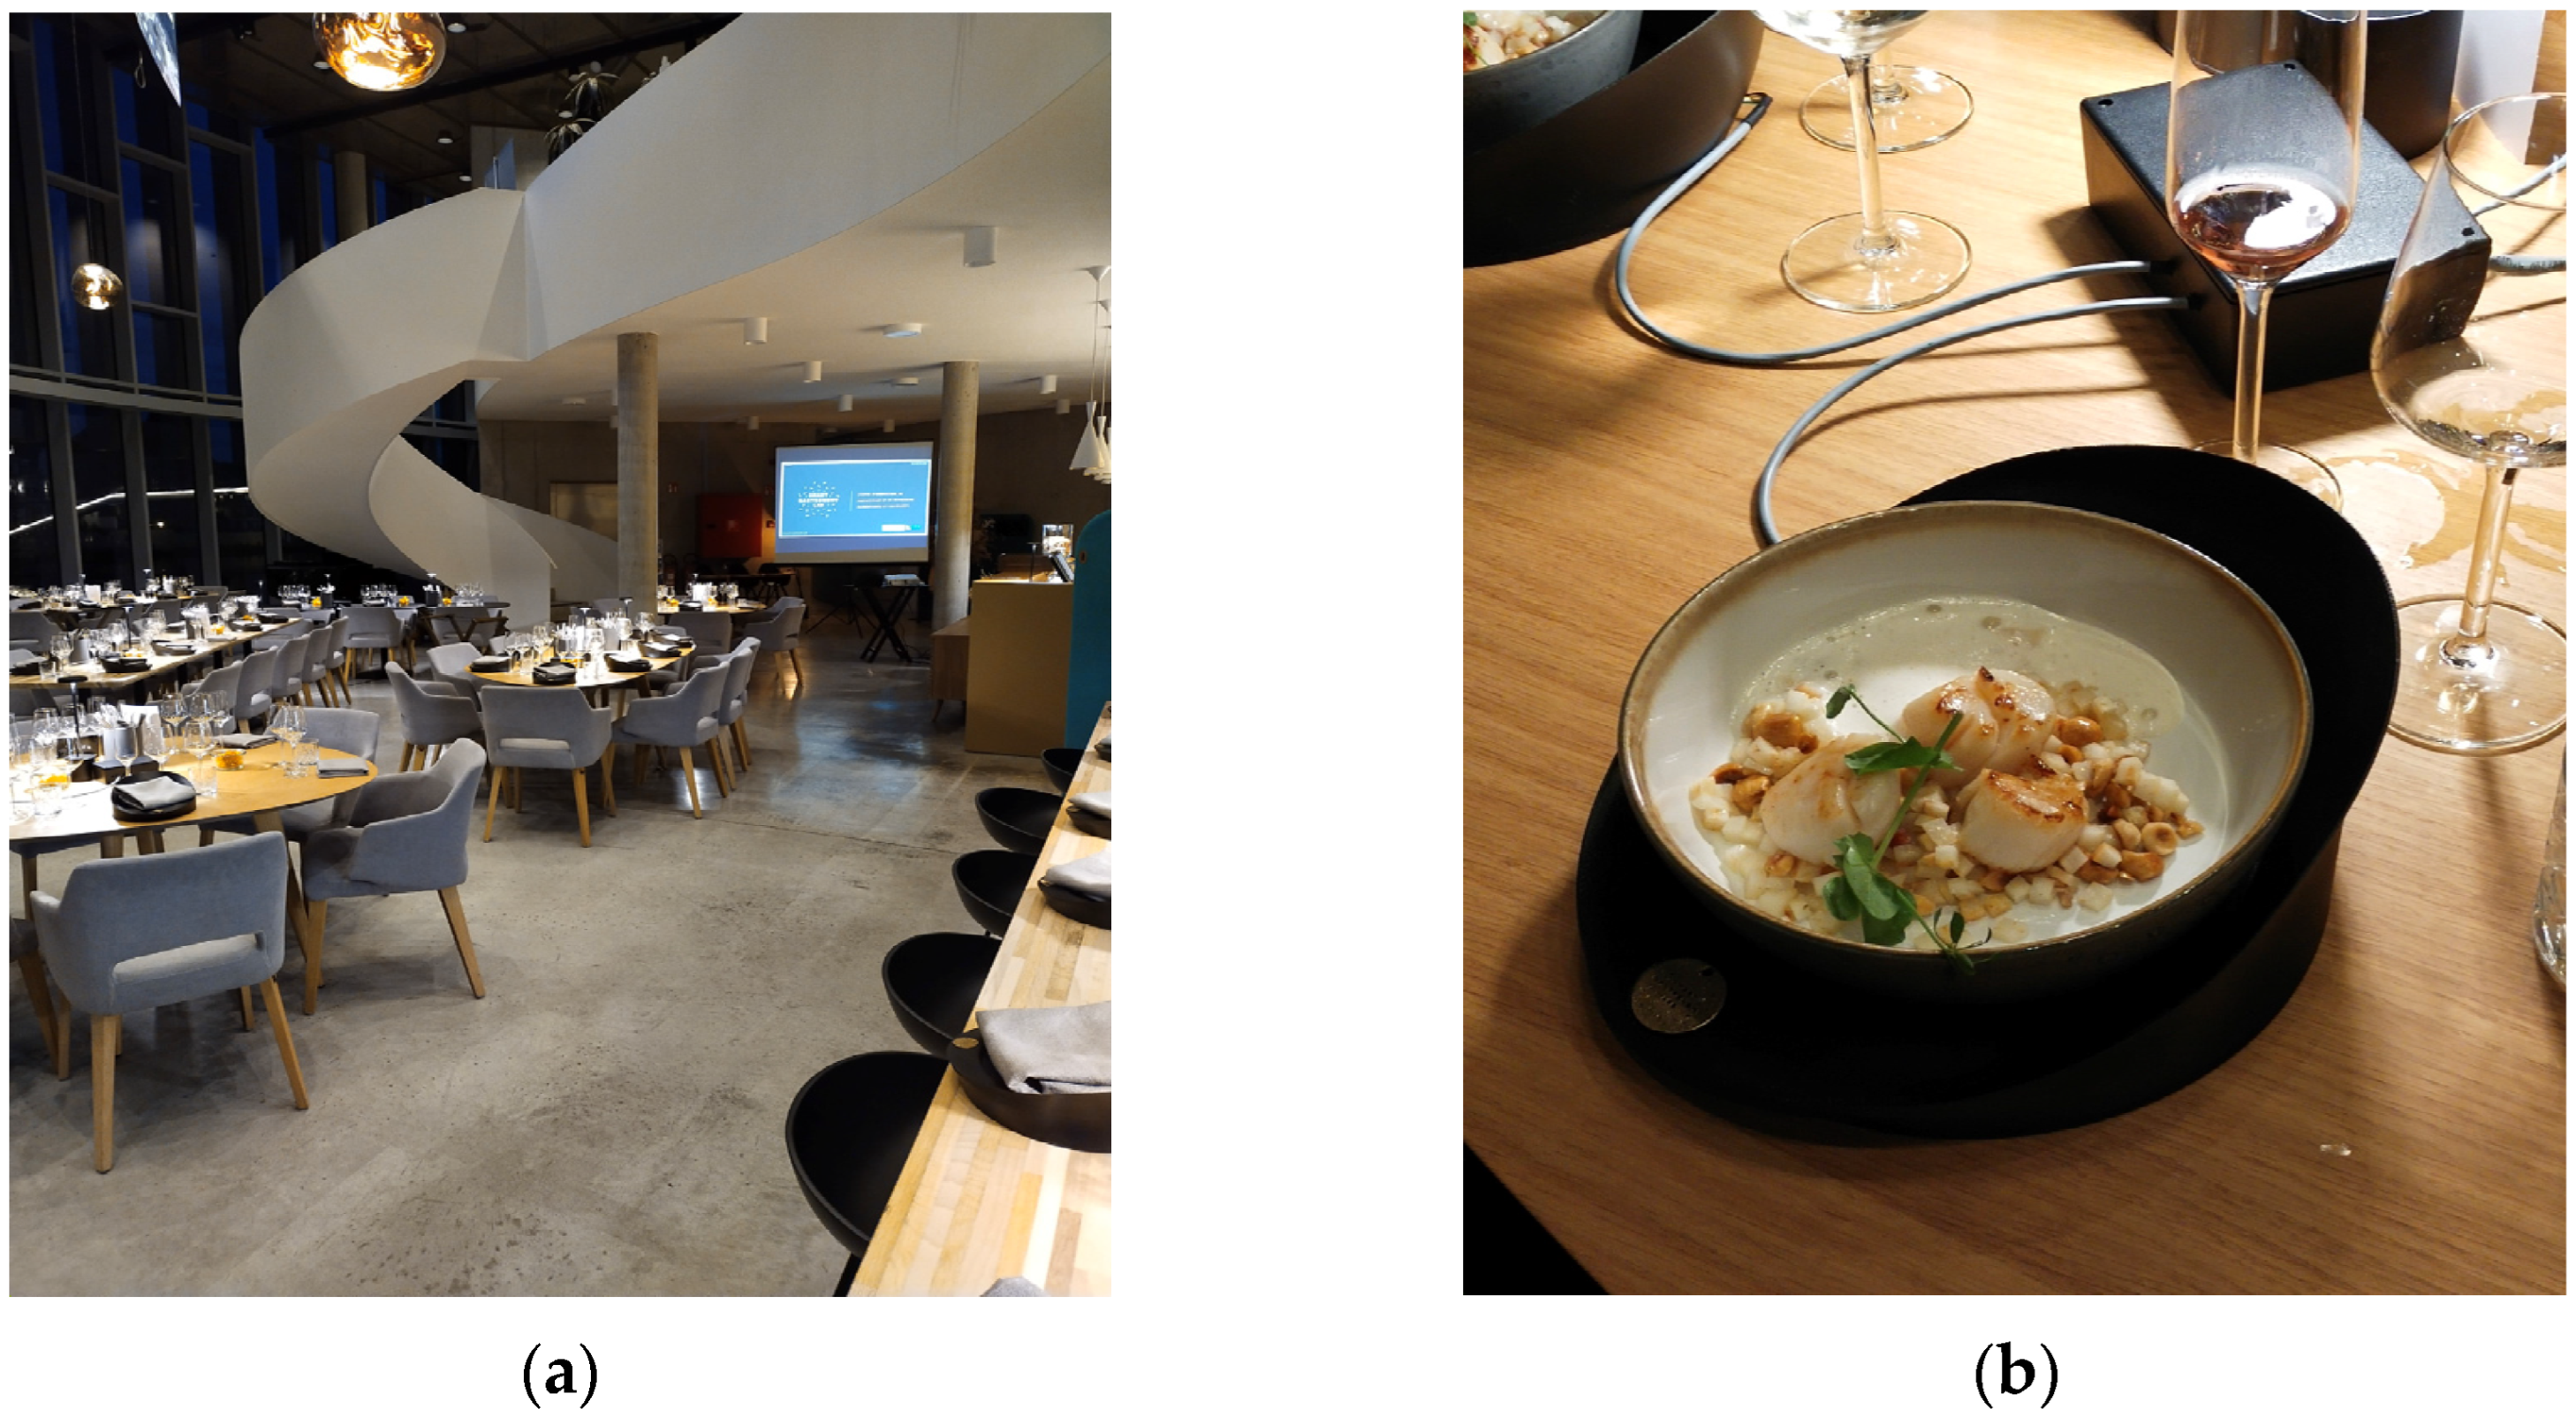
Figure 1. (a) The dining room of La Confluence, where the smart trays were used; (b) the scallop dish placed on the smart tray.
Gastronomy 03 00009 g001
Figure 2. Evolution of plate weight over time for participant 28: red bands represent activity leading to a bite, gray bands represent non-bite activity.
Gastronomy 03 00009 g002
Figure 3. PCA biplot with colorization according to groups from AHC with 95% confidence ellipses.
Gastronomy 03 00009 g003
Figure 4. Boxplots of (a) total meal duration (s), (b) number of bites, (c) activity ratio (%), (d) average work (N.s), and (e) average time interval between each bite (s) across clusters. Letters indicate the results of the Tukey test following an ANOVA (p-value < 0.05), where groups sharing the same letter are not significantly different, while those with different letters are significantly different.
Gastronomy 03 00009 g004aGastronomy 03 00009 g004b
Figure 5. Evolution of plate weight over time for participant 3: red bands represent activity leading to a bite, gray bands represent non-bite activity, black arrows represent depositing of cutlery on plate.
Gastronomy 03 00009 g005
Table 1. Individual metrics for participant n°28.
ParticipantTotal Meal Duration (s)Total Activity Duration (s)Weight Consumed (g)Bites
Number 28316.1162.511713
Table 2. Individual meal varying metrics for participant n°28.
Bite Weight (g)Time Interval Between
Each Bite (s)
Activity Period
Duration (s)
Work (N.s)
Minimum3.03.13.120.1
Maximum22.076.924.6178.6
Mean8.914.69.671.9
Median8.06.29.164.0
Standard deviation5.220.75.843.6
Table 3. Summary of studied meal metrics for 39 individuals.
Total Meal Duration (s)Activity Ratio (%)Number of BitesAverage Time Interval Between Each Bite (s)Average Work (N.s)
Minimum203.82367.224.1
Maximum837.179.72450.6151.8
Mean399.651.114.318.777.5
Median374.151.41416.176.2
Standard deviation132.714.13.99.322.2
Table 4. Comparison of existing weighing sensors: strengths, limitations, and contributions of the proposed device.
ReferenceDevice
Description
MethodType of StudyVideo
Annotation
Accuracy/Error in
Portion Size
ProsCons
[5]Smart tablecloth (equipped with a fine-grained pressure textile matrix and a weight-sensitive tablet)5 individuals consumed 8 meals each, 4 main dishes and 2 side dishesField studyYesError ratio of 16.62% (calculated as error root mean square to signal span)Tablecloth offers high spatial resolution Depends on certain actions carried out using western cutlery (spoons, forks, knives)
[6]Table-embedded scaleMeals consumed by 271 participantsLab studyYesCorrectly detected and weighed approximately 39% of bitesDetects location of bites and measures weight of individual bites consumed during unrestricted eating, as well as detecting drink bites Errors due to multiple bites taken without scale interaction, actions taken too quickly for scale to stabilize, and interactions with non-food items
[7]Portable smart plate consisting of three load cells2 mealsLab and field studyYesAverage error (mean ± standard deviation) of 8 ± 8% in portion size weightDetects location of bites and estimates number of calories without external sensorsData captured in controlled environment, limitations on cutlery
[8]Mandometer113 mealsField studyYesError of 24 g for total meal weightFacilitates large-scale studies of eating behavior, including a variety of foodsDetects one large bite that corresponds to two smaller ground-truth bites
*Portable smart tray consisting of a single weight sensor1 meal,
60 participants
Field studyNoUndetermined in field study; 97% accuracy in lab conditions Wide range of calculated variables linked to activity and bites; better understanding of group’s eating behavior; promising differentiation of activity periodsWeight sensor drift, overestimation of bites
* Corresponds to the device presented in this article.
Disclaimer/Publisher’s Note: The statements, opinions and data contained in all publications are solely those of the individual author(s) and contributor(s) and not of MDPI and/or the editor(s). MDPI and/or the editor(s) disclaim responsibility for any injury to people or property resulting from any ideas, methods, instructions or products referred to in the content.