
A Sensor-Enabled Smart Tray for Understanding Consumer Eating Behavior in a Restaurant

 , , ,
, , ,
Abstract
1. Introduction
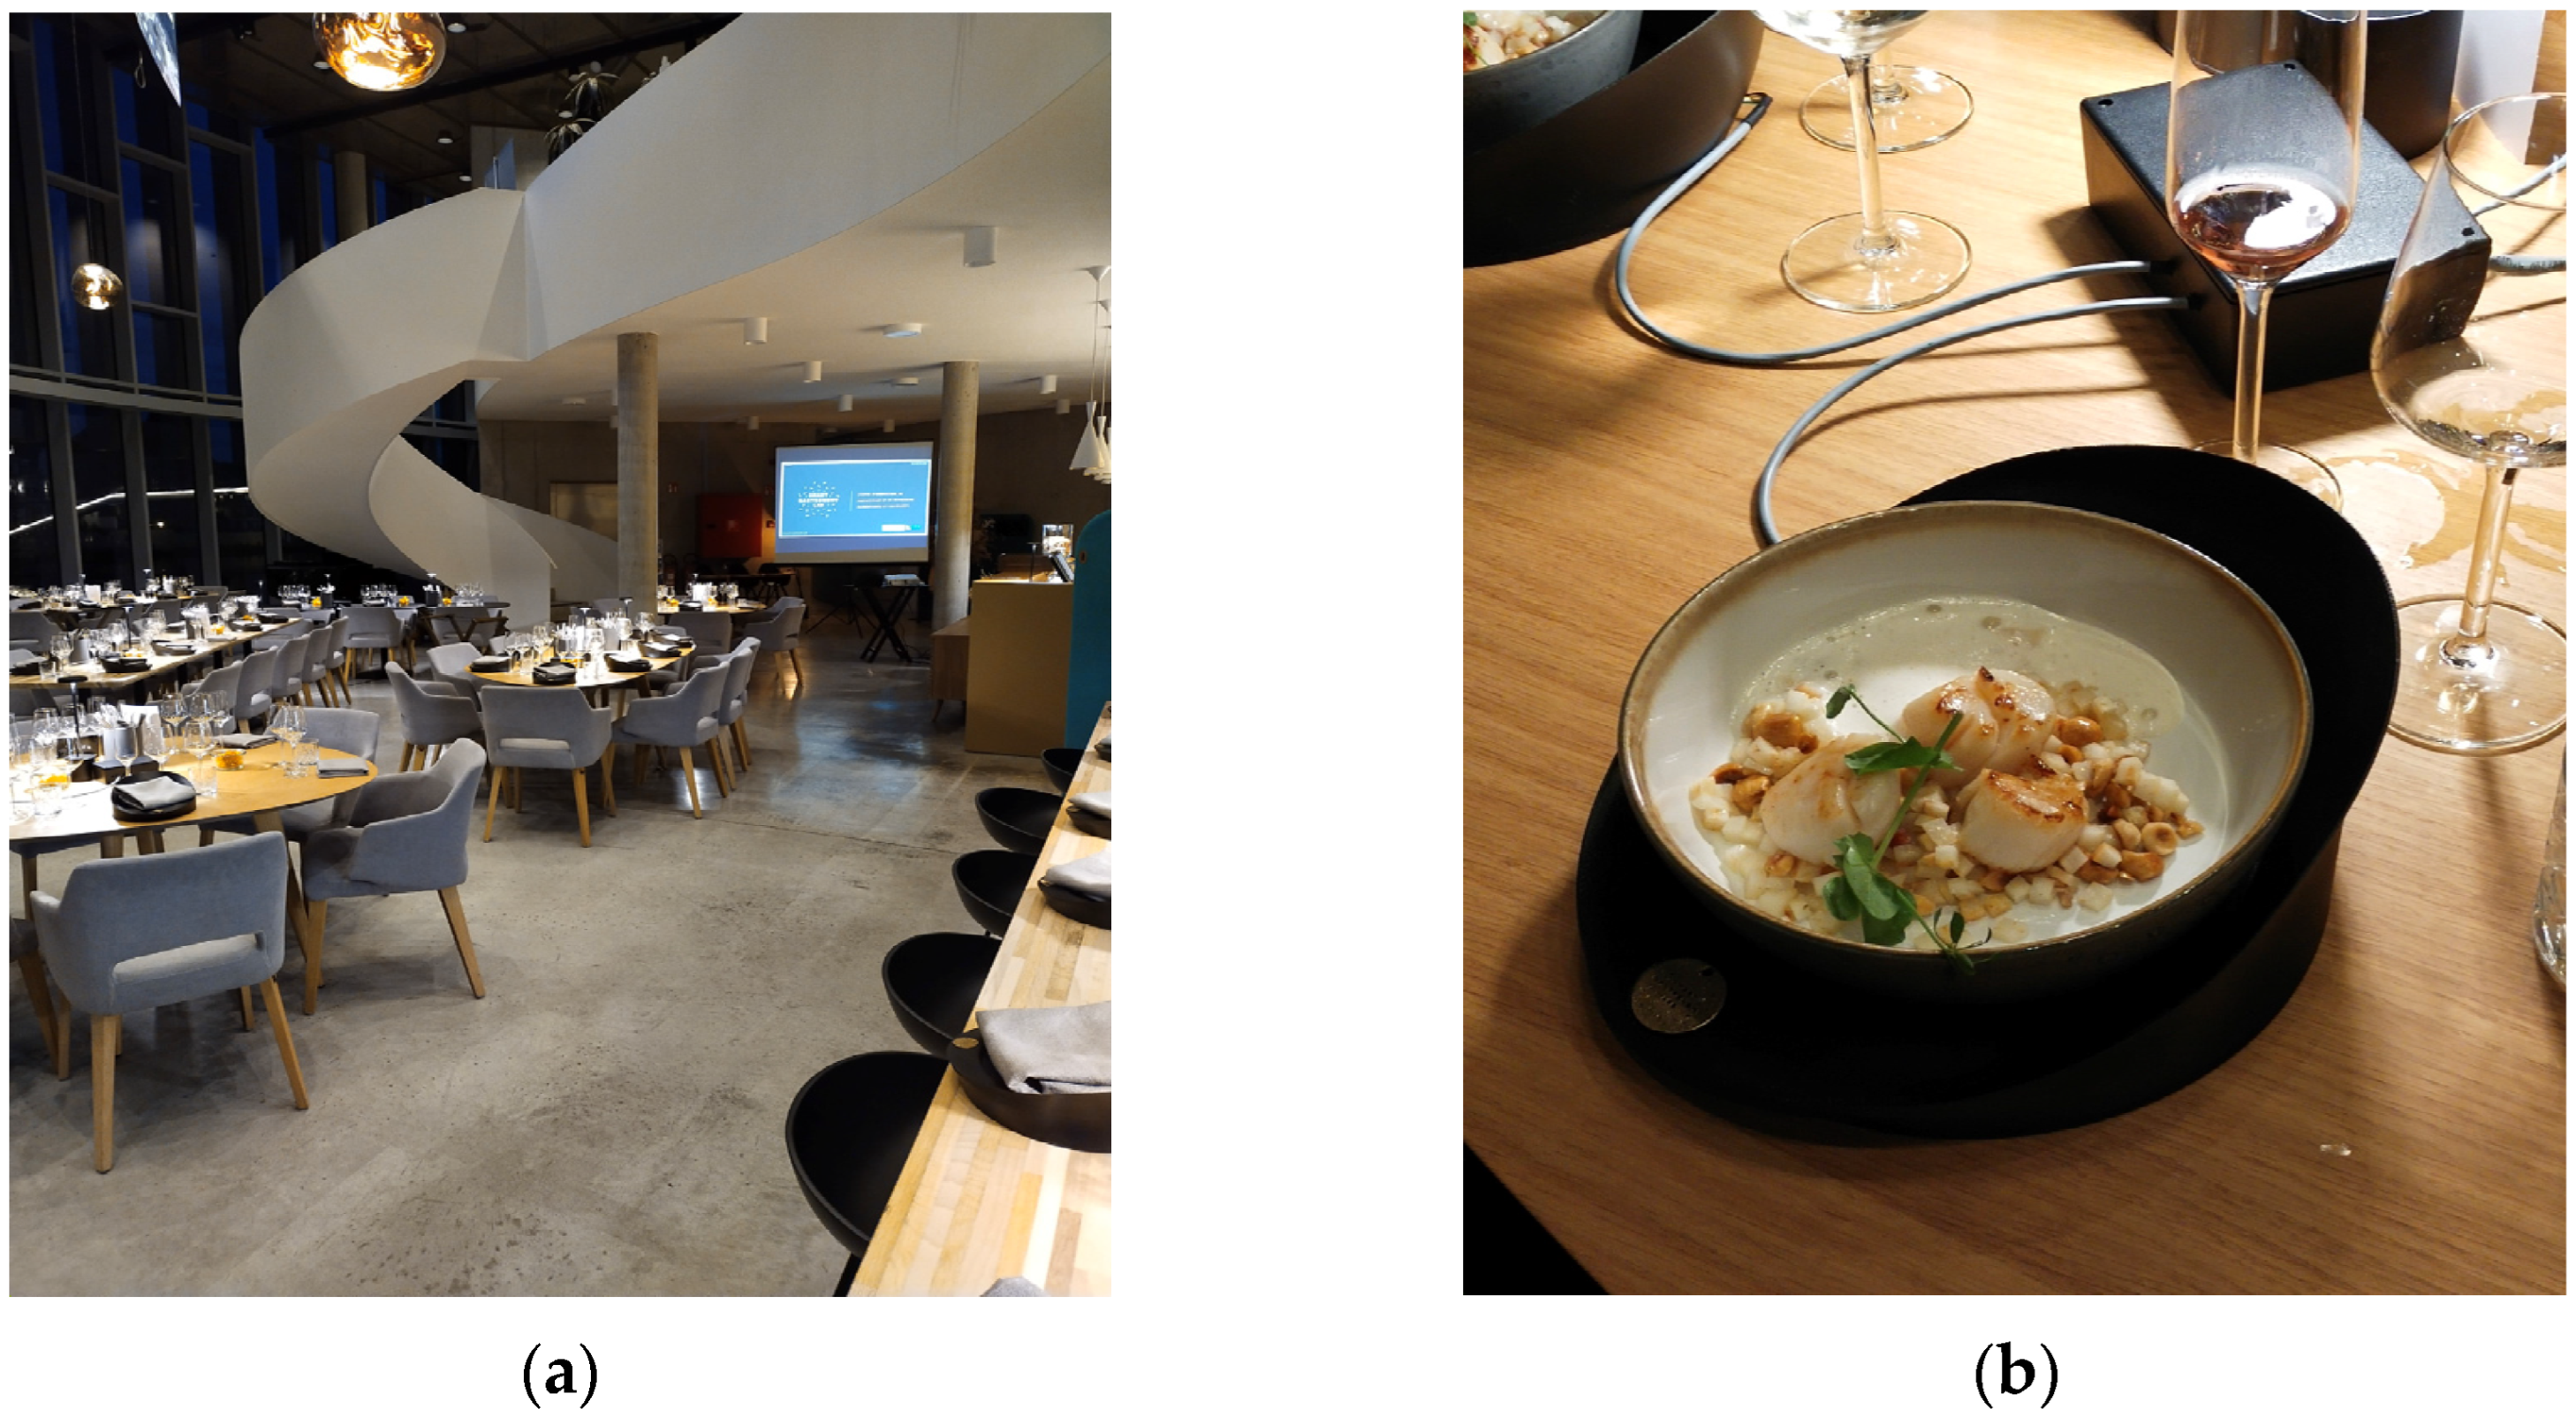
2. Materials and Methods
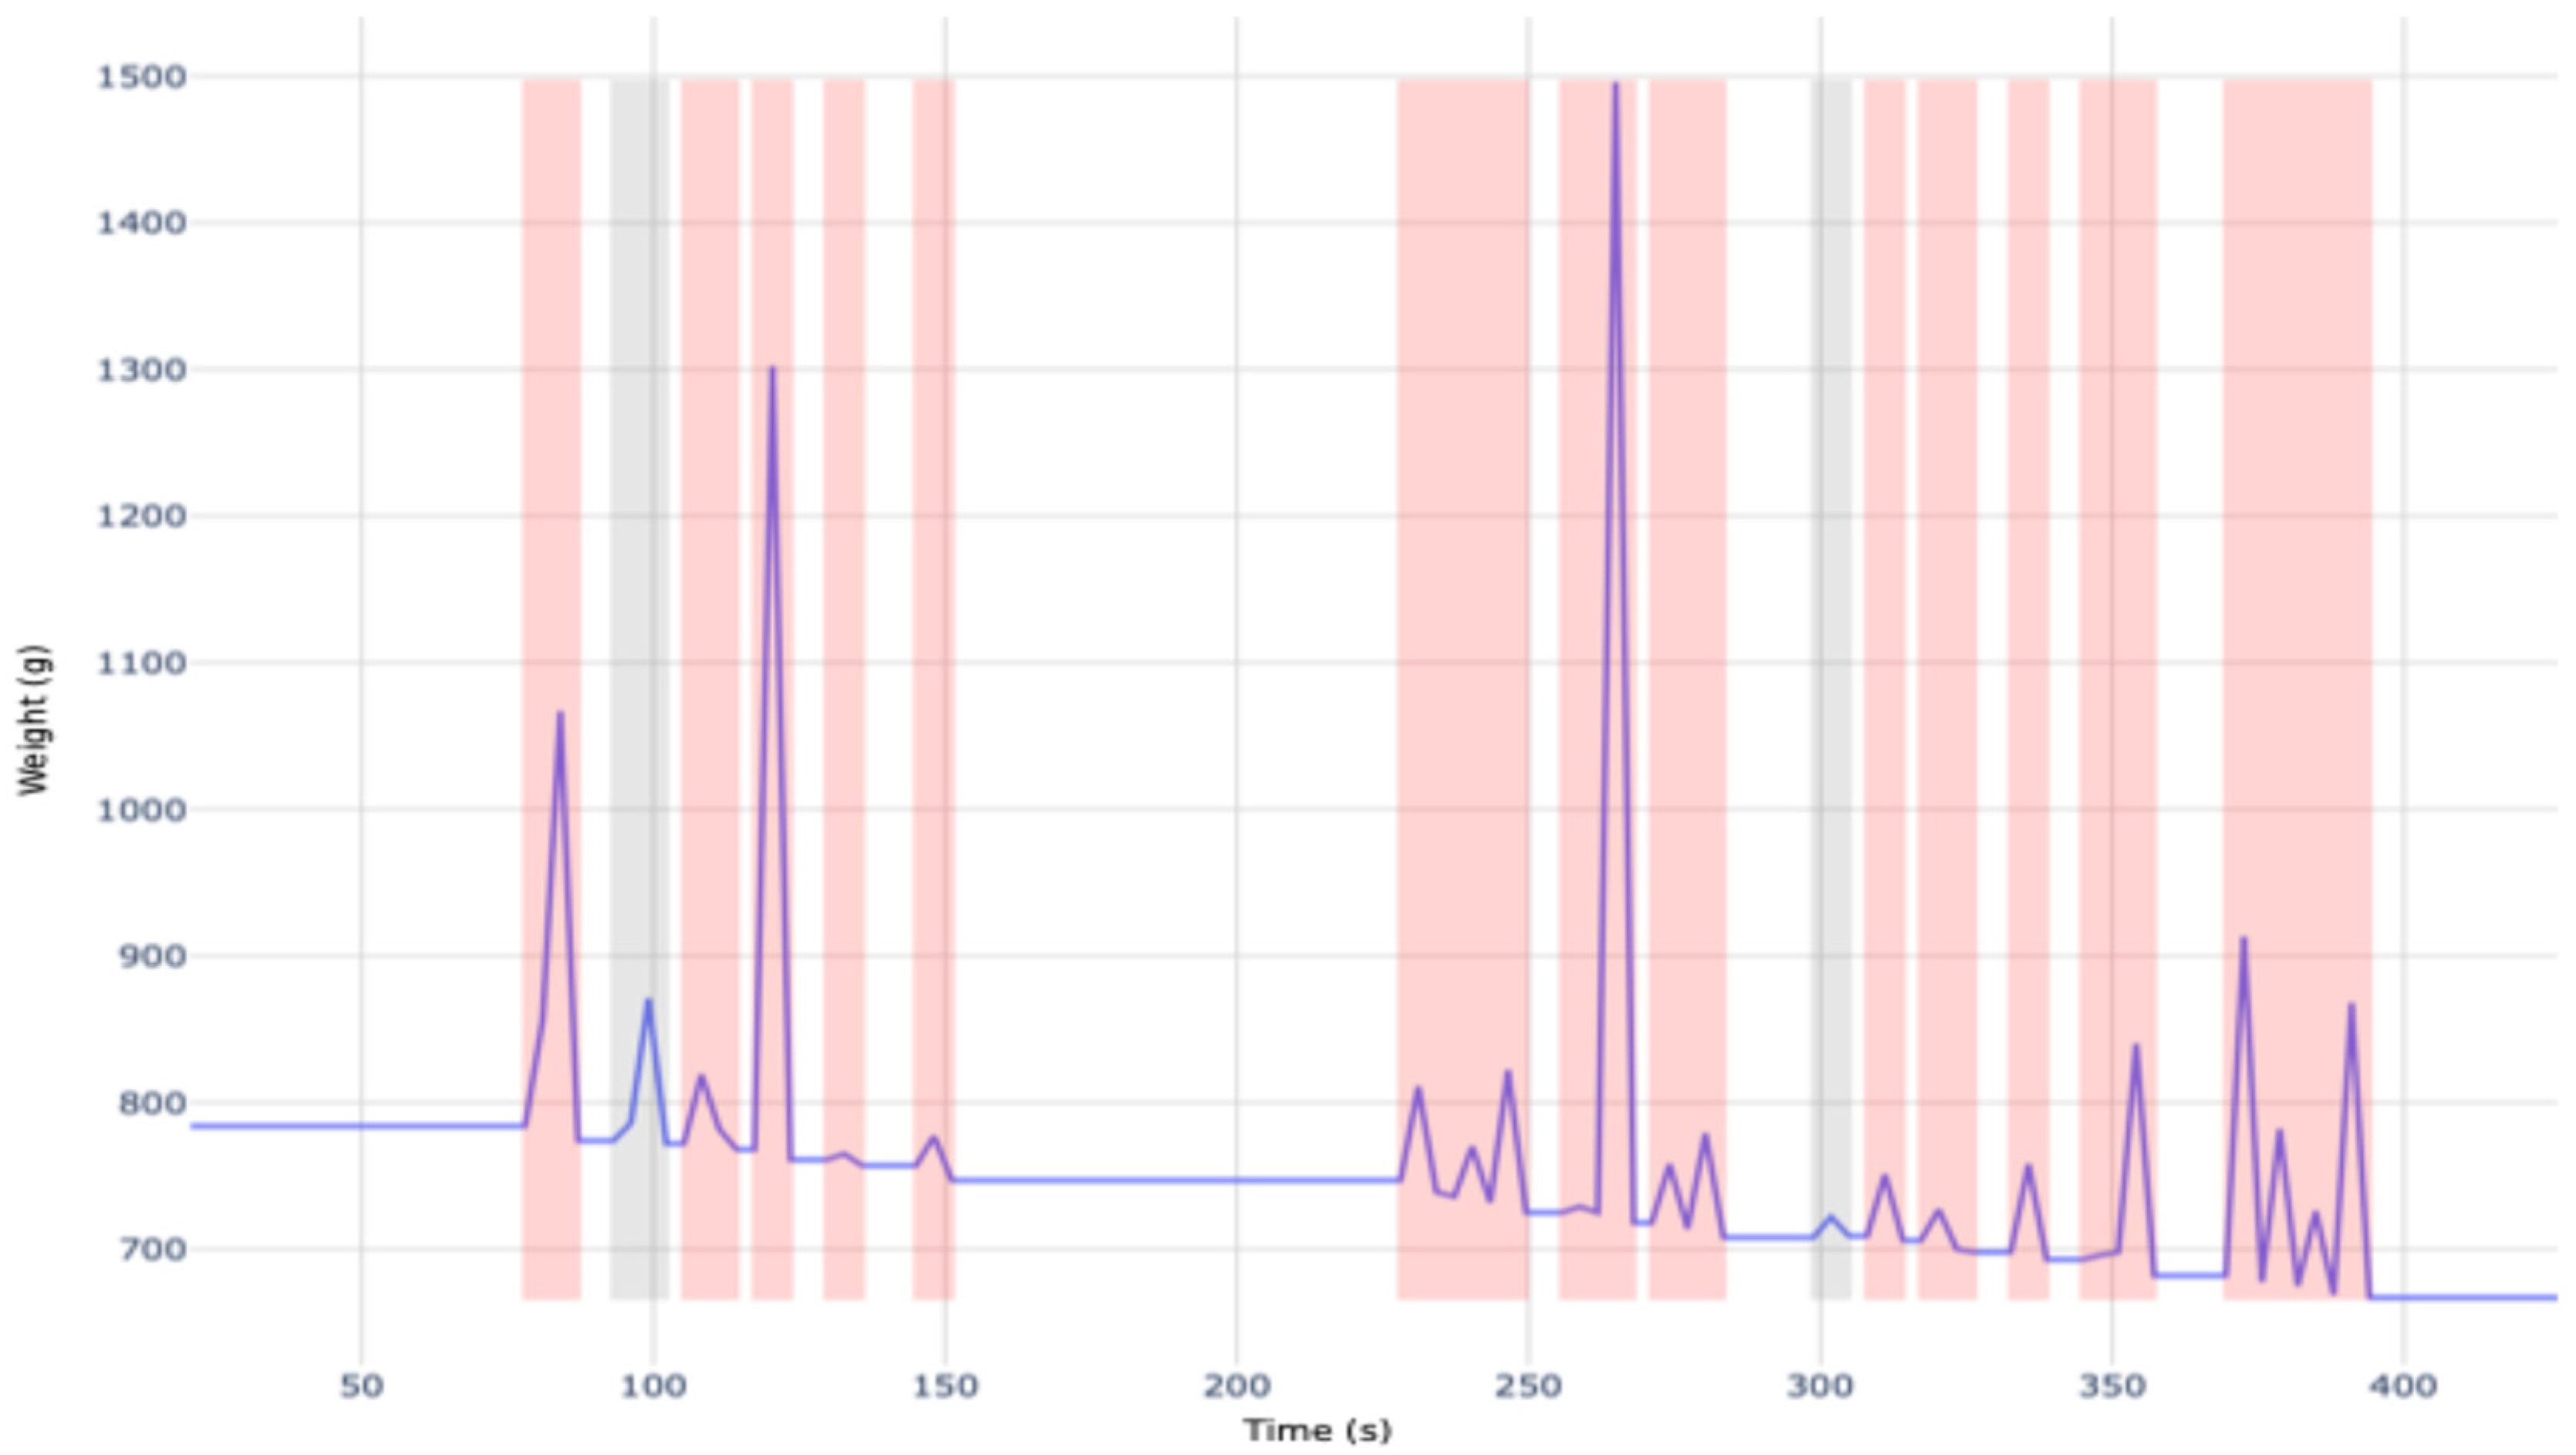
- Total meal duration (s): The time elapsed between the first and last detected action considered as a bite.
- Activity period duration (s): The cumulative duration of all detected activity zones.
- Weight consumed (g): The difference between the weight recorded before the first bite and the weight after the last bite.
- Number of bites (-): The total number of detected actions identified as bites.
- Bite weight (g): The weight difference between the beginning and end of each action identified as a bite.
- Time interval between bites (s): The time difference between two consecutive actions considered as bites.
- Work during action periods (N.s): The area under the curve for each activity zone, representing the intensity of an action.
- Differentiation of action periods (with/without bite) and their duration (s): Classification of activity zones based on whether they result in a bite. An action is classified as a bite when the weight recorded before the action is greater than the weight recorded after the action. The duration of each type of activity period (with or without bite) is then calculated accordingly.
3. Results
3.1. Analysis of Individual Eating Behaviors
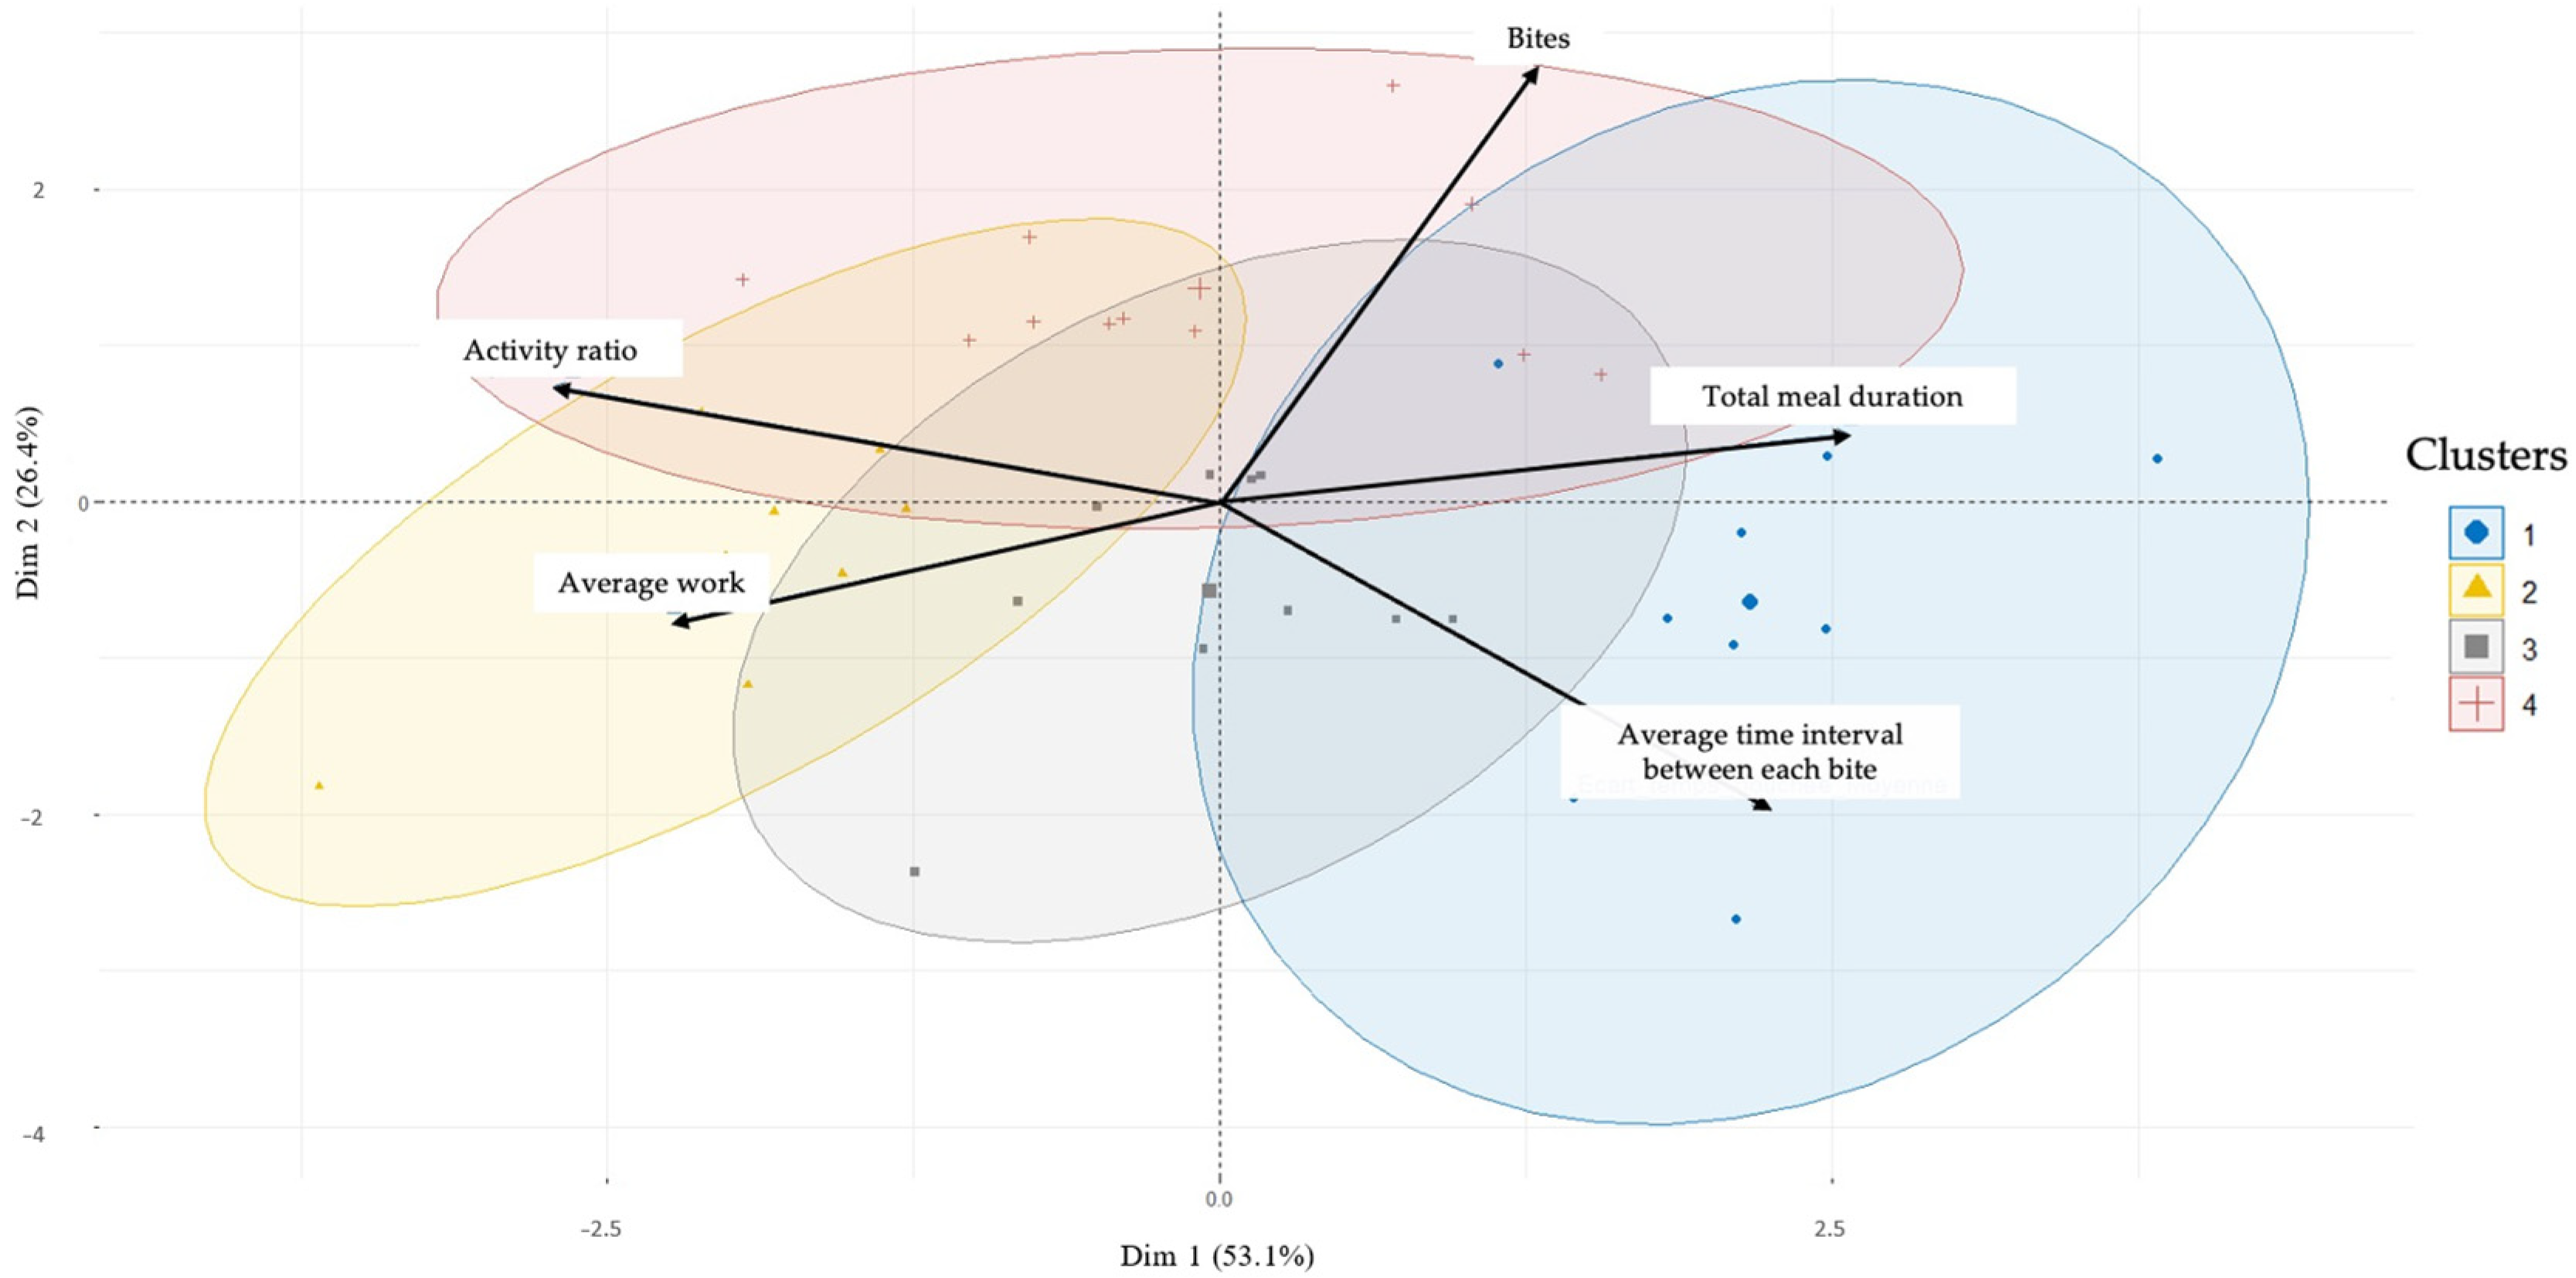
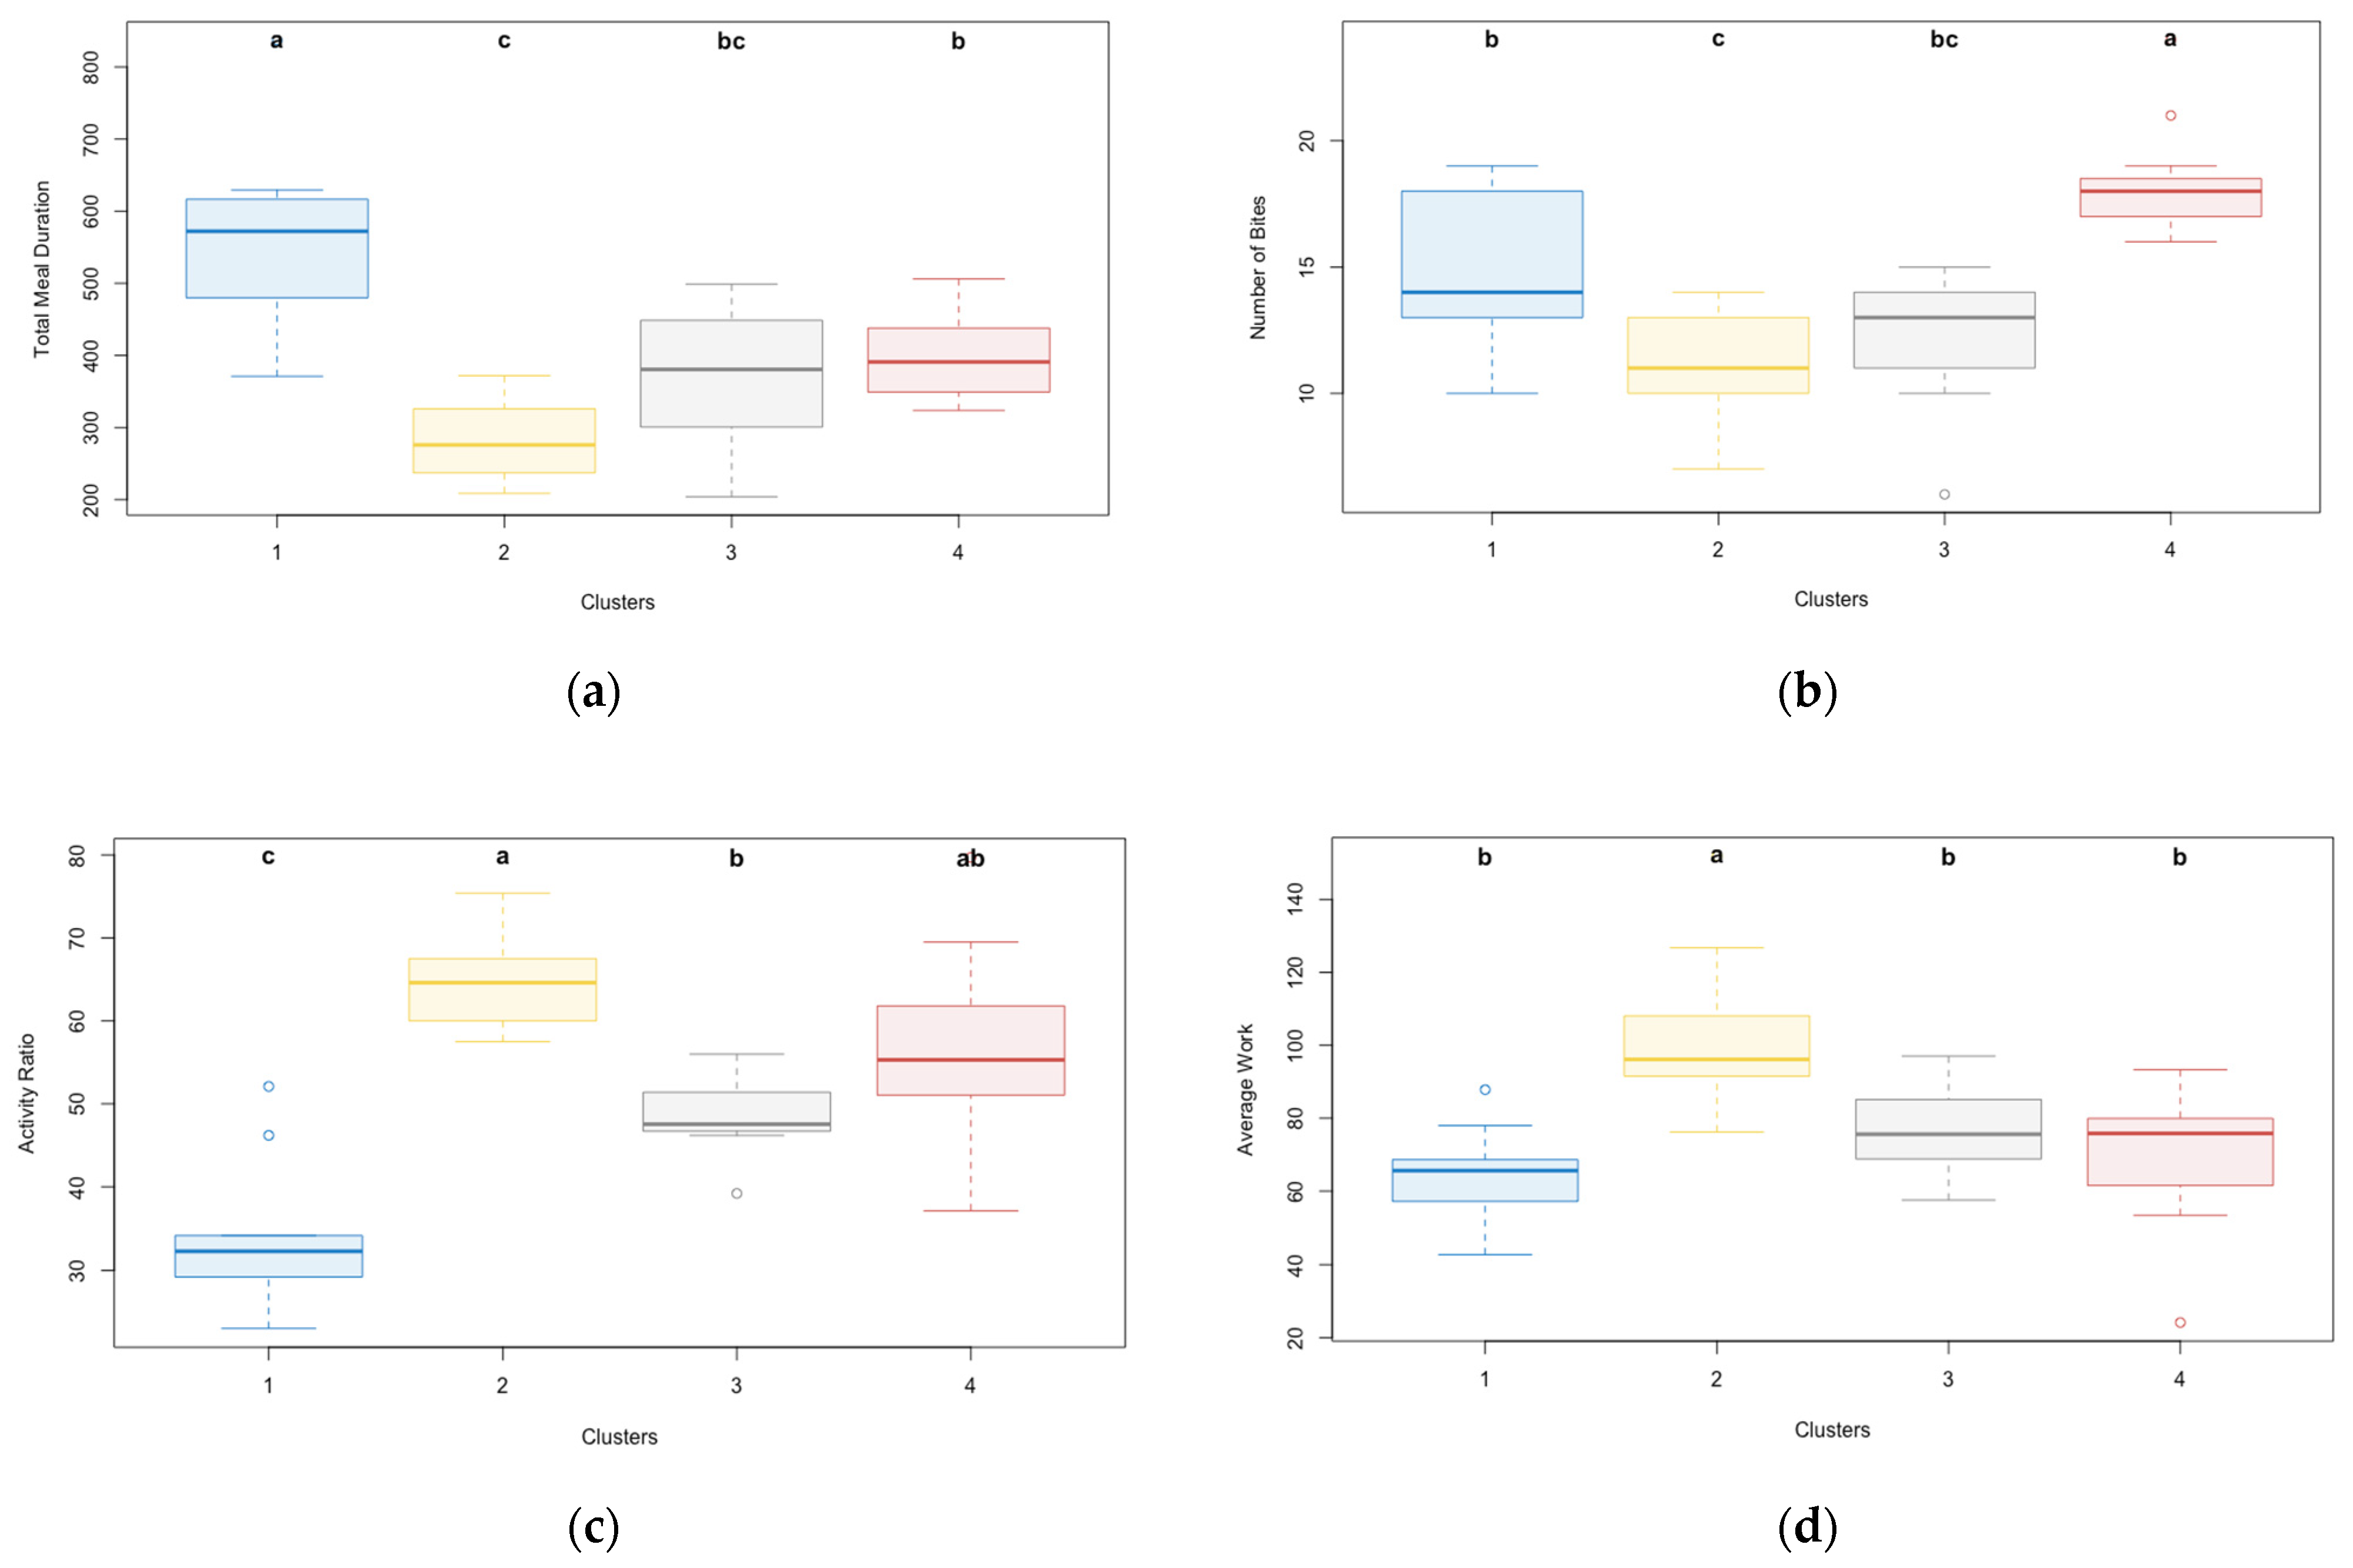
3.2. Characterization of Group Eating Behaviors
- Total meal duration (s);
- Activity ratio (%) 1;
- Number of bites;
- Average time interval between each bite (s);
- Average work (N.s) 2.
4. Discussion
5. Conclusions
Author Contributions
Funding
Institutional Review Board Statement
Informed Consent Statement
Data Availability Statement
Acknowledgments
Conflicts of Interest
Appendix A

| Total Meal Duration (s) | Activity Period Duration (s) | Weight Consumed (g) | Bites | Average Bite Weight (g) * | Time Interval Between Bites (s) | Average Action Period with Bite (s) * | Average Action Period Without Bite (s) * | Maximum Force Applied (N) | Average Work (N.s) * | |
|---|---|---|---|---|---|---|---|---|---|---|
| Minimum | 203.8 | 92.8 | 97.0 | 6 | 5.4 | 7.2 | 6.6 | 3.1 | 318.0 | 24.1 |
| Maximum | 837.1 | 327.8 | 191.0 | 24 | 47.7 | 50.6 | 20.3 | 18.3 | 3538.0 | 151.8 |
| Mean | 399.6 | 194.4 | 127.4 | 14.3 | 14.1 | 18.7 | 11.5 | 8.4 | 942.6 | 77.5 |
| Median | 374.1 | 184.5 | 126.0 | 14.0 | 10.8 | 16.1 | 10.9 | 8.0 | 859.0 | 76.2 |
| Standard deviation | 132.7 | 56.6 | 17.3 | 3.9 | 9.3 | 9.3 | 2.9 | 3.1 | 633.8 | 22.2 |
References
- Burke, L.E.; Warziski, M.; Starrett, T.; Choo, J.; Music, E.; Sereika, S.; Stark, S.; Sevick, M.A. Self-Monitoring Dietary Intake: Current and Future Practices. J. Ren. Nutr. 2005, 15, 281–290. [Google Scholar] [CrossRef] [PubMed]
- Guigoz, Y. The Mini Nutritional Assessment (MNA) review of the literature—What does it tell us? J. Nutr. Health Aging 2006, 10, 466–485; discussion 485–487. [Google Scholar] [PubMed]
- Hugonot-Diener, L. Présentation du MNA ou Mini Nutritional Assessment. Gérontol. Soc. 2010, 33, 133–141. [Google Scholar] [CrossRef]
- Raju, V.B.; Sazonov, E. A Systematic Review of Sensor-Based Methodologies for Food Portion Size Estimation. IEEE Sens. J. 2021, 21, 12882–12899. [Google Scholar] [CrossRef]
- Zhou, B.; Cheng, J.; Sundholm, M.; Reiss, A.; Huang, W.; Amft, O.; Lukowicz, P. Smart table surface: A novel approach to pervasive dining monitoring. In Proceedings of the 2015 IEEE International Conference on Pervasive Computing and Communications (PerCom), St. Louis, MO, USA, 23–27 March 2015; pp. 155–162. [Google Scholar]
- Mattfeld, R.S.; Muth, E.R.; Hoover, A. Measuring the Consumption of Individual Solid and Liquid Bites Using a Table-Embedded Scale During Unrestricted Eating. IEEE J. Biomed. Health Inform. 2017, 21, 1711–1718. [Google Scholar] [CrossRef] [PubMed]
- Mertes, G.; Christiaensen, G.; Hallez, H.; Verslype, S.; Chen, W.; Vanrumste, B. Measuring weight and location of individual bites using a sensor augmented smart plate. In Proceedings of the 2018 40th Annual International Conference of the IEEE Engineering in Medicine and Biology Society (EMBC), Honolulu, HI, USA, 17–21 July 2018; pp. 5558–5561. [Google Scholar]
- Papapanagiotou, V.; Diou, C.; Ioakimidis, I.; Sodersten, P.; Delopoulos, A. Automatic Analysis of Food Intake and Meal Microstructure Based on Continuous Weight Measurements. IEEE J. Biomed. Health Inform. 2019, 23, 893–902. [Google Scholar] [CrossRef] [PubMed]
- Bellisle, F. L’environnement du mangeur affecte sa consommation alimentaire: Des effets sous-estimés. Méd. Nutr. 2008, 44, 9–15. [Google Scholar] [CrossRef]
- Wansink, B.; van Ittersum, K. Fast food restaurant lighting and music can reduce calorie intake and increase satisfaction. Psychol. Rep. 2012, 111, 228–232. [Google Scholar] [CrossRef] [PubMed]
- Weber, A.J.; King, S.C.; Meiselman, H.L. Effects of social interaction, physical environment and food choice freedom on consumption in a meal-testing environment. Appetite 2004, 42, 115–118. [Google Scholar] [CrossRef] [PubMed]
- Stroebele, N.; De Castro, J.M. Effect of ambience on food intake and food choice. Nutr. Burbank Los Angel. Cty. Calif 2004, 20, 821–838. [Google Scholar] [CrossRef] [PubMed]
- Brindal, E.; Wilson, C.; Mohr, P.; Wittert, G. Eating in groups: Do multiple social influences affect intake in a fast-food restaurant? J. Health Psychol. 2015, 20, 483–489. [Google Scholar] [CrossRef] [PubMed]
- Stien, É. L’impact de la Culture Sur le Comportement de Consommation: Modélisation d’un Comportement de Consommation Éthique Ethnique. Ph.D. Thesis, Université d’Artois, Arras, France, 2012. [Google Scholar]
- Cruz-Jentoft, A.J.; Baeyens, J.P.; Bauer, J.M.; Boirie, Y.; Cederholm, T.; Landi, F.; Martin, F.C.; Michel, J.-P.; Rolland, Y.; Schneider, S.M.; et al. Sarcopenia: European consensus on definition and diagnosis. Age Ageing 2010, 39, 412–423. [Google Scholar] [CrossRef] [PubMed]
- Papapanagiotou, V.; Diou, C.; van den Boer, J.; Mars, M.; Delopoulos, A. Recognition of food-texture attributes using an in-ear microphone. In Pattern Recognition. ICPR International Workshops and Challenges; Springer: Berlin/Heidelberg, Germany, 2021; Volume 12665, pp. 558–570. [Google Scholar]
- Zeanandin, G. Comment Identifier un Trouble du Comportement Alimentaire (TCA) en Consultation d’HGE? POST’U. 2024, pp. 303–312. Available online: https://www.fmcgastro.org/wp-content/uploads/2023/08/Comment-identifier-un-trouble-du-comportement-alimentaire-TCA-en-consultation-dHGE.pdf (accessed on 24 May 2025).

| Participant | Total Meal Duration (s) | Total Activity Duration (s) | Weight Consumed (g) | Bites |
|---|---|---|---|---|
| Number 28 | 316.1 | 162.5 | 117 | 13 |
| Bite Weight (g) | Time Interval Between Each Bite (s) | Activity Period Duration (s) | Work (N.s) | |
|---|---|---|---|---|
| Minimum | 3.0 | 3.1 | 3.1 | 20.1 |
| Maximum | 22.0 | 76.9 | 24.6 | 178.6 |
| Mean | 8.9 | 14.6 | 9.6 | 71.9 |
| Median | 8.0 | 6.2 | 9.1 | 64.0 |
| Standard deviation | 5.2 | 20.7 | 5.8 | 43.6 |
| Total Meal Duration (s) | Activity Ratio (%) | Number of Bites | Average Time Interval Between Each Bite (s) | Average Work (N.s) | |
|---|---|---|---|---|---|
| Minimum | 203.8 | 23 | 6 | 7.2 | 24.1 |
| Maximum | 837.1 | 79.7 | 24 | 50.6 | 151.8 |
| Mean | 399.6 | 51.1 | 14.3 | 18.7 | 77.5 |
| Median | 374.1 | 51.4 | 14 | 16.1 | 76.2 |
| Standard deviation | 132.7 | 14.1 | 3.9 | 9.3 | 22.2 |
| Reference | Device Description | Method | Type of Study | Video Annotation | Accuracy/Error in Portion Size | Pros | Cons |
|---|---|---|---|---|---|---|---|
| [5] | Smart tablecloth (equipped with a fine-grained pressure textile matrix and a weight-sensitive tablet) | 5 individuals consumed 8 meals each, 4 main dishes and 2 side dishes | Field study | Yes | Error ratio of 16.62% (calculated as error root mean square to signal span) | Tablecloth offers high spatial resolution | Depends on certain actions carried out using western cutlery (spoons, forks, knives) |
| [6] | Table-embedded scale | Meals consumed by 271 participants | Lab study | Yes | Correctly detected and weighed approximately 39% of bites | Detects location of bites and measures weight of individual bites consumed during unrestricted eating, as well as detecting drink bites | Errors due to multiple bites taken without scale interaction, actions taken too quickly for scale to stabilize, and interactions with non-food items |
| [7] | Portable smart plate consisting of three load cells | 2 meals | Lab and field study | Yes | Average error (mean ± standard deviation) of 8 ± 8% in portion size weight | Detects location of bites and estimates number of calories without external sensors | Data captured in controlled environment, limitations on cutlery |
| [8] | Mandometer | 113 meals | Field study | Yes | Error of 24 g for total meal weight | Facilitates large-scale studies of eating behavior, including a variety of foods | Detects one large bite that corresponds to two smaller ground-truth bites |
| * | Portable smart tray consisting of a single weight sensor | 1 meal, 60 participants | Field study | No | Undetermined in field study; 97% accuracy in lab conditions | Wide range of calculated variables linked to activity and bites; better understanding of group’s eating behavior; promising differentiation of activity periods | Weight sensor drift, overestimation of bites |
Disclaimer/Publisher’s Note: The statements, opinions and data contained in all publications are solely those of the individual author(s) and contributor(s) and not of MDPI and/or the editor(s). MDPI and/or the editor(s) disclaim responsibility for any injury to people or property resulting from any ideas, methods, instructions or products referred to in the content. |
© 2025 by the authors. Licensee MDPI, Basel, Switzerland. This article is an open access article distributed under the terms and conditions of the Creative Commons Attribution (CC BY) license (https://creativecommons.org/licenses/by/4.0/).
Share and Cite
Baugier, B.; Boreux, C.; Jaeger, S.D.; Codutti, N.; Barbet, F.-X.; Barbaut, A.; Joomun, U.; Rajan, S.J.G.; Goffin, D.; Haubruge, E. A Sensor-Enabled Smart Tray for Understanding Consumer Eating Behavior in a Restaurant. Gastronomy 2025, 3, 9. https://doi.org/10.3390/gastronomy3020009
Baugier B, Boreux C, Jaeger SD, Codutti N, Barbet F-X, Barbaut A, Joomun U, Rajan SJG, Goffin D, Haubruge E. A Sensor-Enabled Smart Tray for Understanding Consumer Eating Behavior in a Restaurant. Gastronomy. 2025; 3(2):9. https://doi.org/10.3390/gastronomy3020009
Chicago/Turabian StyleBaugier, Benjamin, Charles Boreux, Simon De Jaeger, Nathan Codutti, François-Xavier Barbet, Antoine Barbaut, Uzeir Joomun, Sébastien Joseph Guna Rajan, Dorothée Goffin, and Eric Haubruge. 2025. "A Sensor-Enabled Smart Tray for Understanding Consumer Eating Behavior in a Restaurant" Gastronomy 3, no. 2: 9. https://doi.org/10.3390/gastronomy3020009
APA StyleBaugier, B., Boreux, C., Jaeger, S. D., Codutti, N., Barbet, F.-X., Barbaut, A., Joomun, U., Rajan, S. J. G., Goffin, D., & Haubruge, E. (2025). A Sensor-Enabled Smart Tray for Understanding Consumer Eating Behavior in a Restaurant. Gastronomy, 3(2), 9. https://doi.org/10.3390/gastronomy3020009