1. Introduction
Given that child and adolescent health impacts not only their current and future adulthood health but the next generation, as a triple dividend of benefits, the importance of investing in their health has been well recognized by the world [
1], especially in this era of rapid aging and decreasing fertility in China. In China, there are 231.6 million children and adolescents aged 6–19 years old, and school sites are their main settings. National health strategies have emphasized helping children and adolescents achieve their potentiality and rights to health and well-being in all settings. The Outline of the Healthy China 2030 Plan issued in 2016 highlights 13 core indicators with targets for 2030, including those for children and adolescents such as injury, stunting, overweight/obesity, poor vision, oral health, and physical activity and physical fitness [
2], while the Healthy China Action (2019–2030) released in 2019 comprises 15 special actions for the whole population; of these, good/excellent physical fitness and reducing myopia in primary and secondary school students have been assigned for annual monitoring and evaluation [
3]. Both plans propose the monitoring of common diseases and the main influencing factors among students. In summary, regular data monitoring is not merely a statistical exercise, it is a compass guiding us toward healthier futures for China’s children and adolescents.
Notably, the current disease spectrum of children and adolescents in China has an epidemiological transition to predominately non-communicable diseases, and its burden has significantly increased relative to the all-cause disease burden with a considerable attribution to mental disorders [
4]. Mental well-being, social determinants, and lifestyle choices all play crucial roles. Accurately documenting these factors and estimating their changes are the first steps to developing the specific interventions to address the multifaceted needs of children and adolescents. Therefore, establishing an updated and regular monitoring system is urgently needed to help stakeholders detect early warning signs, recognize and prioritize the key issues, intervene promptly, and prevent adverse outcomes for contemporary Chinese children and adolescents [
5,
6].
To meet changing needs, and further monitor the common diseases and health risk factors affecting the health outcomes of Chinese students and their trends, strengthen the capabilities of school health staff, and promote the development of school health work in China, the Chinese National Surveillance on Students’ Common Diseases and Risk Factors (CNSSCDRF) has been conducted annually since 2016 by the National Disease Control and Prevention Administration. This overview report describes the CNSSCDRF methodology, including study design, sampling framework, information collection, and data processing and analytic methods.
2. Methods
The CNSSCDRF launches its annual plan in the first half of the year, conducts multi-level training and sampling until August, and then implements field monitoring (institutions/students) during September–November using records review, physical exams, and questionnaires.
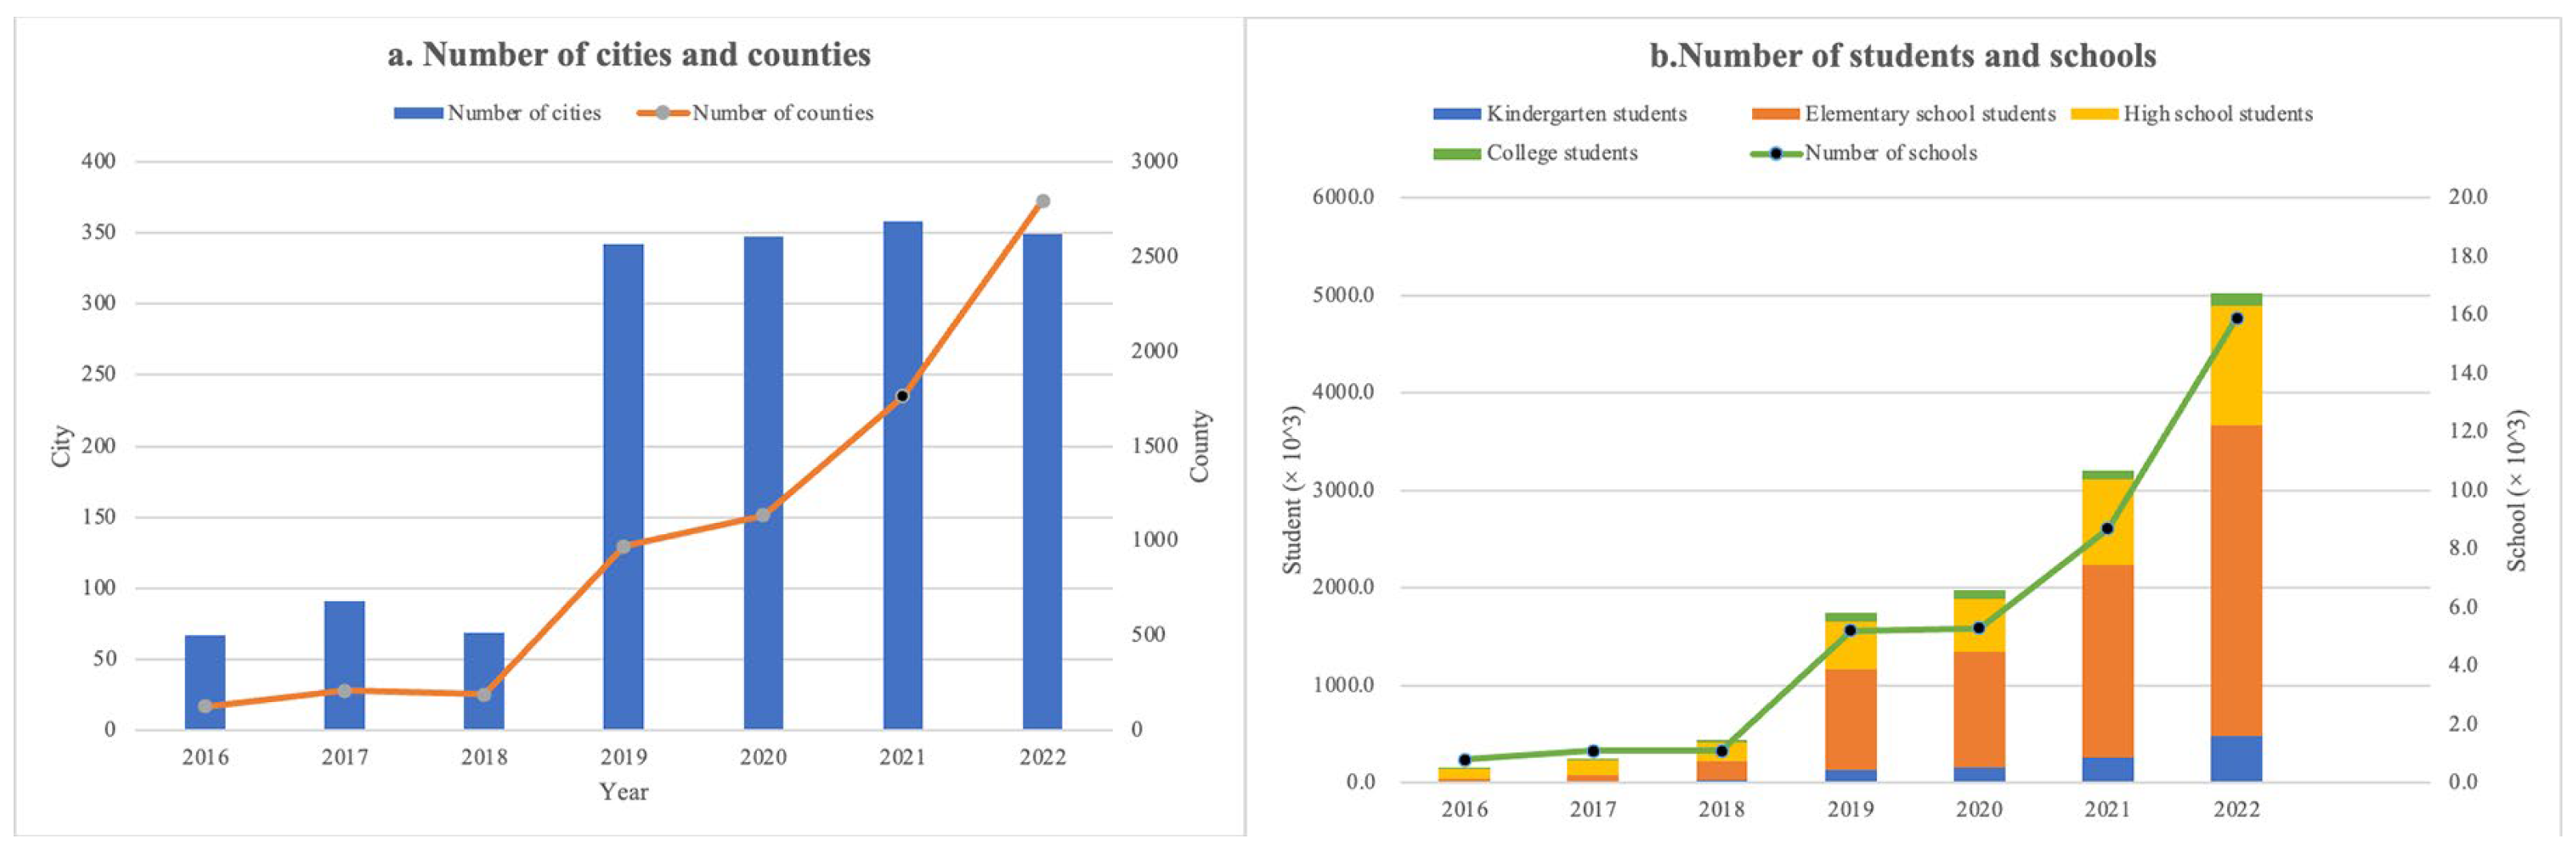
The CNSSCDRF included vision (poor vision and myopia), nutrition, blood pressure (BP), the abnormal curvature of the spine and related risk factors, and health-risk behaviors. The sampling framework covered three counties in three prefecture-level cities in each province initially, and then extended to all prefecture-level cities in each province, and currently encompasses almost all counties nationwide in 2022. The number of participants increased from approximately 253.4 thousand to more than 5 million (
Figure 1).
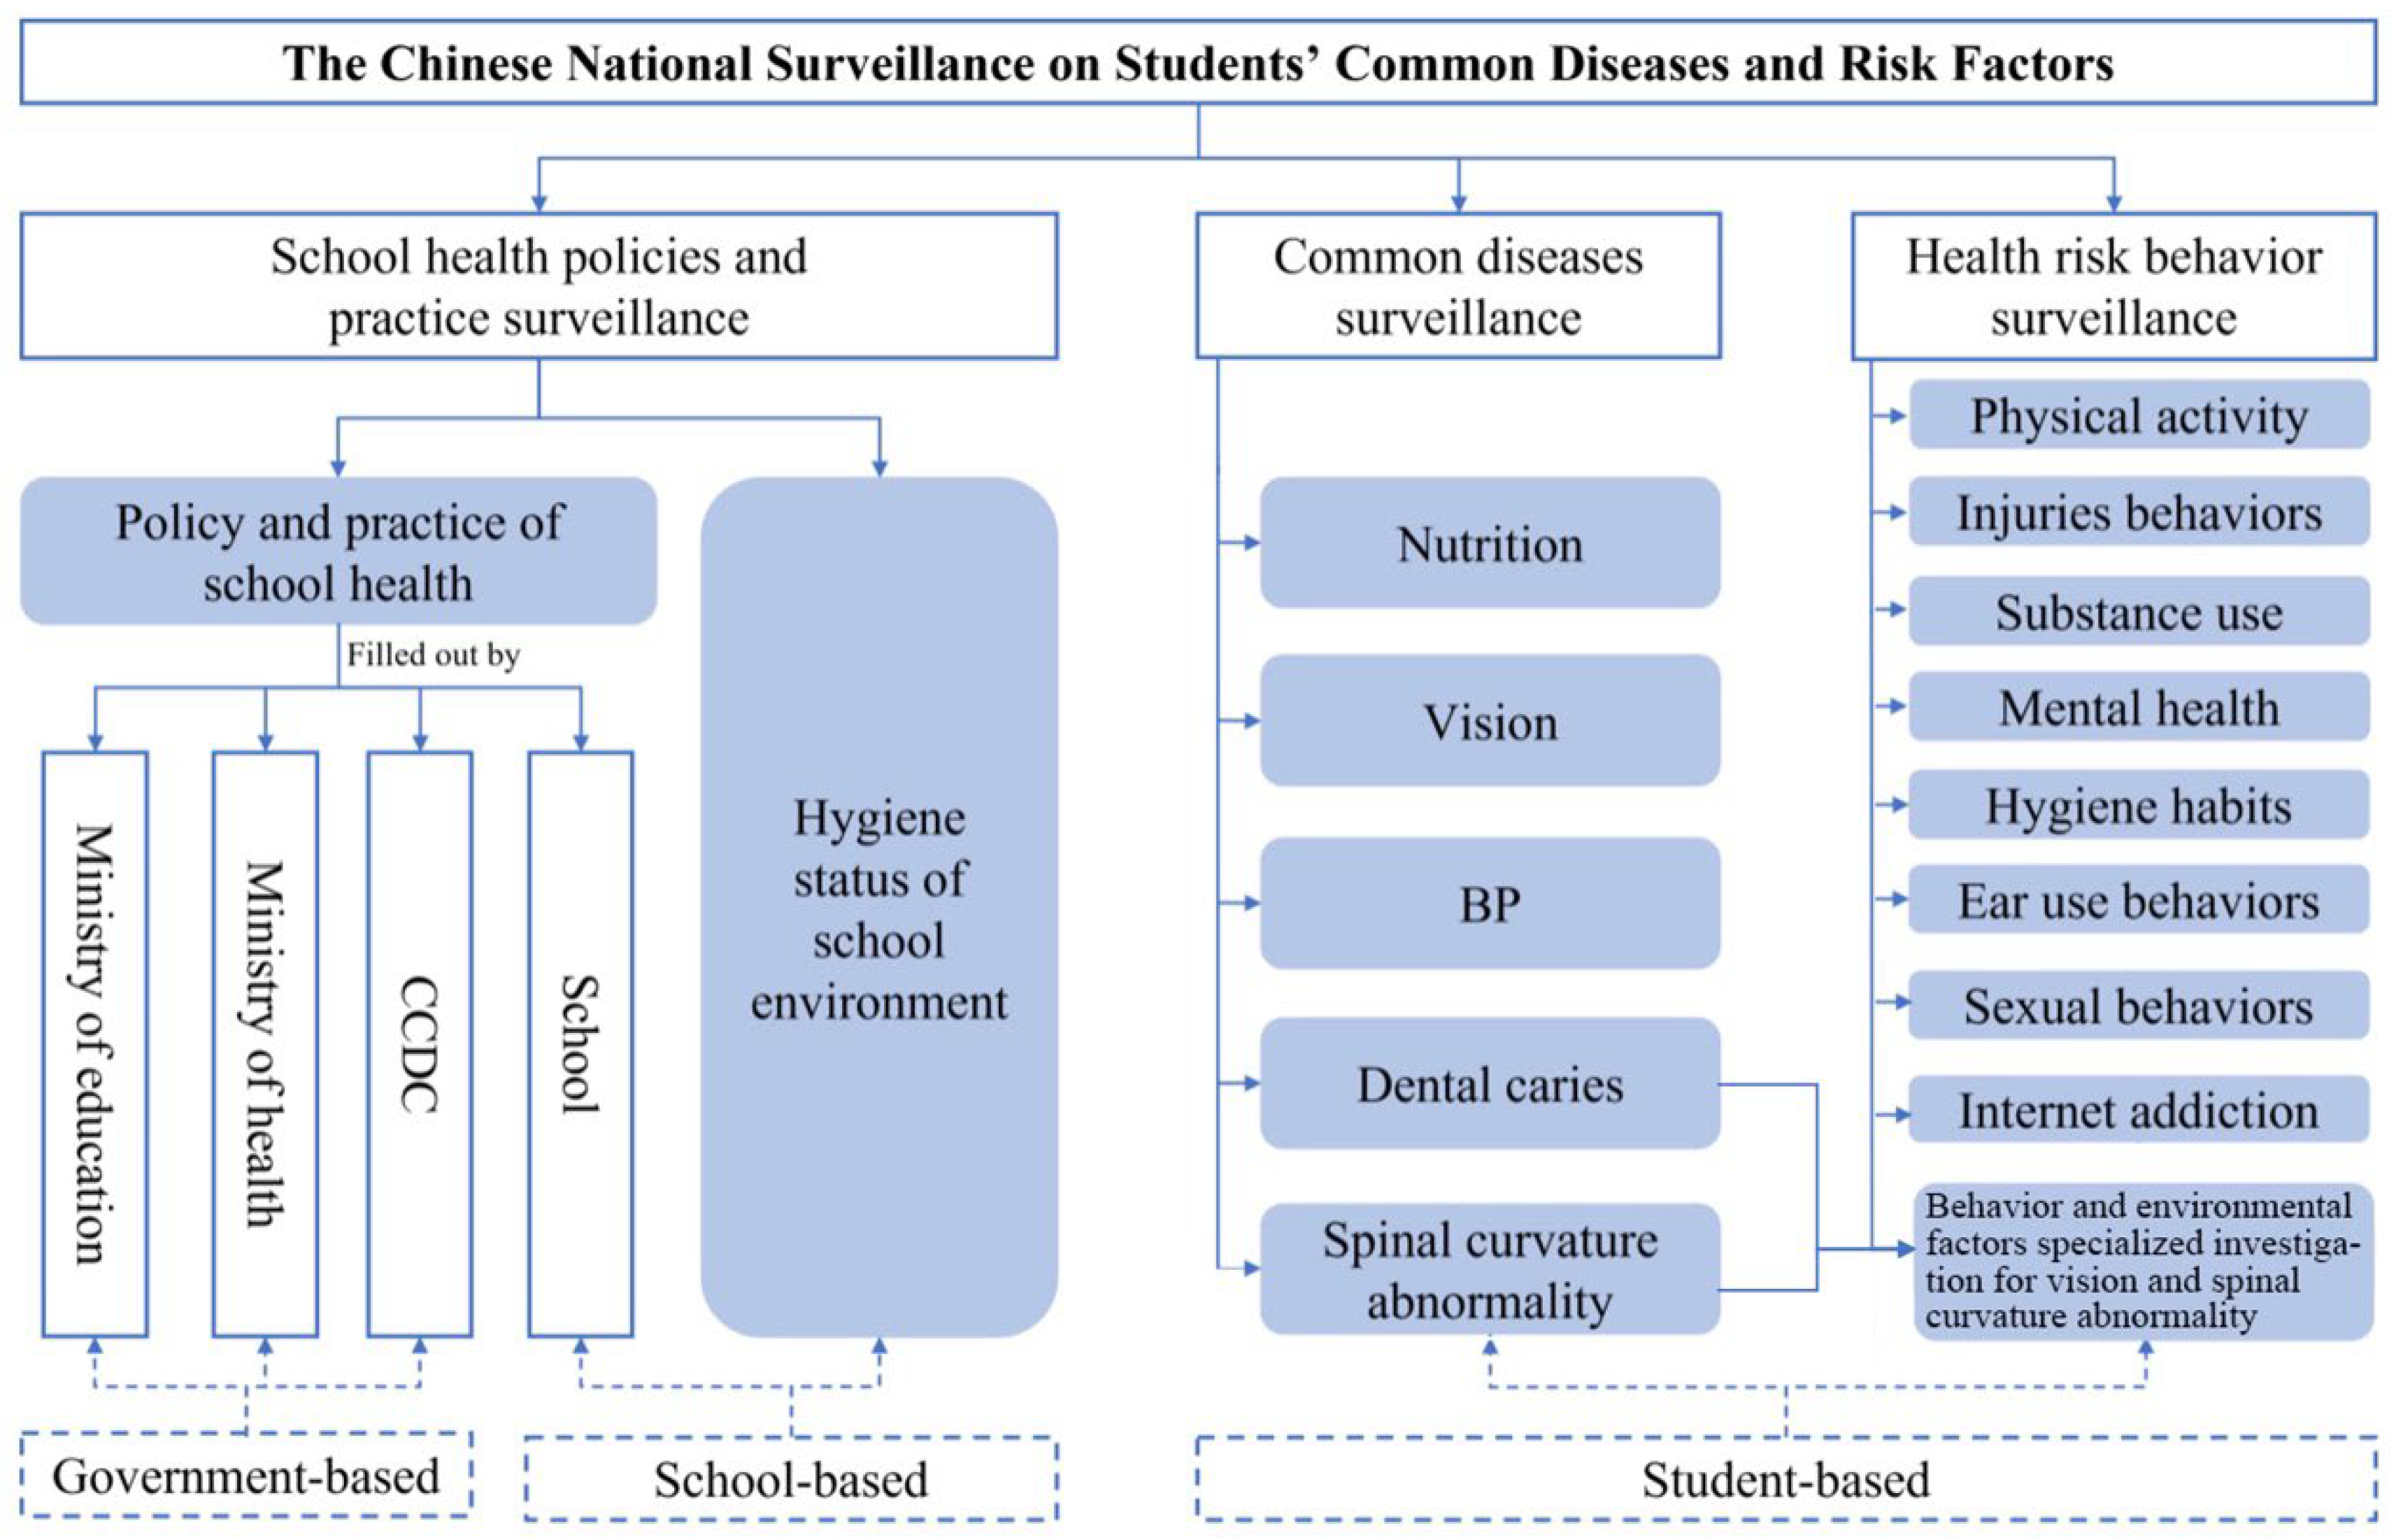
The CNSSCDRF is structured into three distinct components based on differing monitoring subjects, contents, and methodologies, which are the school health policy implementation surveillance, the students’ common diseases surveillance, and the health risk behavior surveillance (
Figure 2). In 2022, the school health policies surveillance consists of government-based surveillance, including 18 indicators in 8 domains, and the school-based surveillance, including 36 indicators of health services provision and 29 indicators of school environments in 16 domains. The students’ common diseases surveillance includes 9 health indicators in 5 domains, and the health-risk behavior surveillance includes 101 health-risk behavior indicators in 9 domains. All of them are considered to be most important for measuring the health of all children and adolescents and always included in the monitoring scope since 2018.
4. Students’ Common Diseases Surveillance Methodology
4.1. Overview
Students’ common diseases surveillance is aimed at monitoring poor vision and myopia, overweight and obesity, malnutrition, abnormal spinal curvature, dental caries, and hypertension in children and adolescents, and designed to collect information among students from grades 1 to 12 and college students. For children aged 6 years old in kindergarten, poor vision and myopia were checked.
4.2. Sampling
We used a two-stage stratified cluster random sampling method to obtain samples. In addition to the randomly selected schools in the school health policies and practice surveillance, two more kindergartens were randomly selected in urban and rural areas, respectively. Then, two more classes per grade in every selected school were randomly selected and all students in the classes were considered to ensure the minimum quota of 80 students attended the survey. College students included those in freshman through junior years. Every student had a specific identification number (ID).
4.3. Information Collection
The information was collected through a short questionnaire and anthropometric measurements. A short questionnaire was filled out by students, including grade, gender, nation, the date of birth and examination, and a history of metabolic and genetic diseases. Anthropometric measurements included uncorrected vision, mirror vision, and the spherical equivalent (SE) of computer optometry (non-cycloplegia), height, weight, BP, dental caries, and spinal curvature abnormality and were conducted by a trained examiner. All of the measurements followed a unified process described in a workbook, which is referred to as the Technical Standard For Physical Examination For Students in China [
8]. The instruments meet national standards. The data were recorded to one decimal place.
The repetition of anthropometric measurements was conducted in 5% of the population each day. The original data were disqualified if the consistency rate was below 90% between the two measurements.
4.4. Data Processing
The national CCDC data review team also confirmed the age range of students and whether the anthropometric information was missing or outside the normal range. All abnormal data were returned to the provincial CCDC for review and correction until the provincial CCDC staff confirmed that the data were correct, and then all data were combined into a national database.
Normal vision is defined as uncorrected vision of both eyes reaching 5.0 or above. Poor vision is defined as uncorrected vision of less than 5.0, with the addition of SE less than −0.5 interpreted as myopia [
9]. The classification of students’ nutrition is based on the body mass index (BMI) and the Chinese National Health Industry standard of overweight and obesity [
10], divided into thin, normal weight, overweight, and obesity. BP is divided into normal and elevated BP, corresponding to lower than P
95 and equal to or higher than P
95 in specific age, sex, and height groups [
11].
4.5. Analytic Method and Weighting
The prevalence rate of myopia, overweight and obesity, elevated BP, dental caries, and spinal curvature abnormality were calculated. To explore the characteristics of prevalence rate, we compare the prevalence rate between boys and girls, urban and rural, different grades, different provinces, and different regions (east, west, middle, and northeast). Prevalence rates from 2022 and earlier are compared to present the change in prevalence rate.
The sampling proportion differs in provinces, owing to their different numbers of students. A weight based on the provincial student population proportion from the National Education Statistical Yearbook was used to reduce the bias. The weighted proportions of students in each province match the provincial population proportions in the nation. The surveillance coverage varied significantly over time (
Figure 1). For the trend analysis, we also calculated the weighted rates to adjust for differences in sampling coverage over time.
6. Discussion
The CNSSCDRF in 2022 was the largest survey on students’ health in China, covering 31 provinces, 436 cities, and more than 2800 counties, which occupied 98% of all counties in China. This is representative of more than 5 million students in those counties aged 6 years to 24 years who attended health checks and conducted self-administered questionnaires.
The scale and frequency of the CNSSCDRF ensure the accuracy of the data. The CNSSCDRF’s scale is almost 17 times bigger than the National Survey on Student Physical Fitness and Health, which is another national survey in China [
14]. Compared with the YRBS in the United States [
12], the CNSSCDRF is more than 350 times bigger and monitored annually rather than biennially.
The CNSSCDRF offers a unique opportunity to monitor the health of Chinese students through a comprehensive indicators system based on the social-ecological model. Most similar to our surveillance is the WHO European Childhood Obesity Surveillance Initiative (COSI), which uses the student record form, the school record form, and the parent record form, respectively, corresponding to the three parts of our surveillance [
15]. Compared with the COSI, our common disease surveillance includes not only obesity, but also common diseases and health-risk behaviors at the individual level, and school surveillance characterized by the implementation of policies as well [
15]. By monitoring the most comprehensive indicators, which measure health outcomes and conditions, health behaviors, health determinants, system performance, and interventions, we can understand the health of children and adolescents in China and its influencing factors from multiple perspectives, such as individuals, families, schools, and macro environments, providing data for policy-making.
This annual monitoring covered all provinces since 2018, whose core indicators have been used up to now. Therefore, it can effectively assess the trends in the prevalence of common diseases and health-risk behaviors. There has been an overall decline in childhood myopia prevalence since 2018, according to the data from the CNSSCDRF reported by the National Disease Control and Prevention Administration. However, this trend was temporarily disrupted during the COVID-19 pandemic (2020–2021), consistent with our observation of fluctuations during this period (2018: 53.6%; 2019: 50.2%; 2020: 52.7%). Notably, the post-pandemic period (2020–2022) showed a sustained recovery, with prevalence decreasing from 52.6% (2021) to 51.9% (2022).
We found that following the epidemic of COVID-19, the prevalence of myopia fluctuated between 2018 and 2020, starting at 53.6% in 2018, dropping to 50.2% in 2019, and then rising slightly to 52.7% in 2020, which can be explained by the finding of an increase in the online class time of students and the reduction of outdoor activities. In 2021~2022, the myopia prevalence exhibited a sustained downward trend from 2021 (52.6%) to 2022 (51.9%); with the increasing efforts of the Chinese government to prevent and control myopia, such as requiring outdoor activities and a reduction of screen-time, the upward trend in the myopia rate has slowed down.
Public health surveillance is the cornerstone of public health practice. This government-funded surveillance, led by the National Disease Control and Prevention Administration and implemented across all levels of disease control centers, systematically reports findings to guide national policies, local interventions, and individual student health management. Results inform government guidelines, trigger public announcements, and prompt on-site feedback to students/parents, with referrals for abnormal cases and targeted interventions for high-risk groups. Surveillance data are crucially important to inform policy changes, guide new program interventions, sharpen public communications, and help agencies assess research investments. For example, based on the surveillance findings, the National Disease Control and Prevention Administration has issued a series of technical guidelines and standards, including Technical Guidelines for Multi-Disease Co-Prevention of Common Student Diseases, Public Health Comprehensive Intervention Technical Guidelines for Myopia Prevention and Control in Children and Adolescents, Implementation Plan for Obesity Prevention and Control in Children and Adolescents, and so on. Additionally, the administration has established pilot counties/districts nationwide to promote appropriate myopia prevention and control technologies for children and adolescents. To improve the quality of surveillance, the national CCDC conducts training courses for provincial CCDC staff at least once a year, and provinces also train their staff in cities and counties to re-check data to confirm the data quality for each day. Information exchange channels between the nation and provinces are built to efficiently communicate the issues arising from surveillance. Students’ ID numbers remain unchanged throughout the surveillance period. Thus, we can explore the association between students’ common diseases and health-risk behaviors, which provides more information for the prevention of common student diseases.
The government-mandated surveillance achieved 99% participation in districts/counties, and 100% of schools and 98% of students in physical examinations, with questionnaire non-response rates being statistically negligible (0.1% of 6 million samples) through class-level cluster sampling. This design, supported by national funding and performance metrics, effectively minimizes underreporting bias.
To address measurement biases in our surveillance system, we implemented a comprehensive quality control framework in the detailed surveillance manual. The series of quality control measures included the following: a stratified two-stage cluster sampling design, a dual-measurement protocol for environmental indicators, standardized equipment calibration procedures, 5% daily re-tests for physical examination, anonymous self-administered classroom survey, logical vale ranges for data validation, the choice of experienced professional and technical personnel (optometrists/dentist, orthopedist, et al.) for measurement and strengthening training and so on.


 ,
, 

