Case Report

Do Laying Hens Form Stable Social Networks?—A Case Study

IFM Biology, AVIAN Behavioural Physiology and Genomics Group, Linköping University, 581 83 Linköping, Sweden
*
Author to whom correspondence should be addressed.
Submission received: 22 November 2024 / Revised: 20 December 2024 / Accepted: 9 January 2025 / Published: 30 January 2025

Abstract

:
A social network is a group of individuals forming a non-random social structure where the number of interactions systematically vary among individuals. The Red Junglefowl, the ancestor of all domesticated chickens, has been shown to form social structures within a larger group; however, how poultry in egg production are socially organised is poorly understood. Egg layers in groups of thousands of individuals are suggested to either, just as Red Junglefowl, form subgroups or to lose social affiliations and replace these with a system of social tolerance. In this case study, a stable group of 20 laying hens with known genetic relationships housed in an outdoor aviary were observed for 3 h per day, during 20 days, in order to determine the social structure in the group. Social affiliations and centralisation measurements were assessed by proximity. The results show that some individuals were consistently more centralised compared to others, which indicates a stable individual variation in sociality. Furthermore, no individual spent more than 10% of her total number of interactions with a particular individual, i.e., little consistency in social affiliations could be found. The results of this case study support the theory of a higher social tolerance rather than a consistent social organisation in domesticated egg layers.

1. Introduction

A social network is a group of individuals forming a non-random social structure where the number of interactions systematically vary among individuals [1,2]. Close associations between animals are beneficial from an evolutionary standpoint. For example, it could minimise intra-group aggression [3] and may allow animals to reach goals that would not be otherwise attainable [2]. Affiliations also relate to mating success [4,5,6,7] and are suggested to increase the motivation for reciprocal altruism in several species [2]. In chickens, social affiliations have been shown to be an effective strategy to avoid harassment from males [7] and reduce aggression within a group [8].
The ancestor of the domesticated laying hen, the Red Junglefowl, lives in smaller groups of about 10 animals [9,10,11]. In larger groups, they form subgroups within the flock, in particular, female–female pairs [12], that are associated with age and rank [7]. However, the every-day life of a domesticated layer in the egg industry differs vastly from that of their ancestor. The layers used in egg production are kept in large industrial production environments, where one flock normally consists of thousands of individuals [13]. In Sweden, where this study was performed, there are flocks with up to at least 69,700 individuals [14], and the largest farm in Sweden has permission to hold 2.9 million fowl [15]. Although the bird density is regulated by Swedish animal legislation, flock size is not [16].
Some evidence indicates that layers in large flocks, just as the Junglefowl, form subgroups and restrict their movements to certain smaller areas [17,18], and that they maintain somewhat stable relationships in terms of proximity [19,20]. However, they seem to have a poorer social learning capacity than their ancestors [21], and one suggestion is that they have, rather than a systematic social structure, an overall high social tolerance without the necessity to recognise each other individually [8,22,23,24]. Although domesticated hens are capable of distinguishing between individuals [8,25,26,27], their ability to do so seems to decrease with flock size [8]. The main argument for this reasoning is that aggression among domesticated chickens seems to decrease with increased group size [8,22,23].
Abeyesinghe et al. [28] applied a social network analysis to investigate the existence of preferential affiliations in small groups of layers. They found no evidence of temporal stability or consistency in structure over the weeks of observations. A similar conclusion was drawn by Campbell et al. [19], who studied hens’ movements through a pop-hole, and reported that no associations between two individuals were greater than random. However, Gómez et al. [20] recently reported that social associations among hens correlate with movement patterns and that this correlation increases with time, which results in more similar movement patterns of socially associated individuals. The authors state that, within a group of hens, there are social affiliations and, further, that these affect the expression of individual behaviour.
The social structure in a flock can be analysed by means of a social network, which consists of nodes (individuals) and edges (relationships). The importance of nodes for the social landscape is characterised by measuring their centrality. Individuals high in degree of centrality have more or stronger relationships with other individuals in the social network [29]. Within a group, chickens sometimes form subgroups [7,12]. A cluster analysis will reveal if there are individuals that form such groups in which intra-group interactions are more frequent than inter-group interactions.
Many animals form stable social affiliations within their groups [30,31,32] and, although the research on chickens is contradictive, there is no biological reason to assume that chickens would differ from other species in that aspect. Preferred affiliations in chickens have been reported to be related to rank and reproductive success, where affiliations with dominant females results in more male attention and frequent mating [7], suggesting that there are evolutionary adaptive reasons for forming close social affiliations. In this study, we aim to explore preferential affiliations and relationships within a small, socially stable group of laying hens that has been kept together from hatch until 46 weeks of age. We hypothesise that chickens over this time have formed preferential affiliations and that full siblings have stronger affiliations than non-related birds. Furthermore, we hypothesise that there is an individual variation in centrality and that individuals with a similar degree of centrality cluster, since there might be an element of personal characters involved in clustering [7].

2. Materials and Methods

2.1. Animals and Housing

A total of 20 chickens of a crossing between two egg-laying hybrids were used. Half of the birds had a mother of the hybrid Delkalb White and a father of the hybrid Bovan Brown, and half of them were the reverse. The birds were all bred in the university chicken facilities by the authors, from parents also bred in the same unit. In total, 8 pairs of parental birds were used, which means that almost all of the observed birds had at least one full sibling. The animals were research animals bred and later used in an unrelated experiment. At the time of the experiment, the animals were 46 weeks old, and the group had been socially stable since hatch. Previous to this experiment, they had not been used in research.
The chickens were kept in an outdoor aviary (360 × 280 cm) containing two feed bells, one water bell, one bale of lucerne, a dust bath, and perches (Figure 1). Furthermore, they had access to an indoor area (245 × 160 cm), which they used for egg laying and perching during the night (Figure 1). The chickens rarely used the indoor area during the day.

2.2. Experimental Set-Up

The chickens were video-recorded in their home pen during the weekdays over the span of one month (in total, 20 days) for three hours per day (10.30–11.30, 15.30–16.30, and 18.00–19.00). During these hours, no human was present, and the cameras were switched on by a timer. Two cameras (Bascom Wireless 2-bullet-systems PLUS) were used, one indoors and one outdoors (Figure 1). Before the start of the experiment, the chickens were marked with red and black patterns on their backs for identification. Red and black were chosen since these are colours easy to distinguish on camera. We could not see any pecking or explorative behaviour due to the marking.

2.3. Behaviour Scoring and Data Analysis
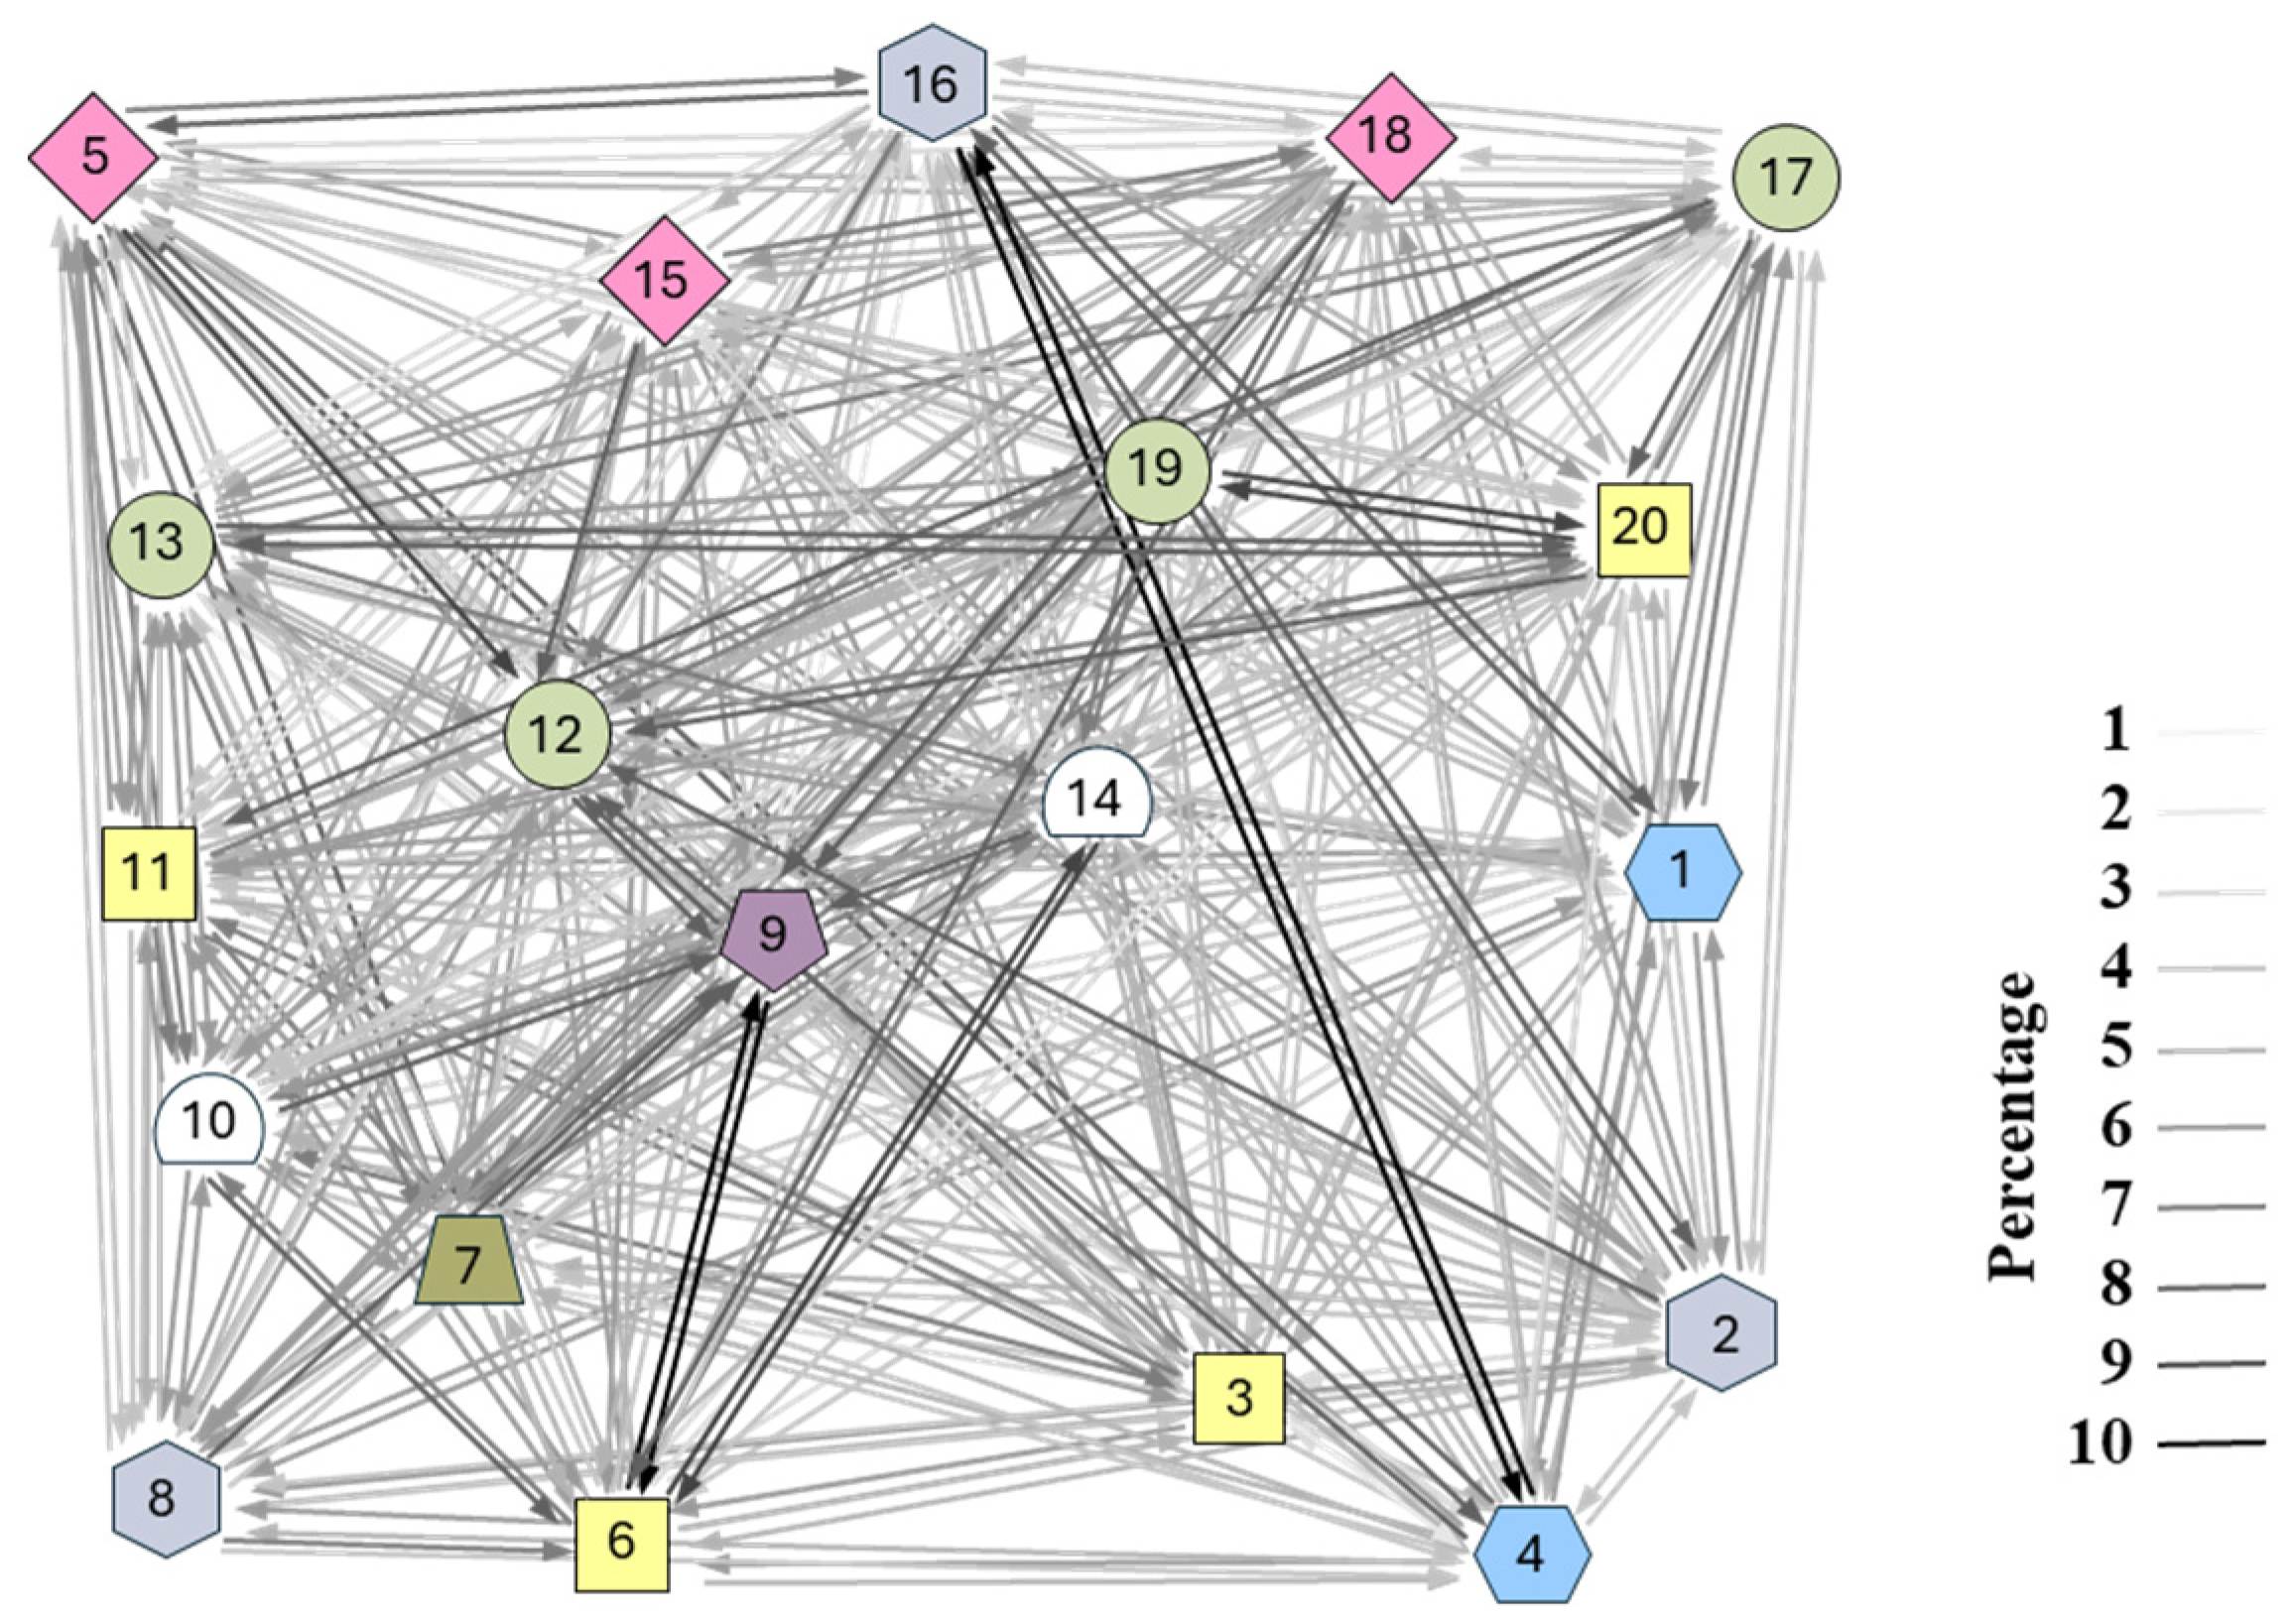
For the behaviour scoring, we applied an interval observation method. Every fifth minute, for each bird, all of the individuals in close proximity were scored, which was defined as a distance of one body length or less. Close spatial proximity is a common way of measuring preferential association between individuals [19,28,33,34]. There could be more than one data point per individual per observation occasion, since a specific individual could be close to several others. For the analysis of the degree of centrality, the Social Network visualiser software (version 3.1, Dimitris V. Kalamaras) was used to reveal the social structure in the group. The weight of the edges was considered in the analyses. A Pearson correlation was performed in order to investigate the stability in the degree of centrality.
For social associations, the percentage of an individual’s total number of interactions with a particular individual was calculated and illustrated with descriptive statistics. The level for complete random associations was set to 5.26%, which is the expected value of sociality an individual would show with each individual if she distributed her time equally between the 19 individuals in the group (100%/19 ind. = 5.26%).
Furthermore, a Louvain cluster analysis was carried out in Rstudio to reveal possible subgroups. The Louvain method shows non-overlapping communities from a network and evaluates how much more connected the nodes in the network are compared to how connected they would be in a random network. The core of community detection is the idea of modularity, which is the defining state of how to divide a network. The Louvain clustering method groups nodes into clusters on the basis of how the movement of the nodes into a specific cluster affects its modularity, where the goal is to maximise the modularity. The Louvain algorithm does not require input on the number of communities or the size before running [35].
The figures were refined in Photoshop (version 26.2.0).

3. Results

The individuals differed in the degree of centrality, where some were more centralised than others (Figure 2 and Figure 3). They were also relatively consistent in their centrality over time (Table 1).
Overall, there was no evidence for strong social affiliations between specific hens. No hen spent more than 10% of her total frequency of interactions with a particular individual (Figure 4). However, a tendency could be seen for a somewhat larger than random association (5.26%) between, for example, individuals 4 and 16, and individuals 6 and 9. A Louvain cluster analysis showed no consistent social pattern or stable subgrouping over the four weeks of observation (Figure 5).

4. Discussion

This was a case study on one group of 20 animals. The aim of the study was not to draw any general conclusions about the social relationships in laying hens, but rather to explore if observing a stable group of animals over an extended period of time would reveal any social patterns that could indicate stable social relationships in this group. The results from this study do not support our hypothesis that chickens form social affiliations. However, as we also hypothesised, individuals scored differently in centrality and sociability, and these traits seemed to be somewhat stable over time. There was a handful of birds (e.g., 12, 9, 14, and 6) that showed a high degree of centrality and spent more time in proximity to others over all four weeks. In the same way, there were some individuals (e.g., 16, 3, and 4) that consistently scored low on sociability and the degree of centrality. There might be underlying explanations for why individuals differ in centrality and sociability, such as a genetic predisposition, personality traits, age, or rank. For example, one recent study showed that younger and more fecund Junglefowl females were generally more social, whereas older, dominant females had fewer but more stable relationships [7]. Although genetics is known to influence social behaviour in chickens [36], here, full siblings where not more similar than non-related birds.
In this study, as in a large number of studies on social networks, proximity was used as an indicator of affiliative relationships. However, although proximity provides an overview of the social landscape in a group, it does not reveal any information about the quality of the relationships. There are several reasons for why an individual may choose to stay close to a particular conspecific and, therefore, when possible, proximity studies should be combined with behaviour studies for a more complete picture of the social landscape in the group. Behaviour studies will reveal if the relationship between two individuals is affiliative or agonistic, as well as mutual or uni-directional. For example, a victim of severe feather pecking will score highly on the degree of centrality because of numerous interactions with others; however, behaviour studies will show that this bird, which can be mistaken for being a highly social individual with numerous affiliations, almost exclusively has uni-directional interactions that are non-beneficial. Complementing behavioural studies could also show if there are other reasons as to why some individuals score highly on the degree of centrality. For example, birds that have a high degree of centrality might be those that cluster around feed bells. That does not mean they actively seek each other’s company, but that they have in common a high motivation for food. In this study, we could not see any consistent clustering of birds; however, all of the animals spent at least one-third of their time in close proximity to others. This does not necessarily mean that they were particularly social, but rather that they were kept in a limited space in which keeping distance from other birds had to be an active decision, for example, by choosing to perch. Although a high stocking density replicates commercial settings, a study design with a lower stocking density might be more suitable for basic research questions about relationships in chickens.

5. Conclusions

In conclusion, this case study does not support the theory that fowl form stable social affiliations; however, it was clear that the birds differed in their degree of centrality and, therefore, that this seems like a trait that is more stable over time. We did not see any consistency in the clustering behaviour either in full siblings or in unrelated birds. However, although the results from this study do not support the hypothesis that fowl form stable social affiliations, that does not rule it out as a possibility. More research is needed on larger sample sizes with several replicates before it is possible to draw any general conclusions about the presence of stable social affiliations in fowl.

Supplementary Materials

The following supporting information can be downloaded at: https://www.mdpi.com/article/10.3390/poultry4010007/s1, File S1: Full dataset and File S2: computer code.

Author Contributions

Conceptualisation, L.H. and P.J.; Data curation, L.H.; Formal analysis, L.H.; Funding acquisition, L.H. and P.J.; Investigation, L.H.; Methodology, L.H. and P.J.; Project administration, P.J.; Resources, D.W. and P.J.; Supervision, P.J.; Validation, L.H. and D.W.; Visualisation, L.H.; Writing—original draft, L.H.; Writing—review and editing, L.H., D.W., and P.J. All authors have read and agreed to the published version of the manuscript.

Funding

This research was funded by Lennanders stiftelse and Längmanska stiftelsen, 2022–2023.

Institutional Review Board Statement

The animal study protocol was approved by the Linköping Council for Ethical Licensing of Animal Experiments (ethical permit no. 10492–2023, 22 June 2023).

Informed Consent Statement

Not applicable.

Data Availability Statement

The full dataset is available in the Supplementary Materials. Further inquiries can be directed to the corresponding author.

Acknowledgments

We thank Doortje Theunissen for help with the practicalities and are grateful to György Barabas for writing the code used in Rstudio for the cluster analysis.

Conflicts of Interest

The authors declare no conflicts of interest. The funders had no role in the design of the study; in the collection, analyses, or interpretation of data; in the writing of the manuscript; or in the decision to publish the results.

References

  1. Krause, J.; Lusseau, D.; James, R. Animal social networks: An introduction. Behav. Ecol. Sociobiol. 2009, 63, 967–973. [Google Scholar] [CrossRef]
  2. Massen, J.; Sterck, E.; de Vos, H. Close social associations in animals and humans: Functions and mechanisms of friendship. Behaviour 2010, 147, 1379–1412. [Google Scholar] [CrossRef]
  3. Hennessy, M.B.; Kaiser, S.; Sachser, N. Social buffering of the stress response: Diversity, mechanisms, and functions. Front. Neuroendocrinol. 2009, 30, 470–482. [Google Scholar] [CrossRef] [PubMed]
  4. Oh, K.P.; Badyaev, A.V. Structure of social networks in a passerine bird: Consequences for sexual selection and the evolution of mating strategies. Am. Nat. 2010, 176, E80–E89. [Google Scholar] [CrossRef]
  5. Cardoso, S.D.; Faustino, A.I.; Costa, S.S.; Valério, F.; Gonçalves, D.; Oliveira, R.F. Social network predicts loss of fertilizations in nesting males of a fish with alternative reproductive tactics. Acta. Ethol. 2017, 20, 59–68. [Google Scholar] [CrossRef]
  6. Wacker, S.; Ness, M.H.; Östlund-Nilsson, S.; Amundsen, T. Social structure affects mating competition in a damselfish. Coral. Reefs. 2017, 36, 1279–1289. [Google Scholar] [CrossRef]
  7. McDonald, G.C.; Spurgin, L.G.; Fairfield, E.A.; Richardson, D.S.; Pizzari, T. Differential female sociality is linked with the fine-scale structure of sexual interactions in replicate groups of red junglefowl. Gallus gallus. Proc. R. Soc. B 2019, 286, 20191734. [Google Scholar] [CrossRef]
  8. D’Eath, R.B.; Keeling, L.J. Social discrimination and aggression by laying hens in large groups: From peck orders to social tolerance. Appl. Anim. Behav. Sci. 2003, 84, 197–212. [Google Scholar] [CrossRef]
  9. Collias, N.E.; Collias, E.C. Social organization of a red junglefowl, Gallus gallus, population related to evolution theory. Anim. Behav. 1996, 51, 1337–1354. [Google Scholar] [CrossRef]
  10. Javed, S.; Rahmani, A.R. Flocking and habitat use pattern of the Red Junglefowl Gallus gallus in Dudwa National Park, India. Trop. Ecol. 2000, 41, 11–16. [Google Scholar]
  11. Zakaria, M.; Arshad, M.I.; Sajap, A.S. Population size of red junglefowl (Gallus gallus Spadiceus) in agriculture areas. Pakistan. J. Sci. Ind. R. 2003, 46, 52–57. [Google Scholar]
  12. Sullivan, M.S. Flock structure in red junglefowl. Appl. Anim. Behav. Sci. 1991, 30, 381–386. [Google Scholar] [CrossRef]
  13. Lannhard Öberg, Å. Marknadsrapport animalieprodukter—Utvecklingen i Sverige till och med 2023. Swed. Board Agric. 2019. Available online: https://jordbruksverket.se/download/18.2a5bd7eb188fa97ada65a69f/1727779283303/Marknadsrapport-animalieprodukter-utvecklingen-tga.pdf (accessed on 1 December 2024).
  14. Svenska Ägg. Nulägesanalys av svensk äggproduktion, Bilaga 1. Sven. Ägg. 2015. Available online: https://www.svenskaagg.se/wp-content/uploads/2024/10/Nulagesanalys-2015.pdf (accessed on 1 December 2024).
  15. Tillstånd enligt 9 kap. miljöbalken för befintlig och utökad produktion av ägg och unghöns. Länsstyrelsen I Kalmar Län 2018. Available online: https://jordbruksverket.se/download/18.2c58b19f1807734f8f8bc11e/1651500109244/M%C3%B6nster%C3%A5s_AB%20CA%20Cedergren_Fj%C3%A4derf%C3%A4_Tillst%C3%A5nd_2018-05-30-tgau.pdf (accessed on 1 December 2024).
  16. Statens jordbruksverks föreskrifter och allmänna råd om fjäderfähållning inom lantbruket m.m., saknr L 111. Swed. Board Agric. 2019, 19. Available online: https://jvdoc.sharepoint.com/:b:/s/sjvfs/EY546msTN69JnQQhUP6e_u8BuLDlke8zVP0nZKnip4446A?download=1 (accessed on 1 December 2024).
  17. McBride, G.; Foenander, F. Territorial behaviour in flocks of domestic fowls. Nature 1962, 194, 102. [Google Scholar] [CrossRef]
  18. Odén, K.; Vestergaard, K.; Algers, B. Space use and agonistic behaviour in relation to sex composition in large flocks of laying hens. Appl. Anim. Behav. Sci. 2000, 67, 307–320. [Google Scholar] [CrossRef]
  19. Campbell, D.L.; Horton, B.J.; Hinch, G.N. Using radio-frequency identification technology to measure synchronised ranging of free-range laying hens. Animals 2018, 8, 210. [Google Scholar] [CrossRef]
  20. Gómez, Y.; Berezowski, J.; Jorge, Y.A.; Gebhardt-Henrich, S.G.; Vögeli, S.; Stratmann, A.; Toscano, M.J.; Voelkl, B. Similarity in temporal movement patterns in laying hens increases with time and social association. Animals 2022, 12, 555. [Google Scholar] [CrossRef]
  21. Väisänen, J.; Håkansson, J.; Jensen, P. Social interactions in Red Junglefowl (Gallus gallus) and White Leghorn layers in stable groups and after re-grouping. Br. Poult. Sci. 2005, 46, 156–168. [Google Scholar] [CrossRef]
  22. Nicol, C.; Gregory, N.; Knowles, T.; Parkman, I.; Wilkins, L. Differential effects of increased stocking density, mediated by increased flock size, on feather pecking and aggression in laying hens. Appl. Anim. Behav. Sci. 1999, 65, 137–152. [Google Scholar] [CrossRef]
  23. Hughes, B.; Carmichael, N.; Walker, A.; Grigor, P. Low incidence of aggression in large flocks of laying hens. Appl. Anim. Behav. Sci. 1997, 54, 215–234. [Google Scholar] [CrossRef]
  24. Estevez, I.; Newberry, R.C.; De Reyna, L.A. Broiler chickens: A tolerant social system. Etologia 1997, 5, 19–29. [Google Scholar]
  25. Dawkins, M.S. How do hens view other hens? The use of lateral and binocular visual fields in social recognition. Behaviour 1995, 132, 591–606. [Google Scholar] [CrossRef]
  26. Bradshaw, R. Discrimination of group members by laying hens Gallus domesticus. Behav. Process 1991, 24, 143–151. [Google Scholar] [CrossRef]
  27. Hughes, B. Selection of group size by individual laying hens. Br. Poult. Sci. 1977, 18, 9–18. [Google Scholar] [CrossRef]
  28. Abeyesinghe, S.M.; Drewe, J.A.; Asher, L.; Wathes, C.M.; Collins, L.M. Do hens have friends? Appl. Anim. Behav. Sci. 2013, 143, 61–66. [Google Scholar] [CrossRef]
  29. Koene, P.; Ipema, B. Social networks and welfare in future animal management. Animals 2014, 4, 93–118. [Google Scholar] [CrossRef]
  30. Veissier, I.; Le Neindre, P. Weaning in calves: Its effects on social organization. Appl. Anim. Behav. Sci. 1989, 24, 43–54. [Google Scholar] [CrossRef]
  31. van Dierendonck, M.C. The Importance of Social Relationships in Horses; Utrecht University: Utrecht, The Netherlands, 2006. [Google Scholar]
  32. Petersen, H.; Vestergaard, K.; Jensen, P. Integration of piglets into social groups of free-ranging domestic pigs. Appl. Anim. Behav. Sci. 1989, 23, 223–236. [Google Scholar] [CrossRef]
  33. Whitehead, H.; Dufault, S. Techniques for analyzing vertebrate social structure using identified individuals: Review and recommendations. Adv. Stud. Behav. 1999, 28, 3374. [Google Scholar]
  34. Silk, M.J. Conceptual representations of animal social networks: An overview. Anim. Behav. 2023, 201, 157–166. [Google Scholar] [CrossRef]
  35. Murniyati; Mutiara, A.B.; Wirawan, S.; Yusnitasari, T.; Anggraini, D. Expanding Louvain Algorithm for Clustering Relationship Formation. IJACSA 2023, 14, 701–708. [Google Scholar]
  36. Johnsson, M.; Henriksen, R.; Fogelholm, J.; Höglund, A.; Jensen, P.; Wright, D. Genetics and Genomics of Social Behavior in a Chicken Model. Genetics 2018, 209, 209–221. [Google Scholar] [CrossRef]
Figure 1. Home pen of the chickens.
Poultry 04 00007 g001
Figure 2. Degree of centrality of individuals 1–20 over four weeks of observation. The higher the degree of centrality, the closer to the centre of the circle. The same colour and shape indicate full siblings.
Poultry 04 00007 g002
Figure 3. Degree of centrality of individuals 1–20 over four weeks of observation. The same colour indicates full siblings.
Poultry 04 00007 g003
Figure 4. Social affiliations of individuals 1–20 over four weeks of observation. Percentage of an individual’s total number of interactions with a particular individual, where 5.26% is the level for complete random associations. The same colour and shape indicate full siblings.
Poultry 04 00007 g004
Figure 5. Louvain clusters revealing the subgroups of individuals 1–20 over four weeks of observation. The same shape indicates full siblings. Encircled individuals of a similar colour represent clusters of individuals with the highest affiliation tendencies.
Poultry 04 00007 g005
Table 1. Correlation of the degree of centrality of individuals 1–20 over four weeks of observation. The table shows the Pearson Correlation Coefficient, degrees of freedom and the p-value of the correlation coefficient for each comparison.
Week 2Week 3Week 4
Week 1Pearson’s r0.550.740.72
df181818
p-value0.011<0.001<0.001
Week 2Pearson’s r 0.490.71
df 1818
p-value 0.027<0.001
Week 3Pearson’s r 0.47
df 18
p-value 0.033
Disclaimer/Publisher’s Note: The statements, opinions and data contained in all publications are solely those of the individual author(s) and contributor(s) and not of MDPI and/or the editor(s). MDPI and/or the editor(s) disclaim responsibility for any injury to people or property resulting from any ideas, methods, instructions or products referred to in the content.

