Article

Extracellular DNA in the Chicken Cecal Environment

1
Center of Excellence for Poultry Science, University of Arkansas System Division of Agriculture, Fayetteville, AR 72701, USA
2
Department of Pathology & Veterinary Diagnostics, Institute of Veterinary Medicine, Warsaw University of Life Sciences, 02-776 Warsaw, Poland
3
Department of Biological Sciences, Northern Illinois University, DeKalb, IL 60115, USA
4
Cell and Molecular Biology Program, University of Arkansas, Fayetteville, AR 72701, USA
*
Author to whom correspondence should be addressed.
Retired.
Poultry 2025, 4(1), 14; https://doi.org/10.3390/poultry4010014
Submission received: 1 November 2024 / Revised: 27 February 2025 / Accepted: 3 March 2025 / Published: 18 March 2025

Abstract

:
The presence and biological role of extracellular DNA (eDNA) have been explored in diverse microbial environments. Nonetheless, it has not been studied in the chicken gut microbiome. This study aims to investigate eDNA in the chicken cecum, analyzing cecal samples from broiler chickens using three preparation methods: Whole Cecal Suspension (WCS), Washed Cell Pellets (WCP), and Cell-Free Supernatant (CFS). The 16S rRNA gene-based microbiota analysis revealed distinct microbial communities in CFS compared to WCS and WCP (p = 0.001). Notably, specific taxa, including Anaerofilum, Anaerotruncus, Oscillospira, Syntrophomonas, and Delftia, were enriched in CFS. Confocal fluorescence microscopy, employing stains such as Propidium Iodide (PI), GelGreen, and SYTO 9, confirmed the presence of eDNA with filaments observed in WCS and CFS. Colocalization of PI and GelGreen™ validated the extracellular nature of eDNA, while DNase I treatment selectively degraded eDNA, further confirming its extracellular nature. Our findings in this study highlight the presence of eDNA in the chicken cecal microbiome, and the presence of eDNA associated with specific taxonomic groups suggest that it might play a specific role in the biological function of the cecal microbiome, which warrants further investigation in the future.

1. Introduction

The chicken gut microbiome is a complex ecosystem that plays a critical role in nutrient absorption, immune function, and disease resistance [1,2,3]. Understanding the composition and structural characteristics of extracellular DNA (eDNA) within microbial communities in the chicken cecum and how these characteristics influence the microbial community might be important for advancing poultry health, productivity, and food safety [4,5]. High-throughput sequencing of the 16S rRNA gene has revolutionized our understanding of the gut microbiota, providing significant insights into the intricate relationships between microbial communities and host biology [6]. Conventionally, studies on the gut microbiome involve resuspending gut contents or fecal samples in buffers, extracting community DNA, and sequencing the variable regions of the 16S rRNA gene [7,8]. These methodologies predominantly focus on live bacterial communities as the primary players of microbiome functionality [9,10], often overlooking the roles of non-cellular factors such as metabolites and extracellular DNA (eDNA), which is DNA outside the cellular confines [11,12].
Originating from intracellular DNA (iDNA) through active release, passive shedding, or cell lysis, eDNA’s ecological significance has been increasingly recognized across various environments, including aquatic systems, soil, and biofilms [13,14,15]. It plays a crucial role in bacterial biofilm, acting as a structural component that enhances stability and resilience [16,17,18]. Despite these findings, the role of eDNA in the chicken gut microbiome remains underexplored, though it is hypothesized to contribute to the spread of antimicrobial resistance in Campylobacter jejuni [19].
DNase I, an enzyme that selectively degrades DNA, is widely used in both experimental and clinical settings to disrupt biofilm integrity, highlighting the structural importance of eDNA [18]. DNase I is often used to differentiate between iDNA and eDNA, confirming the extracellular nature of eDNA [20,21]. While molecular techniques such as 16S rRNA sequencing provide valuable taxonomic insights, confocal laser scanning microscopy (CLSM) offers spatial resolution, enabling the direct visualization of eDNA using stains like Propidium Iodide (PI), SYTO 9, and GelGreen™. These stains help differentiate between live cells, dead cells, and eDNA, offering a powerful tool for investigating microbial communities and their interactions with eDNA. GelGreen, which intercalates between nucleic acids, stains eDNA or dead cells green, but is unable to penetrate live cells [22,23]. PI also stains eDNA, dead or compromised cells, while SYTO 9 binds to DNA in both live cells and dead cells, producing green fluoresce. Together, these dyes allow for a comprehensive visualization of both iDNA and eDNA [21,24,25,26].
Some studies suggest that eDNA supports biofilm architecture, influences microbial community dynamics, and facilitates horizontal gene transfer [21,26,27]. The structural and compositional differences between genomic DNA and eDNA may affect their roles within microbial communities [28]. Understanding these dynamics in the chicken gut context is crucial, as eDNA may shape microbial interactions. Employing CLSM in addition to 16S rRNA gene sequencing can provide a more comprehensive view of the chicken gut microbiome [29,30].
We hypothesize that eDNA is released into the chicken cecal environment either actively or passively, and that it differs in composition and structure from iDNA. The first objective was to utilize three DNA preparation methods—Whole Cecal Suspension (WCS), Washed Cell Pellets (WCP), and Cell-Free Supernatant (CFS)—to extract community DNA and analyze bacterial communities using the 16S rRNA gene-based sequencing [6,31]. The second objective was to visualize eDNA through staining with PI, GelGreen™, and SYTO 9 using confocal fluorescence microscopy. The third objective was to apply DNase I treatment to confirm the extracellular nature of the eDNA. This research could provide novel insights into understanding the gut microbiome in chickens and, studying eDNA in the chicken cecum may reveal parallel attributes with other microbiomes, contributing to a broader understanding of eDNA’s functions across ecosystems [32].

2. Materials and Methods

2.1. Reagents and Equipment

The materials used in this study included specialized equipment, reagents, and biological materials. Confocal microscopy was conducted using an Olympus FluoView FV10i-LIV microscope (60× magnification, Objective lens Numerical Aperture value = NA 1.2; Olympus Corporation, Tokyo, Japan) at the Engineering Research Center, University of Arkansas. Imaging was performed on sterile glass-bottom Mat Tek dishes, using nucleic acid stains, PI (1 mg/mL; Sigma Aldrich, Burlington, MA, USA), SYTO 9 Fluorescent Nucleic Acid Stain (5 mM in DMSO; Invitrogen, Carlsbad, CA, USA), and GelGreen™ Nucleic Acid Gel Stain (10,000×; Biotium, Fremont, CA, USA) [22,23], to differentiate between iDNA and eDNA during staining.
Enzymatic treatments utilized RNase-free DNase I (1 U/μL, Thermo Fisher Scientific, Waltham, MA, USA) to degrade eDNA, while DNA extractions were performed using the Quick-DNA™ Fecal/Soil Microbe Miniprep Kit (Zymo Research, Irvine, CA, USA) [33]. Extracted DNA were quantified using the Qubit™ dsDNA HS Assay Kit (Thermo Fisher Scientific, Waltham, MA, USA) for downstream analysis.
Salmonella enterica serotype Typhimurium (S. Typhimurium) 14028s, a spontaneous mutant with resistance to nalidixic acid, was cultured using Luria–Bertani (LB) broth. Image analysis and data processing were conducted using ImageJ software (version 1.54; NIH, Bethesda, MD, USA) to evaluate fluorescence patterns and structural integrity.

2.2. Chicken Cecal Samples and Sample Processing Procedures

The protocol for collecting chicken cecal samples was approved (18 September 2020) by the Institutional Animal Care and Use Committee (IACUC) at the University of Arkansas, Fayetteville, AR. Cobb 500 broiler chicks (male byproducts), freely provided by Cobb-Vantress, Inc. (Siloam Springs, AR, USA) for use for research purposes, were provided ad libitum access to water and an antibiotic-free corn-soybean meal diet (Table S1). Twelve birds (3 weeks old) were humanely euthanized, and their ceca were promptly and aseptically harvested. For the microbiome study, the weight of the cecal content was measured and the same volume (e.g., 1 mL to 1 g content) of Phosphate-Buffered Saline (PBS, pH 7.0) was added to the cecal content, which was then mixed thoroughly. The samples were processed in three different ways: (1) WCS (n = 12): Here, 0.2 mL of the cecal suspension in PBS was transferred to a new tube. (2) WCP (n = 12): 1.2 mL of the cecal suspension was transferred into a new tube, which was centrifuged at 15,000× g at 4 °C for 10 min. The supernatant was removed and the remaining cell pellet was washed three times and resuspend in 1.2 mL PBS. (3) CFS (n = 12): The supernatant (0.5 mL) from the preparation of WCP was centrifuged again at 15,000× g at 4 °C for 10 min and the supernatant (0.4 mL) was sequentially pre-filtered through 1.2 μm and then 0.45 μm filters (Millipore) to remove tissue debris, and further filtered with a 0.2 μm filter to remove microbial cells [27].
Fifty microliters of each CFS sample were plated on Brain Heart Infusion (BHI) and Mueller Hinton (MH) agar plates, then incubated at 37 °C for 48 h under aerobic conditions and 72 h under microaerophilic conditions to confirm the absence of any live bacterial cells. Community DNA was isolated from WCS, WCP, and CFS, and its concentration and quality were assessed using the Quick-DNA™ Fecal/Soil Microbe Miniprep Kit (Zymo Research) [33] and Qubit™ dsDNA HS Assay Kit (ThermoFisher Scientific), respectively (Table S2).

2.3. Microbiota Analysis

The 16S rRNA gene sequencing profiling was conducted as per protocols described in the Earth Microbiome Project [34]. The V4-V5 region of the 16S rRNA gene was amplified from each community DNA sample (10 ng), using 515F [35] and 926R primers [36]. The PCR was performed using Platinum™ Green Hot Start PCR Master Mix (2×) (Invitrogen, Carlsbad, CA, USA) in a 50 µL reaction volume, following the manufacturer’s instructions. The PCR cycling profile included an initial denaturation at 94 °C for 2 min, followed by 30 cycles of denaturation at 94 °C for 30 s, annealing at 60 °C for 30 s, and extension at 68 °C for 30 s, with a final extension at 68 °C for 5 min. PCR amplicons were resolved on 1% agarose gel and purified. The concentration of purified amplicons was quantified using the Qubit 4 dsDNA Broad-Range Assay Kit (Thermo Fisher Scientific, MA, USA). An equal concentration of 350 ng DNA from each sample was pooled. The pooled PCR amplicon was sequenced on an Illumina MiSeq platform (2 × 300 PE) at Admera Health, South Plainfield, NJ, USA.

2.4. 16S rRNA Gene Sequence and Statistical Analysis

Sequence reads were analyzed using Quantitative Insights into Microbial Ecology (QIIME) 2 version 1.9.1 [37] on the University of Arkansas’s High Performance Computing Center (AHPCC). Amplicon Sequence Variants (ASVs) were identified using the DADA2 pipeline within QIIME2 [31]. The α and β diversities were calculated using the observed OTUs and the Weighted UniFrac distance metric, respectively [6].
Statistical differences among groups at various taxonomic levels were determined using LEfSe [38] with criteria set at p < 0.05 and LDA score > 2.2. The significant differences in α diversity were calculated using the alpha-group-significance command in QIIME2, while differences in β diversity among groups were analyzed using the PERMANOVA test implemented through the beta-group-significance command in QIIME2 with the pairwise comparison option. For both diversity analyses, corrected p-values for multiple comparisons (q) were reported, with a significance level set at q < 0.05.

2.5. Confocal Laser Scanning Microscope Imaging

2.5.1. Sample Preparation and Staining Procedures

For confocal imaging, 24 ceca were thawed from −80 °C and the content was collected. All samples were combined and prepared as WCS, WCP, and CFS using a 10-fold dilution of ceca content (weight per volume, w/v) in 1× PBS, as described in Section 2.2. The prepared samples were divided into aliquots for various experimental conditions, including single or co-staining, anaerobic incubation (CFS), and inoculation with S. Typhimurium or E. coli control cultures, DNA extraction and DNase I treatment. Additionally, aliquots were further divided into smaller volumes for staining with PI alone or in combination with GelGreen or SYTO 9.We carefully prepared and stained samples to differentiate and visualize iDNA and eDNA in microbial communities from the chicken ceca. The samples included WCS, WCP, and CFS, along with control cultures of S. typhimurium in CFS Escherichia coli (E. coli) in CFS. PI was used at a concentration of 10 µM, with excitation at 537 nm and emission at 619 nm [20,21,24], to stain eDNA and dead cells, as PI binds to nucleic acids but does not penetrate intact live cells. SYTO 9 was used at a concentration of 5 µM, with excitation at 483 nm and emission at 503 nm [25], and live cells were differentiated from dead cells based on their membrane integrity [21]. To specifically target eDNA, GelGreen™ was applied at a concentration of 1×, with excitation at 489 nm and emission at 510 nm, without entering live cells [22,39].
The staining sequence began with either GelGreen or SYTO 9 followed by PI. For single stains, a 30 min incubation in the dark was used [22], while for co-staining one-hour incubation was used. The appropriate wavelengths for each stain were selected to capture detailed fluorescent images. Samples were transferred to glass-bottom Mat Tek dishes and imaged using confocal microscopy at 60× magnification with a numerical aperture (NA) of 1.2. Throughout the imaging procedure, strict sterile techniques were maintained to ensure the accuracy and reliability of the results.

2.5.2. Analysis of Cell-Free Supernatant (CFS)

Initially, CFS was prepared by filtering through a 0.2 µm filter and immediately stained for imaging. When this approach yielded little to no visible images, an additional portion of the CFS was incubated overnight (16 h) at 37 °C in aerobic conditions to promote eDNA coagulation or fiber formation, enhancing the potential for visualization under confocal microscopy. Following incubation, 1 mL of CFS was stained with PI alone, and in separate sets, with SYTO 9 or GelGreen followed by PI. DNA was extracted from a portion of CFS and stained with PI alone, and another portion was stained with both PI and GelGreen to assess eDNA content. Another aliquot of CFS was treated with DNase I (RNase-free, 100 µL of 1 U/μL) and 100 µL of 10× buffer, incubated overnight, and stained to assess the presence and degradation of eDNA [21]. These samples were then placed onto glass-bottom Mat Tek dishes and imaged using confocal microscopy at 60× magnification. Throughout the procedure, strict sterile techniques were maintained to ensure the reliability of the results.

2.5.3. Analysis of WCS, WCP, and CFS Inoculated with S. Typhimurium

WCS was analyzed directly to assess its natural eDNA content and dynamics. WCP was resuspended with four times its volume of Phosphate-Buffered Saline (PBS) and stained with PI alone or with either SYTO 9 or GelGreen followed by PI. Aliquots of both WCS and WCP were stained directly, while another aliquot was treated with DNase I (RNase-free, 100 units/mL) in 1× buffer and incubated anaerobically at 37 °C for 24 h to assess the presence and degradation of eDNA. Then, 1× PBS was added to samples not treated with DNase I to achieve the same 1 mL final volume, followed by staining with PI and GelGreen to visualize eDNA. CFS was inoculated with S. Typhimurium and incubated anaerobically at 37 °C for 72 h to simulate pathogen-induced eDNA responses. Afterward, an aliquot of 1 mL with 104 CFU/mL was stained directly, while another portion was treated with DNase I as described earlier and stained using GelGreen or SYTO 9 and PI to distinguish between cellular DNA and eDNA.

2.5.4. Validation and Control Experiments

Controls were used to ensure the specificity and accuracy of the staining procedures. DNA was extracted from CFS using the Quick-DNA™ Fecal/Soil Microbe Mini Prep Kit and stained with dyes to validate the presence of eDNA. DNase I treatment was evaluated for 15 min, 30 min, and overnight incubation using WCS, since it had the most eDNA co-localization (Figure S1) and overnight incubation was used in all experiments [21]. Comparative analysis of DNase I-treated and untreated samples, as well as incubation with bacterial controls, provided a robust framework for assessing the role of eDNA in the chicken cecal microbiome (Figure S2).

2.5.5. Imaging and Data Analysis

All samples were imaged using a confocal microscope on sterile glass-bottom Mat Tek dishes. ImageJ software was used to analyze the red and green fluorescence patterns, as well as their merged and contrast channels. This analysis assessed the presence and structural integrity of eDNA, cellular integrity, and interactions within microbial communities. Multiple images were captured from different sample regions to provide representative observations. Strict sterile techniques were maintained to ensure the accuracy of the results.

3. Results

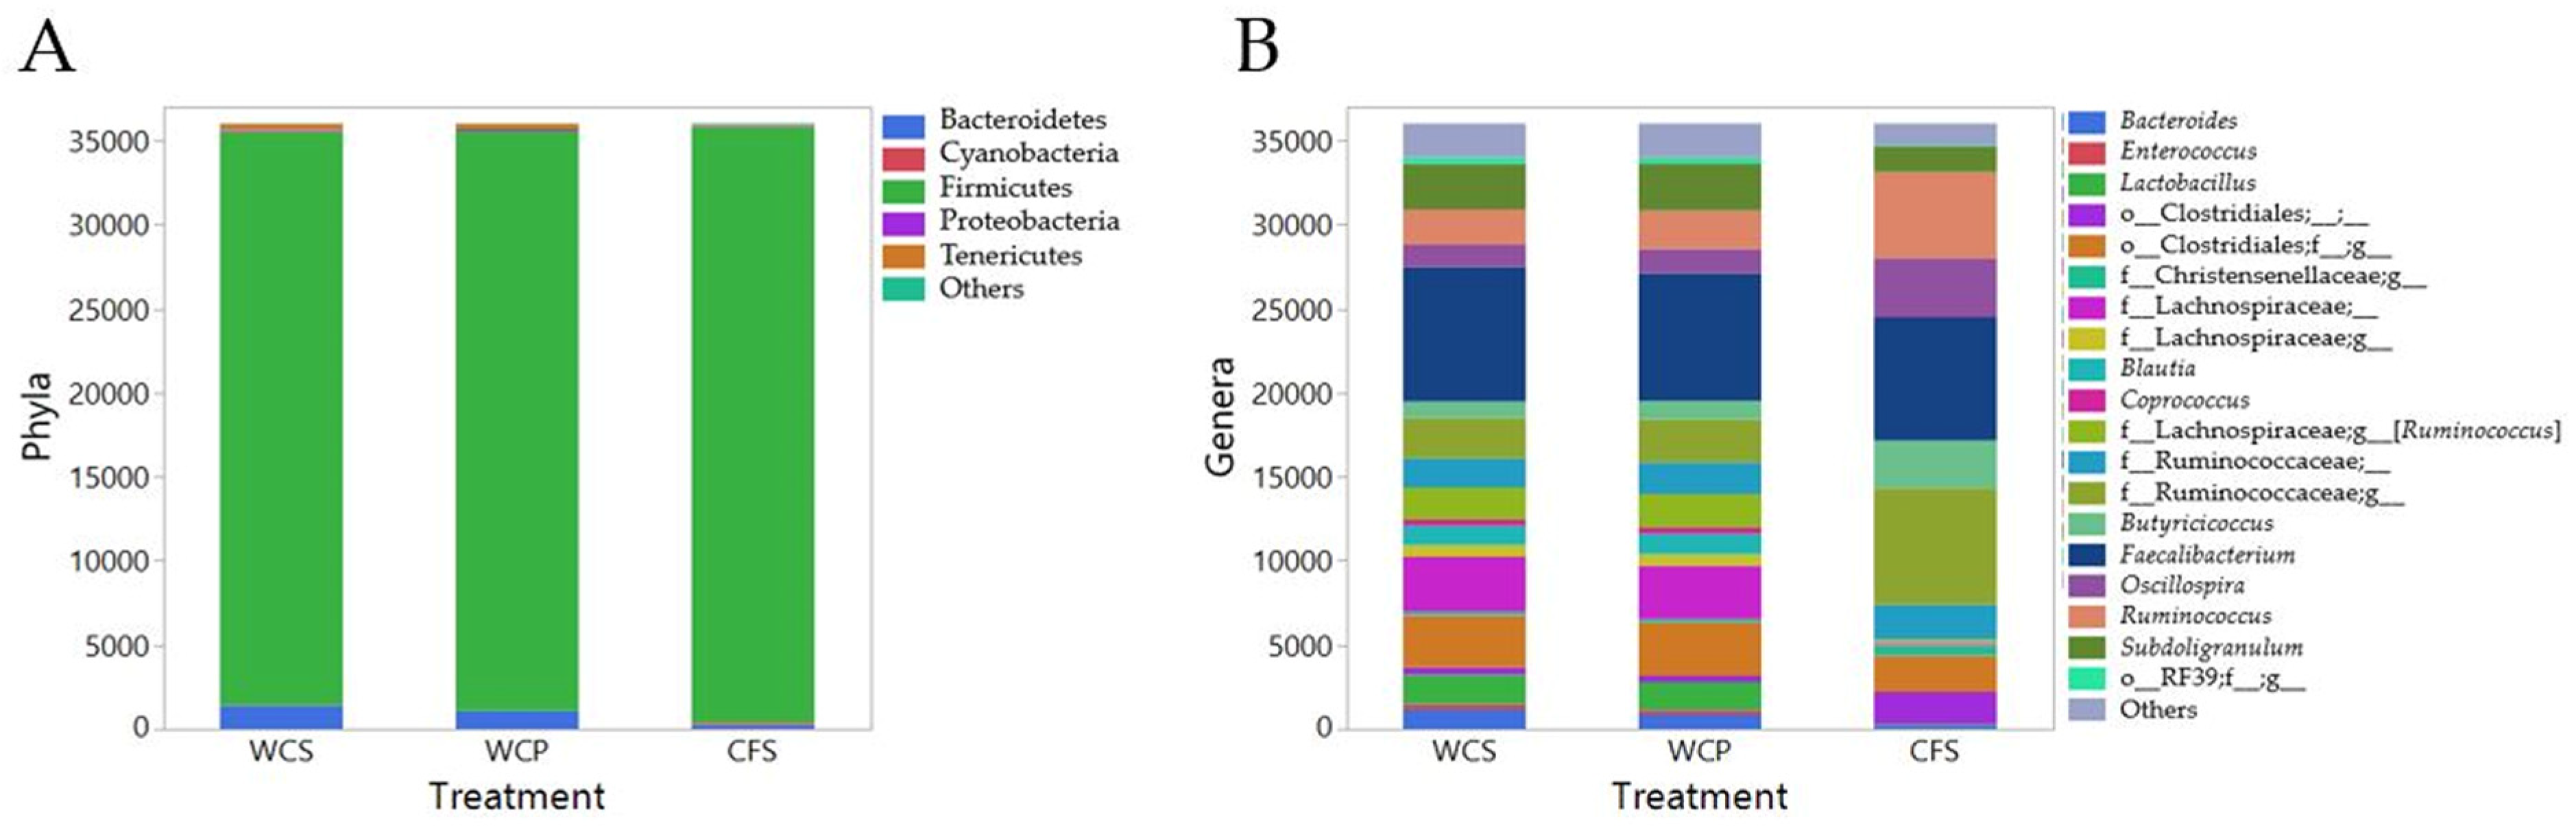
3.1. Diversity and Abundance of Bacterial Genera in Cecal Microbiomes

A total of 13,207,944 sequence reads were obtained from 36 samples. The median and mean reads (±SE) per sample were 97,866 and 105,307.94 (±5874.76), respectively. A cumulative sum scaling (CSS)-normalized OTU BIOM table was used for taxonomy assignment and α diversity analysis. The relative abundances of different taxonomic groups in all three groups (≥1% of all groups) at phylum and genus levels are shown in Figure 1.
Overall, the most abundant bacterial genera identified by taxonomic assignment included Faecalibacterium (21.25%), Ruminococcus (8.79%), Subdoligranulum (6.55%), Oscillospira (5.79%), Butyricicoccus (4.55%), Lactobacillus (3.24%), Blautia (2.19%), Bacteroides (2.05%), Coprococcus (0.69%), and Enterococcus (0.57%), in descending order of relative abundance (Figure 1B).

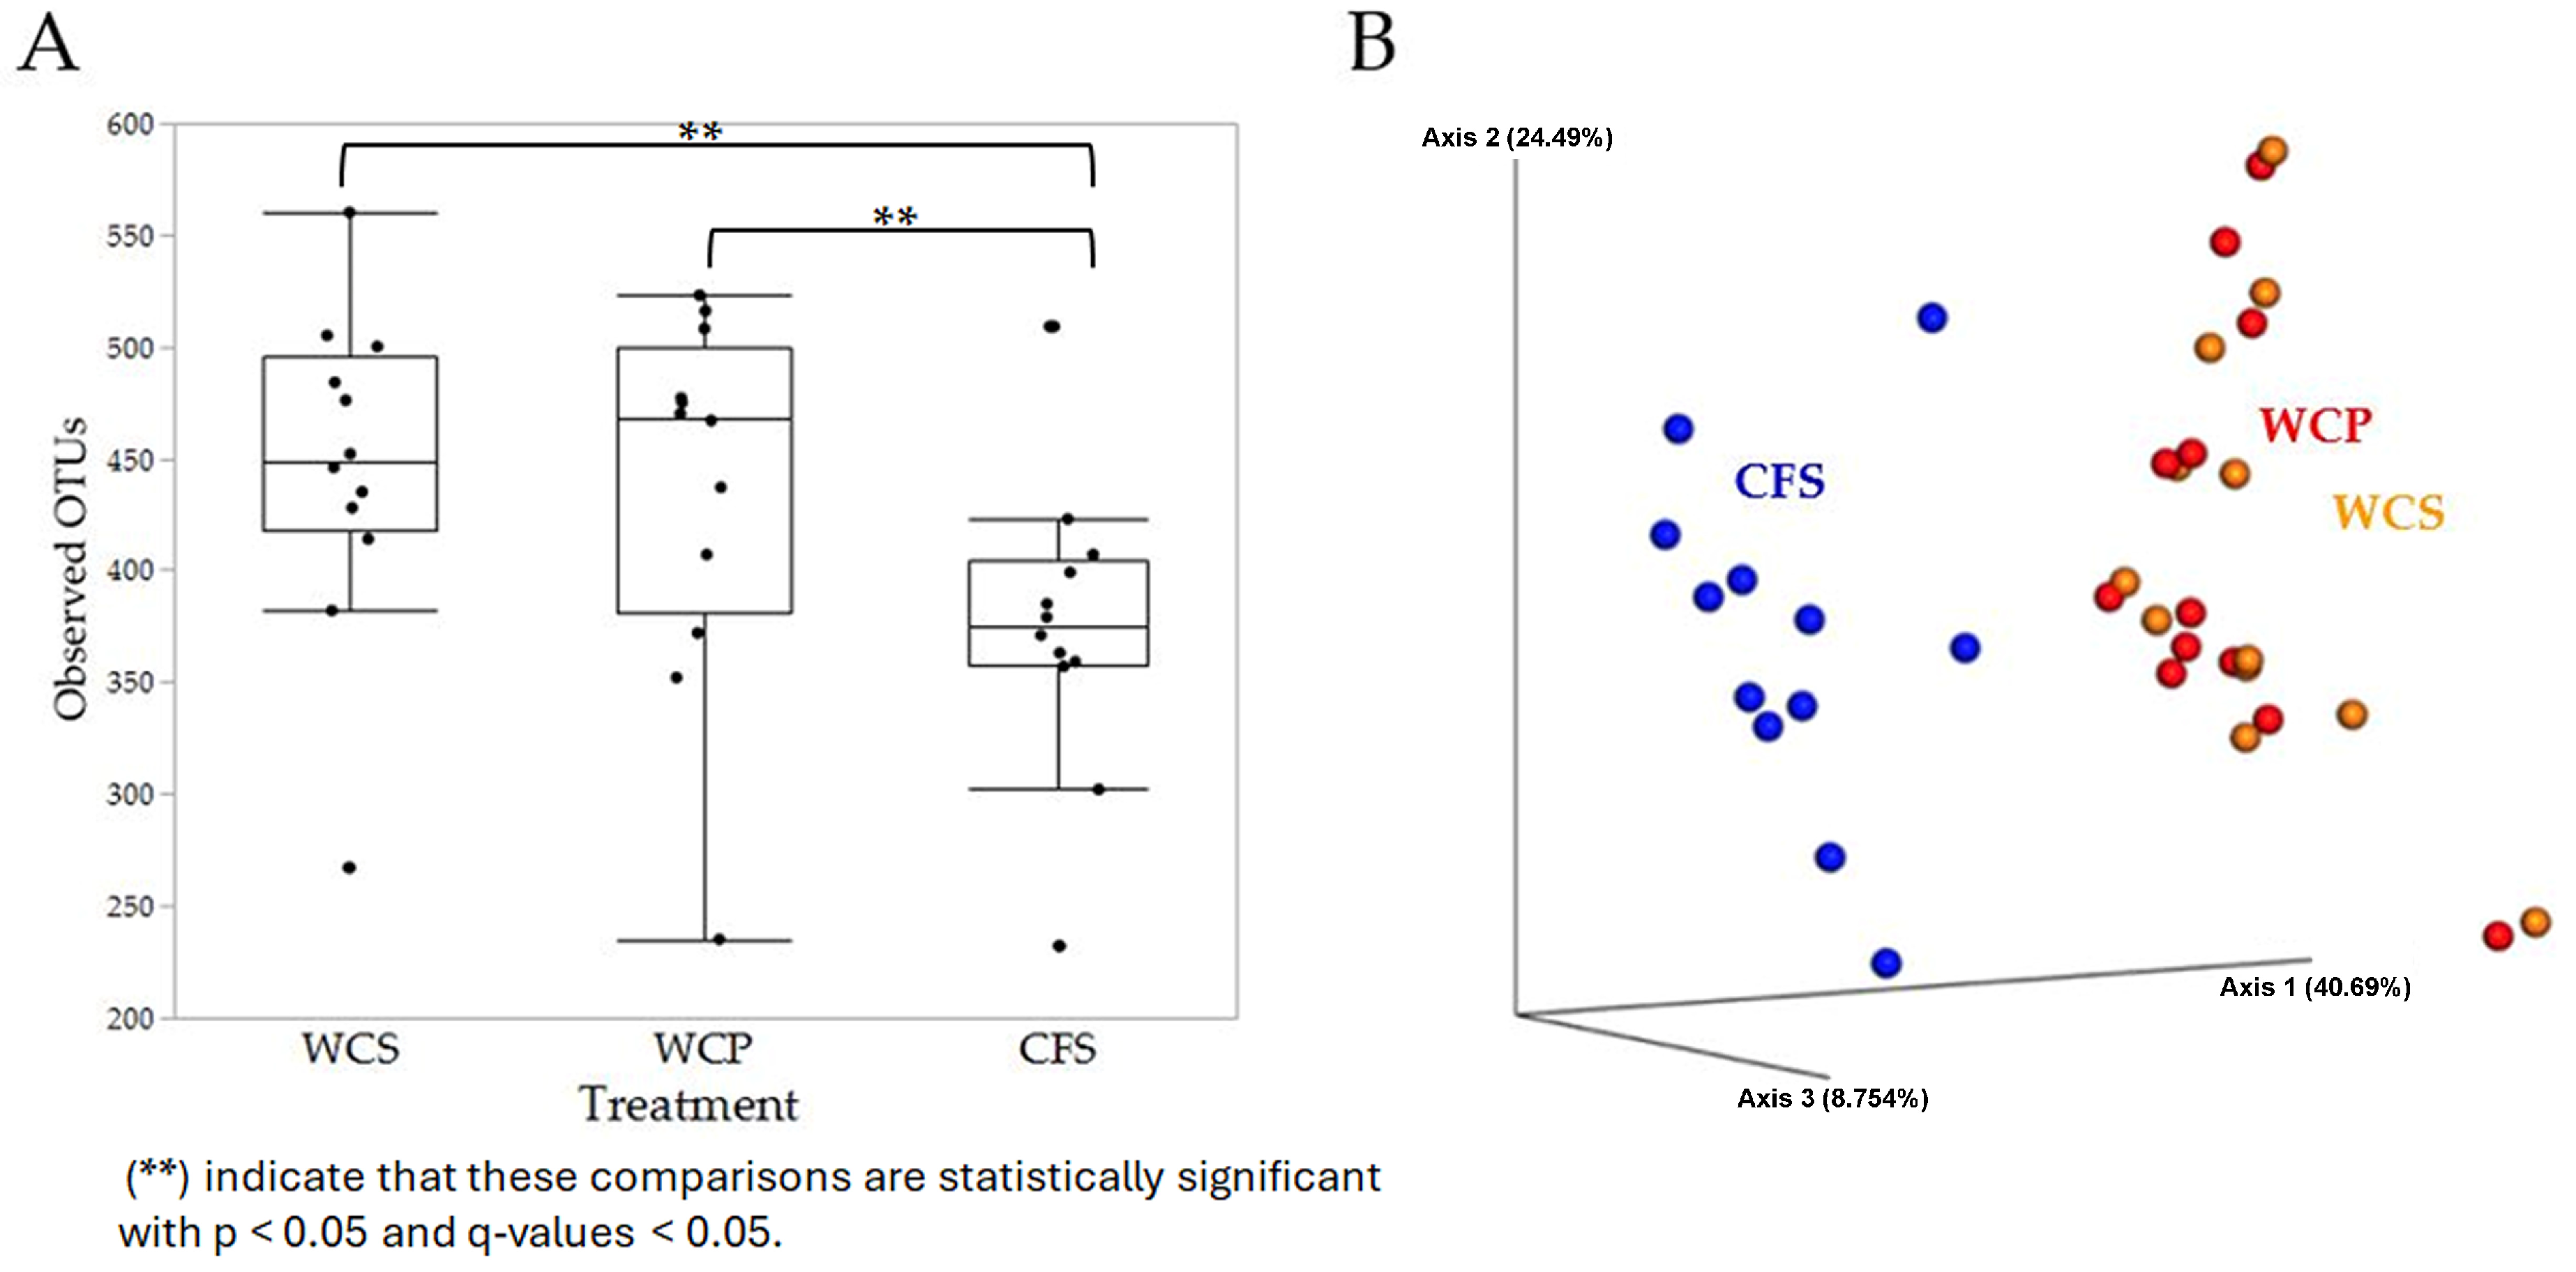
3.2. Alpha and Beta Diversities Reveal Distinct Microbial Communities in Cecal Samples

The α diversity of the microbial communities, measured using the observed OTUs metric, revealed a significant difference between groups, with CFS showing significantly lower α diversity compared to WCS (q < 0.05) (Figure 2A). The β diversity analysis using the Weighted UniFrac distance metric showed significant differences between CFS and the other two groups (WCS and WCP) (q = 0.001 for both). These findings highlight that CFS represents a distinct microbial niche, while WCS and WCP show similar microbial community compositions. The PERMANOVA test confirmed these differences, with large pseudo-F values (14.98 and 15.38) for comparisons between CFS and both WCS and WCP (p = 0.001 for both), supporting the observed community differences. No significant difference was observed between WCS and WCP (p = 0.996, q = 0.996), suggesting that the washing process did not substantially alter the microbial composition. The Principal Coordinate Analysis (PCoA) plot (Figure 2B) visually illustrates the separation of microbial communities in CFS from those in WCS and WCP. WCS and WCP samples clustered closely with no statistically significant differences between them (p > 0.05), supporting the similarity between WCS and WCP in microbial community structure.

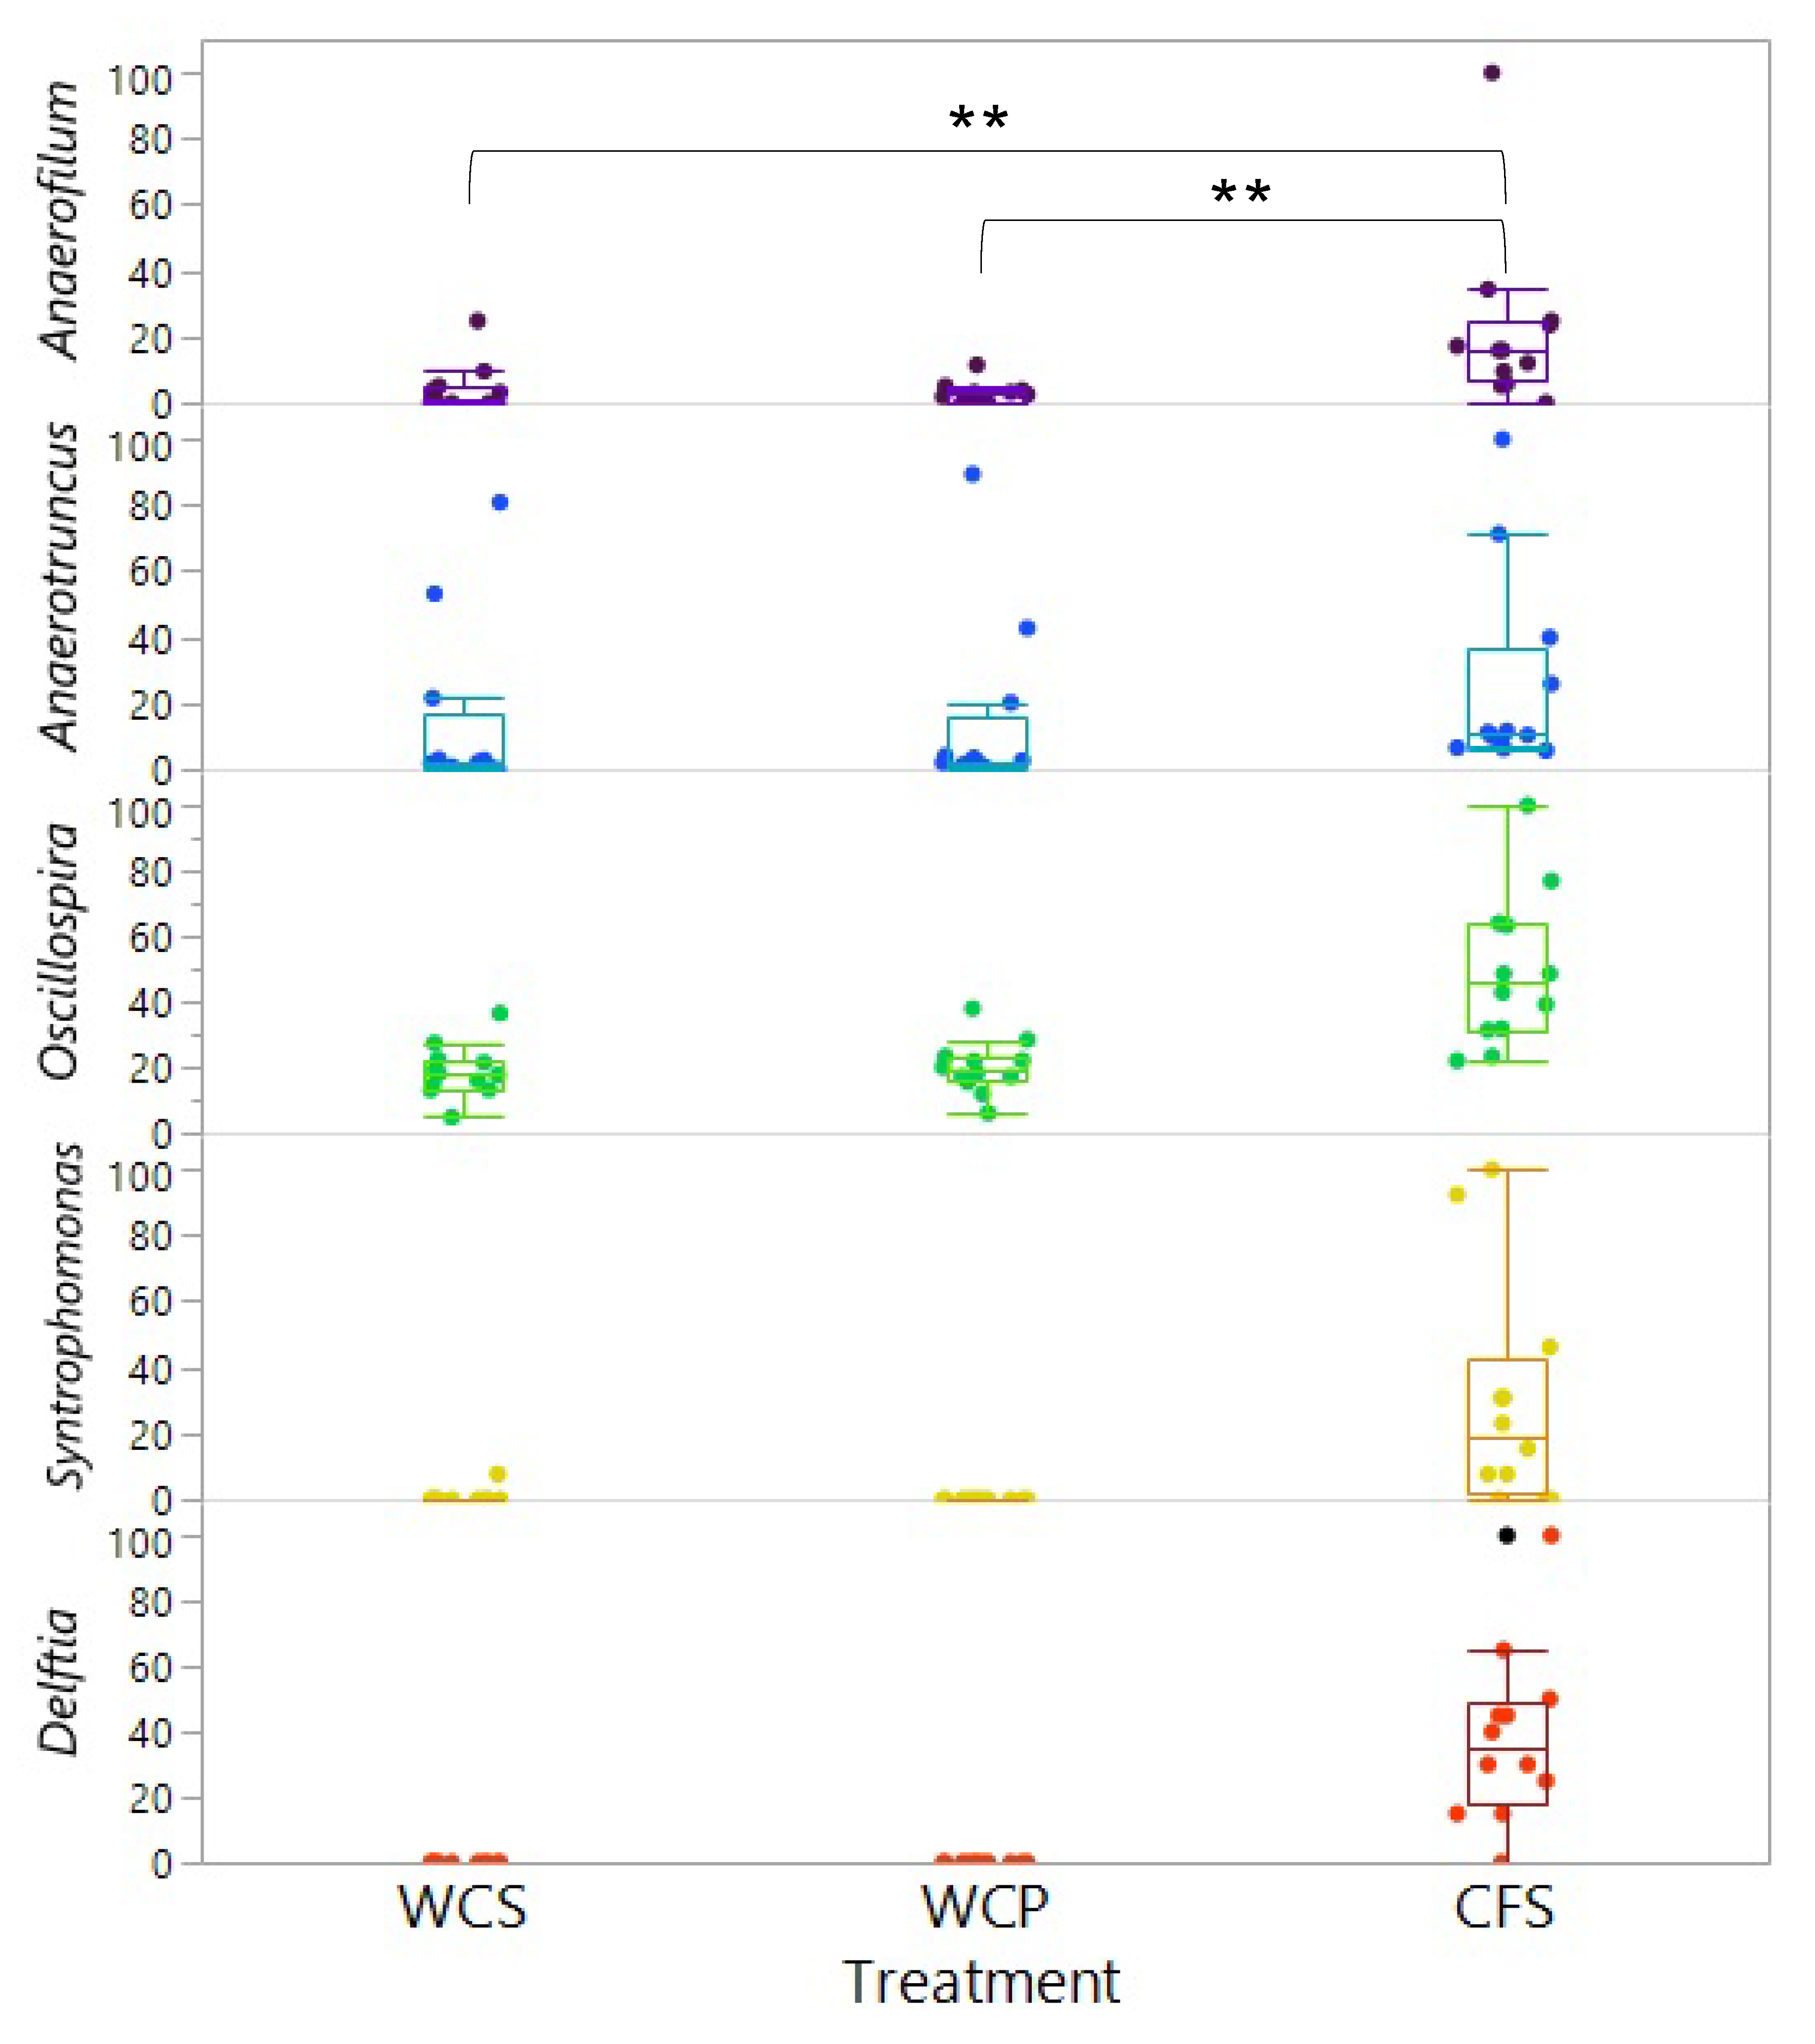
3.3. Identification of Differentially Abundant Taxa Reveals Varied Bacterial Clades Across Cecal Sample Groups

The LEfSe (Linear Discriminant Analysis Effect Size) analysis identified 31 differentially abundant taxonomic clades with an LDA score higher than 2.2 (p < 0.05) across the three groups: WCS, WCP, and CFS (Figure 3A). The number of bacterial taxa significantly enriched in WCS, WCP, and CFS was 11, 7, and 13, respectively. At the phylum level, Firmicutes were more abundant in CFS, while Tenericutes were enriched in WCS. At the class level, Clostridia and Betaproteobacteria were more abundant in CFS, whereas Gammaproteobacteria were significantly enriched in WCP. In contrast, Mollicutes, Deltaproteobacteria, and Erysipelotrichi were more abundant in WCS. At the genus level, Anaerofilum, Anaerotruncus, Oscillospira, Syntrophomonas, and Delftia were significantly enriched in CFS, while Clostridium and Coprobacillus were more abundant in WCS and WCP, respectively. The relative distribution of these five genera significantly enriched in CFS is shown in Figure 4. These distinct taxa may play roles in processes like nutrient cycling, pathogen resistance, or microbial community stability, providing insight into their potential contribution to the microbial dynamics in the chicken cecum. Cumulative Sum Scaling (CSS) normalization was applied to account for compositional biases in the sequencing data, improving the accuracy of diversity measures and ensuring the reliable interpretation of microbial community composition differences.
The LDA scores (>2.2) and p-values (<0.05) from the LEfSe analysis were crucial in identifying distinct taxa that were significantly differentially abundant between the groups, aiding in the identification of functional roles within the microbial communities (see Table S3).

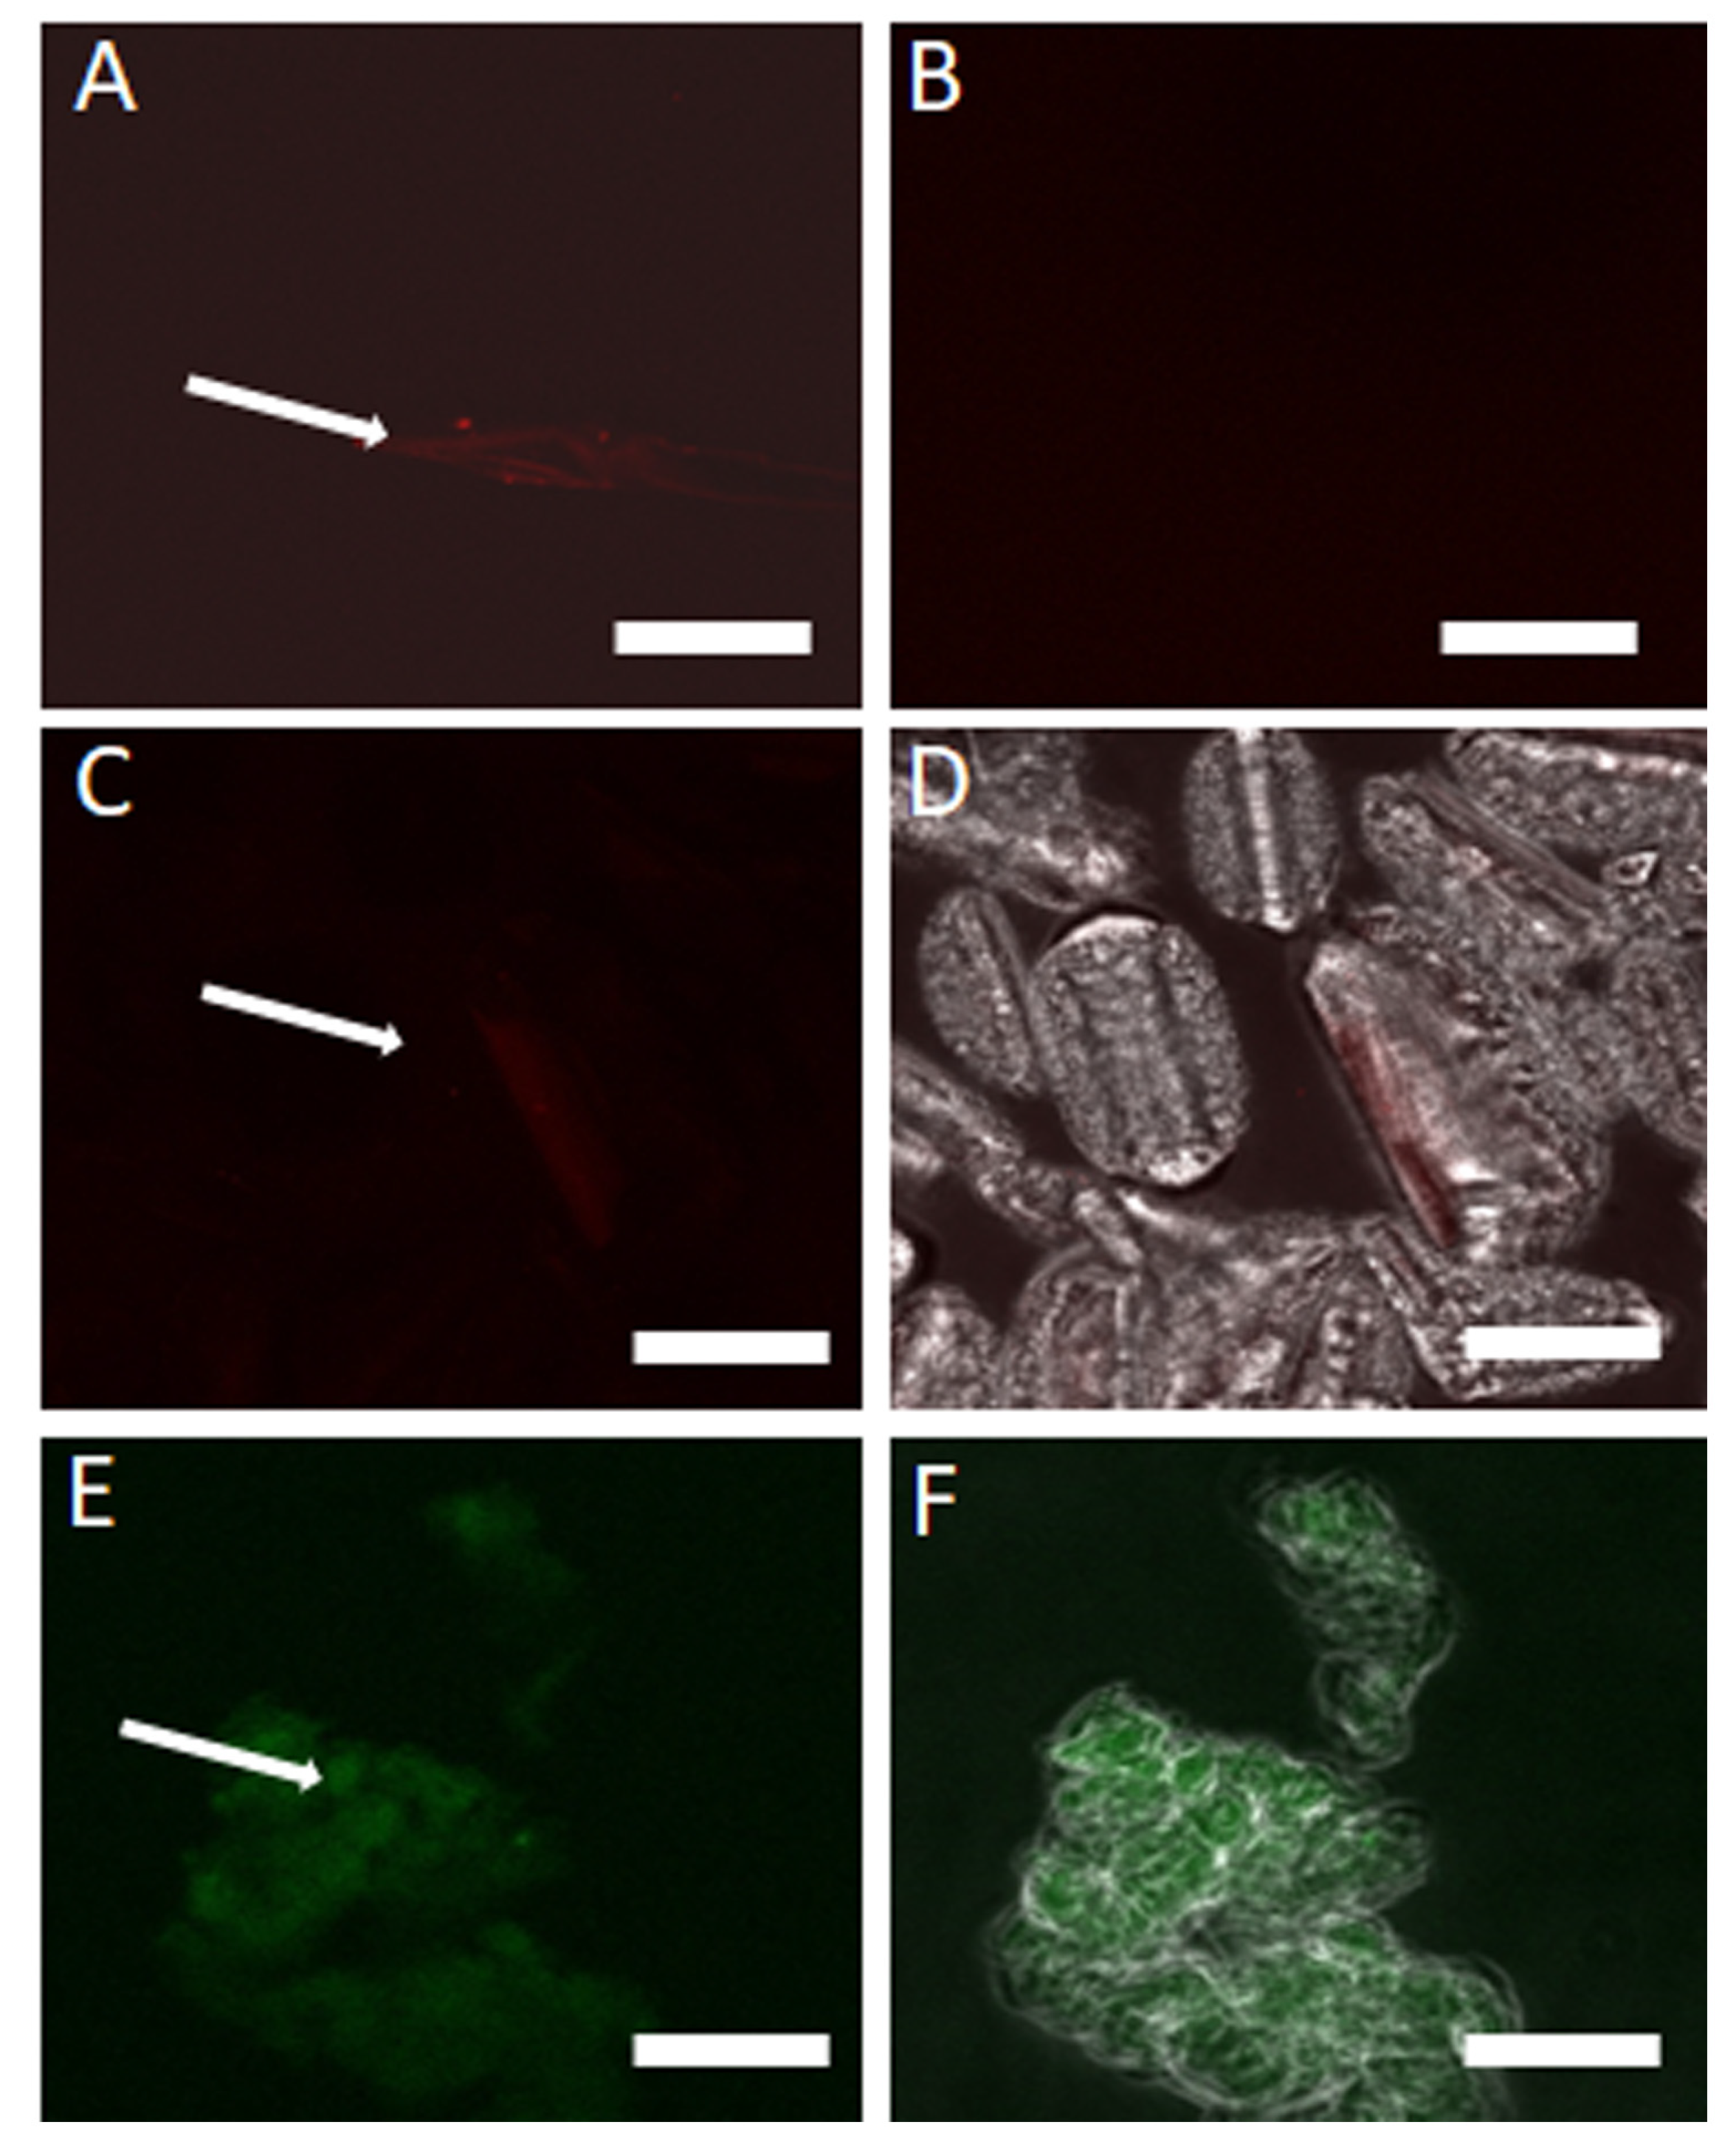
3.4. Verification of eDNA in CFS Using DNase I, DNA Extraction and Staining Methods

Visualization of eDNA in the CFS using the red fluorescence channel revealed aggregated, fragmented fiber structures following filtration and overnight incubation (Figure 5A). After treatment with DNase I, no visible eDNA structure was observed, confirming the enzymatic breakdown of eDNA (Figure 5B).
Upon DNA extraction followed by staining with PI, minimal staining was observed, indicating a low concentration of eDNA. However, when stained with GelGreen, a nucleic acid-specific dye, the extracted eDNA was more distinctly visualized, providing clearer images of the eDNA structures compared to PI (Figure 5C–F).

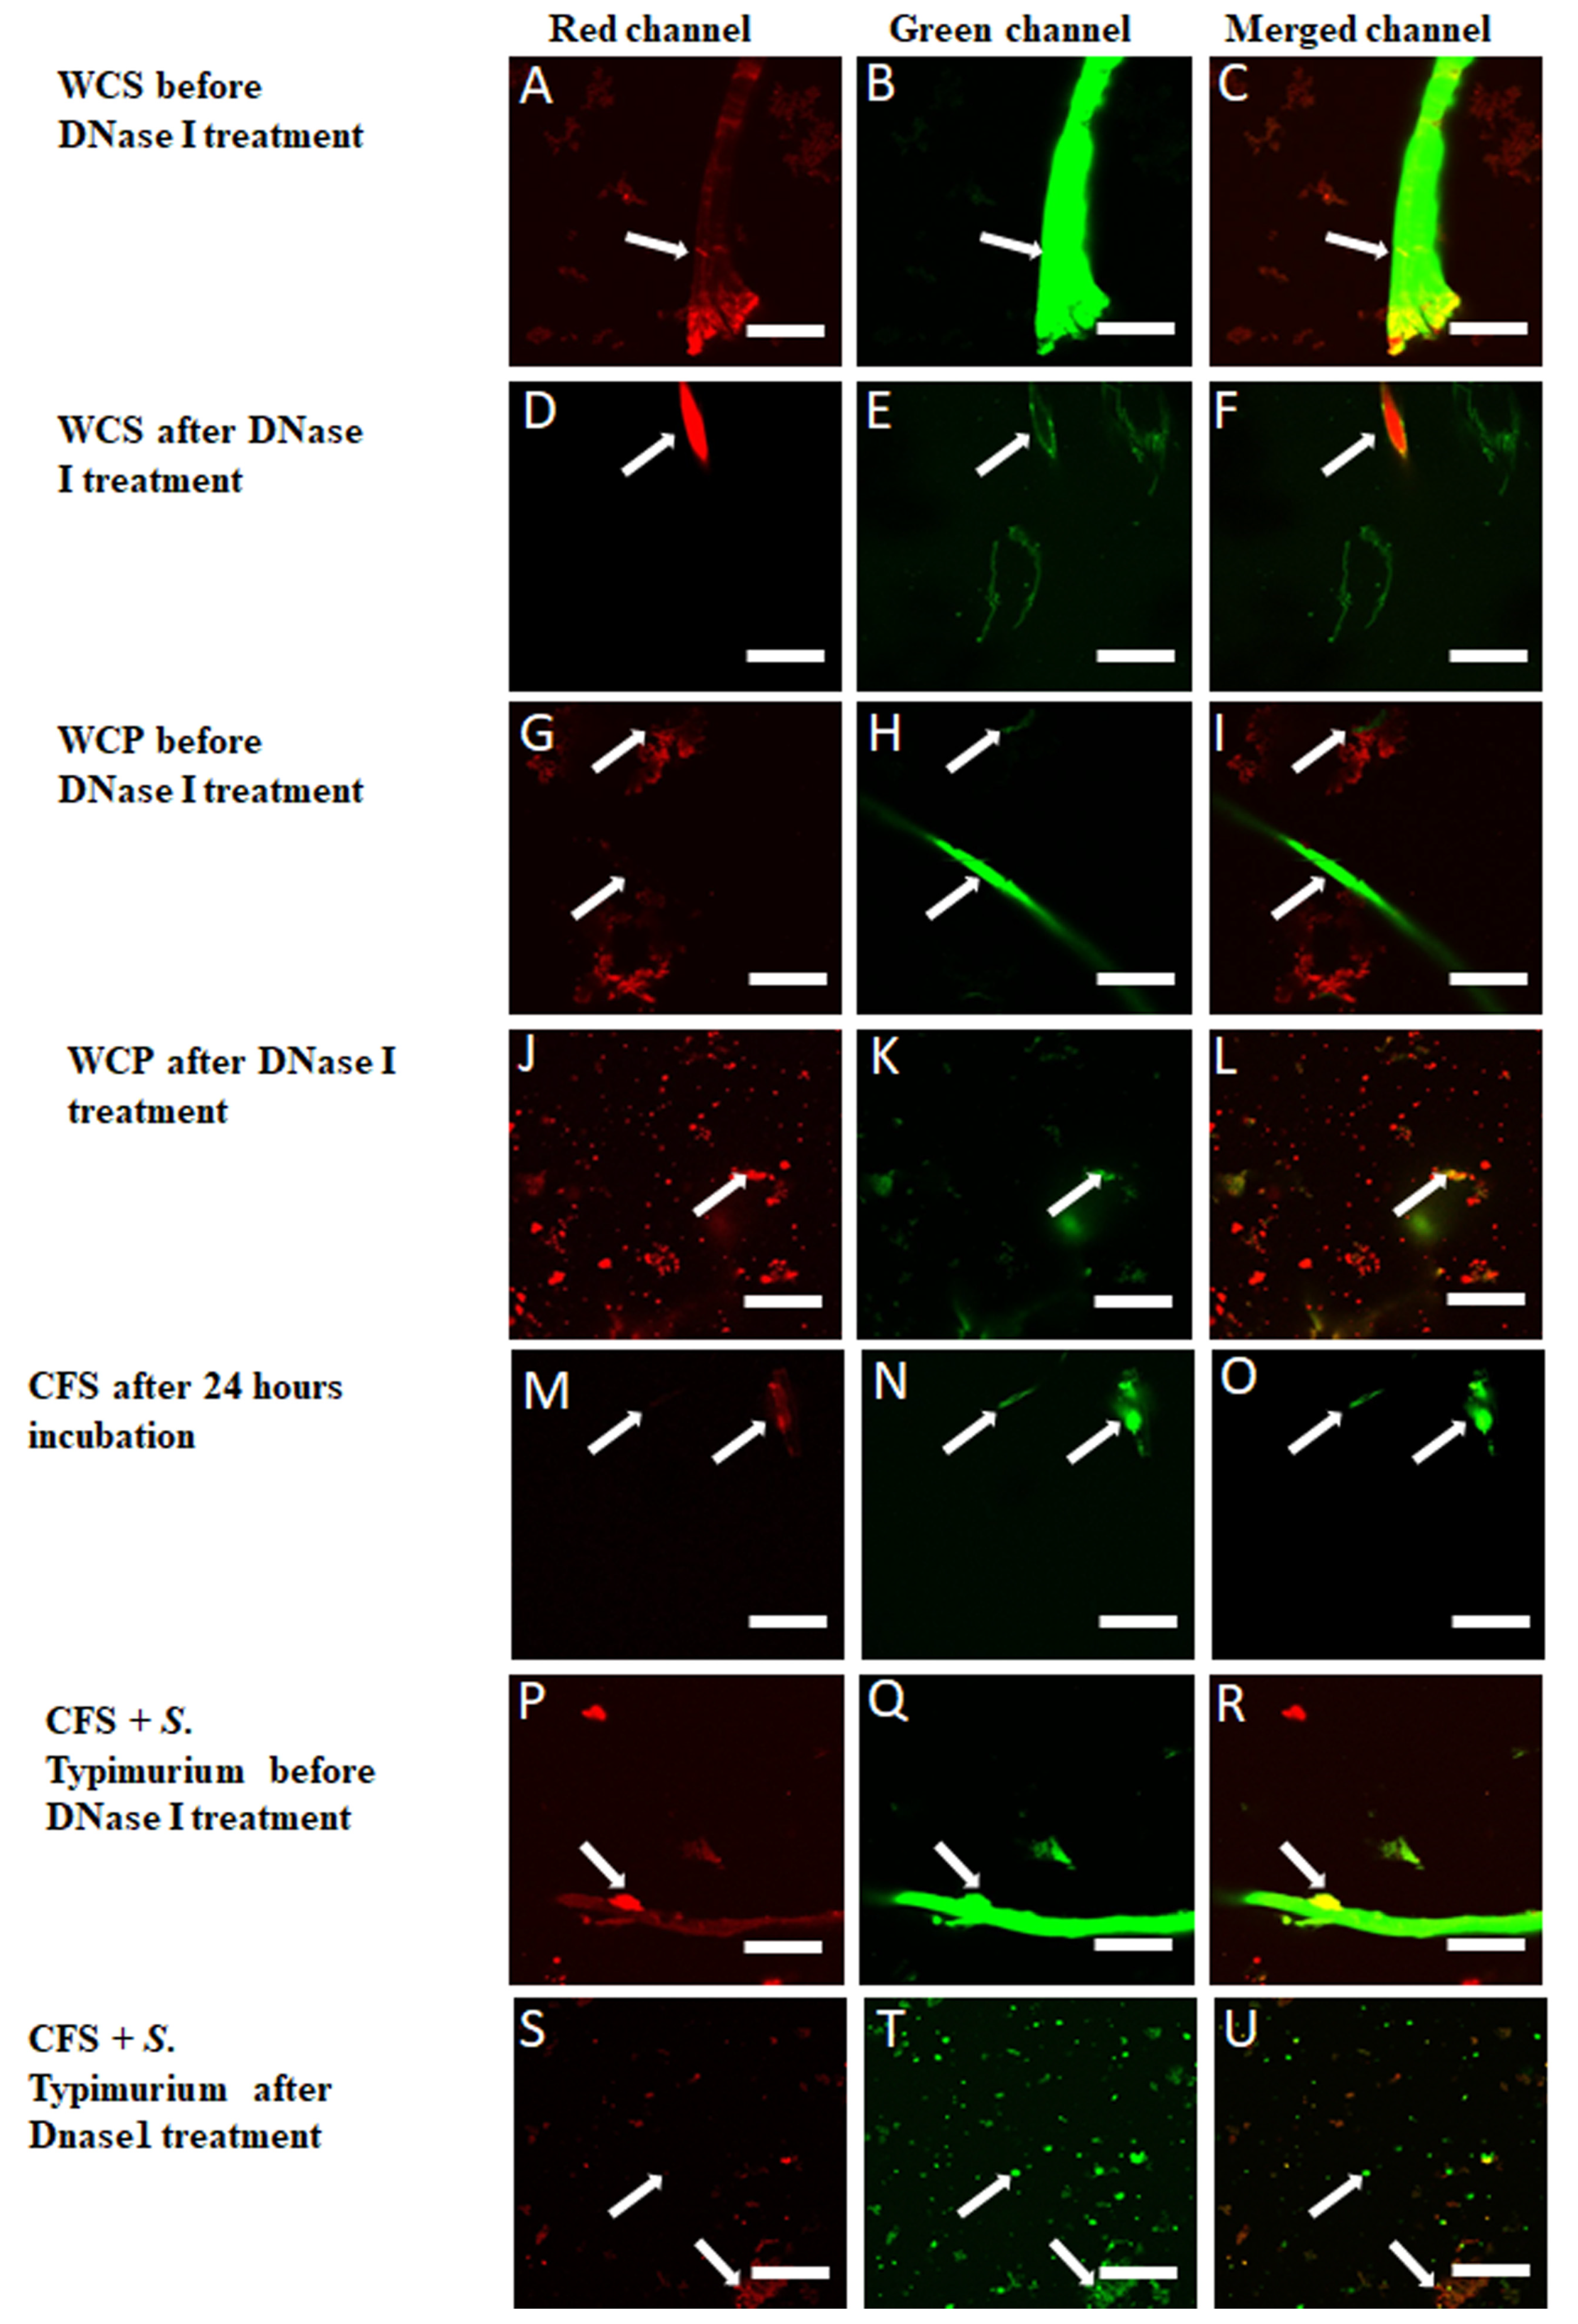
3.5. DNase I Confirmed eDNA Aggregation and Filament Formation in WCS, WCP, CFS and CFS Inoculated with S. Typhimurium

Confocal fluorescence microscopy revealed distinct eDNA structures in WCS, WCP, and CFS inoculated with S. Typhimurium. Staining with PI, GelGreen, and SYTO 9 enabled a clear visualization of these eDNA filaments across all sample preparations. In WCS, eDNA aggregates were observed as filaments consisting of elongated and interconnected fibers. These structures were clearly visible in both the red (PI) and green (GelGreen) fluorescence channels (Figure 6A–C). Some filaments showed colocalization between PI and GelGreen, indicating overlapping nucleic acid signals, while others did not, suggesting distinct eDNA. Following DNase I treatment, the filaments were significantly reduced, confirming the degradation of eDNA (Figure 6D–F). In WCP, fewer and less dense eDNA formations were noted as compared to WCS. Red-stained coagulated eDNA, mixed with cellular debris, was present. Upon DNase I treatment, these filaments dispersed, further confirming eDNA degradation (Figure 6G–L). In CFS, after filtration and anaerobic incubation, non-cellular eDNA strands stained with GelGreen were observed. These strands were distinct from the red-stained aggregated eDNA fragments (Figure 6M–O). When CFS was inoculated with S. Typhimurium and incubated anaerobically for 72 h, a marked increase in eDNA filament formation was observed (Figure 6P–R). Post-DNase I treatment overnight, these filaments disintegrated, leaving green-stained intact cells unaffected, with yellow-stained regions indicating colocalization and suggesting partially compromised cell membranes (Figure 6S–U).

4. Discussion

In this study, we investigated eDNA within the chicken cecal environment for the first time, exploring its presence, structural characteristics, and associated taxa. eDNA has been shown to act as a physical scaffold in biofilms, enhancing their stability and resistance to environmental challenges [40,41,42,43]. This is crucial not only in benign ecosystems but also in pathogenic settings, where it serves as a defense mechanism against host immune responses and antibiotics [44]. While several studies have expanded our understanding of eDNA across diverse ecosystems, from aquatic environments [12,14,45,46] to anaerobic digesters [47], studies on eDNA in animal hosts, particularly poultry, remain limited, despite the critical role of the chicken gut microbiome in nutrient absorption, immune response, and health [3]. In this context, the behavior of S. Tyyphimurium, which has been reported to release eDNA, form biofilms, and activate genes responsible for resistance to host antimicrobial peptide [48], in the gut environment might be influenced by microbiome-released eDNA. By combining molecular techniques with CLSM, this study confirms the presence of eDNA in the chicken cecum and visualizes eDNA filaments within the microbiome, extending our knowledge of its potential impact on microbial interactions within the chicken gut.
We analyzed cecal community DNA prepared using WCS and WCP. WCS, representing a typical gut microbiota preparation method, was expected to contain a small portion of eDNA. WCP was intended to minimize eDNA contamination. As expected, the microbial communities in WCS and WCP were very similar, clustering tightly in PCoA plots based on Weighted UniFrac distances, although they were not identical (Figure 2B). Slightly higher α diversity was observed in WCS as compared to WCP (445.75 ± 21.21 vs. 436.58 ± 24.13 observed OTUs), although the difference was not significant (p > 0.05) (Figure 2A). Negative culture result from CFS samples confirmed the elimination of bacterial cells, ensuring that sequence reads originated solely from eDNA. We identified 13 taxa significantly enriched in CFS compared to WCS and WCP, including Anaerofilum, Oscillospira, Syntrophomonas, and Delftia. Four of these taxa have been reported in normal chicken gut microbiota [49,50,51,52,53,54], while Delftia has been reported in native Chinese yellow-feather broilers as being enriched in conditions of low immunity, such as heat stress, which leads to decreased feed intake [55], and has also been noted to elicit a pro-inflammatory response in immune cells and linked to bacterial translocation in cases of compromised immunity [56]. Anaerofilum and Syntrophomonas are involved in fiber fermentation and short-chain fatty acid production, which are vital for gut health [49,57,58]. Oscillospira, associated with healthy gut function, could potentially utilize eDNA to modulate immune responses, while Delftia, known for degrading complex aromatic compounds, might contribute to microbial resilience [55]. However, further studies are needed to understand the mechanisms of how eDNA is enriched for these taxa and how the eDNA influences microbial community in this environment.
Fluorescence confocal microscopy visualized eDNA in cecal samples, after filteration of CFS through a 0.2 µm filter. The eDNA might have arisen by certain mechanisms, including cell lysis, active secretion, or natural cell death, as reported in other studies [28,59,60,61]. Several studies have reported eDNA to serve as a scaffold for microbial interactions or other biological processes [4,62,63]. Autoaggregation of eDNA has been reported as a mechanism for the formation of these structures [61], often discribed as filaments [21,61] or fibers [21,64] depending on the thickness. While quorum sensing may influence eDNA aggregation [61], further research is needed to establish this as an operating mechanism in the chicken gut. The use of nucleic acid dyes, known to intercalate between the base pairs of DNA, including PI [25] and GelGreen [23], reinforced the identification of eDNA filaments and their extracellular nature. In WCS and WCP, PI specifically bound to eDNA or compromised cells, producing red fluorescence, while GelGreen selectively stained eDNA, excluding iDNA unless the cell membrane was permeable. Direct PI staining of the incubated CFS revealed red fluorescent structures indicative of eDNA (Figure 5A), confirming its extracellular nature consistent with previous findings in microbial biofilms [19,24]. DNase I treatment reduced these filaments (Figure 5B), confirming the enzymatic degradation of eDNA. GelGreen and PI staining also provided clearer visualization of non-cellular DNA remaining after the removal of live cells by filtration and DNA extraction. This confirmed that eDNA, which does not include culturable bacteria, still contained nucleic acids in the chicken cecal environment (Figure 5C–F).
In WCS, distinct aggregated filaments showed co-localization of PI and GelGreen, producing yellow signals [64] (Figure 6A–C), suggesting the presence of eDNA. DNase I treatment further confirmed the extracellular nature of these eDNA in the filaments (Figure 6D–F). In WCP, less dense eDNA formations were observed due to the washing steps (Figure 6G–I), though DNase I treatment still degraded the eDNA filaments (Figure 6J–L). In CFS, eDNA persisted as non-cellular aggregated or fragmented filaments [20] (Figure 6M–O). The inoculation of CFS with S. Typhimurium further enhanced eDNA filament formation under anaerobic conditions (Figure 6P–R), suggesting that S. Typhimurium may actively shed or induce eDNA production, which could be associated with biofilm formation and microbial survival. However, due to a possible multitasking effect [17] and the confounding influence of microbiome eDNA in CFS, we could not definitely establish the origin of the additional eDNA [47,60]. DNase I treatment disintegrated the filaments while S. Typhimurium cells remained intact.
The absence of PI staining, in conjunction with GelGreen staining in some eDNA, provides valuable insights into the source of eDNA. We suggest that PI and Gelgreen bind to the eDNA in dead or compromised cells, from which DNA leak out. The eDNA stained by GelGreen but not PI suggests that there could be eDNA from different sources. This also raises the possibility that some of the PI-stained eDNA released from dead cells could be taken up by other living cells.

5. Conclusions

In this study, we identified distinct microbial taxa in CFS that are enriched in eDNA composition and confirmed the presence of the eDNA in the chicken cecal microbiome for the first time through 16S rRNA gene sequencing and microscopic visualization. The presence of eDNA suggests the distinct role that eDNA might be playing in the chicken gut microbiome. However, further details of the eDNA, including the potential mode of release (e.g., autolysis, active secretion, association with membrane vesicles), the structural forms (e.g., filaments or biofilm), and the biological functions (e.g., biofilm formation, nutrient source, or gene transfer), remain uncertain and require further investigations in the future. In this initial attempt to find evidence for eDNA in chicken ceca, we chose one age group (3 weeks old) of chickens. However, it will be necessary to study various factors impacting gut microbiota on eDNA formation in chicken gut, such as age, diet and rearing conditions, in future studies to understand the broad functional roles of eDNA.

Supplementary Materials

The following supporting information can be downloaded at https://www.mdpi.com/article/10.3390/poultry4010014/s1. Table S1. Ingredients and calculated composition of basal diets. Table S2. DNA concentrations and sterility test results. Table S3. PERMANOVA test between two groups. Figure S1. Optimization of the incubation time for DNase I digestion. Figure S2. Experimental controls for confocal microscopy.

Author Contributions

Conceptualization, D.O., A.Z. and Y.M.K.; methodology, A.Z., D.O. and Y.M.K.; software, D.O. and B.A.; validation, D.O., A.Z. and B.A.; formal analysis, D.O., A.Z., B.A. and P.S.; investigation, D.O., A.Z. and B.A.; resources, Y.M.K.; data curation, B.A., T.J. and D.O.; writing—original draft preparation, T.J., D.O., S.W.K. and A.Z.; writing—review and editing, D.O., S.W.K. and Y.M.K.; visualization, D.O., A.Z., S.W.K. and T.J.; supervision, Y.M.K. and S.W.K.; project administration, Y.M.K. and S.W.K.; funding acquisition, Y.M.K., D.O. and A.Z. contributed equally as first authors. All authors have read and agreed to the published version of the manuscript.

Funding

This work was supported by the USDA National Institute of Food and Agriculture, Agricultural and Food Research Initiative Competitive Program, grant number: 2021-08164. We thank Arkansas High Performance Computing Center, which is funded through multiple National Science Foundation grants and the Arkansas Economic Development Commission and the Arkansas Integrative Metabolic Research Center AIMRC grant, NIH (P20GM139768).

Institutional Review Board Statement

All procedures utilized in the present study were approved by the Institutional Animal Care and Use Committee of the University of Arkansas, Fayetteville, AR (protocol number 21069). The IACUC protocol was approved on 18 September 2020.

Informed Consent Statement

Not applicable.

Data Availability Statement

The raw reads were deposited in the NCBI Sequence Read Archive (SRA) database (Accession Number: PRJNA649528).

Conflicts of Interest

The authors declare that the research was conducted in the absence of any commercial or financial relationships that could be constructed as potential conflicts of interest.

References

  1. Oakley, B.B.; Lillehoj, H.S.; Kogut, M.H.; Kim, W.K.; Maurer, J.J.; Pedroso, A.; Lee, M.D.; Collett, S.R.; Johnson, T.J.; Cox, N.A. The chicken gastrointestinal microbiome. FEMS Microbiol. Lett. 2014, 360, 100–112. [Google Scholar] [CrossRef] [PubMed]
  2. Pan, D.; Yu, Z. Intestinal microbiome of poultry and its interaction with host and diet. Gut Microbes 2014, 5, 108–119. [Google Scholar] [CrossRef] [PubMed]
  3. Kogut, M.H. The gut microbiota and host innate immunity: Regulators of host metabolism and metabolic diseases in poultry? J. Appl. Poult. Res. 2013, 22, 637–646. [Google Scholar] [CrossRef]
  4. Peng, D. Biofilm formation of Salmonella. In Microbial Biofilms-Importance and Applications; IntechOpen Limited: London, UK, 2016; p. 556. [Google Scholar]
  5. Ma, L.; Feng, J.; Zhang, J.; Lu, X. Campylobacter biofilms. Microbiol. Res. 2022, 264, 127149. [Google Scholar] [CrossRef]
  6. Caporaso, J.G.; Lauber, C.L.; Walters, W.A.; Berg-Lyons, D.; Lozupone, C.A.; Turnbaugh, P.J.; Fierer, N.; Knight, R. Global patterns of 16S rRNA diversity at a depth of millions of sequences per sample. Proc. Natl. Acad. Sci. USA 2011, 108, 4516–4522. [Google Scholar] [CrossRef]
  7. Goodrich, J.K.; Di Rienzi, S.C.; Poole, A.C.; Koren, O.; Walters, W.A.; Caporaso, J.G.; Knight, R.; Ley, R.E. Conducting a microbiome study. Cell 2014, 158, 250–262. [Google Scholar] [CrossRef]
  8. Claesson, M.J.; Cusack, S.; O’Sullivan, O.; Greene-Diniz, R.; de Weerd, H.; Flannery, E.; Marchesi, J.R.; Falush, D.; Dinan, T.; Fitzgerald, G. Composition, variability, and temporal stability of the intestinal microbiota of the elderly. Proc. Natl. Acad. Sci. USA 2011, 108, 4586–4591. [Google Scholar] [CrossRef]
  9. Ocejo, M.; Oporto, B.; Hurtado, A. 16S rRNA amplicon sequencing characterization of caecal microbiome composition of broilers and free-range slow-growing chickens throughout their productive lifespan. Sci. Rep. 2019, 9, 2506. [Google Scholar] [CrossRef]
  10. Weinroth, M.D.; Oakley, B.; Ramírez, G.A.; Reyes, A.; Harris, C.E.; Buhr, R.J. 16S rRNA gene-based assessment of common broiler chicken sampling methods: Evaluating intra-flock sample size, cecal pair similarity, and cloacal swab similarity to other alimentary tract locations. Front. Physiol. 2022, 13, 996654. [Google Scholar] [CrossRef]
  11. Vorkapic, D.; Pressler, K.; Schild, S. Multifaceted roles of extracellular DNA in bacterial physiology. Curr. Genet. 2016, 62, 71–79. [Google Scholar] [CrossRef]
  12. Sivalingam, P.; Poté, J.; Prabakar, K. Extracellular DNA (eDNA): Neglected and potential sources of antibiotic resistant genes (ARGs) in the aquatic environments. Pathogens 2020, 9, 874. [Google Scholar] [CrossRef] [PubMed]
  13. Pietramellara, G.; Ascher, J.; Borgogni, F.; Ceccherini, M.T.; Guerri, G.; Nannipieri, P. Extracellular DNA in soil and sediment: Fate and ecological relevance. Biol. Fertil. Soils 2009, 45, 219–235. [Google Scholar] [CrossRef]
  14. Nagler, M.; Insam, H.; Pietramellara, G.; Ascher-Jenull, J. Extracellular DNA in natural environments: Features, relevance and applications. Appl. Microbiol. Biotechnol. 2018, 102, 6343–6356. [Google Scholar] [CrossRef] [PubMed]
  15. Dell’Anno, A.; Danovaro, R. Extracellular DNA plays a key role in deep-sea ecosystem functioning. Science 2005, 309, 2179. [Google Scholar] [CrossRef]
  16. Flemming, H.-C.; Wingender, J.; Szewzyk, U.; Steinberg, P.; Rice, S.A.; Kjelleberg, S. Biofilms: An emergent form of bacterial life. Nat. Rev. Microbiol. 2016, 14, 563–575. [Google Scholar] [CrossRef]
  17. Flemming, H.-C.; van Hullebusch, E.D.; Neu, T.R.; Nielsen, P.H.; Seviour, T.; Stoodley, P.; Wingender, J.; Wuertz, S. The biofilm matrix: Multitasking in a shared space. Nat. Rev. Microbiol. 2023, 21, 70–86. [Google Scholar] [CrossRef]
  18. Whitchurch, C.B.; Tolker-Nielsen, T.; Ragas, P.C.; Mattick, J.S. Extracellular DNA required for bacterial biofilm formation. Science 2002, 295, 1487. [Google Scholar] [CrossRef]
  19. Brown, H.L.; Hanman, K.; Reuter, M.; Betts, R.P.; van Vliet, A.H. Campylobacter jejuni biofilms contain extracellular DNA and are sensitive to DNase I treatment. Front. Microbiol. 2015, 6, 699. [Google Scholar] [CrossRef]
  20. Deng, B.; Ghatak, S.; Sarkar, S.; Singh, K.; Das Ghatak, P.; Mathew-Steiner, S.S.; Roy, S.; Khanna, S.; Wozniak, D.J.; McComb, D.W.; et al. Novel Bacterial Diversity and Fragmented eDNA Identified in Hyperbiofilm-Forming Pseudomonas aeruginosa Rugose Small Colony Variant. iScience 2020, 23, 100827. [Google Scholar] [CrossRef]
  21. Sena-Vélez, M.; Redondo, C.; Graham, J.H.; Cubero, J. Presence of extracellular DNA during biofilm formation by Xanthomonas citri subsp. citri strains with different host range. PLoS ONE 2016, 11, e0156695. [Google Scholar] [CrossRef]
  22. Biotium. Safety Report for GelRed® and GelGreen® A Summary of Mutagenicity and Environmental Safety Test Results from Three Independent Laboratories for the Nucleic Acid Gel Stains GelRed® and GelGreen®. Available online: https://biotium.com/wp-content/uploads/2013/07/GelRed-and-GelGreen-Safety-Report.pdf (accessed on 12 December 2024).
  23. Guzaev, M.; Li, X.; Park, C.; Leung, W.-Y.; Roberts, L. Comparison of Nucleic Acid Gel Stains, Cell permeability, Safety, and Sensitivity of Ethidium Bromide Alternatives. Available online: https://biotium.com/wp-content/uploads/2017/02/Gel-Stains-Comparison.pdf (accessed on 17 December 2024).
  24. Deng, Y.; Wang, L.; Chen, Y.; Long, Y. Optimization of staining with SYTO 9/propidium iodide: Interplay, kinetics and impact on Brevibacillus brevis. BioTechniques 2020, 69, 88–98. [Google Scholar] [CrossRef] [PubMed]
  25. Stocks, S. Mechanism and use of the commercially available viability stain, BacLight. Cytom. Part A J. Int. Soc. Anal. Cytol. 2004, 61, 189–195. [Google Scholar] [CrossRef] [PubMed]
  26. Vilain, S.; Pretorius, J.M.; Theron, J.; Brözel, V.S. DNA as an adhesin: Bacillus cereus requires extracellular DNA to form biofilms. Appl. Environ. Microbiol. 2009, 75, 2861–2868. [Google Scholar] [CrossRef] [PubMed]
  27. Samarth, D.P.; Kwon, Y.M. Horizontal genetic exchange of chromosomally encoded markers between Campylobacter jejuni cells. PLoS ONE 2020, 15, e0241058. [Google Scholar] [CrossRef]
  28. Panlilio, H.; Rice, C.V. The role of extracellular DNA in the formation, architecture, stability, and treatment of bacterial biofilms. Biotechnol. Bioeng. 2021, 118, 2129–2141. [Google Scholar] [CrossRef]
  29. Gloag, E.S.; Turnbull, L.; Huang, A.; Vallotton, P.; Wang, H.; Nolan, L.M.; Mililli, L.; Hunt, C.; Lu, J.; Osvath, S.R. Self-organization of bacterial biofilms is facilitated by extracellular DNA. Proc. Natl. Acad. Sci. USA 2013, 110, 11541–11546. [Google Scholar] [CrossRef]
  30. Hayta, E.N.; Ertelt, M.J.; Kretschmer, M.; Lieleg, O. Bacterial materials: Applications of natural and modified biofilms. Adv. Mater. Interfaces 2021, 8, 2101024. [Google Scholar] [CrossRef]
  31. Callahan, B.J.; McMurdie, P.J.; Rosen, M.J.; Han, A.W.; Johnson, A.J.A.; Holmes, S.P. DADA2: High-resolution sample inference from Illumina amplicon data. Nat. Methods 2016, 13, 581–583. [Google Scholar] [CrossRef]
  32. Flemming, H.-C.; Wuertz, S. Bacteria and archaea on Earth and their abundance in biofilms. Nat. Rev. Microbiol. 2019, 17, 247–260. [Google Scholar] [CrossRef]
  33. Zymo, R. Quick-DNA™ Fecal/Soil Microbe Miniprep Kit Protocol. Available online: https://files.zymoresearch.com/protocols/_d6010_quick-dna_fecalsoil_microbe_miniprep_kit.pdf (accessed on 12 December 2024).
  34. Thompson, L.R.; Sanders, J.G.; McDonald, D.; Amir, A.; Ladau, J.; Locey, K.J.; Prill, R.J.; Tripathi, A.; Gibbons, S.M.; Ackermann, G.; et al. A communal catalogue reveals Earth’s multiscale microbial diversity. Nature 2017, 551, 457–463. [Google Scholar] [CrossRef]
  35. Parada, A.E.; Needham, D.M.; Fuhrman, J.A. Every base matters: Assessing small subunit rRNA primers for marine microbiomes with mock communities, time series and global field samples. Environ. Microbiol. 2016, 18, 1403–1414. [Google Scholar] [CrossRef] [PubMed]
  36. Quince, C.; Lanzen, A.; Davenport, R.J.; Turnbaugh, P.J. Removing noise from pyrosequenced amplicons. BMC Bioinform. 2011, 12, 38. [Google Scholar] [CrossRef] [PubMed]
  37. Bolyen, E.; Rideout, J.R.; Dillon, M.R.; Bokulich, N.A.; Abnet, C.C.; Al-Ghalith, G.A.; Alexander, H.; Alm, E.J.; Arumugam, M.; Asnicar, F. Reproducible, interactive, scalable and extensible microbiome data science using QIIME 2. Nat. Biotechnol. 2019, 37, 852–857. [Google Scholar] [CrossRef] [PubMed]
  38. Segata, N.; Izard, J.; Waldron, L.; Gevers, D.; Miropolsky, L.; Garrett, W.S.; Huttenhower, C. Metagenomic biomarker discovery and explanation. Genome Biol. 2011, 12, R60. [Google Scholar] [CrossRef]
  39. Olsen, A.; Ehrhardt, C.J.; Yadavalli, V.K. Nanoscale visualization of extracellular DNA on cell surfaces. Anal. Sci. Adv. 2020, 1, 194–202. [Google Scholar] [CrossRef]
  40. Campoccia, D.; Montanaro, L.; Arciola, C.R. Extracellular DNA (eDNA). A Major Ubiquitous Element of the Bacterial Biofilm Architecture. Int. J. Mol. Sci. 2021, 22, 9100. [Google Scholar] [CrossRef]
  41. Secchi, E.; Savorana, G.; Vitale, A.; Eberl, L.; Stocker, R.; Rusconi, R. The structural role of bacterial eDNA in the formation of biofilm streamers. Proc. Natl. Acad. Sci. USA 2022, 119, e2113723119. [Google Scholar] [CrossRef]
  42. Das, T.; Sharma, P.K.; Busscher, H.J.; Van Der Mei, H.C.; Krom, B.P. Role of extracellular DNA in initial bacterial adhesion and surface aggregation. Appl. Environ. Microbiol. 2010, 76, 3405–3408. [Google Scholar] [CrossRef]
  43. Okshevsky, M.; Meyer, R.L. The role of extracellular DNA in the establishment, maintenance and perpetuation of bacterial biofilms. Crit. Rev. Microbiol. 2015, 41, 341–352. [Google Scholar] [CrossRef]
  44. Shree, P.; Singh, C.K.; Sodhi, K.K.; Surya, J.N.; Singh, D.K. Biofilms: Understanding the structure and contribution towards bacterial resistance in antibiotics. Med. Microecol. 2023, 16, 100084. [Google Scholar] [CrossRef]
  45. Amarasiri, M.; Furukawa, T.; Nakajima, F.; Sei, K. Pathogens and disease vectors/hosts monitoring in aquatic environments: Potential of using eDNA/eRNA based approach. Sci. Total Environ. 2021, 796, 148810. [Google Scholar] [CrossRef] [PubMed]
  46. Mauvisseau, Q.; Harper, L.R.; Sander, M.; Hanner, R.H.; Kleyer, H.; Deiner, K. The multiple states of environmental DNA and what is known about their persistence in aquatic environments. Environ. Sci. Technol. 2022, 56, 5322–5333. [Google Scholar] [CrossRef] [PubMed]
  47. Nagler, M.; Podmirseg, S.M.; Mayr, M.; Ascher-Jenull, J.; Insam, H. The masking effect of extracellular DNA and robustness of intracellular DNA in anaerobic digester NGS studies: A discriminatory study of the total DNA pool. Mol. Ecol. 2021, 30, 438–450. [Google Scholar] [CrossRef] [PubMed]
  48. Johnson, L.; Horsman, S.R.; Charron-Mazenod, L.; Turnbull, A.L.; Mulcahy, H.; Surette, M.G.; Lewenza, S. Extracellular DNA-induced antimicrobial peptide resistance in Salmonella enterica serovar Typhimurium. BMC Microbiol. 2013, 13, 115. [Google Scholar] [CrossRef]
  49. Kairmi, S.H.; Abdelaziz, K.; Spahany, H.; Astill, J.; Trott, D.; Wang, B.; Wang, A.; Parkinson, J.; Sharif, S. Intestinal microbiome profiles in broiler chickens raised without antibiotics exhibit altered microbiome dynamics relative to conventionally raised chickens. PLoS ONE 2024, 19, e0301110. [Google Scholar] [CrossRef]
  50. Zhang, Y.; Liu, Y.; Li, J.; Xing, T.; Jiang, Y.; Zhang, L.; Gao, F. Dietary resistant starch modifies the composition and function of caecal microbiota of broilers. J. Sci. Food Agric. 2020, 100, 1274–1284. [Google Scholar] [CrossRef]
  51. Kumar, S.; Shang, Y.; Kim, W.K. Insight into dynamics of gut microbial community of broilers fed with fructooligosaccharides supplemented low calcium and phosphorus diets. Front. Vet. Sci. 2019, 6, 95. [Google Scholar] [CrossRef]
  52. Wang, J.; Singh, A.; Kong, F.; Kim, W. Effect of almond hulls as an alternative ingredient on broiler performance, nutrient digestibility, and cecal microbiota diversity. Poult. Sci. 2021, 100, 100853. [Google Scholar] [CrossRef]
  53. Molnár, A.; Such, N.; Farkas, V.; Pál, L.; Menyhárt, L.; Wágner, L.; Husvéth, F.; Dublecz, K. Effects of wheat bran and Clostridium butyricum supplementation on cecal microbiota, short-chain fatty acid concentration, pH and histomorphometry in broiler chickens. Animals 2020, 10, 2230. [Google Scholar] [CrossRef]
  54. Liu, T.; Tang, J.; Feng, F. Medium-chain α-monoglycerides improves productive performance and egg quality in aged hens associated with gut microbiota modulation. Poult. Sci. 2020, 99, 7122–7132. [Google Scholar] [CrossRef]
  55. Jin, Y.Y.; Guo, Y.; Zheng, C.T.; Liu, W.C. Effect of heat stress on ileal microbial community of indigenous yellow-feather broilers based on 16S rRNA gene sequencing. Vet. Med. Sci. 2022, 8, 642–653. [Google Scholar] [CrossRef] [PubMed]
  56. McNeill, R.M.; DeFoor, W.M.; Goller, C.C.; Ott, L.E. Delftia spp elicit a pro-inflammatory response in monocytes. J. Young Investig. 2015, 29, 6. [Google Scholar]
  57. Wofford, N.Q.; Beaty, P.S.; McInerney, M.J. Preparation of cell-free extracts and the enzymes involved in fatty acid metabolism in Syntrophomonas wolfei. J. Bacteriol. 1986, 167, 179–185. [Google Scholar] [CrossRef] [PubMed]
  58. Qiu, M.; Hu, J.; Peng, H.; Li, B.; Xu, J.; Song, X.; Yu, C.; Zhang, Z.; Du, X.; Bu, G. Research Note: The gut microbiota varies with dietary fiber levels in broilers. Poult. Sci. 2022, 101, 101922. [Google Scholar] [CrossRef]
  59. Campoccia, D.; Montanaro, L.; Arciola, C.R. Tracing the origins of extracellular DNA in bacterial biofilms: Story of death and predation to community benefit. Biofouling 2021, 37, 1022–1039. [Google Scholar] [CrossRef]
  60. Sharma, D.K.; Rajpurohit, Y.S. Multitasking functions of bacterial extracellular DNA in biofilms. J. Bacteriol. 2024, 206, e00006–e00024. [Google Scholar] [CrossRef]
  61. Dogsa, I.; Kostanjšek, R.; Stopar, D. eDNA Provides a Scaffold for Autoaggregation of B. subtilis in Bacterioplankton Suspension. Microorganisms 2023, 11, 332. [Google Scholar] [CrossRef]
  62. Dominiak, D.M.; Nielsen, J.L.; Nielsen, P.H. Extracellular DNA is abundant and important for microcolony strength in mixed microbial biofilms. Environ. Microbiol. 2011, 13, 710–721. [Google Scholar] [CrossRef]
  63. Ibanez de Aldecoa, A.L.; Zafra, O.; González-Pastor, J.E. Mechanisms and regulation of extracellular DNA release and its biological roles in microbial communities. Front. Microbiol. 2017, 8, 1390. [Google Scholar] [CrossRef]
  64. Peng, N.; Cai, P.; Mortimer, M.; Wu, Y.; Gao, C.; Huang, Q. The exopolysaccharide–eDNA interaction modulates 3D architecture of Bacillus subtilis biofilm. BMC Microbiol. 2020, 20, 115. [Google Scholar] [CrossRef]
Figure 1. Microbiota composition of chicken cecal samples in three different preparations. Chicken cecal samples were processed using three distinct methods: WCS, WCP, and CFS. (A) The distribution of microbial taxa at the phylum level; (B) the genus-level composition, showcasing the diverse bacterial communities extracted from each preparation method.
Poultry 04 00014 g001
Figure 2. Alpha and beta diversity differences in chicken cecal microbiota across different sample preparations. This figure presents the diversity analyses of chicken cecal contents processed via three methods: WCS, WCP, and CFS. (A) The alpha diversity based on the observed OTUs metric, highlighting variations in microbial richness among the preparations. (B) The beta diversity, utilizing the Weighted UniFrac distance metric to depict the differences in microbial community composition between the sample groups.
Poultry 04 00014 g002
Figure 3. Differential abundance of microbial taxa across cecal sample preparations. This figure summarizes the results from a Linear discriminant analysis Effect Size (LEfSe) analysis to identify differentially abundant taxa within chicken cecal microbiota processed in three distinct preparations: WCS, WCP, and CFS. (A) Quantification of the differentially abundant features in each preparation, with 11, 7, and 13 significant features in WCS, WCP, and CFS, respectively, each exceeding an LDA score of 2.2. (B) Presentation of a cladogram that visualizes the taxonomic levels at which these differences occur, illustrating the distinct microbial signatures of each sample type.
Poultry 04 00014 g003
Figure 4. Relative abundance of genera enriched in eDNA across different chicken cecal preparations. This figure shows the relative abundance of the five genera that were significantly enriched (p < 0.05) in eDNA across three distinct chicken cecal sample preparations: WCS, WCP, and CFS. No significant difference was observed between WCS and WCP (p = 0.996, q = 0.996). ** indicates significant difference at p < 0.05.
Poultry 04 00014 g004
Figure 5. Visualization and degradation of eDNA in Cell-Free Supernatant (CFS) using Propidium Iodide (PI) and GelGreen stains before and after DNase I treatment and following DNA extraction. (A) PI-stained aggregated eDNA in CFS before DNase I treatment. (B) DNase I treatment disperses eDNA, indicating degradation. (C) PI-stained eDNA after extraction shows minimal staining. (D) Red and contrast channels reveal fragmented eDNA with faint PI staining. (E) GelGreen-stained eDNA shows clearer, less fragmented structures. (F) Green and contrast channels confirm eDNA presence with GelGreen staining. Scale bar = 50 μm.
Poultry 04 00014 g005
Figure 6. Aggregation and filament formation of eDNA in WCS (Whole Culture Supernatant), WCP (Washed Cell Pellet), incubated CFS, and CFS (Cell-Free Supernatant) inoculated with S. Typhimurium. (AC): Aggregated eDNA in WCS shows structure visualized using PI (A) and GelGreen (B), with yellow co-localization in merged channel (C) confirming eDNA presence. (DF): DNase I treatment of WCS reduces eDNA filaments and co-localization. (GI): WCP displays dense, red coagulated eDNA and less dense, green-stained filaments (H), with no co-localization (I). (JL): DNase I treatment of WCP disperses red coagulated eDNA (J) and disintegrates green-stained filaments (KL). (MO): Post-filtration through 1.2 μm, 0.45 μm, and 0.2 μm filters and anaerobic incubation for 24 h at 37 °C; CFS lacks cellular-shaped structures stained with GelGreen and PI. However, aggregated red- and green-stained eDNA fragments (M,N) and green-stained eDNA strands are visible. Nucleic acid co-staining confirms the presence of eDNA. (PR): A network of eDNA filaments like those in WCS (AC) was observed in CFS inoculated with S. Typhimurium after anaerobic incubation for 72 h at 37 °C and stained with SYTO 9 and PI. (SU): DNase I treatment disperses eDNA filaments, with yellow regions indicating partially compromised cell membranes. Intact cells remain unaffected. Scale bar = 50 μm.
Poultry 04 00014 g006
Disclaimer/Publisher’s Note: The statements, opinions and data contained in all publications are solely those of the individual author(s) and contributor(s) and not of MDPI and/or the editor(s). MDPI and/or the editor(s) disclaim responsibility for any injury to people or property resulting from any ideas, methods, instructions or products referred to in the content.

