Proceeding Paper

Drone-Based Multispectral Imaging for Precision Monitoring of Crop Growth Variables †

by
Devanakonda Venkata Sai Chakradhar Reddy
1,*,
Rabi N. Sahoo
1,
Tarun Kondraju
1,
Rajan G. Rejith
1,
Rajeev Ranjan
1,
Amrita Bhandari
1,
Ali Moursy
2,
Subhash Chandra Tripathi
3 and
Nitesh Kumar
3
1
Division of Agricultural Physics, Indian Council of Agricultural Research (ICAR), Indian Agricultural Research Institute (IARI), Pusa, New Delhi 110012, India
2
Soil and Water Department, Faculty of Agriculture, Sohag University, Sohag 82524, Egypt
3
Indian Council of Agricultural Research (ICAR), Indian Institute of Wheat and Barley Research, Karnal 132001, India
*
Author to whom correspondence should be addressed.
Presented at the 4th International Electronic Conference on Agronomy, 2–5 December 2024; Available online: https://sciforum.net/event/IECAG2024.
Biol. Life Sci. Forum 2025, 41(1), 10; https://doi.org/10.3390/blsf2025041010
Published: 23 May 2025

Abstract

:
This study aimed to demonstrate the efficacy of drone-assisted crop monitoring in precision agriculture by evaluating the relationships between the NDVI, leaf area index (LAI), and leaf nitrogen content (LNC) in three wheat varieties (DBW-187, HD-3086, PBW-826) under eight nitrogen treatments (N0–N210). The NDVI was derived from drone-based multispectral imagery at the flowering (90 DAS) and grain-filling (108 DAS) stages. Strong correlations were observed between the NDVI, LAI, and LNC, with the R2 values improving from 0.78–0.86 at flowering to 0.88–0.90 at grain filling. These findings highlight the potential of drone-derived indices for efficient crop monitoring, resource use optimization, and yield prediction in precision agriculture.

1. Introduction

Precision agriculture represents the forefront of modern farming. It combines advanced technologies and agronomic practices to optimize resource use, maximize yields, and ensure sustainability. These approaches are of critical necessity while managing wheat and other food crops that are crucial for sustaining the growing population of the world with diminishing resources. Precision agriculture in terms of these crops can only be achieved when their condition is estimated with the utmost accuracy. Several works have used crop biophysical parameters such as the leaf area index (LAI) and leaf nitrogen content (LNC) to monitor the precise crop condition, growth and productivity with high accuracy [1,2]. The current study also used these variables for assessing the wheat crop condition, as they are among the best indicators of crop health.
Traditional methods for assessing these parameters involve destructive sampling and are often labor-intensive and time-consuming, limiting their feasibility for large-scale applications. Recently, UAV-based remote sensing has revolutionized crop health monitoring. A UAV provides high-resolution real-time data that can capture the spatial variability within fields better, offering an efficient alternative to conventional methods. Guebsi et al., in their comprehensive review, highlight the transformative potential of drones equipped with multispectral sensors in monitoring crop growth and detecting the early signs of stress or diseases, enabling precise interventions [3]. Due to these advantages, several works have already used UAV data for monitoring and assessing crop health using the related imagery. In this study too, a similar dataset was used to read the crop conditions.
Further, recent works demonstrate various innovative approaches to estimating crop growth using the LNC and LAI, particularly through remote-sensing technologies [4,5,6]. These works predominantly use vegetation indices as a proxy to estimate the LNC and LAI of the crop. Vegetation indices such as the normalized difference vegetation index (NDVI) are widely used to monitor the crop phenology, canopy structure, and overall health. The NDVI correlates with the LAI and LNC, which are critical indicators of photosynthetic activity and nitrogen availability, respectively. Understanding the relationships among these parameters is essential for optimizing nitrogen management and enhancing site-specific crop management strategies.
Wheat varieties differ in their genetic potential, canopy architecture, and nutrient uptake efficiency, which influence their physiological responses to nitrogen application and remote-sensing metrics like the NDVI. Therefore, it is essential to assess multiple varieties to ensure the robustness and scalability of drone-based monitoring approaches across diverse genotypes. This study investigated the relationships between the NDVI, LAI, and LNC during key growth stages of wheat, focusing on three wheat varieties (DBW-187, HD-3086, PBW-826) under varying nitrogen treatments. By evaluating the relationships, this study aimed to demonstrate the efficacy of drone-assisted crop monitoring in precision agriculture. Building on previous studies [7,8,9,10], this work aimed to provide valuable insights for precision agriculture applications and contribute to improving the resource use efficiency.

2. Materials and Methods

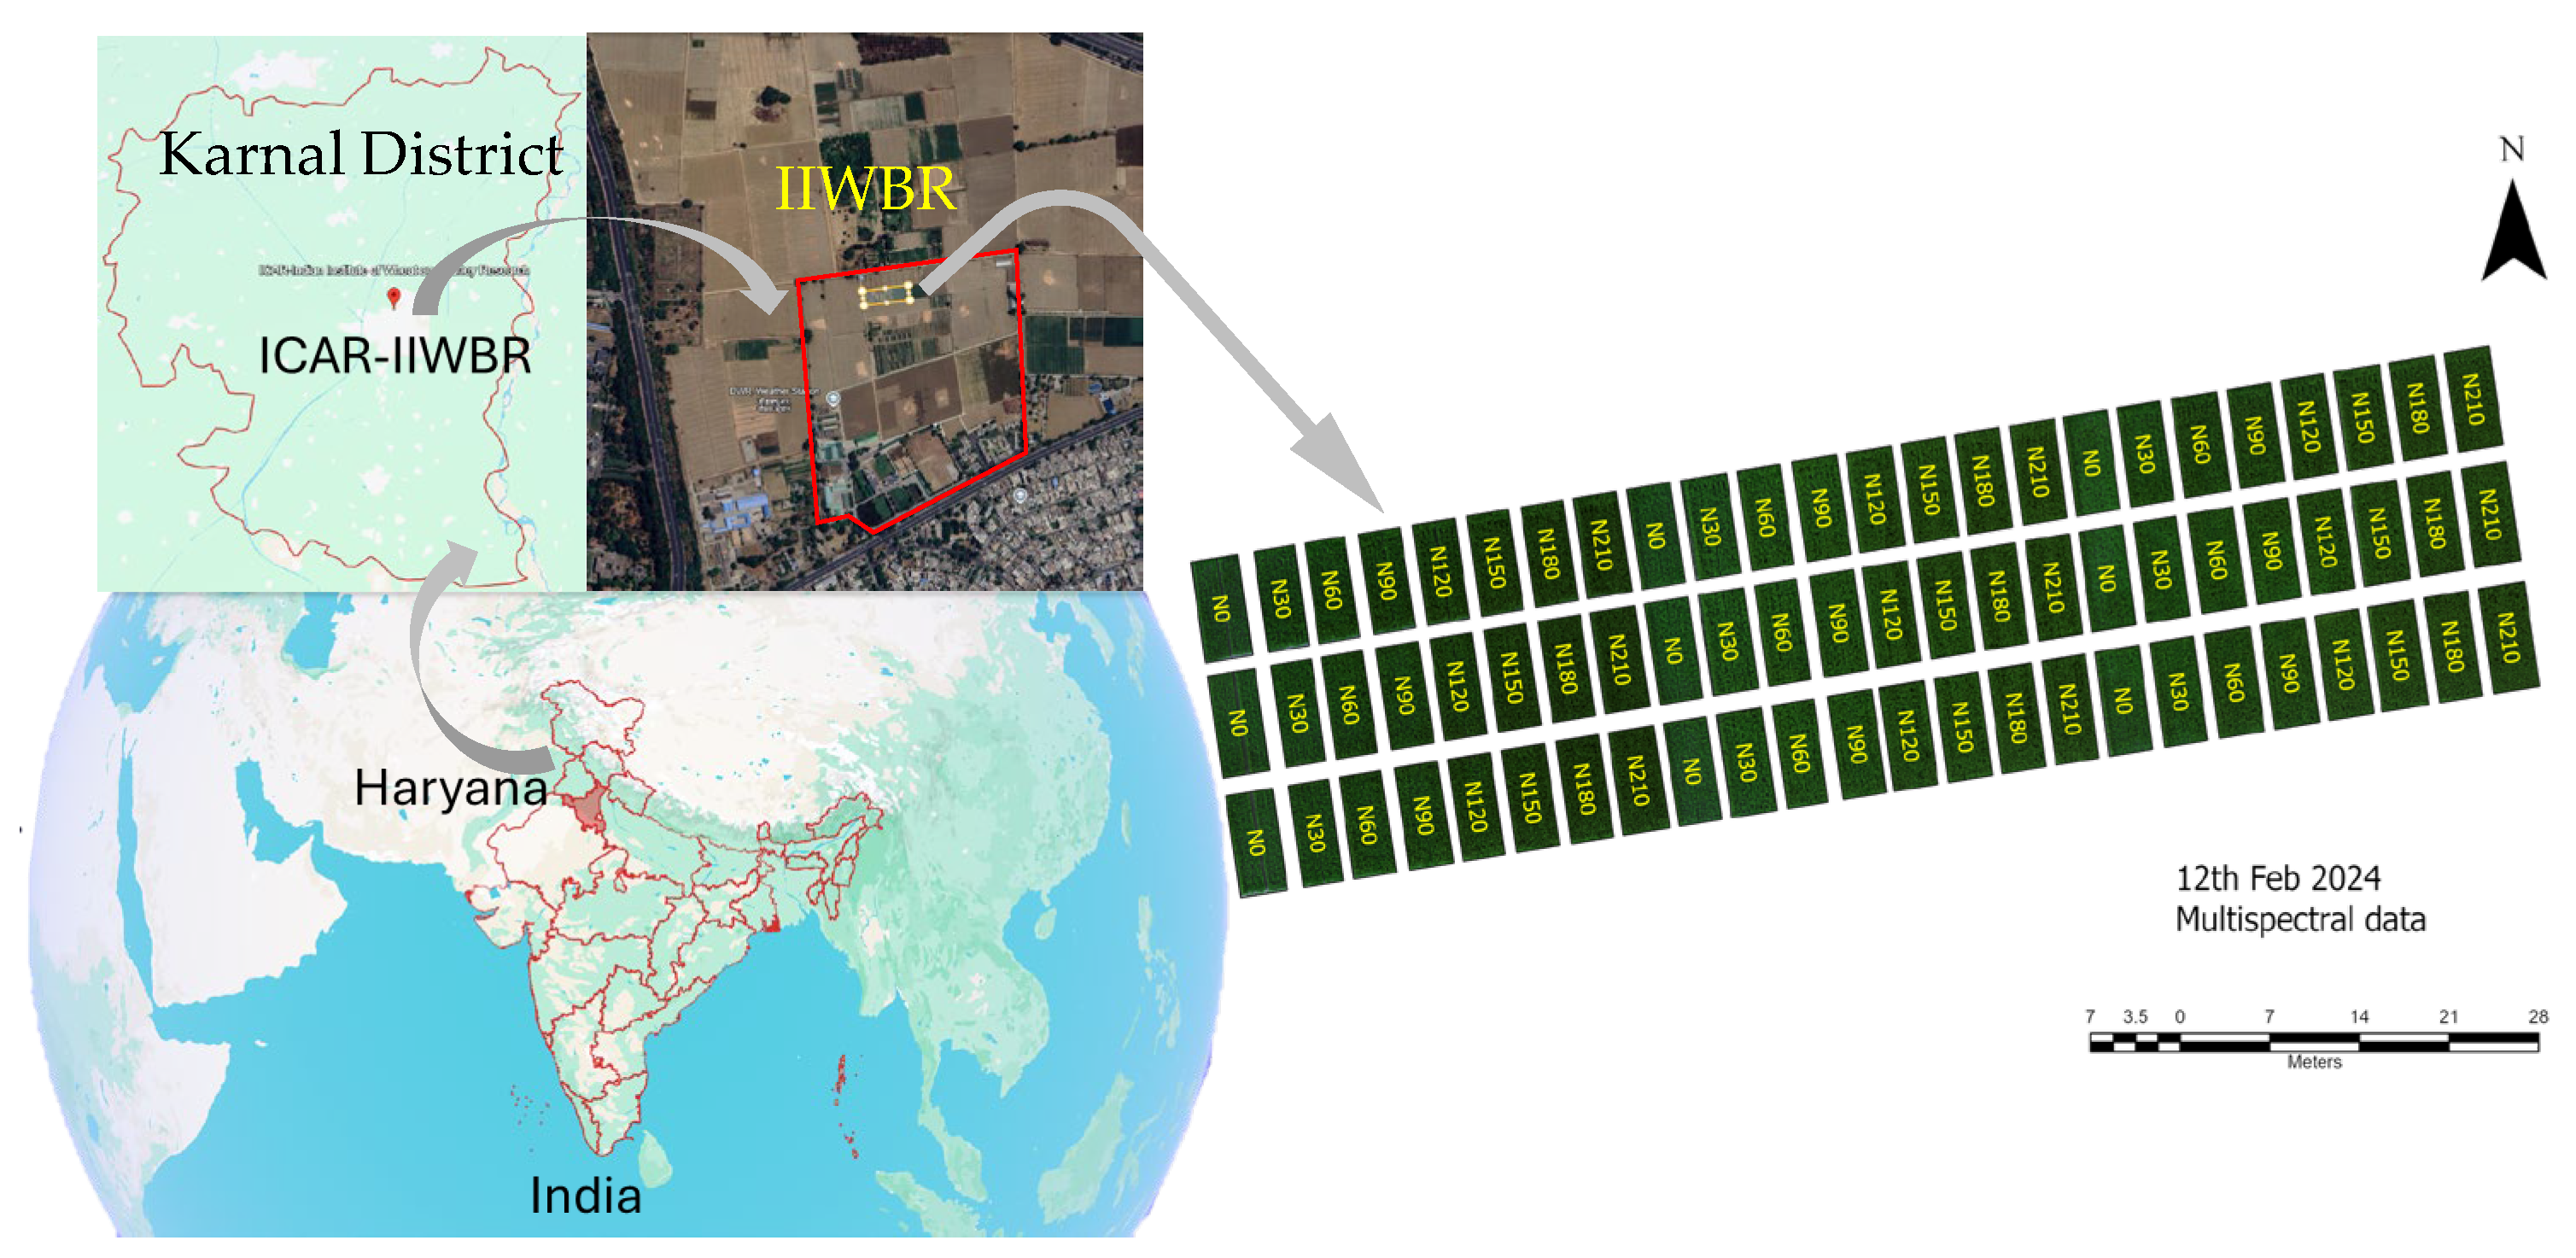
2.1. Study Area and Experimental Design

The experiment was carried out during the 2023–2024 rabi season at the Indian Institute of Wheat and Barley Research (IIWBR), Karnal, Haryana, India. A split-plot design was adopted with three replications. The main plots comprised three wheat varieties—DBW-187, HD-3086, and PBW-826—while the subplots received eight nitrogen levels: N0, N30, N60, N90, N120, N150, N180, and N210 kg ha⁻1 (Figure 1). Nitrogen was applied in three equal splits at the sowing, tillering, and stem elongation stages. Uniform agronomic management, including six irrigations and pest control, was maintained throughout the crop period.

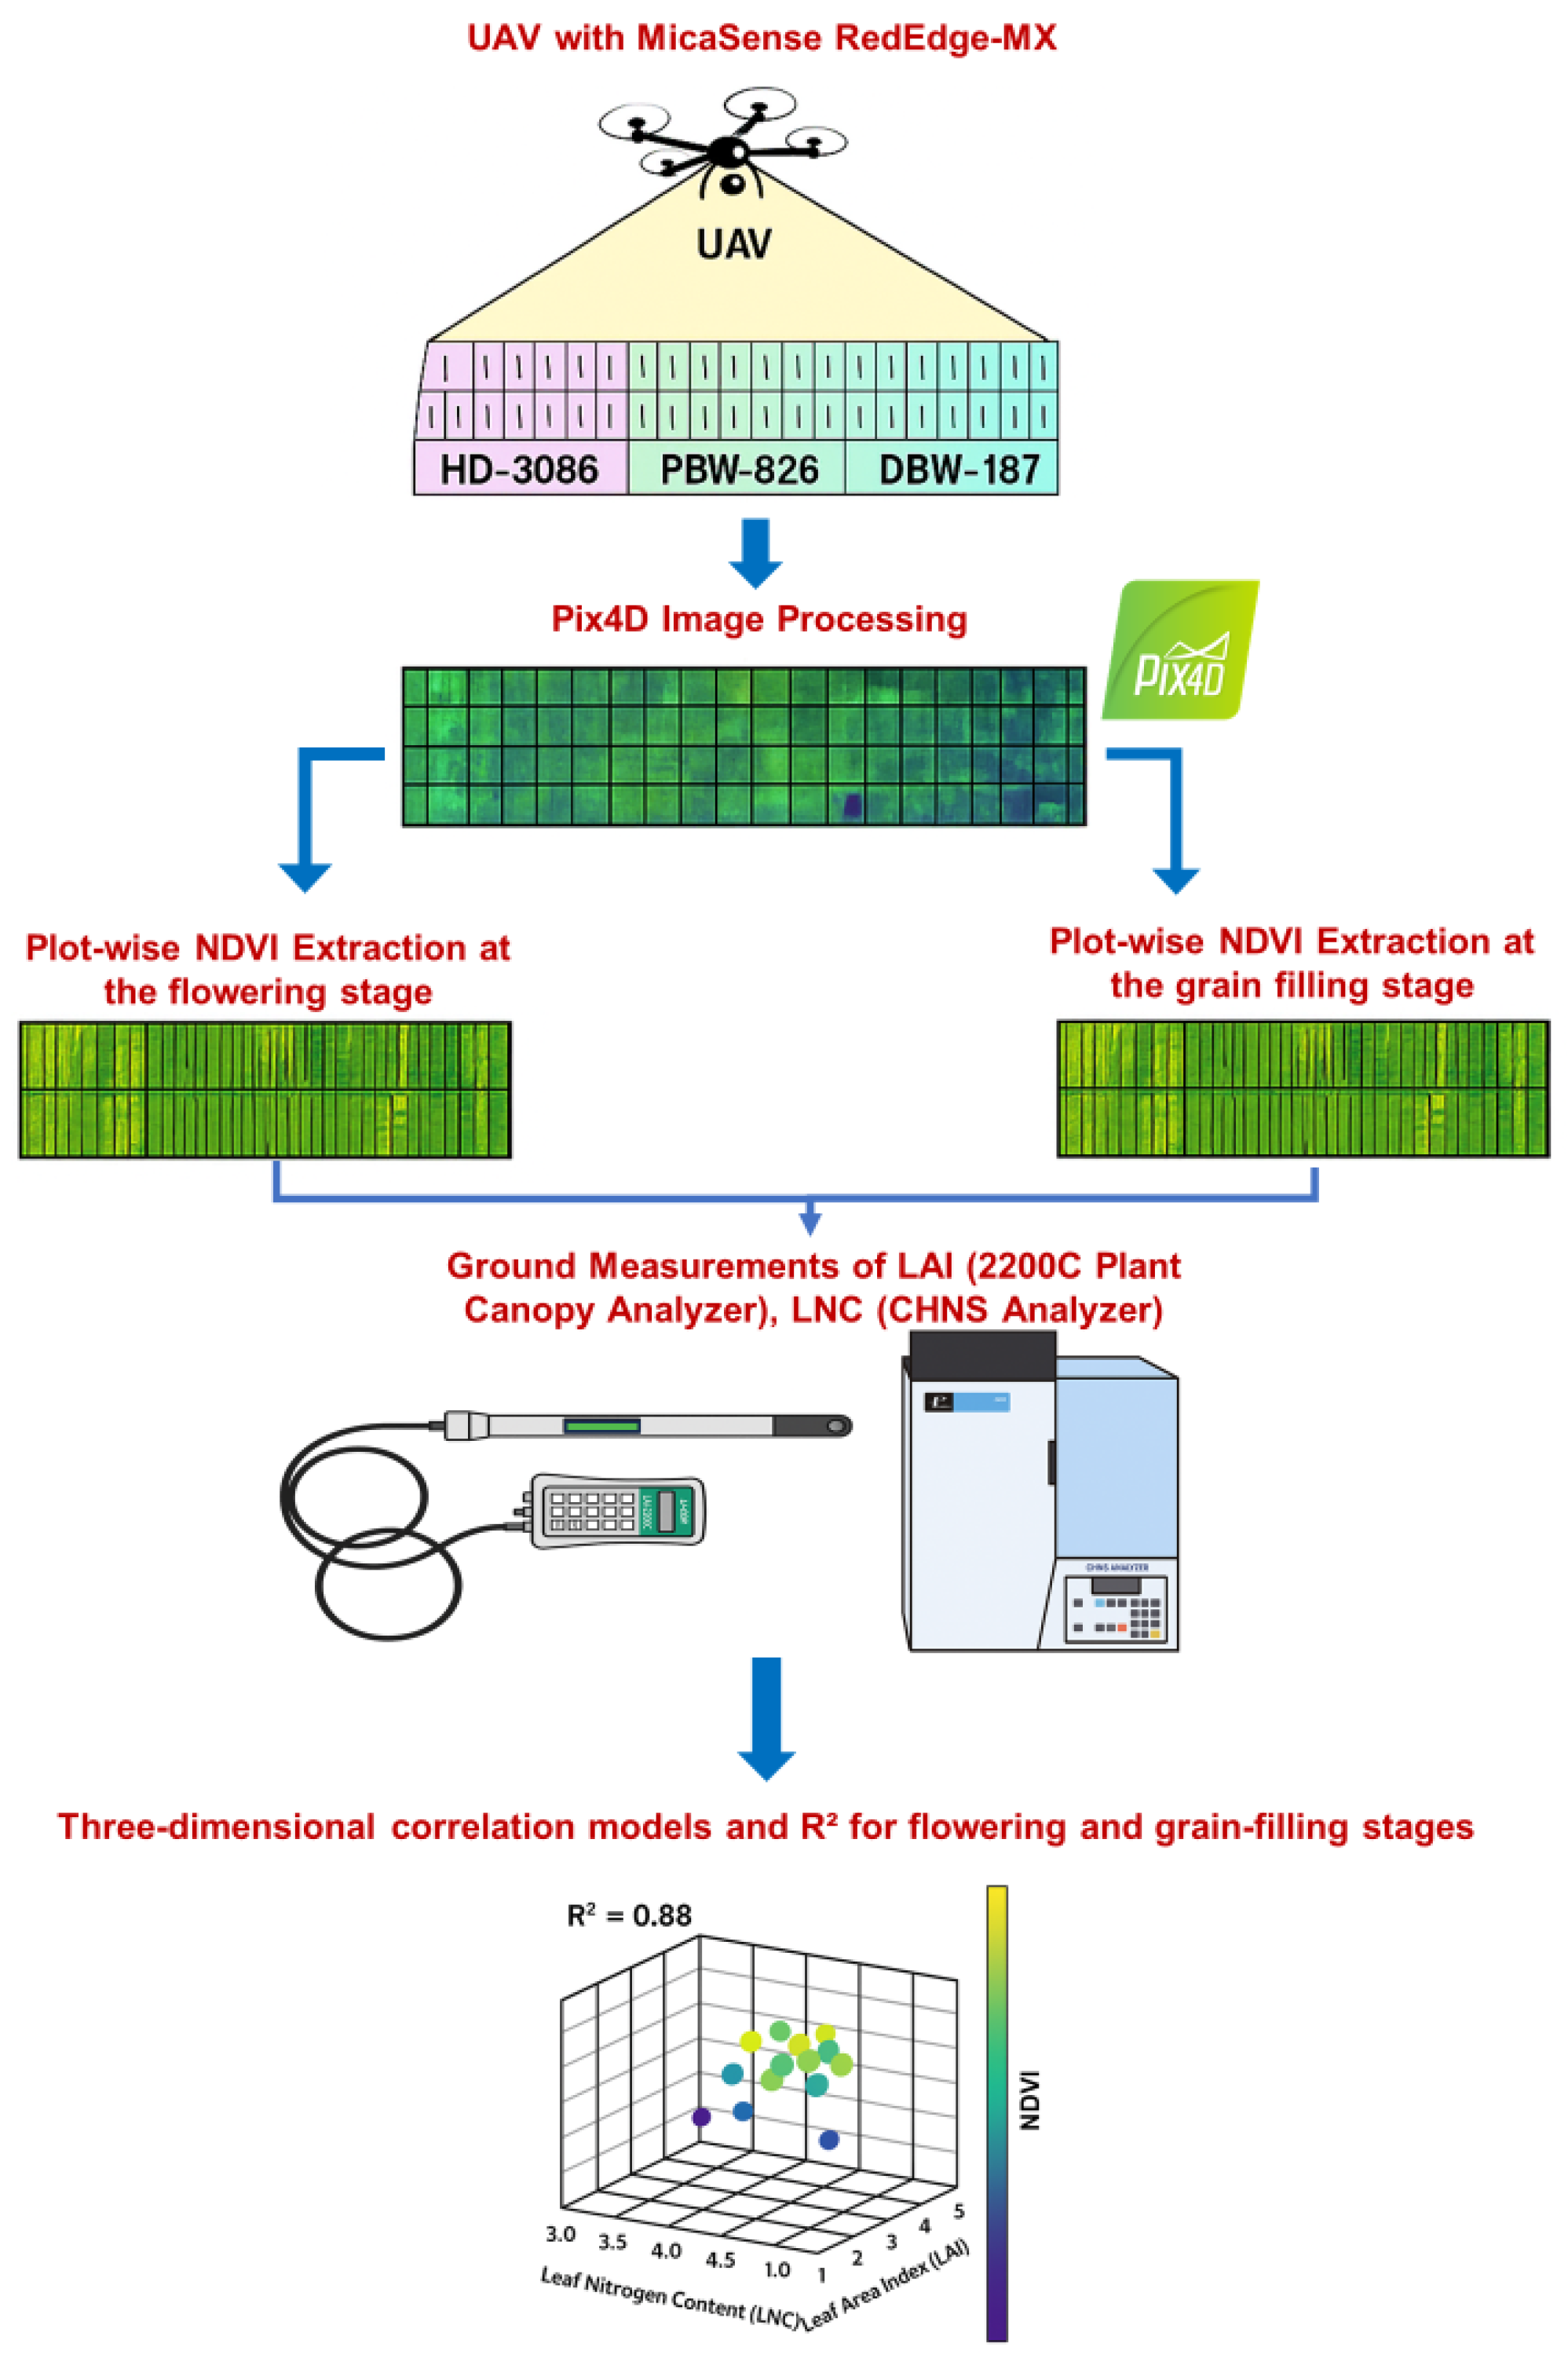
2.2. UAV-Based Data Acquisition

A UAV equipped with a MicaSense RedEdge-MX multispectral sensor (MicaSense Inc., Seattle, WA, USA) was used to capture high-resolution images in five spectral bands: blue, green, red, red edge, and near-infrared.The drone was flown at a 30 m altitude during clear sky conditions on 12 and 28 February 2024, corresponding to the flowering (90 DAS) and grain-filling (108 DAS) stages. The images were processed using Pix4D Mapper software v.4.6.4 to generate orthomosaics and derive each plot’s normalized difference vegetation index (NDVI).
The NDVI is a commonly used vegetation index that reflects the crop vigor and chlorophyll content. It is calculated as:
NDVI = NIR − Red/NIR + Red
The NDVI has been widely reported to correlate with the crop canopy structure, photosynthetic activity, and nitrogen status, making it a useful indicator for real-time crop health assessment.

2.3. Ground-Based Biophysical Measurements

Simultaneously with the UAV flights, ground truth measurements were collected for the leaf area index (LAI) and leaf nitrogen content (LNC). The LAI was measured using the LAI-2200C Plant Canopy Analyzer (LI-COR, Inc., Lincoln, NE, USA), which estimates the LAI based on the light attenuation through the canopy. The LAI represents the total leaf area per unit of ground area and is a key indicator of the crop biomass and light interception capacity. The LNC was measured using a CHNS elemental analyzer (Elementar Analysensysteme GmbH, Langenselbold, Germany). Leaf samples were collected from three different locations in each plot, dried, and analyzed for the nitrogen content. The LNC is an essential parameter reflecting the nitrogen uptake and utilization efficiency. Three readings per plot were averaged to obtain representative values of the LAI and LNC. The plot-level average NDVI values were extracted from the processed imagery to establish correlations with the ground-based LAI and LNC data (Figure 2).
These three variables—NDVI, LAI, and LNC—are significant indicators of the wheat crop health, with relevance to the photosynthetic efficiency, nitrogen management, and yield potential. Their integration through UAV-based monitoring provides a scalable and non-destructive alternative to traditional sampling methods. Correlation analysis was performed to evaluate the strength of the relationships among these parameters.

3. Results

3.1. NDVI Analysis of Experimental Fields

Figure 3 shows the NDVI products generated from the UAV multispectral imagery on 12 and 28 February, 2024. The images clearly illustrate variations in the NDVI values across the nitrogen treatments (N0 to N210). At the flowering stage, the NDVI values ranged between 0.17 and 0.96, with a heterogeneous distribution across the plots, reflecting differences in the nitrogen uptake and canopy development. During the grain-filling stage, the NDVI range narrowed to 0.11 to 0.98, with increased mean values and greater uniformity within the treatments. This transition suggests canopy closure and enhanced leaf chlorophyll content, indicative of sufficient nitrogen availability and optimal growth conditions. The spatial representation provided by the NDVI maps highlights the treatment effects and enables identification of zones requiring corrective measures.

3.2. Correlation Between NDVI and Biophysical Parameters

3.2.1. Relationship Between NDVI and LAI

Figure 4 demonstrates a strong positive correlation between the NDVI and the LAI across all the wheat varieties and growth stages. At the flowering stage, the R2 values were 0.78, 0.86, and 0.80 for DBW-187, HD-3086, and PBW-826, respectively. These correlations improved at the grain-filling stage, reaching R2 values of 0.89, 0.88, and 0.90. The enhanced correlations at the later stages can be attributed to increased canopy coverage, which reduces the background soil reflectance and enhances the vegetation’s spectral response. These findings underscore the reliability of the NDVI in capturing the LAI dynamics under dense canopy conditions.

3.2.2. Relationship Between NDVI and LNC

A similar trend was observed for the NDVI and LNC correlations, which strengthened from the flowering to grain-filling stages. At flowering, the R2 values were 0.76, 0.84, and 0.79 for DBW-187, HD-3086, and PBW-826, respectively. These correlations increased to 0.87, 0.89, and 0.91 during the grain-filling stage. The higher sensitivity of the NDVI to the LNC at this stage is likely due to nitrogen accumulation in the leaves, enhancing their spectral reflectance in the near-infrared region. These results highlight the NDVI as a reliable proxy for monitoring the nitrogen content, particularly during critical growth stages.

3.3. Varietal Differences

Among the three wheat varieties, HD-3086 consistently exhibited the highest R2 values, indicating a stronger relationship between the NDVI, the LAI, and the LNC. This suggests that genetic factors influence the spectral response of crops, emphasizing the need for variety-specific calibration in precision agriculture applications. DBW-187 and PBW-826 also showed significant correlations, but with slightly higher variability across the treatments, reflecting potential differences in the growth patterns and nitrogen use efficiency.

3.4. NDVI Correlations Across Growth Stages

The results demonstrated consistently strong positive correlations between the NDVI and the biophysical parameters (LAI and LNC) across the growth stages and wheat varieties. The correlations of the NDVI with the LAI and LNC during the flowering stage ranged from R2 = 0.78 to 0.86, improving to R2 = 0.87 to 0.91 at the grain-filling stage. The increased canopy density and reduced soil reflectance background at the grain-filling stage likely enhanced the predictive accuracy of the NDVI for both parameters. Varietal differences were also evident, with HD-3086 showing the strongest correlations during flowering and PBW-826 exhibiting the highest R2 value at the grain-filling stage.

3.5. Implications for Precision Agriculture

The findings underscore the potential of the drone-based NDVI as a reliable tool for estimating the LAI and LNC. Compared to traditional methods, drone-assisted monitoring offers significant advantages in terms of the speed, accuracy, and scalability. High-resolution, real-time data enable farmers to make informed decisions about nitrogen management, irrigation, and other agronomic practices. The reduced labor and cost compared with ground-based measurements make this technology accessible to a broader range of agricultural stakeholders. The consistently high R2 values across the growth stages and varieties demonstrate the robustness of the NDVI in capturing biophysical parameters. Integrating drone-based NDVI measurements into precision agriculture frameworks can improve the nitrogen use efficiency and optimize crop management practices. Variety-specific calibrations and further validation under diverse environmental conditions are recommended to maximize the utility of this approach.

4. Discussion

The use of the drone-assisted NDVI has proven highly effective in estimating biophysical variables such as the leaf area index (LAI) and leaf nitrogen content (LNC) in wheat crops under varying nitrogen treatments. The strong NDVI correlations observed across the growth stages, especially during grain filling, are not merely descriptive but also indicative of physiological processes such as enhanced chlorophyll content, photosynthetic activity, and nitrogen translocation. This stage-specific sensitivity aligns with known phenological responses, wherein denser canopy architecture and nitrogen remobilization improve the spectral signal fidelity.
The stronger performance of cultivar HD-3086 points to genotypic variability in the canopy structure and nitrogen use efficiency, necessitating variety-specific calibration models. This interpretation is consistent with prior UAV-based studies suggesting that genotype-driven morphological differences can significantly alter vegetation index response curves, thereby influencing the model transferability across cultivars.
Recent studies highlight the integration of UAV multispectral imagery and feature combination indices (FCIs) for improved LNC estimation [6], while texture and spectral features enhance LAI predictions [11]. Hassan et al. demonstrate strong NDVI correlations (R2 0.86–0.89) with the grain yield at late growth stages, underscoring the NDVI’s reliability [12]. Moreover, Liu et al. and Vadillo et al. reveal the critical influence of nitrogen treatments on the canopy development and NDVI metrics, reinforcing the need for balanced fertilization strategies [13,14].
Varietal distinctions were a critical dimension of this study. Among the three wheat genotypes, HD-3086 exhibited consistently stronger NDVI correlations with the LAI and LNC, particularly at the grain-filling stage. This may be attributed to its compact canopy architecture and efficient nitrogen assimilation [8]. In contrast, DBW-187 and PBW-826 showed more variability, underscoring how genotypic differences affect the spectral response [15]. These findings align with prior work showing that the NDVI–trait correlations are genotype-dependent, necessitating variety-specific calibration to avoid prediction biases in precision agriculture [16].
Spatial NDVI variability analysis adds a layer of interpretability by capturing the temporal dynamics of canopy development. Higher nitrogen treatments enhanced the NDVI during flowering, reflecting increased leaf biomass and chlorophyll density. By grain filling, the intra-treatment NDVI convergence suggested physiological compensation in low-N zones, possibly due to the reallocation of assimilates or delayed senescence. This observation aligns with findings by Nian et al. and Tao et al., who show the NDVI’s responsiveness to nitrogen-induced canopy restructuring during the later stages [6,17].
We chose linear models to relate the NDVI with the LAI and LNC because they offer both practical advantages and strong empirical support. These models are easy to interpret, making them valuable tools for decision-making in precision agriculture, especially when datasets are limited [18]. Importantly, past studies have shown that the linear relationships between the NDVI and crop parameters perform well in systems with uniform canopies—like the winter cover crops used in our study—particularly during the early growth stages when the NDVI saturation is minimal [19]. While nonlinear models may offer benefits in more complex systems, linear models proved sufficient and reliable in our context.
Moving forward, integrating additional vegetation indices, temporal image series, and hybrid modeling frameworks (e.g., ML-augmented regressions) will improve the generalizability across diverse crop systems. The fusion of spectral data with predictive analytics offers a path toward site-specific, real-time crop monitoring, supporting a more sustainable and responsive approach to precision agriculture.

5. Conclusions

Our study highlights the practical potential of the drone-based NDVI for monitoring wheat health under diverse nitrogen conditions. By capturing the spatial variability in the leaf area and nitrogen levels, particularly during the grain-filling stage, we provide farmers with actionable insights to optimize crop management. The stronger correlations observed in varieties like HD-3086 emphasize the importance of tailoring approaches to specific crops, ensuring precise nutrient interventions. Beyond farm-scale applications, this technology could aid biodiversity tracking and land-use planning by mapping vegetation dynamics. Looking ahead, integrating advanced modeling and multi-seasonal data will refine the predictions in shifting climates, bridging precision agriculture and global sustainability goals.

Author Contributions

Conceptualization, D.V.S.C.R. and R.N.S.; methodology, D.V.S.C.R., R.R. and T.K.; software, D.V.S.C.R. and T.K.; validation, D.V.S.C.R., R.N.S., T.K. and R.G.R.; formal analysis, D.V.S.C.R. and A.M.; investigation, D.V.S.C.R.; resources, R.N.S., R.R., A.B., S.C.T. and N.K.; data curation, R.R., S.C.T. and N.K.; writing—original draft preparation, D.V.S.C.R. and T.K.; writing—review and editing, D.V.S.C.R., R.N.S., T.K. and R.G.R.; visualization, D.V.S.C.R.; supervision, R.N.S.; project administration, R.N.S.; funding acquisition, R.N.S. All authors have read and agreed to the published version of the manuscript.

Funding

The results summarized in this manuscript were achieved as part of the research project “Network Program on Precision Agriculture (NePPA)”, which was funded by the Indian Council of Agricultural Research (ICAR), India.

Institutional Review Board Statement

Not applicable.

Informed Consent Statement

Not applicable.

Data Availability Statement

Data can be made available upon request.

Conflicts of Interest

The authors declare no conflicts of interest.

References

  1. Fang, Y.; Sun, H.; Yan, Y.; Ren, J.; Dong, D.; Chen, Z.; Yue, H.; Durrani, T. Wheat Growth Assessment for Satellite Remote Sensing Enabled Precision Agriculture. In Proceedings of the 8th International Conference on Communications, Signal Processing, and Systems, Urumqi, China, 20–22 July 2019; Lecture Notes in Electrical Engineering. Springer: Singapore, 2020; Volume 571. [Google Scholar] [CrossRef]
  2. Choroś, T.; Oberski, T.; Kogut, T. UAV Imaging at RGB for Crop Condition Monitoring. In Proceedings of the XXIV ISPRS Congress, the International Archives of the Photogrammetry, Remote Sensing and Spatial Information Sciences—ISPRS Archives, Nice, France, 31 August–2 September 2020; Volume 43. [Google Scholar]
  3. Guebsi, R.; Mami, S.; Chokmani, K. Drones in Precision Agriculture: A Comprehensive Review of Applications, Technologies, and Challenges. Drones 2024, 8, 686. [Google Scholar] [CrossRef]
  4. Zhu, B.; Chen, S.; Xu, Z.; Ye, Y.; Han, C.; Lu, P.; Song, K. The Estimation of Maize Grain Protein Content and Yield by Assimilating LAI and LNA, Retrieved from Canopy Remote Sensing Data, into the DSSAT Model. Remote Sens. 2023, 15, 2576. [Google Scholar] [CrossRef]
  5. Fu, H.; Lu, J.; Chen, J.; Wang, W.; Cui, G.; She, W. Influence of Structure and Texture Feature on Retrieval of Ramie Leaf Area Index. Agronomy 2023, 13, 1690. [Google Scholar] [CrossRef]
  6. Su, X.; Nian, Y.; Yue, H.; Zhu, Y.; Li, J.; Wang, W.; Sheng, Y.; Ma, Q.; Liu, J.; Wang, W.; et al. Improving Wheat Leaf Nitrogen Concentration (LNC) Estimation across Multiple Growth Stages Using Feature Combination Indices (FCIs) from UAV Multispectral Imagery. Agronomy 2024, 14, 1052. [Google Scholar] [CrossRef]
  7. Fu, Z.; Jiang, J.; Gao, Y.; Krienke, B.; Wang, M.; Zhong, K.; Cao, Q.; Tian, Y.; Zhu, Y.; Cao, W.; et al. Wheat Growth Monitoring and Yield Estimation Based on Multi-Rotor Unmanned Aerial Vehicle. Remote Sens. 2020, 12, 508. [Google Scholar] [CrossRef]
  8. Zhang, J.; Cheng, T.; Shi, L.; Wang, W.; Niu, Z.; Guo, W.; Ma, X. Combining Spectral and Texture Features of UAV Hyperspectral Images for Leaf Nitrogen Content Monitoring in Winter Wheat. Int. J. Remote Sens. 2022, 43, 2335–2356. [Google Scholar] [CrossRef]
  9. Fu, Z.; Yu, S.; Zhang, J.; Xi, H.; Gao, Y.; Lu, R.; Zheng, H.; Zhu, Y.; Cao, W.; Liu, X. Combining UAV Multispectral Imagery and Ecological Factors to Estimate Leaf Nitrogen and Grain Protein Content of Wheat. Eur. J. Agron. 2022, 132, 126405. [Google Scholar] [CrossRef]
  10. Liao, Z.; Dai, Y.; Wang, H.; Ketterings, Q.M.; Lu, J.; Zhang, F.; Li, Z.; Fan, J. A Double-Layer Model for Improving the Estimation of Wheat Canopy Nitrogen Content from Unmanned Aerial Vehicle Multispectral Imagery. J. Integr. Agric. 2023, 22, 2248–2270. [Google Scholar] [CrossRef]
  11. Zou, M.; Liu, Y.; Fu, M.; Li, C.; Zhou, Z.; Meng, H.; Xing, E.; Ren, Y. Combining Spectral and Texture Feature of UAV Image with Plant Height to Improve LAI Estimation of Winter Wheat at Jointing Stage. Front. Plant Sci. 2023, 14, 1272049. [Google Scholar] [CrossRef] [PubMed]
  12. Hassan, M.A.; Yang, M.; Rasheed, A.; Yang, G.; Reynolds, M.; Xia, X.; Xiao, Y.; He, Z. A Rapid Monitoring of NDVI across the Wheat Growth Cycle for Grain Yield Prediction Using a Multi-Spectral UAV Platform. Plant Sci. 2019, 282, 95–103. [Google Scholar] [CrossRef] [PubMed]
  13. Liu, K.; Choo-Foo, K.; Wen, G.; Schoenau, J.; Knight, J.D. Assessing Crop Productivity, Grain Quality, and Soil Labile Carbon and Nitrogen in Pea-Based Intercrops under Low Nitrogen Input. Can. J. Plant Sci. 2025, 105, 1–12. [Google Scholar] [CrossRef]
  14. Vadillo, J.M.; Campillo, C.; González, V.; Prieto, H. Assessing Nitrogen Fertilization in Processing Pepper: Critical Nitrogen Curve, Yield Response, and Crop Development. Horticulturae 2024, 10, 1141. [Google Scholar] [CrossRef]
  15. Kaur, R.; Singh, B.; Singh, M.; Thind, S.K. Hyperspectral Indices, Correlation and Regression Models for Estimating Growth Parameters of Wheat Genotypes. J. Indian Soc. Remote Sens. 2015, 43, 551–558. [Google Scholar] [CrossRef]
  16. Chen, J.; Wang, P.; Sun, W.; Ling, L. Directional Vegetation Index and Its Effects on Normalized-Difference-Vegetation-Index-Based Agricultural Applications. In Proceedings of the Geoinformatics 2006: GNSS and Integrated Geospatial Applications, Wuhan, China, 28–29 October 2006; Volume 6418. [Google Scholar]
  17. Tao, Y.; Xu, Y.; Ye, C.; Zhu, J.; Xiao, D.; Liao, W.; Zhu, Y.; Chu, G.; Xu, C.; Wang, D. Exogenous N Supply on N Transportation and Reuse during the Rice Grain-Filling Stage and Its Relationship with Leaf Color-Changing Parameters. Agronomy 2024, 14, 2321. [Google Scholar] [CrossRef]
  18. Lykhovyd, P.V.; Vozhehova, R.A.; Lavrenko, S.O.; Lavrenko, N.M. The Study on the Relationship between Normalized Difference Vegetation Index and Fractional Green Canopy Cover in Five Selected Crops. Sci. World J. 2022, 2022, 8479424. [Google Scholar] [CrossRef]
  19. Tenreiro, T.R.; García-Vila, M.; Gómez, J.A.; Jiménez-Berni, J.A.; Fereres, E. Using NDVI for the Assessment of Canopy Cover in Agricultural Crops within Modelling Research. Comput. Electron. Agric. 2021, 182, 106038. [Google Scholar] [CrossRef]
Figure 1. Study area map of the wheat field, ICAR-Indian Institute of Wheat and Barley Research (IIWBR), Karnal District, Haryana, India.
Blsf 41 00010 g001
Figure 2. Overview of the experimental workflow.
Blsf 41 00010 g002
Figure 3. Shows the NDVI images of the experimental fields on 12th (top) and 28th Feb (bottom) in 2024.
Blsf 41 00010 g003
Figure 4. Three-dimensional correlation graph between the LNC (X-axis) and the LAI (Y-axis) using the NDVI (Z-axis) during the flowering and grain-filling stages.
Blsf 41 00010 g004
Disclaimer/Publisher’s Note: The statements, opinions and data contained in all publications are solely those of the individual author(s) and contributor(s) and not of MDPI and/or the editor(s). MDPI and/or the editor(s) disclaim responsibility for any injury to people or property resulting from any ideas, methods, instructions or products referred to in the content.

