
Comparative Evaluation of Hypoglycemic Activity of Cucumis sativus and Cucurbita pepo Whole Plant Extracts in Normal and Streptozotocin-Induced Diabetic Rats †


Abstract
1. Introduction
2. Materials and Methods
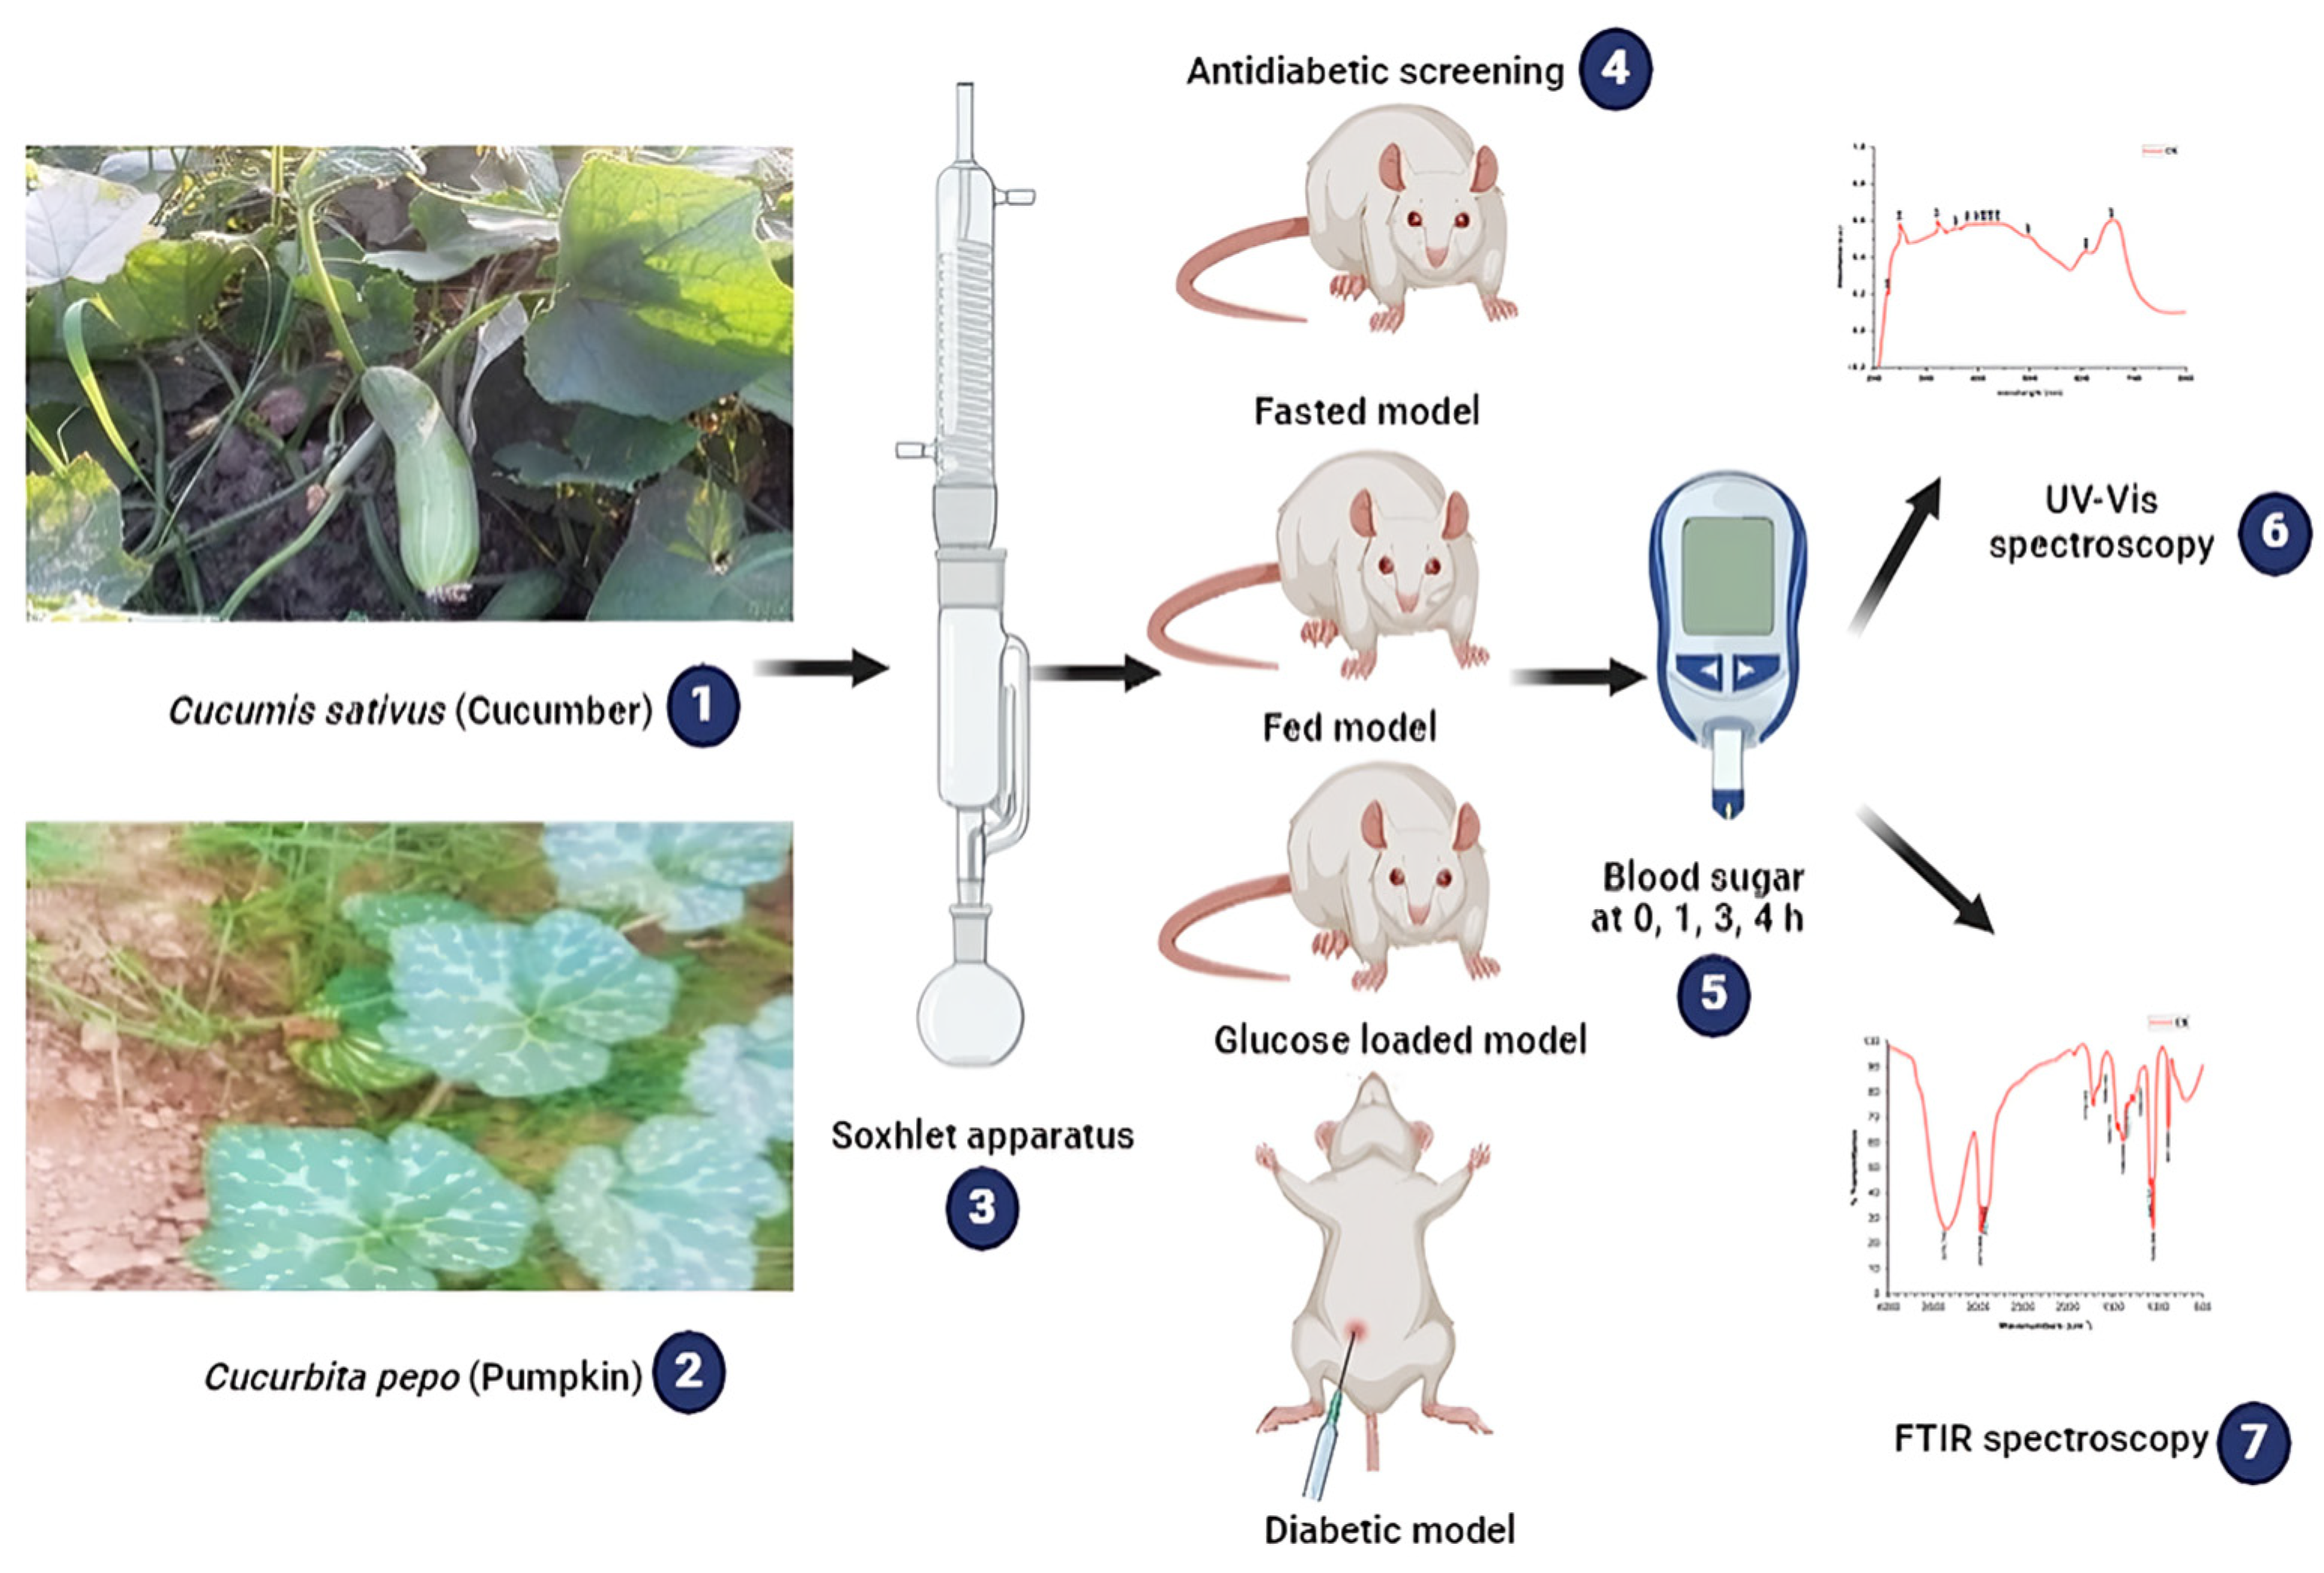
2.1. Collection and Preparation of Extract
2.2. Animals
2.3. Experimental Design
- Fasted model: Animals were fasted overnight (18 h), and blood was collected at 0 h from the tail vein; afterwards, the tested plant extracts were administered at a dose of 250 mg/kg body weight. Blood samples were collected at different time intervals (1, 3, and 4 h). Blood glucose concentration was measured using the standard glucometer (Accu-Chek Active Glucometer; Roche, Germany);
- Fed model: excess pellets were kept in the cages on the previous evening, leaving some pellets left over the next morning. For blood glucose estimation, blood was collected before (at 0 h) and after administration of the extracts at a dose of 250 mg/kg body weight at time intervals of 1, 3, and 4 h;
- Diabetic model: Diabetes was induced in rats by streptozotocin (35 mg/kg body weight) dissolved in freshly prepared, chilled citrate-phosphate buffer (pH 4.5) by intraperitoneal (i.p.) injection. Before injection, the rats were fasted for 18 h. After streptozotocin injection, all rats were returned to their cages and given free access to food and water. To avoid transit hypoglycemia, all rats were administered a 10% glucose solution for 24 h. After 3 days of i.p. administration, the blood glucose concentration of the rats was checked. Rats with fasting blood glucose levels over 200 mg/dL were considered diabetic rats and were used for the experiment. Then, the same protocol that we had carried out in the fasted group was followed and the blood glucose concentration of the rats in this group was measured at different time intervals;
- Glucose-loaded model: animals were fasted for 18 h, and blood was collected (at 0 h) for glucose estimation. Then, the plant extract was administered, and half an hour after the feeding extract, a glucose (1.5 gm/kg body weight orally) solution was administered using an oral cannula (18G × 50 mm), and blood samples were taken for glucose estimation at 1/2, 1, and 3 h post administration.
2.4. UV-Vis Spectroscopy
2.5. FTIR Spectroscopy
2.6. Statistical Analysis of Data
3. Results and Discussion
3.1. Antidiabetic Effect
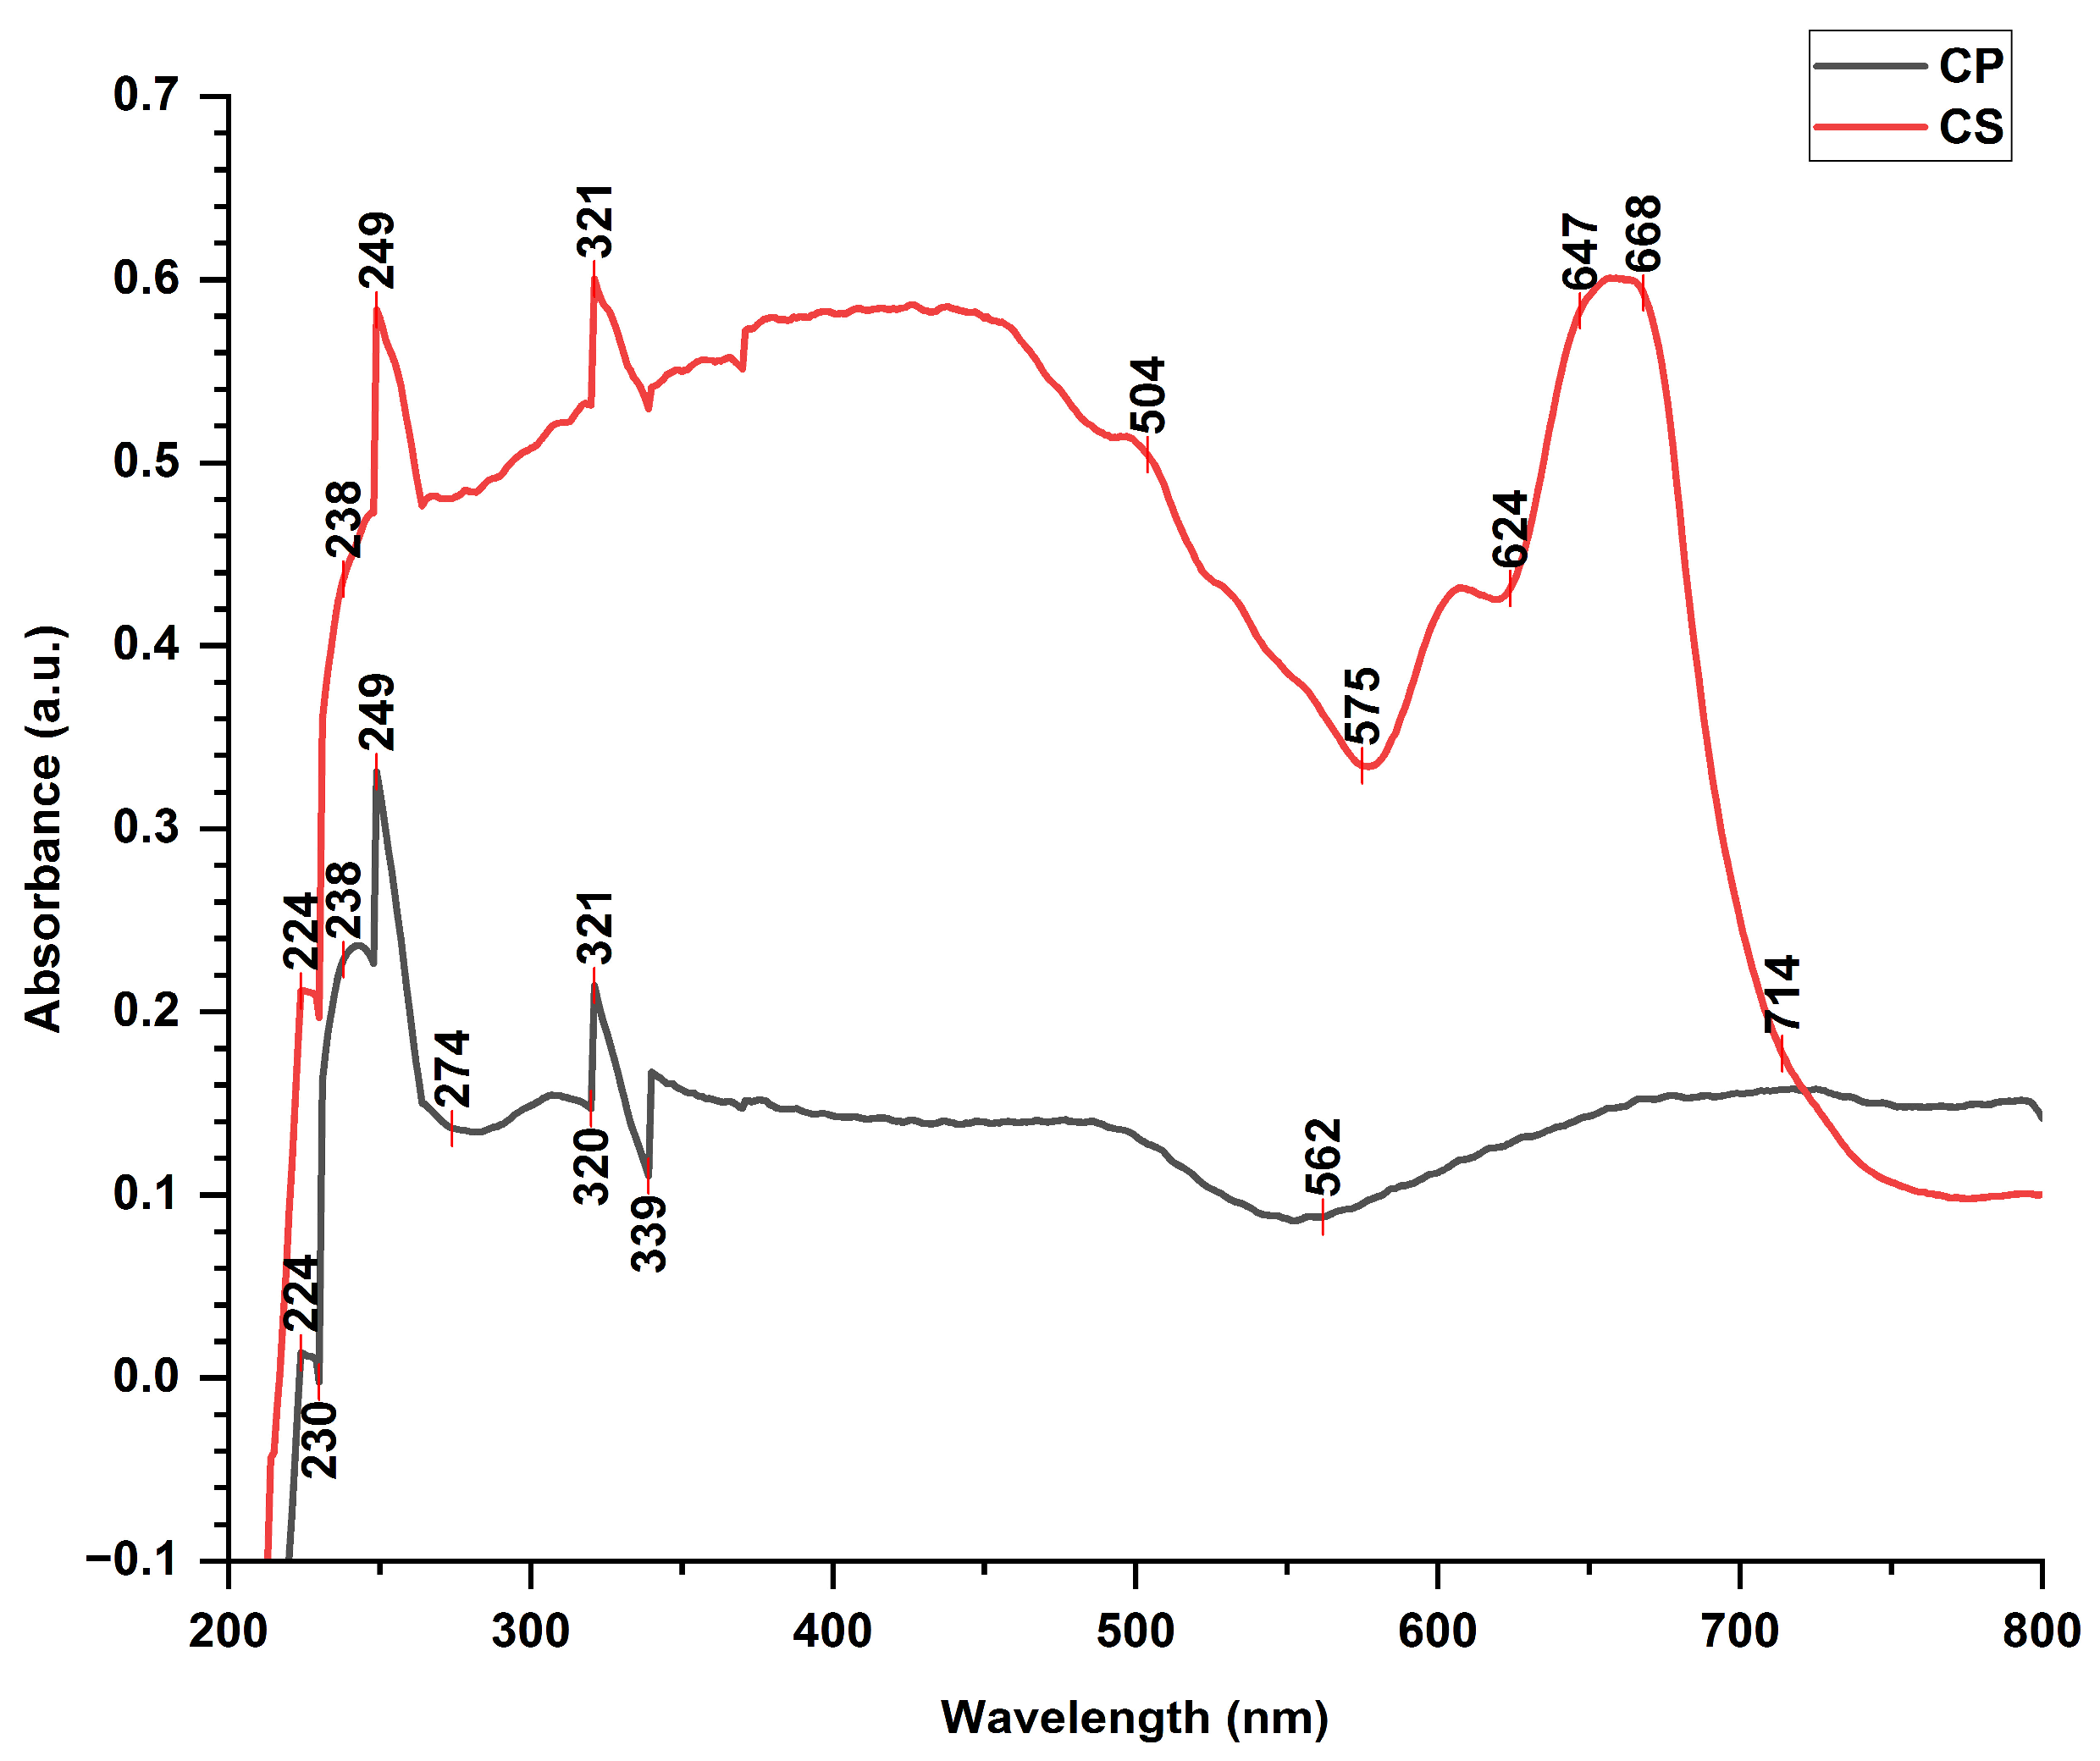
3.2. UV-Vis Analysis
3.3. FTIR Analysis
4. Conclusions
Author Contributions
Funding
Institutional Review Board Statement
Informed Consent Statement
Data Availability Statement
Acknowledgments
Conflicts of Interest
References
- Dilworth, L.; Facey, A.; Omoruyi, F. Diabetes Mellitus and Its Metabolic Complications: The Role of Adipose Tissues. Int. J. Mol. Sci. 2021, 22, 7644. [Google Scholar] [CrossRef] [PubMed]
- American Diabetes Association Professional Practice Committee. 2. Classification and Diagnosis of Diabetes: Standards of Medical Care in Diabetes—2022. Diabetes Care 2022, 45 (Suppl. 1), S17–S38. [Google Scholar] [CrossRef] [PubMed]
- Shahzad, N.; Alzahrani, A.R.; Ibrahim, I.A.A.; Shahid, I.; Alanazi, I.M.; Falemban, A.H.; Imam, M.T.; Mohsin, N.; Azlina, M.F.N.; Arulselvan, P. Therapeutic strategy of biological macromolecules based natural bioactive compounds of diabetes mellitus and future perspectives: A systematic review. Heliyon 2024, 10, e24207. [Google Scholar] [CrossRef] [PubMed]
- Rasoanaivo, P.; Wright, C.W.; Willcox, M.L.; Gilbert, B. Whole plant extracts versus single compounds for the treatment of malaria: Synergy and positive interactions. Malar. J. 2011, 10, S4. [Google Scholar] [CrossRef] [PubMed]
- Dhiman, K.; Gupta, A.; Sharma, D.; Gill, N.; Goyal, A. A review on the medicinally important plants of the family cucurbitaceae. Asian J. Clin. Nutr. 2012, 4, 16–26. [Google Scholar] [CrossRef]
- Suryavanshi, A.; Gautam, V.; Saxena, A.; Panjwani, D.; Kumar, S. Evaluation of the Anti-diabetic Potential of Rumex vesicarius L. in normal and Streptozotocin induced Diabetic Rats. Res. J. Biotechnol. 2022, 17, 63–67. [Google Scholar] [CrossRef]
- Makita, C.; Chimuka, L.; Steenkamp, P.; Cukrowska, E.; Madala, E. Comparative analyses of flavonoid content in Moringa oleifera and Moringa ovalifolia with the aid of UHPLC-qTOF-MS fingerprinting. S. Afr. J. Bot. 2016, 105, 116–122. [Google Scholar] [CrossRef]
- Alara, O.R.; Abdurahman, N.H.; Mudalip, S.K.A.; Olalere, O.A. Characterization and effect of extraction solvents on the yield and total phenolic content from Vernonia amygdalina leaves. J. Food Meas. Charact. 2018, 12, 311–316. [Google Scholar] [CrossRef]
- Patle, T.K.; Shrivas, K.; Kurrey, R.; Upadhyay, S.; Jangde, R.; Chauhan, R. Phytochemical screening and determination of phenolics and flavonoids in Dillenia pentagyna using UV–vis and FTIR spectroscopy. Spectrochim. Acta Part A Mol. Biomol. Spectrosc. 2020, 242, 118717. [Google Scholar] [CrossRef]
- Saxena, M.; Saxena, J. Evalution of phytoconstituents of Acorus calamus by FTIR and UV-VIS spectroscopic analysis. Int. J. Biol. Pharm. Res. 2012, 3, 498–501. [Google Scholar]
- Gautam, A.K.; Pandey, G. Green Synthesis of Pistia stratiotes Ag/AgCl Nanomaterials and Their Anti-Bacterial Activity. Chem. Proc. 2023, 15, 88. [Google Scholar]
- Gautam, N.; Singh, K.B.; Snigdha; Upadhyay, D.D.; Pandey, G. Structural and optical properties of silver supported α-Fe2O3nanocomposite fabricated by Saraca asoca leaf extract for the effective photo-degradation of cationic dye Azure B. RSC Adv. 2023, 13, 23181–23196. [Google Scholar] [CrossRef] [PubMed]
- Manimaran, R.; Kumar, K.M.M.; Narayanan, N.S. Synthesis of bio-oil from waste Trichosanthes cucumerina seeds: A substitute for conventional fuel. Sci. Rep. 2020, 10, 17815. [Google Scholar] [CrossRef] [PubMed]
- Gautam, V.; Ranjan, A.; Bajpai, K.G.; Baqri, S.S.R.; Saxena, A.M. Exploring the Therapeutic Potential of Three Cucurbit Plants Involving In Vivo Diabetes Screening. Cureus 2025, 11, 17. [Google Scholar] [CrossRef] [PubMed]


| Group | Treatment | Blood Sugar Level mg/dL (Mean ± SD.) at Time (h) | Maximum % of Blood Sugar Lowering from Initial Value | |||
|---|---|---|---|---|---|---|
| 0 h | 1 h | 3 h | 4 h | |||
| Fasted Model | Control C. sativus Control C. pepo | 87.83 ± 5.04 87.5 ± 4.46 96.67 ± 3.33 91.83 ± 5.34 | 85.67 ± 5.92 89.0 ± 8.56 98.83 ± 4.92 86.50 ± 4.81 | 83.83 ± 5.42 81.83 ± 5.23 99.67 ± 3.67 83.83 ± 4.17 * | 84.17 ± 3.13 79.17 ± 3.25 * 96.17 ± 5.15 87.83 ± 3.49 | 4.55% at 3rd h 9.52% at 4th h 0.51% at 4th h 8.71% at 3rd h |
| Fed Model | Control C. sativus Control C. pepo | 120.17 ± 2.4 124.33 ± 7.87 126.83 ± 5.78 129.0 ± 10.77 | 124.67 ± 4.27 113.33 ± 13.52 127.83 ± 5.19 130.33 ± 6.95 | 122.17 ± 6.91 107.17 ± 9.91 * 125.67 ± 5.43 117.67 ± 7.31 | 119.17 ± 8.91 105.0 ± 5.06 * 126.67 ± 6.92 119.67 ± 9.99 | 0.83% at 4th h 15.54% at 4th h 0.91% at 3rd h 8.78% at 3rd h |
| Diabetic Model | Control C. sativus Control C. pepo | 210.33 ± 4.23 206.67 ± 5.89 210.0 ± 3.16 208.17 ± 2.32 | 208.0 ± 7.87 190.83 ± 11.05 210.33 ± 3.01 192.5 ± 1.22 | 210.83 ± 2.48 170.83 ± 14.99 *** 207.83 ± 4.45 188.83 ± 1.72 | 205.5 ± 8.02 164.83 ± 15.48 **** 206.67 ± 4.68 186.33 ± 4.13 **** | 2.29% at 4th h 20.4% at 4th h 1.58% at 4th h 10.49% at 4th h |
| Group | Treatment | Blood Sugar Level mg/dL (Mean± SD.) at Time (h) | Maximum % of Blood Sugar Lowering from Initial Value | |||
|---|---|---|---|---|---|---|
| 0 h | 1/2 h | 1 h | 3 h | |||
| Glucose-Loaded Model | Control C. sativus Control C. pepo | 115.83 ± 11.46 117.0 ± 2.37 92.83 ± 5.27 98.33 ± 4.97 | 129.5 ± 9.48 125.33 ± 3.88 110.17 ± 6.05 113.17 ± 4.88 | 128.83 ± 6.46 121.67 ± 10.03 113.5 ± 5.79 104.67 ± 3.72 | 124.83 ± 4.83 105.67 ± 5.68 * 105.5 ± 7.23 96.67 ± 4.80 | No lowering 9.68% at 3rd h No lowering 1.68% at 3rd h |
Disclaimer/Publisher’s Note: The statements, opinions and data contained in all publications are solely those of the individual author(s) and contributor(s) and not of MDPI and/or the editor(s). MDPI and/or the editor(s) disclaim responsibility for any injury to people or property resulting from any ideas, methods, instructions or products referred to in the content. |
© 2025 by the authors. Licensee MDPI, Basel, Switzerland. This article is an open access article distributed under the terms and conditions of the Creative Commons Attribution (CC BY) license (https://creativecommons.org/licenses/by/4.0/).
Share and Cite
Gautam, V.; Saxena, A.M. Comparative Evaluation of Hypoglycemic Activity of Cucumis sativus and Cucurbita pepo Whole Plant Extracts in Normal and Streptozotocin-Induced Diabetic Rats. Biol. Life Sci. Forum 2024, 40, 51. https://doi.org/10.3390/blsf2024040051
Gautam V, Saxena AM. Comparative Evaluation of Hypoglycemic Activity of Cucumis sativus and Cucurbita pepo Whole Plant Extracts in Normal and Streptozotocin-Induced Diabetic Rats. Biology and Life Sciences Forum. 2024; 40(1):51. https://doi.org/10.3390/blsf2024040051
Chicago/Turabian StyleGautam, Vikas, and Anand Murari Saxena. 2024. "Comparative Evaluation of Hypoglycemic Activity of Cucumis sativus and Cucurbita pepo Whole Plant Extracts in Normal and Streptozotocin-Induced Diabetic Rats" Biology and Life Sciences Forum 40, no. 1: 51. https://doi.org/10.3390/blsf2024040051
APA StyleGautam, V., & Saxena, A. M. (2024). Comparative Evaluation of Hypoglycemic Activity of Cucumis sativus and Cucurbita pepo Whole Plant Extracts in Normal and Streptozotocin-Induced Diabetic Rats. Biology and Life Sciences Forum, 40(1), 51. https://doi.org/10.3390/blsf2024040051