Abstract
One ton of potatoes processed to starch yields 5 to 12 m3 of potato fruit juice (PFJ), containing 30–41 wt% per dry matter protein with a high nutritional value that is comparable to eggs and has all essential amino acids. However, high levels of phenolics reduce potato protein concentrate (PPC) quality and taste. This study deployed a sustainable method evaluating novel adsorption resins to bind phenolics in PFJ and improve the PPC. Resins exhibited aqueous phenolic binding capacities ranging from 317 ± 0.5 mg to 606 ± 0.9 mg of Gallic Acid bound per mL of resin. The best performing resin, Strong Anion Exchanger (SAX) 002, significantly reduced PFJ total phenolic content (TPC) from 295 ± 0.6 μg/mL to 84 ± 0.1 μg/mL (Gallic Acid Equivalent (GAE)). Weak Anion Exchanger (WAX) 007 and 008 also decreased TPC to 155 ± 0.2 μg/mL GAE and 154 ± 0.3 μg/mL GAE, respectively. However, the most effective phenolic-binding resin resulted in a lower PPC yield versus control. In contrast, WAX 003 showed moderate phenolic removal but resulted in a higher yield (60 ± 0.69% to 90.1 ± 0.1% of control), demonstrating a trade-off between phenolic reduction and PPC recovery. SAX resins are superior in lowering PFJ and PPC phenolic content through adsorption. The results show the possibilities of using specialized resins to improve PPC quality for human consumption.
1. Introduction
The potato (Solanum tuberosum) originated in northwestern South America [1]. It was brought to Europe by the Spanish, who then disseminated it to China, Japan, Malaysia, and the Moluccas region. It was further introduced to India and Africa by the Portuguese. The United Nations designated 2008 as the Year of the Potato in October 2007, recognizing the crop’s importance as a basic item in human nutrition. Today, potato is the world’s third most significant food crop, after wheat and rice, and is currently grown on an estimated 20 million hectares of cropland, with a global production of 366 million tonnes [2]. This staple crop contains essential amino acids, vitamins, and minerals, and is reported to have a significant role in human nutrition [3].
The potato tuber contains up to 2% protein, 20% starch, 1% fiber, 75% water, and 2% of other beneficial bioactive compounds [4]. In 2022, 4.25 million tonnes of starch was produced from potato [5]. Besides starch, commercial potato protein concentrate (PPC) is a side product from potato starch production, where one ton of potatoes processed to starch yields 5 to 12 m3 of potato fruit juice (PFJ). This PFJ contains high concentration of protein, 30–41 wt% per dry matter [6]. The protein is collected commercially through the application of heat and reduced pH precipitation. Furthermore, the nutritional value of potato protein has proven superior to most major plant proteins and can be compared to the nutritional value of eggs [7]. All essential amino acids are present in the protein precipitated from PFJ, and it has a digestion-adjusted amino acid score of 0.85 out of 1, indicating excellent protein quality [8]. However, the undesirable sensory qualities imparted by phenolic compounds limit applications for this otherwise nutritious protein. In terms of phenolic compound profile and content, potato germplasm displays a wide range [9]; having a higher total phenolic content (TPC) than other common fruits and vegetables including carrots, onions, and tomatoes [10]. The sensory qualities such as taste, color, and texture of potato-derived processed food are affected by the high phenolic content [11,12,13], thus, rendering some products, including protein extracted from PFJ, less desirable by humans.
The bulk of the protein produced from industrial starch potato PFJ processing is used for animal feed, while livestock production/meat, one of the major sources of human protein, is associated with negative environmental impact [14]. Livestock production is also a less effective protein converter, with protein conversion efficiency highly depending on the animal—ranging from 2.5% for beef to 21% for poultry [15].
Due to environmental concerns, transitioning to more sustainable diets and researching alternative protein sources for the world’s growing population is important and has been at the forefront of many scientific studies [16,17,18]. As part of this transition and to enhance the production and consumption of sustainable protein, many methods, food processing techniques, and separation technologies have been employed for the purification of potato protein for human use [6]. Ion exchange has been one of the effective methods used in this regard. It uses a mechanism in which the protein is adsorbed in the pores of the resin and desorbed with the use of sodium chloride or sodium hydroxide for recovery. In this process, undesired components in potato such as glycoalkaloids and phenolics are not present after protein recovery [6]. This study uses an effective and more sustainable alternative method in which the undesired components (e.g., phenolics) are adsorbed while the protein is not adsorbed due to the small pore size (10 to 15 Å) of the resin and remains in the PFJ. It aims to improve the quality of precipitated potato protein concentrate for human consumption using novel adsorption resins by assessing the resins’ capacity and effectiveness for binding phenolics in both pure solutions and PFJ. This study also assessed the effect of the resins on the yield of PPC as well as the TPC of the recovered protein concentrate.
2. Materials and Methods
A total of 20 novel adsorption and ion exchange resins were provided by Redstone Separations AB (Alnarp, Skåne County, Sweden). These resins were categorized as Strong Anion Exchange (SAX) Resins, Weak Anion Exchange (WAX) Resins, Reversed Phase (RP) Resins, and a Weak Cation Exchange (WCX) Resin. WCX was not expected to perform well in binding phenolics and was used as a ‘control resin’ for the preliminary screening. Silica gel (Silica gel 60 (0.2–0.5 mm), CAS No. 7631-86-9, Merck KGaA, Darmstadt, Hessen, Germany) was used in all experiments including the preliminary screening as the control. All other chemicals were purchased from Sigma-Aldrich as analytical grade or better unless otherwise stated.
2.1. Preliminary Screening of Resins for Phenolic Binding
2.1.1. Dilution and Establishing a Standard Curve
The Folin-Ciocâlteu spectrophotometric method [19] was used to quantify selected phenolics. Phenolic compounds were selected based on their presence in potato or other common foods, chemical structures, water solubility, and availability (Table 1). Batches of 300 μg/mL stock solutions were prepared in MilliQ water for Gallic Acid, Vanillic Acid, Vanillin, Methyl Gallate, and Tannic Acid, while Rutin Hydrate required a 200 μg/mL solution due to its lower solubility. The solutions were sonicated (Branson 2510, Branson Ultrasonics, CT, USA ) before generating standard calibration curves (0, 10, 20, 50, 100, 200, and 300 μg/mL) and stored at 5 °C in the darkness.

Table 1.
Phenolic compounds selected for the preliminary screening of resin, showing a food/plant it is found in, concentration used, and solubility in water [20,21,22,23,24,25].
2.1.2. Resin Binding Analysis
All resins (1 mL each, placed in glass tubes) were preconditioned with deionized water, except WAX 005 and WAX 007, which required ethanol (EtOH) for preconditioning. Resins that required EtOH for preconditioning were first treated with 10 mL of 96% EtOH before adding 10 mL of deionized water. After that, resins were allowed to settle before decanting the solution and the resin was washed thrice with deionized water (10 mL × 3). Resins preconditioned with water were treated only with 10 mL of deionized water, allowed to settle for 1 min, then the water was decanted. After preconditioning, 10 mL stock solutions were added to each resin and shaken gently for 2 h.
2.1.3. Folin-Ciocâlteu Spectrophotometric Method
The TPCs of the solutions (after contact with the resins for 2 h) were determined according to the Folin-Ciocâlteu spectrophotometric method [19]. Briefly, 12 µL of standards or supernatants from solutions exposed to the resins were pipetted in technical triplicates into the wells of a 96-well plate followed by 12 µL of Folin-Ciocâlteu reagent, then incubated for 6 min. An amount of 125 µL of 7% (w/v) Na2CO3 was then placed in each well containing supernatants and standards with a multi-channel pipette. An amount of 50 µL of MilliQ water was then added to each well, and the solution mixed before incubating for 75 min in the dark at room temperature. After incubation, the absorbance at 765 nm was measured using a spectrophotometer (Multiskan GO, Thermo Scientific, Vantaa, Uusimaa, Finland). The TPCs of the supernatants were then calculated based on the standard curves of the pure phenolic compounds selected for the preliminary screening (Table 1) and in Gallic Acid equivalents (GAEs) based on the Gallic Acid standard calibration curves for PFJ.
2.2. Resin Capacity Determination
2.2.1. Gallic Acid Binding, Recovery, and Titration Against Hydrochloric Acid (HCl)
Resin capacities were assessed using Gallic Acid. Resins (1/3 mL) were screened in 20 mL of 0.3 mg/mL Gallic Acid solution for 2 h. An amount of 1/3 mL of each resin was measured by dividing 1 mL of its weight by 3. RP resins were selected for Gallic Acid recovery testing based on their chemistry and hydrophobic properties. Recovery involved washing resins thrice with acetone (5 mL), followed by evaporation at 70 °C in a TurboVap (Biotage, Uppsala, Uppsala County, Sweden). Recovered Gallic Acid was quantified gravimetrically (SBS-LW-300A, Steinberg Systems, Hamburg, Hamburg, Germany).
2.2.2. Titration Test of Resins Against HCl
Resin binding sites were assessed by titration according to Belova and Ershova [26]. Preconditioned resins (1 mL) in 20 mL deionized water were titrated with 200 µL aliquots of 1 M HCl until pH stabilization (inoLab pH 7110, WTW, Warrenville, IL, USA). This was repeated multiple times. The amount of HCl adsorbed by each resin before saturation of the active sites was calculated to determine the resin capacity.
2.3. Removal of Phenolics from PFJ
Resins that exhibited more than 500 mg/mL Gallic Acid adsorption in the result of the Gallic Acid binding and recovery experiment were selected and tested with commercial PFJ that was generously supplied by Lyckeby Starch (Kristianstad, Skåne County, Sweden). The PFJ (20 mL) was centrifuged (5000 RCF, 15 min, RT, LBS-LZ-400B, Steinberg Systems, Germany) and treated with 1 mL of preconditioned resin for 2 h with gentle shaking. TPC in the supernatants was measured using the Section 2.1.3, and calculated as µg/mL Gallic Acid Equivalents (GAEs).
2.4. Potato Protein Precipitation
Protein was precipitated from resin-treated PFJ according to Strolle et al. [27]. Samples (15 mL PFJ) were centrifuged (Electric Centrifuge, LBS-LZ-400B, 5000 RCF, 15 min) to remove particles then acidified to pH 5 with food-grade acetic acid (24% acetic acid, Perstorps Absolut Ren Ättika, Perstorp, Skåne County, Sweden), heat-treated for 75 min in a boiling water bath, cooled, and centrifuged (2300 RCF, 30 min). The supernatants were poured into new tubes while the wet protein pellets were kept in the initial tubes. The wet protein pellets were frozen at −80 °C and subsequently freeze dried (110-4 PRO CoolSafe, Scanvac, Lillerød, Capital Region, Denmark). The dry mass of the coagulated PPC was then quantified.
2.5. Analysis of the Phenolic Content in Precipitated PPC
2.5.1. Free Phenolic Extraction
Ground freeze dried PPC (50 mg) in 2 mL Eppendorf tubes was extracted with 1 mL 80% EtOH. Samples were vortex mixed (10 s), ultrasonicated (10 min, room temperature; Digitec, Bandelin Sonorex, Berlin, Berlin, Germany), and centrifuged (2500 RCF, 5 min; Legend Micro 17, Thermo Scientific, Dreieich, Hesse, Germany). This process was repeated thrice and supernatants combined. Combined extracts were vacuum-evaporated (60 min, SpeedVac SVC-100, Savant, Farmingdale, NY, USA), cooled (−20 °C, 15 min), and reconstituted in 0.5 mL cold 50% EtOH with 2% acetic acid (v/v).
2.5.2. Alkaline Extraction of Bound Phenolics
Residual pellets were hydrolyzed in 1.2 mL MilliQ water and 0.5 mL of 10 M NaOH, vortex mixed (Vortex-Genie 2, Scientific Industries, Bohemia, NY, USA), and incubated overnight for 16 h at room temperature. Samples were centrifuged at 16,200 RCF for 20 min, and supernatants were extracted thrice with 0.6 mL of ethyl acetate. Combined extracts were evaporated (SpeedVac, SVC-100, Savant, Farmingdale, NY, USA) and placed in the freezer at −20 °C for cooling before dissolving the samples with 0.5 mL cold solution of 50% EtOH, 2% acetic acid v/v. The samples were then stored at −20 °C pending analysis.
2.5.3. Acidic Extraction of Bound Phenolics
The remaining pellets after alkaline hydrolysis were acidified with 0.2 mL 37% HCl, heated (85 °C, 30 min), and pH checked using litmus paper to ensure pH under 2. After centrifugation (16,200 RCF, 20 min), supernatants underwent triple ethyl acetate extraction, evaporation, and reconstitution following the same procedure described in Section 2.5.2.
2.5.4. Total Phenolic Content (TPC)
The TPCs of the precipitated PPCs were analyzed according to Folin and Ciocâlteu [19], as described in Section 2.1.3.
2.6. Data Analysis
The experiments were conducted in technical triplicates and data were processed and analyzed using Microsoft Excel 2010, GraphPad Prism 10.1.0, and Minitab 21.1.1.0 to indicate the levels of residual phenolic content in the supernatants after resin treatment and to determine whether the results of the treatments were significantly different, respectively. The standard deviation (SD) is denoted by the error bars in the graphs and expressed in the results as mean ± SD. To compare the results and determine whether the differences between the treatments (individual resin performance) were statistically significant, the Tukey Method within a General Linear Model was performed (Minitab 21.1.1.0 statistical software) with a significance threshold of 0.05. Results that are not significantly different are denoted by the same character over their representative bar in the figures.
3. Results and Discussion
3.1. Preliminary Screening of Resins for Their Binding Towards Phenolics
Preliminary screening showed that practically all SAX, RP, and WAX resins effectively bound Gallic Acid, Vanillic Acid, Vanillin, Methyl Gallate, Tannic Acid (from 300 μg/mL solutions), and Rutin Hydrate (from 200 μg/mL solution) as pure compounds in aqueous solution with essentially no residual phenolics found in the supernatants after resin treatment (Figure 1).
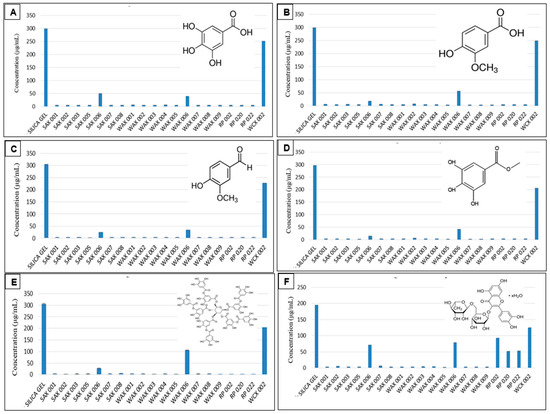
Figure 1.
Resin binding of Gallic Acid (A), Vanillic Acid (B), Vanillin (C), Methyl Gallate (D), Tannic Acid (E), and Rutin Hydrate (F) in aqueous solution. (Measurements carried out in triplicate; error bars may be too small to be seen).
Their opposite charge explains the good phenolic (negative charge) binding to the positively charged SAX and WAX resins. For the RP resins which are non-charged and hydrophobic, the aromatic and hydrophobic portion of polyphenols were the basis for retention. This is visible by the hydrophilic sugar moieties of Rutin which bound considerably less to the RP adsorbents. In general, differing resin structures of the resin variants led some resins to bind more of certain phenolics. This was noticeable with resins whose supernatants contained residual phenolics after treatment (Table 2).
Table 2.
Effectiveness of selected resins SAX 006, WAX 006, and WCX 002 Resins, showing comparative variability towards the binding of Gallic Acid, Vanillic Acid, Vanillin, Methyl Gallate, Tannic Acid, and Rutin Hydrate based on the residual phenolics found in supernatants after resin treatment. (Different superscript letters within each row indicate significant differences (p < 0.05) based on Tukey’s test).
3.2. Resin Capacity Determination
Gallic Acid Binding, Recovery, and Titration Against HCl
Resin binding capacity was examined by treating resins with a high Gallic Acid concentration (11.54 mg/mL). Though 1/3 mL resin volumes reached capacity, Gallic Acid binding varied from 105.7 ± 0.2 to 202 ± 0.3 mg (317 ± 0.5 to 606 ± 0.9 mg per mL resin) out of the total 230.8 mg of Gallic Acid present in the solution (Figure 2A). WAX 003 bound the most at 606 ± 0.9 mg/mL. Among other high-performing SAX and WAX resins, there were no significant differences. Further, between 96.5 ± 0.8–97.7 ± 0.5 of bound Gallic Acid was recovered from RP resins using acetone to recover Gallic Acid from the resins (Table 3).
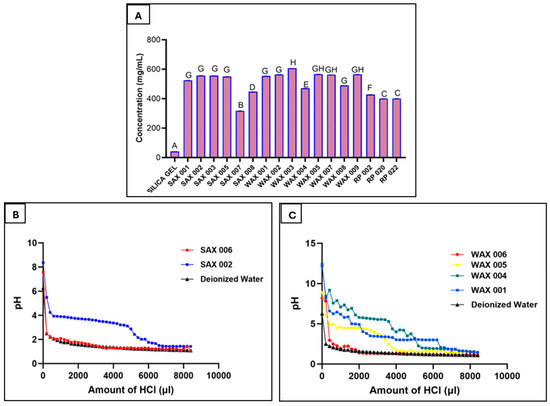
Figure 2.
Resin binding of Gallic Acid in aqueous solution to determine capacity (A), SAX resin titration, showing the operating capacities of the resins (1 M HCl added) (B), WAX resin titration, showing the operating capacities of the resins (1 M HCl added) (C). (Measurements carried out in triplicate; error bars may be too small to be seen, results denoted by the same letter in A are not significantly different).
Table 3.
Recovery percentage of bound Gallic Acid (GA) from RP resins using acetone. (Different superscript letters within each column indicate significant differences (p < 0.05) based on Tukey’s test.)
Titration with 1 M HCl determined resin binding capacities. The highest capacities were seen for WAX 001 (6.2 mmol/mL), SAX 002 (5.2 mmol/mL), WAX 004 (5.1 mmol/mL), and WAX 005 (3.6 mmol/mL), while low-performing WAX 006 (0.4 mmol/mL) and SAX 006 (0.2 mmol/mL) showed poorer capacities that matched the result of their earlier phenolic binding assays (Figure 2B,C). The basicity of WAX resins likely elevated their capacity projections.
Binding of Gallic Acid to RP adsorbents demonstrated that a large portion of bound phenolics can be desorbed from the resin. It may be important to retrieve bound phenolics as they could be valuable raw materials for uses such as food preservatives or health supplements. Also, the ability to wash off bound compounds from a resin after use is important for regeneration and re-use of the resin.
3.3. Removal of Phenolics from PFJ
Both SAX and WAX resins effectively bound phenolics in PFJ. However, SAX resins reduced TPC significantly more. Particularly, SAX 001, SAX 002, SAX 003, and SAX 005 lowered TPC from 295 ± 0.6 μg/mL in untreated PFJ down to 96 ± 0.5, 84 ± 0.1, 111 ± 0.4, and 101 ± 0.3 μg/mg Gallic Acid equivalents (GAEs), respectively (a 72% reduction for SAX 002, the most effective SAX resin), whereas the best performing WAX resins (WAX 001, 002, 003, 005, 007, 008, 009) only lowered TPC to 220 ± 0.6, 200 ± 0.5, 176 ± 0.2, 196 ± 0.4, 155 ± 0.2, 154 ± 0.3, and 181 ± 0.1 μg/mg GAE reduction, respectively (a 49% reduction for WAX 008, the most effective WAX resin) (Figure 3A).
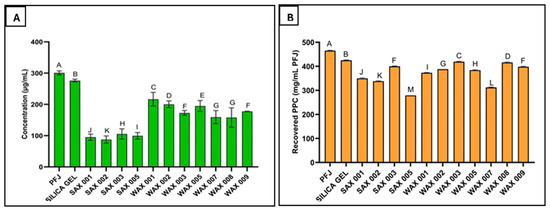
Figure 3.
Effectiveness of SAX and WAX resins towards the binding of phenolics in potato fruit juice (A), and resin effect on the yield of PPC recovered after precipitation (B). (Measurements carried out in triplicate, error bars may be too small to be seen. Results denoted by the same letter are not significantly different).
The improved performance of SAX over WAX resins is potentially attributed to proprietary differences in resin types and properties. SAX resins may also maintain binding potential over a broader pH range compared to the more pH-sensitive WAX resins. These findings align with a study showing anion exchange resins effectively removed phenolics from solution, and that resin selection significantly impacts removal efficacy [28].
As pH was not controlled during resin treatment in order to reflect real-world applications, variations in the pH of PFJ during adsorption may have contributed to the observed resin performance differences. However, adjusting pH may have yielded different results. Ultimately, SAX resins outperformed WAX resins in binding PFJ phenolics under pH-unregulated conditions by reducing TPC an additional 3.5-fold.
3.4. Potato Protein Precipitation
Resin treatment variably impacted the PPC yield from PFJ, ranging from 60 ± 0.7 to 90.1 ± 0.1% compared to that of the untreated PFJ control (Figure 3B). The highest PPC yield (27.9 ± 0.9 mg/mL) was recovered using WAX 003 resin, while 31 ± 0.8 mg/mL was recovered from the control (untreated). This constituted 90.1 ± 0.1% of the expected yield. In comparison, SAX 005 resin resulted in the lowest yield at 18.6 ± 0.5 mg/mL PFJ (60 ± 0.7% of the control). These reported yields reflect only the mass of recovered PPC, not its protein content.
The PPC recovered after SAX 002 treatment demonstrated the lowest total phenolic content at 0.3 ± 0.2 μg/mg GAE after free, alkaline, and acidic phenolic extractions. This projects SAX 002 as the most effective resin for improving PPC quality. Further, this phenolic level is comparable to some fruits and vegetables, such as carrots (0.114–0.306 μg/mg) [29]. Additionally, the improved quality of resin-treated PPC samples was visibly evidenced by more appealing coloration. As phenolic content decreased, PPC samples had a cleaner appearance that differed among resins. Thus, resins may be removing additional unknown PPC components beyond phenolics alone. However, improving purity appears to trade off against protein yield, as the highest yielding and lowest phenolic content was not produced by the same resin.
3.5. Removal of Phenolics from PPC
Resin treatment reduced the phenolic content detected in recovered PPC. Phenolic levels decreased by varying extents depending on the resin. Further residual PPC phenolics comprised primarily the free form with limited bound phenolics (Figure 3). Depending on the resin, free phenolic content was reduced up to 9.1-fold, from 2.7 ± 0.9 down to 0.3 ± 0.3 μg/mg after 80% EtOH washing (Figure 4A). Alkaline extraction removed most of the bound phenolics (Figure 4B), while acidic extraction removed extremely low levels (Figure 4C)—far less than untreated PPC or silica gel-treated controls. This demonstrates the ability of resins to effectively extract phenolics from PFJ resulting in lower levels in subsequently precipitated PPC. The combination of SAX 002 treatment and EtOH washing lowered TPC 180 times compared to the untreated PPC. Therefore, reducing phenolics content in PFJ before protein precipitation can directly lower the phenolic residues in PPC.
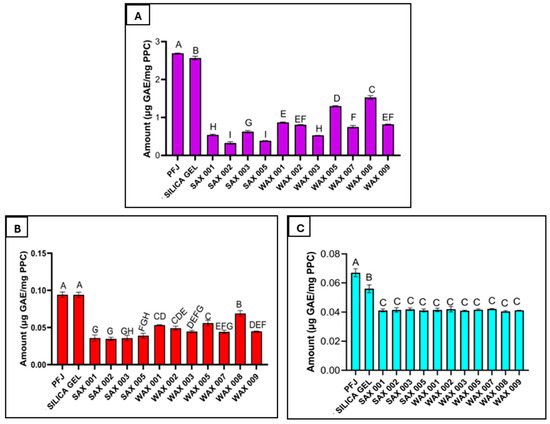
Figure 4.
Free phenolics extracted from the PPC with 80% EtOH (A), bound phenolics extracted from the PPC by the alkaline procedure (B), bound phenolics extracted from the PPC by the acidic procedure (C). Note: The scale of the y-axis is different for each graph. Results denoted by the same letter are not significantly different.
There was a trade-off between protein yield and phenolic level. While SAX 002 resin most effectively reduced the phenolics found in PPC, it lowered protein yield to 22.5 ± 0.2 mg/mL from the expected 31 ± 0.8 mg/mL. In comparison, WAX 003 which was the highest-yielding resin achieved a PPC yield of 27.9 ± 0.9 mg/mL but with far higher residual phenolic levels than SAX 002.
3.6. Relationship Between the Total Phenolic Content of the PPC and the Amount of PPC Recovered
There was a moderate correlation (R2 = 0.482) observed between lower PPC phenolic content and lower protein yield when using SAX and WAX resins (Figure 5). However, the cleanest PPC with the lowest phenolics was obtained from SAX resins, but most yielded less than 24 mg/mL PFJ from an expected 31 ± 0.8 mg/mL. WAX 003 resin on the other hand achieved both a high reduction in PPC phenolics and the highest protein yield at 27.9 mg/mL PFJ. No other WAX resin achieved this performance, placing most of the resins in this category below the SAX resins. The procedure for PPC recovery was not changed from that developed for unimproved PFJ; further development of the precipitation protocol may improve the PPC yield but was beyond the scope of this study.
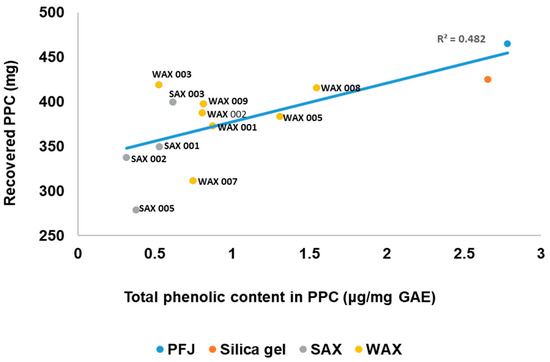
Figure 5.
Relationship between the total phenolic content of the PPC after resin treatment and the amount of PPC recovered.
Overall, the resins showed positive effects on bound PPC phenolics compared to untreated PFJ or silica controls. Combining SAX 002, the best resin for reducing phenolics in PFJ, with 80% EtOH PPC washing decreased bound phenolic content 180 times over unwashed PPC (2.8 μg/GAE/mg). This significant reduction is attributed to the resins, since the washed PPC from untreated PFJ only decreased TPC 8.7 times and contained residual phenolics. Decreasing PFJ phenolics clearly also lowers PPC phenolic levels. Selecting optimal resins therefore requires balancing both high protein recovery and purity based on factors such as type and concentration of extract contaminants.
4. Conclusions
This study evaluated the effectiveness of novel adsorption resins as a sustainable alternative method for reducing phenolic levels in potato fruit juice (PFJ) and improving the quality of recovered potato protein concentrate (PPC). The resins demonstrated the ability to bind different phenolic compounds in aqueous solution and reduce total phenolic content (TPC) in PFJ to varying extents. SAX resins, especially SAX 001, SAX 002, SAX 003, and SAX 005, lowered TPC in PFJ more effectively than WAX resins. Treatment with SAX 002 resin before precipitation resulted in the lowest residual phenolic levels in PPC after extraction of free phenolics (0.29 ± 0.3 μg/mg) and bound phenolics (0.31 ± 0.2 μg/mg). This represented a 180-fold reduction in total phenolic content compared to untreated PPC. These resins, particularly those of the RP category, also showed high potential of being reused since between 96.5 ± 0.8% and 97.7 ± 0.5% of bound phenolics can be recovered from the binding sites. However, SAX 002 also reduced protein yield in PPC to 60 ± 0.7% of control levels, indicating a trade-off between purity and yield. In contrast, WAX 003 resin achieved a higher PPC yield (90.1 ± 0.1%) but with moderately higher residual phenolics than the best SAX resins.
These findings demonstrate the ability and feasibility of novel adsorption resins, particularly SAX types, to effectively bind phenolic contaminants in PFJ and improve the quality of recovered potato protein towards human consumption or enhanced animal feed. Further research should focus on balancing resin performance to ensure both optimal PPC purity and product yield for various food applications. Resin selection criteria should consider matrix complexity, target contaminants, acceptable product loss, and required purity levels.
Author Contributions
T.W.D.: conceptualization, data curation, formal analysis, investigation, methodology, software, validation, visualization, writing—original draft, writing—review and editing; E.Y.: conceptualization, funding acquisition, methodology, project administration, resources, supervision, validation, writing—review and editing; W.R.N.: conceptualization, funding acquisition, methodology, project administration, resources, supervision, validation, writing—review and editing. All authors have read and agreed to the published version of the manuscript.
Funding
This research was supported by Vinnova grant 2021-03564. W. Newson was also supported by the Kompetensförsörjning befintliga resurspersoner at SLU.
Institutional Review Board Statement
Not applicable.
Informed Consent Statement
Not applicable.
Data Availability Statement
Data will be made available on request.
Acknowledgments
This publication has been produced during TW Davis’s scholarship period at Swedish University of Agricultural Sciences (SLU), which was funded by the Swedish Institute (SI).
Conflicts of Interest
Co-author E.Y. serves as the CEO of Redstone Separation AB, the company that manufactured the resins used in this study. While E.Y. contributed to conceptualization, funding acquisition, methodology, project administration, resources, supervision, validation, and manuscript review, E.Y. was not involved in the investigation, data curation or formal analysis of the study results. These responsibilities were handled independently by T.W.D. to ensure objectivity in the development of an alternative method for potato protein purification.
References
- Bradshaw, J.E.; Ramsay, G. Potato Origin and Production. In Advances in Potato Chemistry and Technology; Elsevier: Amsterdam, The Netherlands, 2009; pp. 1–26. [Google Scholar]
- Devaux, A.; Goffart, J.P.; Kromann, P.; Andrade-Piedra, J.; Polar, V.; Hareau, G. The Potato of the Future: Opportunities and Challenges in Sustainable Agri-food Systems. Potato Res. 2021, 64, 681–720. [Google Scholar] [CrossRef] [PubMed]
- Deußer, H.; Guignard, C.; Hoffmann, L.; Evers, D. Polyphenol and glycoalkaloid contents in potato cultivars grown in Luxembourg. Food Chem. 2012, 135, 2814–2824. [Google Scholar] [CrossRef] [PubMed]
- Burlingame, B.; Mouillé, B.; Charrondière, R. Nutrients, bioactive non-nutrients and anti-nutrients in potatoes. J. Food Compos. Anal. 2009, 22, 494–502. [Google Scholar] [CrossRef]
- ChemAnalyst. Potato Starch Market Analysis: Industry Market Size, Plant Capacity, Production, Operating Efficiency, Demand & Supply Gap, End-User Industries, Sales Channel, Regional Demand, Company Share, Manufacturing Process, 2015–2034. Available online: https://www.chemanalyst.com/industry-report/potato-starch-market-3131 (accessed on 20 February 2025).
- Løkra, S.; Strætkvern, K.O. Industrial Proteins from Potato Juice. A Review. Food 2009, 3, 88–95. [Google Scholar]
- Ralet, M.C.; Guéguen, J. Fractionation of Potato Proteins: Solubility, Thermal Coagulation and Emulsifying Properties. LWT-Food Sci. Technol. 2000, 33, 380–387. [Google Scholar] [CrossRef]
- Hertzler, S.R.; Lieblein-Boff, J.C.; Weiler, M.; Allgeier, C. Plant Proteins: Assessing Their Nutritional Quality and Effects on Health and Physical Function. Nutrients 2020, 12, 3704. [Google Scholar] [CrossRef]
- Andre, C.M.; Ghislain, M.; Bertin, P.; Oufir, M.; Herrera, M.D.R.; Hoffmann, L.; Hausman, J.F.; Larondelle, Y.; Evers, D. Andean potato cultivars (Solanum tuberosum L.) as a source of antioxidant and mineral micronutrients. J. Agric. Food Chem. 2007, 55, 366–378. [Google Scholar] [CrossRef]
- Chun, O.K.; Kim, D.O.; Smith, N.; Schroeder, D.; Han, J.T.; Chang, Y.L. Daily consumption of phenolics and total antioxidant capacity from fruit and vegetables in the American diet. J. Sci. Food Agric. 2005, 85, 1715–1724. [Google Scholar] [CrossRef]
- Kroon, P.A.; Williams, G. Hydroxycinnamates in plants and food: Current and future perspectives. J. Sci. Food Agric. 1999, 79, 355–361. [Google Scholar] [CrossRef]
- Alasalvar, C.; Grigor, J.M.; Zhang, D.; Quantick, P.C.; Shahidi, F. Comparison of volatiles, phenolics, sugars, antioxidant vitamins, and sensory quality of different colored carrot varieties. J. Agric. Food Chem. 2001, 49, 1410–1416. [Google Scholar] [CrossRef]
- Rytel, E.; Tajner-Czopek, A.; Kita, A.; Aniołowska, M.; Kucharska, A.Z.; Sokół-Łętowska, A.; Hamouz, K. Content of polyphenols in coloured and yellow fleshed potatoes during dices processing. Food Chem. 2014, 161, 224–229. [Google Scholar] [CrossRef]
- de Vries, M.; de Boer, I.J.M. Comparing environmental impacts for livestock products: A review of life cycle assessments. Livest. Sci. 2010, 128, 1–11. [Google Scholar] [CrossRef]
- Shepon, A.; Eshel, G.; Noor, E.; Milo, R. Energy and protein feed-to-food conversion efficiencies in the US and potential food security gains from dietary changes. Environ. Res. Lett. 2016, 11, 105002. [Google Scholar] [CrossRef]
- Lonnie, M.; Johnstone, A.M. The public health rationale for promoting plant protein as an important part of a sustainable and healthy diet. Nutr. Bull. 2020, 45, 281–293. [Google Scholar] [CrossRef]
- Manners, R.; Blanco-Gutiérrez, I.; Varela-Ortega, C.; Tarquis, A.M. Transitioning European Protein-Rich Food Consumption and Production towards More Sustainable Patterns-Strategies and Policy Suggestions. Sustainability 2020, 12, 1962. [Google Scholar] [CrossRef]
- Anderson, C.A.M.; Bradley, R. The potential of novel plant protein foods to improve dietary patterns and markers of cardiovascular health. Am. J. Clin. Nutr. 2020, 112, 1151–1152. [Google Scholar] [CrossRef] [PubMed]
- Folin, O.; Ciocalteu, V. On Tyrosine and Tryptophane Determinations in Proteins. J. Biol. Chem. 1927, 73, 627–650. [Google Scholar] [CrossRef]
- Huang, W.Y.; Zhang, H.C.; Liu, W.X.; Li, C.Y. Survey of antioxidant capacity and phenolic composition of blueberry, blackberry, and strawberry in Nanjing. J. Zhejiang Univ. Sci. B 2012, 13, 94–102. [Google Scholar] [CrossRef]
- Aguilera, Y.; Rebollo-Hernanz, M.; Cañas, S.; Taladrid, D.; Martín-Cabrejas, M.A. Response surface methodology to optimise the heat-assisted aqueous extraction of phenolic compounds from coffee parchment and their comprehensive analysis. Food Funct. 2019, 10, 4739–4750. [Google Scholar] [CrossRef]
- Gallage, N.J.; Hansen, E.H.; Kannangara, R.; Olsen, C.E.; Motawia, M.S.; Jørgensen, K.; Holme, I.; Hebelstrup, K.; Grisoni, M.; Møller, B.L. Vanillin formation from ferulic acid in Vanilla planifolia is catalysed by a single enzyme. Nat. Commun. 2014, 5, 4037. [Google Scholar] [CrossRef]
- Choi, J.G.; Kang, O.H.; Lee, Y.S.; Oh, Y.C.; Chae, H.S.; Jang, H.J.; Shin, D.W.; Kwon, D.Y. Antibacterial activity of methyl gallate isolated from galla rhois or carvacrol combined with nalidixic acid against nalidixic acid resistant bacteria. Molecules 2009, 14, 1773–1780. [Google Scholar] [CrossRef] [PubMed]
- Naus, P.J.; Henson, R.; Bleeker, G.; Wehbe, H.; Meng, F.; Patel, T. Tannic acid synergizes the cytotoxicity of chemotherapeutic drugs in human cholangiocarcinoma by modulating drug efflux pathways. J. Hepatol. 2007, 46, 222–229. [Google Scholar] [CrossRef]
- Awatsuhara, R.; Harada, K.; Maeda, T.; Nomura, T.; Nagao, K. Antioxidative activity of the buckwheat polyphenol rutin in combination with ovalbumin. Mol. Med. Rep. 2009, 3, 121–125. [Google Scholar] [CrossRef] [PubMed][Green Version]
- Belova, T.P.; Ershova, L.S. Boron concentration by industrial anion exchanger resins from model solutions in a dynamic mode. Heliyon 2021, 7, e06141. [Google Scholar] [CrossRef]
- Strolle, E.O.; Cording, J.; Aceto, N.C. Recovering Potato Proteins Coagulated by Steam Injection Heating. J. Agric. Food Chem. 1973, 21, 974–977. [Google Scholar] [CrossRef]
- ÖSandıkçı, Ö.; Parmaksız, A.; Kocaoğlu, A.; Arar, Ö.; Yüksel, Ü. The effect of ion exchange resin form on the removal of phenol from water. J. Turk. Chem. Soc. Sect. A Chem. 2017, 4, 969–980. [Google Scholar]
- Koca Bozalan, N.; Karadeniz, F. Carotenoid profile, total phenolic content, and antioxidant activity of carrots. Int. J. Food Prop. 2011, 14, 1060–1068. [Google Scholar] [CrossRef]


Disclaimer/Publisher’s Note: The statements, opinions and data contained in all publications are solely those of the individual author(s) and contributor(s) and not of MDPI and/or the editor(s). MDPI and/or the editor(s) disclaim responsibility for any injury to people or property resulting from any ideas, methods, instructions or products referred to in the content. |
© 2025 by the authors. Licensee MDPI, Basel, Switzerland. This article is an open access article distributed under the terms and conditions of the Creative Commons Attribution (CC BY) license (https://creativecommons.org/licenses/by/4.0/).