Proceeding Paper

Land Surface Temperature Responses to Land Use Land Cover Dynamics (District of Taroudant, Morocco) †

Faculty of Sciences, Chouaib Doukkali University, El Jadida 24000, Morocco
*
Author to whom correspondence should be addressed.
Presented at the 1st International Electronic Conference on Agronomy, Online, 3–17 May 2021; Available online: https://sciforum.net/conference/IECAG2021.
Biol. Life Sci. Forum 2021, 3(1), 28; https://doi.org/10.3390/IECAG2021-09726
Published: 1 May 2021
(This article belongs to the Proceedings of The 1st International Electronic Conference on Agronomy)

Abstract

:
Land surface temperature plays an essential role in estimating radiation budgets, in heat balance studies, as a control for climate dynamics and for soil–vegetation–atmosphere transfer modeling, and in studying the impact of land use/land cover (LULC) changes at the regional level. This study provides a comprehensive evaluation of the relationship between land use and land surface temperature (LST), through a landscape dynamics assessment based on multi-source and multi-sensor remote sensing technologies. In particular, the study was performed using Landsat satellite 5 TM, ETM, and OLI 8 data for three different dates (1985, 2001 and 2017) and aimed to assess the effects of land use/land cover changes on the LST distribution in the region of Taroudant, Morocco. Spatial and statistical analysis and comparison of maps generated from remotely sensed data using GIS indicate the existence of different changes in the Taroudant region between 1985 and 2017. These changes are predominantly characterized by an increase in built-up areas and bare ground and a decrease in natural areas (vegetation, forest, etc.). The average temperatures in 1985, 2001 and 2017 in open forests were 32.74 °C, 34.37 °C and 39.17 °C, respectively. The farming greenhouse temperatures were 24.09 °C, 28.5 °C, 35.58 °C, and barren soils 37.14 °C, 38.38 °C, 40.01 °C. The average land surface temperatures of farming lands were 24.31 °C, 27.87 °C and 28.61 °C, respectively. As a result, soil artificialization and everything associated with it, such as greenhouse gas emissions, and abusive consumption of farming and natural land, are likely to be the origin of environmental problems and climate change marked mainly by these changes in surface temperature, irregular rainfall, and unprecedented periods of drought.

1. Introduction

Deforestation, agriculture, and urban sprawl are the principal causes of land use changes, consequently impacting climate, biodiversity, and natural resources. As a result, land use change maps are essential to understanding the significant changes generated by anthropic activities and natural factors at the scale of territory to better manage and plan its development [1,2,3]. Thus, given its synoptic and multi-temporal capabilities, remote sensing has become a veritable tool in the characterization, mapping, and evolution of large physical soil units over time. In this sense, several supervised or unsupervised classification approaches have been developed over the last few decades to make the best use of satellite images [4,5,6]. This study aims to detect and map major changes in land cover from satellite and multi-temporal data and assess their impact on surface temperature in the Taroudant region between 1985 and 2017. The aim of this work is to characterize the state of the large physical units of the soil and their spatio–temporal dynamics to better identify the threats weighing on the environment and natural resources.

2. Study Area

The Taroudant region, which is part of the Souss plain, is located in southwest Morocco, approximately between longitudes 9°6′ and 7°47′ W and latitudes 29°70′ and 31°11′ N (Figure 1). This area is characterized by a semi-arid to sub-desert type of climate, but the mitigating effect of the Atlantic Ocean current and the mountainous barrier of the Anti-Atlas constitute a protection against desert influence. Annual rainfall is low and irregular: 200 mm/year on average in the plain. The temperatures were moderate; the annual average was about 19 °C, the average of the maxima reached 27 °C, and the minimum was 11 °C. In general, the high level of sunshine (3000 h of sunlight per year) and the mildness of the climate provide this region an opportunity for intensive off-season crop production. At the Moroccan level, the Souss Plain is the first Moroccan region producing citrus fruits (more than 40%) and early fruits (more than 60%).

3. Data and Methodology

The spatial and temporal dynamics of land use in the Taroudant region, where agriculture is the main activity, require a diachronic analysis based on a series of satellite images.
The images used in this study are from the Thematic Mapper (TM), Enhanced Thematic Mapper Plus (ETM+) and Operational Land Imager (OLI) sensors, and the Thermal Infra-Red Sensor (TIRS) of Landsat. They were acquired during the same period of the year to reduce problems due to differences in sunlight angles, phenological changes in vegetation, and soil moisture differences [7]. In addition to satellite images, topographic maps were used at 1:100,000.
The methodology adopted to identify the changes at different dates consists of the application of a series of preprocessing (geometric, radiometric, and atmospheric corrections) and numerical treatments (principal component analysis (PCA), calculation of the vegetation index (NDVI), and classifications) (Figure 2). The satellite images derived from these techniques were transformed into thematic maps of land use for the three selected years and then into maps of change during the observed period. The analysis, interpretation, and comparison between the different maps will help to better understand the changes that this region experienced during the study period.

4. Results

4.1. Mapping and Evolution of Land Use

The methodology used gave very satisfactory results and showed its effectiveness for a region with significant vegetal diversity, despite some confusion due to similarities between the spectral signatures of some thematic classes. The overall average classification accuracy was 73%. In the form of digital maps (Figure 3), these results identified the spatiotemporal evolution of land use in the Taroudant region for 32 years (from 1985 to 2017). Examining these maps shows that the most significant change recorded for the open forest class went from 993.28 km2 in 1985 to 403.04 km2 in 2017. It also indicates a spatial expansion of the built-up area (BU) classes and bare soil (BS), which increased from 23.5% in 1985 to 46.3% in 2017, and from 2.35% in 1985 to 8.11% in 2017. For the same period, farming land area of increased by 14.8%. This study also showed that the area equipped with greenhouse farming experienced an increase of 242.55% between 1985 and 2001, followed by a decrease of −43.64% between 2001 and 2017 (Figure 4).

4.2. Spatial Distribution and Changes of Land Surface Temperature (LST)

Many factors affect LST recovery from remotely sensed thermal infrared images [8,9], and they can be mainly classified into two main categories: atmospheric effects and land surface effects [10]. The analysis of the maps of the spatial distribution of surface temperature (Figure 5) showed that its variation is related to the type of land use for the maps of the three years studied (1985, 2001, and 2017). Thus, the lowest LST, between 1985 and 2017, was recorded in farming land, followed by greenhouse farming, built-up areas, open forests, and bare soil. While the comparison between these surface temperature maps highlighted an average increase of 6 °C between 1985 and 2017. These changes in surface temperature are generally controlled in addition to climate change due to the changes that this region experienced during this period (1985 to 2017). Thus, the areas that have recorded a significant increase in LST are those where farming land has become bare soil due to drought and groundwater depletion (case of Sebt Guerdane).

5. Discussion

Land use/land cover (LULC) maps and surface temperature maps (LST), derived from satellite images, were used to quantify the changes in the Taroudant region between 1985 and 2017. However, to evaluate the relationship between LULC and LST, the LST image was overlaid for the same year as the corresponding land cover map. Thus, the average surface temperature of each LULC type was determined. From the analysis of these results, it appears that the surface temperature changed over time according to the different types of land cover and land use. Thus, the surface temperature increased at a high rate in areas where LULC classes were converted to bare soil, the case of farming land and open forest (Argan). However, in areas that have undergone a reverse transformation, marked by the conversion of bare soil into farming land, there is a decrease in surface temperature.
Changes in land use and land cover in the Taroudant region are of both natural and anthropogenic origin. In addition to the extension of artificial surfaces, these changes are mainly due on the one hand to the intense exploitation of groundwater, which has caused a significant regression on the surface of farming land, and on the other hand to climatic changes marked by drought-related damage to the Argan forest, which has experienced this region during the last four decades.

6. Conclusions

The results obtained from the application of automatic classifications on Landsat satellite images highlighted the changes in land cover and surface temperature during 1985–2017. Thus, we found that the most significant changes are mainly in the forest class, which decreased from 993.28 km2 in 1985 to 403.04 km2 in 2017. There was also an increase in the built-up area (BU) and bare soil (BS) classes, which, respectively, passed from 23.5% in 1985 to 46.3% in 2017 and from 2.35% in 1985 to 8.11% in 2017. For the same period, the area of farming land also increased by 14.8%. In terms of the area equipped with greenhouses farming, this study showed an increase of 242.55% between 1985 and 2001, followed by a decrease of −43.64% between 2001 and 2017. These land use changes have a direct impact on the spatial distribution and temporal evolution of the surface temperature. Thus, land use and land cover significantly influence surface temperature, and strongly depend on surface conditions. This is highly expressed in areas with significant transformations, such as areas where farming land has become bare soil or where the forest has been heavily degraded. These areas were recorded during the period 1985–2017, an increase in surface temperature. In the areas with predominantly bare soil and converted to farming land, the surface temperature decreased during the same period. However, in general, the Taroudant region experienced an increase of 6 °C on average LST between 1985 and 2017, which is related to the loss of farming land due to both overexploitation and groundwater depletion and the drought that hit the region during this period.

Supplementary Materials

The following are available online at https://www.mdpi.com/article/10.3390/IECAG2021-09726/s1.

Author Contributions

Conceptualization, A.R., Z.K., A.B., I.E.M. and M.B.; methodology, A.R., Z.K., A.B., I.E.M. and M.B.; software, A.R., Z.K., A.B., I.E.M. and M.B.; validation, A.R., Z.K., A.B., I.E.M. and M.B.; formal analysis, A.R., Z.K., A.B., I.E.M. and M.B.; investigation, A.R., Z.K., A.B., I.E.M. and M.B.; resources, A.R., Z.K., A.B., I.E.M. and M.B.; data curation, A.R., Z.K., A.B., I.E.M. and M.B.; writing—original draft preparation, A.R., Z.K., A.B., I.E.M. and M.B.; writing—review and editing, A.R., Z.K., A.B., I.E.M. and M.B.; visualization, A.R., Z.K., A.B., I.E.M. and M.B.; supervision, A.R., Z.K., A.B., I.E.M. and M.B.; project administration, A.R., Z.K., A.B., I.E.M. and M.B.; funding acquisition, A.R., Z.K., A.B., I.E.M. and M.B. All authors have read and agreed to the published version of the manuscript.

Funding

This research received no external funding.

Institutional Review Board Statement

The study did not require ethical approval.

Informed Consent Statement

Not applicable.

Data Availability Statement

Data availability is not applicable for this study.

Conflicts of Interest

The authors declare no conflict of interest.

References

  1. Pande, C.B.; Moharir, K.N.; Khadri, S.F.R.; Patil, S. Study of land use classification in an arid region using multispectral satellite images. Appl. Water Sci. 2018, 8, 123. [Google Scholar] [CrossRef] [Green Version]
  2. Yang, Y.; Zhang, S.; Liu, Y.; Xing, X.; de Sherbinin, A. Analyzing historical land use changes using a Historical Land Use Reconstruction Model: A case study in Zhenlai County, northeastern China. Sci. Rep. 2017, 7, 41275. [Google Scholar] [CrossRef] [PubMed]
  3. Näschen, K.; Diekkrüger, B.; Evers, M.; Höllermann, B.; Steinbach, S.; Thonfeld, F. The Impact of Land Use/Land Cover Change (LULCC) on Water Resources in a Tropical Catchment in Tanzania under Different Climate Change Scenarios. Sustainability 2019, 11, 7083. [Google Scholar] [CrossRef] [Green Version]
  4. Mohammady, M.; Moradi, H.R.; Zeinivand, H.; Temme, A.J.A.M. A comparison of supervised, unsupervised and synthetic land use classification methods in the north of Iran. Int. J. Environ. Sci. Technol. 2015, 12, 1515–1526. [Google Scholar] [CrossRef] [Green Version]
  5. Al-Ali, Z.M.; Abdullah, M.M.; Asadalla, N.B.; Gholoum, M. A comparative study of remote sensing classification methods for monitoring and assessing desert vegetation using a UAV-based multispectral sensor. Environ. Monit. Assess. 2020, 192, 389. [Google Scholar] [CrossRef] [PubMed]
  6. Lei, T.C.; Wan, S.; Wu, S.-C.; Wang, H.-P. A New Approach of Ensemble Learning Technique to Resolve the Uncertainties of Paddy Area through Image Classification. Remote Sens. 2020, 12, 3666. [Google Scholar] [CrossRef]
  7. Ishihara, M.; Inoue, Y.; Ono, K.; Shimizu, M.; Matsuura, S. The Impact of Sunlight Conditions on the Consistency of Vegetation Indices in Croplands—Effective Usage of Vegetation Indices from Continuous Ground-Based Spectral Measurements. Remote Sens. 2015, 7, 14079–14098. [Google Scholar] [CrossRef] [Green Version]
  8. Dar, I.; Qadir, J.; Shukla, A. Estimation of LST from multi-sensor thermal remote sensing data and evaluating the influence of sensor characteristics. Ann. GIS 2019, 25, 263–281. [Google Scholar] [CrossRef]
  9. Vlassova, L.; Perez-Cabello, F.; Nieto, H.; Martín, P.; Riaño, D.; De la Riva, J. Assessment of Methods for Land Surface Temperature Retrieval from Landsat-5 TM Images Applicable to Multiscale Tree-Grass Ecosystem Modeling. Remote Sens. 2014, 6, 4345–4368. [Google Scholar] [CrossRef] [Green Version]
  10. Weng, Q. Thermal infrared remote sensing for urban climate and environmental studies: Methods, applications, and trends. ISPRS J. Photogramm. Remote Sens. 2009, 64, 335–344. [Google Scholar] [CrossRef]
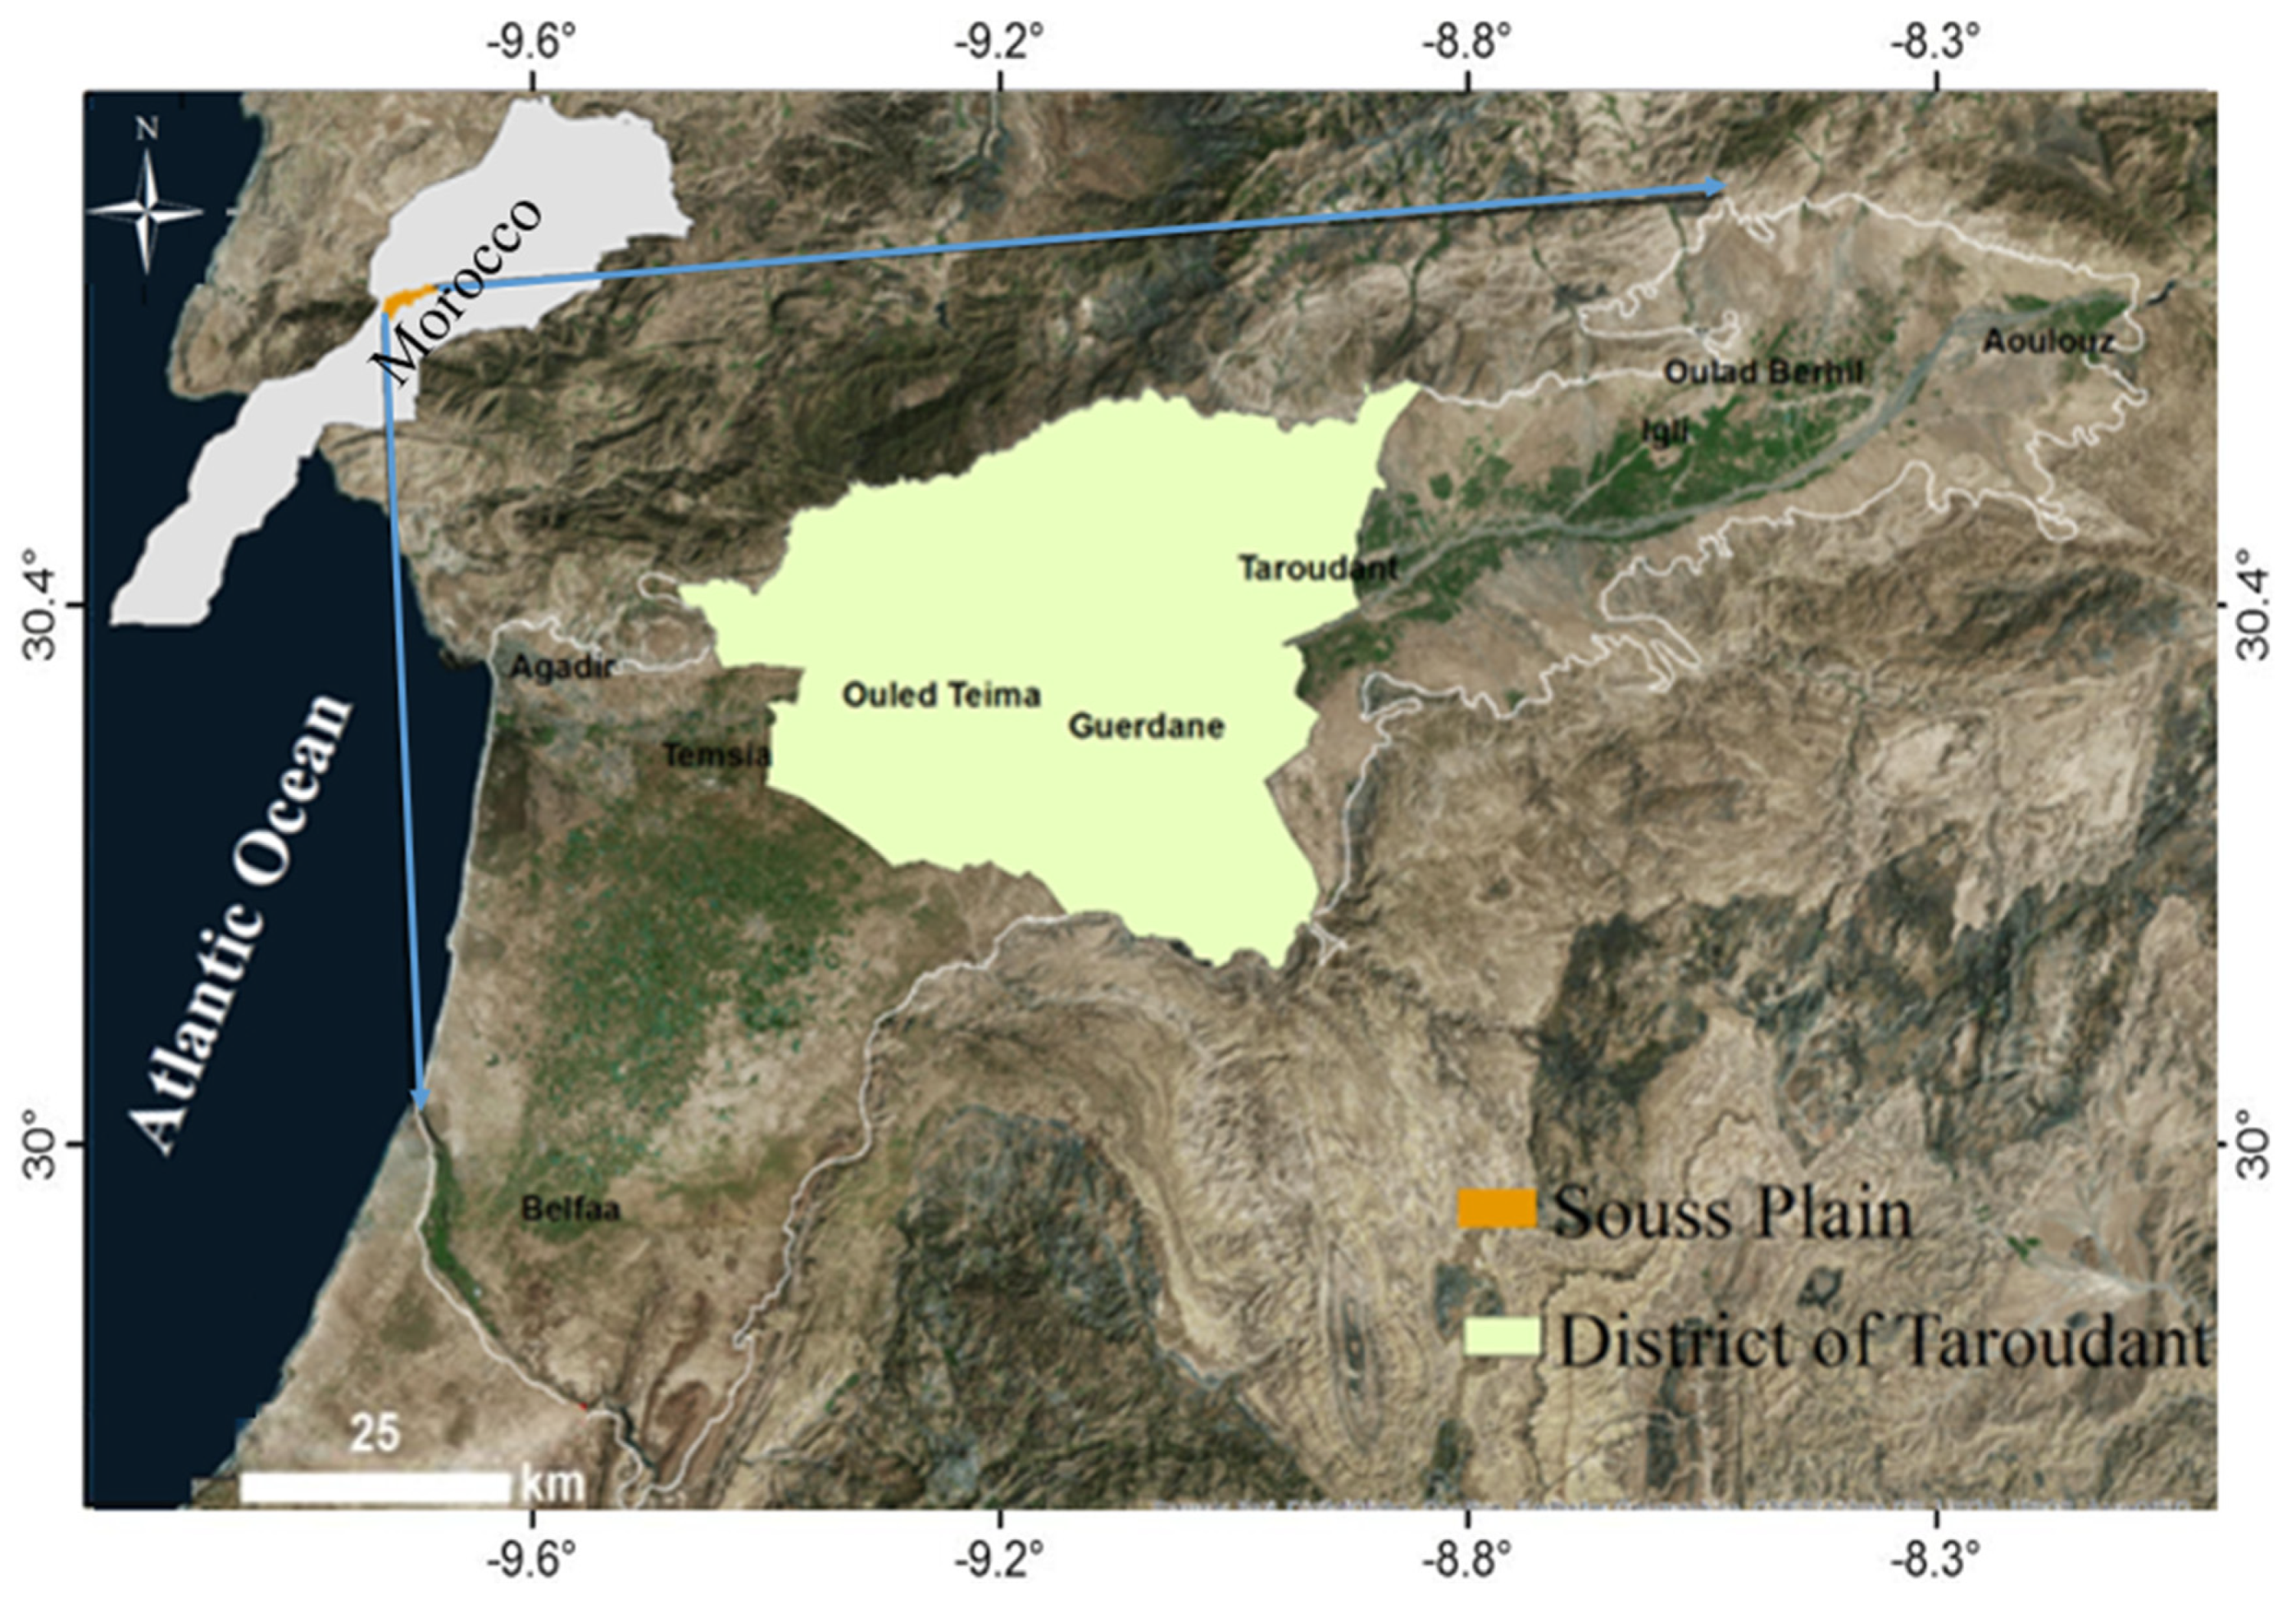
Figure 1. Location of study area.
Blsf 03 00028 g001
Figure 2. Flowchart of the methodological approach.
Blsf 03 00028 g002
Figure 3. Map obtained through overlying land use/land cover maps of 1985, 2001 and 2017.
Blsf 03 00028 g003
Figure 4. Evolution of the main land use classes in the Taroudant region between 1985 and 2017.
Blsf 03 00028 g004
Figure 5. Land surface temperature maps of Taroudant 1985, 2001, 2017.
Blsf 03 00028 g005
Publisher’s Note: MDPI stays neutral with regard to jurisdictional claims in published maps and institutional affiliations.