Abstract
Graptophyllum pictum (L.) Griff is one of the medicinal plants in Indonesia that has been proved to have antioxidant, antidiabetic, and analgesic properties. However, there is no report about the relationship of its genetic diversity with accession and ethnic aspects. Thus, we carried out polymorphism studies and clusterization of 34 samples of G. pictum that were collected from 10 ethnics in Western Indonesia. The research purpose was to determine the polymorphism and kinship relations between ethnic groups and accessions of G. pictum in Western Indonesia. DNA was isolated using the GeneJET Plant Genomic DNA purification mini kit. Sequence Related Amplified Polymorphism (SRAP) was used as a molecular marker in PCR amplification. We analyzed the data using NTSYS and PopGene 1.3 software. We found eight combinations of selected primers with a polymorphic percentage average of 72.23% and 45 loci. The ethnicity that has the highest polymorphic percentage is Kutai (East Kalimantan) with 55.56%. The diversity between population and accession is moderate with a Dissimilarity Index (DI) of not more than 0.69. Ribun ethnic in West Kalimantan is the oldest ancestry ethnic that has a locus marker at the 24th and 41st position. In conclusion, we found that G. pictum in Western Indonesia is divided into four clusters.
1. Introduction
Indonesia has 188 million hectares of land area that are spread over more than 10,000 islands, with more than half covered by primary natural forest [1]. However, many of the species are becoming endangered because of the rapidly decreasing vegetation area in Indonesia. Other factors that threaten biodiversity are anthropogenic and growing mining activities, such as logging and land conversion [2,3]. North Sulawesi Province lost up to 12,668.2 hectares forest from deforestation from 2000 to 2013 [4]. Wibisono and Azham (2017) found that there are several medicinal plants in the conservation plot of the Kutai Kertanegara Regency Forest that can be used as traditional medicine [5].
Graptophyllum pictum (L.) Griff is one of the medicinal plants that has not been optimally utilized in Indonesia [6]. This plant has varieties with local names in Indonesia, such as daun wungu, handeuleum, and tulak. It has several properties according to the local ethnic. Most of the people in West Java use G. pictum to prevent postpartum infections, restore stamina, normalize the size of the uterus, stimulate breast milk production, and reduce body weight [6]. G. pictum has antidiabetic activity by inhibiting the -glucosidase enzyme in vitro [7]. The extract of G. pictum in 70% ethanol can treat diabetes with a dose of 50 mg/kg/bodyweight based on the Intraperitoneal Glucose Tolerance Test (IPGTT) [8]. Andrianto et al. (2015) also found that 70% of G. pictum leaves’ ethanolic extract was able to protect pancreatic β-cell function in oxidative stress by alloxan injection in rats [9].
There are several reports on the bioactivity of G. pictum [7,8,9], but the relationship of its genetic diversity with accession and ethnic aspects is currently unconfirmed. Thus, polymorphism studies and clusterization of G. pictum from 34 samples of 10 ethnics in Western Indonesia is important. We chose Sequence Related Amplified Polymorphism (SRAP) for the molecular markers, because it provides a good level of polymorphism in plant species. This study aimed to determine the polymorphism and kinship relations between ethnic groups and accessions of 34 samples of G. pictum from 10 ethnics in Western Indonesia. This research will provide a better understanding of conservation support, breeding strategies, and the basis for developing G. pictum as an ethnopharmacological product in Indonesia.
2. Experiments
2.1. Study Area
The samples of this research were taken from South Sumatera, West Java, Central Java, East Java, West Kalimantan, North Kalimantan, South Kalimantan, and East Kalimantan Provinces in the Western part of Indonesia (GMT+7) (Table 1). South Sumatera samples consisted of four accessions that were taken from the Pegagan Ethnic, in Ogan Ilir Regency, which is located about 35 km west of Palembang City. West Java samples were taken from the Cirebon and Tasik Ethnics. Four accessions were taken from the Cirebon Ethnic in Cirebon City, which is located 130 km northwest of Bandung City. Three accessions were taken from the Tasik Ethnic in Tasikmalaya Regency, which is located 100 km southwest of Bandung City.

Table 1.
Graptophyllum pictum (L.) Griff leaves from 10 ethnics in Western Indonesia. Location based on WGS84 geographic coordinate system.
Central Java samples were taken from the Java Ethnic that consisted of one accession located in Surakarta Regency, 65 km northeast of Yogyakarta City. East Java samples consisted of three accessions that were taken from the Majapahit Ethnic, located in Kediri Regency, 129 km west of Surabaya City. Samples of West Kalimantan were obtained from the Ribun and Sambas Ethnics. The Ribun Ethnic consisted of three accessions taken from Sanggau Regency, 186 km north of Pontianak City. The Sambas Ethnic was located in Bengkayang Regency, 227 km south of Pontianak City. We collected four accessions from the Sambas Ethnic. The North Kalimantan samples were taken from the Putak Ethnic that consisted of three accessions, located in Malinau Regency, in the west part of North Kalimantan Province. The South Kalimantan samples consisted of three accessions that were taken from the Pagatan Ethnic, located in Tanah Bumbu Regency, 183 km north of Banjarmasin City. Samples of East Kalimantan were taken from the Kutai Ethnic that consisted of seven accessions. This ethnic was located in Kutai Kertanegara Regency.
2.2. Materials
The equipment used in this research included water baths (Memmert, Schwabach, Germany), electrophoretic device sets (Biorad, CA, USA), a Nano Pro spectrophotometer (Maestrogen, Hsinchu, Taiwan), a Gel Documentation System (Maestrogen, Hsinchu, Taiwan), a PCR (Biorad, Hercules, CA, USA), and a refrigerated centrifuge (Tomy, Tokyo, Japan). The material used included 34 samples of Graptophyllum pictum (L) leaves from 10 ethnic groups in western Indonesia, liquid nitrogen, a GeneJET Plant Genomic DNA Purification Mini Kit (Thermo Fischer Scientific, Waltham, MA, USA), Invitrogen proteinase-K (Thermo Fischer Scientific, Waltham, MA, USA), water, agarose (Thermo Fischer Scientific, Waltham, MA, USA), Safe DNA dye (Peqlab, Radnor, PA, USA), Tris Boric-acid EDTA (TBE) (Sigma, Darmstadt, Germany), DreamTaq Green PCR Master Mix (2X) (Thermo Scientific, Waltham, MA, USA), Invitrogen SRAP primer (Thermo Fischer, Waltham, MA, USA), Free Nuclease Water (Thermo Fischer, USA), and a Generuler ladder 100 and 1000 base pair (Thermo Fischer Scientific, Waltham, MA, USA). This study also used NTSYSpc (Numerical Taxonomy and Multivariate Analysis System) 2.1 and Pop Gene (Population Genetic Analysis) 1.3 software.
2.3. Primary Selection and Annealing Temperature Optimization
The research began with the isolation of genomic DNA, including sample preparation, DNA extraction, electrophoresis, and quantification of the isolate. Then the SRAP primer selection that matched the printed DNA and its temperature was optimized. There were 16 SRAP primer combinations tested (forward Me 1–4 and reverse Em 1–4 combination) as well as 8 annealing temperature combinations (between 33.0 and 58.0 °C). Subsequently, amplification of 34 DNA isolates using the 8 selected primers through PCR was conducted; then, the amplicon was visualized via electrophoresis (data not shown).
2.4. Amplification of Genomic DNA Using SRAP Markers
DNA amplification was carried out twice during primary selection (16 primary combinations of 1 sample) and the polymorphism test (8 primary combinations of 34 samples) [10]. Both used the PCR cocktail formula and the PCR cycle. The PCR reaction started with a 1 initial denaturation cycle for 5 min at 94 °C. Then denaturation and annealing were 5 cycles, with 1 min for each cycle. This denaturation used a temperature of 94 °C. The first annealing used different temperatures according to the optimum temperature of the primer used. Next, there were 35 denaturation cycles (94 °C), second annealing (temperature was according to the primer), and elongation (72 °C), each for 1 min. Furthermore, the final extension was finished once at 72 °C for 8 min. The reaction was complete when the sample was allowed to stand for approximately 10 min in PCR at 4 °C as holding temperature before visualization. The sample was visualized using the Gel Documentation System.
2.5. Data Analysis
2.5.1. Allele Scoring
The base DNA fragments’ length from each accession from each primer was calculated. The presence of DNA fragments in each accession was given a different score; the score was 1 if it showed there was a fragment, and a score of 0 meant there was no DNA fragment. Furthermore, monomorphic, polymorphic, and total alleles of each primer were calculated to show that the primer met the requirements to test the polymorphism of a species.
2.5.2. Analysis of Diversity through Software NTSYS 2.1 and Pop Gene 1.3
The Similarity Index was calculated using the DICE similarity index formula. We also obtained the polymorphic percent for each population of G. pictum. The dendrogram construction was carried out using the Unweighted Pair Group Method Using Arithmetic Method (UPGMA). Then, Principal Component Analysis was performed to obtain the eigenvalues and cumulative variations of the main alleles in diversity. Subsequently, the ethnics were clustered based on the results of the NTSYS phylogenetic dendrograms. Data were interpreted and supported by gene migration data and allele frequencies. Furthermore, the data were visualized as a map of the distribution and classification of G. pictum from western Indonesia.
3. Results
3.1. Polymorphic-Monomorphic Determination
The eight selected primer combinations were applied to 34 isolated DNA genomes of G. pictum. Electrophoresis result of 34 PCR samples at 2.5% agarose showed the presence of polymorphism and monomorphism bands. The monomorphism in this research was demonstrated by the presence of identical or similar allele patterns in 28 samples. This meant that the appearance of the ribbon in 28 samples was categorized as monomorphic. The polymorphic was shown by the variety of the patterns of band appearance with the same size in the sample being tested. The results were scanned into binary data and processed using NTSYS software (data not shown). Subsequently, there were 45 selected fragments (alleles) as variables and 34 individuals representing 10 different ethnicities (Table 2).
Table 2.
Total of DNA fragments from amplification of each locus in eight primer combinations.
In addition to the diversity shown by the allele frequencies, PopGene can also indicate the value of gene flow or migration. Two loci specifically gave rise to a migration value of 0 and Genetic diversity (Gst) of 1, namely the alleles 24 and 41. So, these two alleles have the potential to become specific marker alleles for G. pictum from the Ribun ethnic origin.
3.2. Diversity of Intra-Population Based on Ethnicity
We can see the genetic diversity in a population according to ethnicity (Table 3). The Shannon Index (I) in each ethnic corresponded to a low level of diversity due to I1. The populations of G. pictum with high percent polymorphic loci were Kutai (55.56%), Pegagan (48.89%), and Sambas (48.89%). The ethnicities with the lowest polymorphism were Pagatan (8.89%), Tasik (15.56%), and Putak (15.56%). The number of observed alleles (Na) was relatively low due to the limited sample size of each ethnic group. The value of effective allele (Ne) was proportional to the number of heterozygous individuals in the population.
Table 3.
Genetic variety of each population based on ethnic.
3.3. Diversity and Phylogenetics between Accessions
Phylogenetic trees were obtained from 28 G. pictum accessions of 10 ethnics in Western Indonesian through the Numerical Taxonomy System (NTSYS) software (Figure 1). The Dissimilarity Index (DI) between 34 accessions reached a maximum value of 0.6444 obtained from accessions 6 and 30 (Ribun and Pagatan). The second highest DI value was 0.6222 representing the genetic distance between accession 6 and 31 (Ribun and Pagatan). The maximum DI value in this research was classified as moderate but higher than the DI between ethnicity with a maximum DI value of 0.4359 (Figure 1). Individual diversity ranged from 5 to 80% based on the dendrogram.
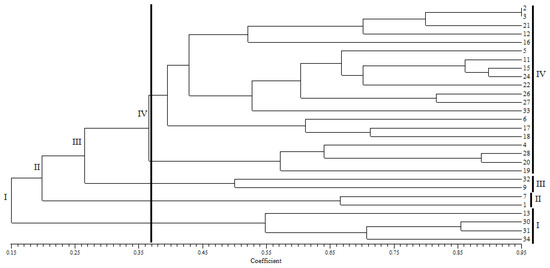
Figure 1.
Phylogenetic tree of 34 accessions of G. pictum from 10 ethnics in Western Indonesia using the UPGMA method. Clusterization coefficient = 0.37 (Dissimilarity Index 0.63).
4. Discussion
The numbers at the end of the phylogenetic tree showed the accession clusterization of G. pictum in Western Indonesia (Figure 1). We obtained four clusters based on the coefficient value of 0.37 or a diversity index of 0.63. The accessions that had the closest diversity based on DI were the accessions of 28 and 20 (Jawa–Putak) and 30 and 31 (Pagatan–Pagatan) with a DI of 0.02222. After that, the closest diversity were the accessions of 2 and 3 (Pegagan–Pegagan) and 15 and 24 (Kutai–Sambas) with a DI of 0.04444. Clusterization was expected to be able to inform genetic similarity patterns, making it easy to make cross maps for the development of superior varieties of G. pictum.
Figure 2 shows the clusterization of G. pictum in Western Indonesia was random, it did not follow the pattern of geographical proximity. Cluster I consisted of all accessions from the Pagatan Ethnic and several accessions from the Tasik and Kutai Ethnics. Cluster II consisted of several accessions from the Tasik and Pegagan Ethnics. Cluster III consisted of several accessions from the Cirebon Ethnic. Cluster IV consisted of all accessions from all ethnics, except the Pagatan and Tasik Ethnics. The pattern of the genetic closeness of G. pictum populations is thought to be the role of humans in mixing genes between populations such as the Anthocephalus cadamba tree in Indonesia [11]. Many studies report that humans play a large role in shaping the genetic structure of a population, through domestication and mixing origins [12]. Thus, ethnic migration is one of the important factors that determined the kinship of G. pictum.
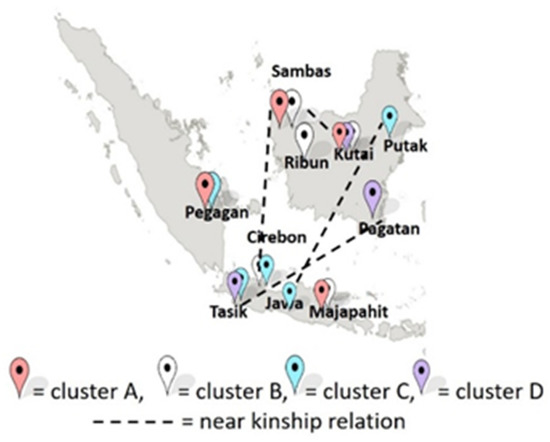
Figure 2.
Clusterization map of Graptophyllum pictum in Western Indonesia.
5. Conclusions
The mean polymorphic percent of 16 primary SRAP combinations was 72.23%. G. pictum with the closest genetic distance came from the ethnics Tasik (West Java) and Pagatan (South Kalimantan) (ID = 0.0094). The accessions with the furthest genetic distance were the accessions 6 and 30 (ID = 0.6444) of the Ribun (West Kalimantan) and Pagatan ethnic groups. G. pictum of Ribun ethnic origin was the oldest ancestry. The high polymorphism G. pictum population came from Kutai (East Kalimantan) (polymorphic percent = 55.56%). In general, G. pictum polymorphisms in Western Indonesia were classified as moderate (ID < 0.69). G. pictum clusterization from Western Indonesia did not show a pattern that matched its ethnicity or geography.
Author Contributions
D.A. and P.J.P. were the recipients of the research grant and designed the experiments; U.M.S.P. and D.O.P. performed the experiments; S.H. analyzed the data; D.S. and A.M. contributed samples; D.A. wrote the paper. All authors have read and agreed to the published version of the manuscript.
Funding
This research received no external funding.
Institutional Review Board Statement
Not applicable.
Informed Consent Statement
Not applicable.
Data Availability Statement
The data presented in this study are available on request from the corresponding author. The data are not publicly available due to the use of Indonesian biodiversity.
Acknowledgments
The authors would like to acknowledge the Medicinal Plant and Traditional Medicine Research and Development Centre, National Institute of Health and Research Development, Ministry of Health that funded this research through the RISTOJA 2018 program.
Conflicts of Interest
The authors declare no conflict of interest.
References
- Margono, B.; Potapov, P.; Turubanova, S.; Stolle, F.; Hansen, M.C. Primary forest cover loss in Indonesia over 2000–2012. Nat. Clim. Chang. 2014, 4, 730–735. [Google Scholar] [CrossRef]
- Naidu, M.T.; Kumar, O.A. Tree diversity, stand structure and community composition of tropical forests in Eastern Ghats of Andhra Pradesh, India. J. Asia Pasific Divers. 2016, 9, 328–334. [Google Scholar] [CrossRef] [Green Version]
- Lillo, E.P.; Fernando, E.S.; Lillo, M.J.R. Plant diversity and structure of forest habitat types on Dinagat Island, Philippines. J. Asia Pasific Divers. 2018, 12, 83–105. [Google Scholar] [CrossRef]
- Ahmad, A.; Saleh, M.B.; Rusolono, T. Spatial model of deforestation in FMU of Poigar, North Sulawesi. J. Penelit. Kehutan. Wallacea 2016, 5, 159–169. [Google Scholar] [CrossRef] [Green Version]
- Wibisono, Y.; Azham, Z. Inventory of medicinal potentially plant on medicinal plants conservation plot in KHDTK Samboja, Samboja sub district of Kutai Kartanegara Regency. Indones. J. Agric. For. 2017, 16, 125–140. [Google Scholar]
- Rosmala, A.; Khumaida, N.; Sukma, D. Morphological changes and growth of handeuleum (Graptophyllum pictum L. Griff) due to gamma ray irradiation. J. Agron. Indones. 2015, 43, 235–241. [Google Scholar] [CrossRef]
- Nurcholis, W.; Andrianto, D.; Falah, S.; Katayama, T. α-Glucosidase Inhibitor and Cytotoxic Activities and Phytochemical Screening of Graptophyllum pictum (L.) Griff. In Proceedings of the 3rd International Symposium of Indonesian Wood Research Society (IWoRS), Yogyakarta, Indonesia, 3–4 November 2011; pp. 87–93. [Google Scholar]
- Andrianto, D.; Nurcholis, W.; Katayama, T.; Suzuki, T. Antidiabetic and antioxidant anctivity of 70% ethanolic extract of Graptophyllum pictum improves glucose resistance in rats. J. For. Biomass Util. Soc. 2014, 9, 31–36. [Google Scholar]
- Andrianto, D.; Nurcholis, W.; Katayama, T.; Suzuki, T. 70% ethanolic extract of Graptophyllum pictum leaves protects pancreas β-cell in rats by antioxidant mechanism. J. For. Biomass Util. Soc. 2015, 10, 49–54. [Google Scholar]
- Li, G.; Quiros, C.F. Sequence-Related Amplified Polymorphism (SRAP), a new marker system based on a simple PCR reaction: Lts application to mapping and gene tagging in Bressica. Theor. Appl. Genelics 2001, 103, 455–461. [Google Scholar] [CrossRef]
- Nurtjahjaningsih, I.L.G.; Qiptiyah, M.; Pamungkas, T.; Widyamoko, A.Y.P.B.C.; Rimbawanto, A. Genetic diversity characterization of Anthocepalus cadamba population revealed by Random Amplified Polymorphism DNA. J. Pemuliaan Tanam. Hutan 2014, 8, 81–92. [Google Scholar] [CrossRef] [Green Version]
- Mccusker, M.R.; Mandrak, N.; Egeh, B.; Lovejoy, N.R. Population Structure and Conservation Genetic Assessment of the Endangered Pugnose Shiner, Notropis Anogenus. Conserv. Genet. 2014, 15, 343–353. [Google Scholar] [CrossRef]
Publisher’s Note: MDPI stays neutral with regard to jurisdictional claims in published maps and institutional affiliations. |
© 2021 by the authors. Licensee MDPI, Basel, Switzerland. This article is an open access article distributed under the terms and conditions of the Creative Commons Attribution (CC BY) license (https://creativecommons.org/licenses/by/4.0/).