Proceeding Paper

Image-Based Phenotyping of Shell Thickness Revealed Strong Association with Kernel Recovery in Macadamia †

1
School of Agriculture and Food Sciences, The University of Queensland, Brisbane, QLD 4072, Australia
2
Queensland Alliance for Agriculture and Food Innovation, The University of Queensland, 47 Mayers Road, Sunshine Coast, QLD 4560, Australia
*
Author to whom correspondence should be addressed.
Presented at the 2nd International Electronic Conference on Plant Sciences—10th Anniversary of Journal Plants, 1–15 December 2021; Available online: https://iecps2021.sciforum.net/.
Biol. Life Sci. Forum 2022, 11(1), 95; https://doi.org/10.3390/IECPS2021-12037
Published: 2 December 2021

Abstract

:
Phenotyping in macadamia breeding programs is laborious, time-consuming and costly. Developing rapid and cost-effective phenotyping technologies can reduce costs and increase breeding efficiency. The aim of this project is to develop an image-based phenotyping tool for rapid, cost-effective and accurate assessment of kernel recovery (KR) in macadamia. Nut samples were collected from second-generation macadamia breeding progenies grown in Bundaberg research station, Queensland, Australia, and were measured for nut traits. Nuts were cracked at the suture line to measure nutshell thickness. A digital slide caliper was used for manual phenotyping, and a digital camera was used for image-based phenotyping of shell thickness. Pictures of the cracked nut samples were processed with Image J to extract phenotypic information. Correlations between shell thickness and kernel recovery were negative in both manual and image-based approaches. Correlations were low in manual measurements (−0.54 to −0.59) but very high with image-based measurements (−0.87). The outcomes indicate that shell thicknesses can be used as a predictor for KR in macadamia breeding programs, and more importantly, image-based measurements offer higher prediction accuracy of KR than manual measurements.

1. Introduction

Four species of the genus Macadamia belonging to the Proteaceae family are found on the east coast of Australia. The species are Macadamia integrifolia, M. tetraphylla, M. ternifolia and M. jansenii [1]. The only two macadamia species that produce edible kernels are M. integrifolia and M. tetraphylla. These two species and their hybrids are cultivated around the world, with almost half of production located in Australia and South Africa [2]. Kernels can be used as snack food or in bakery goods, and their oil has high commercial values for various purposes, such as cooking oil and cosmetics [3]. Significant efforts and investments are being made in breeding programs of macadamia to improve profitability. However, phenotyping activities of macadamia remain costly and laborious due to limitations of conventional phenotyping technology. Recently, rapid phenotyping technologies have emerged as an effective approach to reduce the cost of breeding and improve breeding efficiency. In particular, image-based rapid phenotyping techniques have been developed in other plants, such as soybean [4], wheat [5], pine and cypress trees [6], to characterise growth traits and seed traits. In this report, we will explore the possibility of applying image-based rapid phenotyping techniques on nut traits of macadamia.
Macadamia nuts comprise a protective hard nutshell surrounding a kernel. The thickness of the shell wall ranges from 1mm to 4mm, depending on the location of measurements [7]. Kernel performance is commonly measured by the amount of total kernel in a nut in shell (NIS), also called kernel recovery (KR). Kernel recovery is one of the key indicators of farm profitability. It was evidenced that the thickness of macadamia shell is moderately negatively correlated (−0.57) with kernel recovery [8,9]. However, the shell thickness was based on manual measurements at the equatorial region, which may not accurately reflect the thickness of the shell. An accurate measurement of shell thickness can be useful to identify the association between shell thickness and kernel recovery. The cost of accurate measurement of KR across a large number of nuts is costly. Therefore, another focus of this study is to assess kernel recovery using a rapid and cost-effective method.
Various rapid phenotyping techniques have been developed to characterise plant traits. Two-dimensional image-based methodologies have been applied to soybean and cereal seeds [4,5,10]. Image J software was employed to extract morphological information from pictures of soybean seeds taken by a digital camera, achieving a high correlation coefficient (R = 0.94) between image-based measurements and manual measurements [4]. A software called Grain Scan was utilised to analyse pictures of wheat seed scanned by a desktop scanner and recorded a high Pearson correlation between image-based measurements and actual measurements (p = 0.981–0.996) [5]. Additionally, phenotyping methods of plant traits have been developed in mobile devices due to their increasingly strong computational capacity and the need for a low-cost, high-throughput method in field conditions. For instance, SeedCounter was developed as an application for mobile devices that run Android OS [11]. These methods offer high accuracy of estimation of morphological parameters and a high level of mobility to assist in rapid phenotyping activities.
Three-dimensional (3D) image processing techniques have also been developed. Numerous 3D point clouds have been constructed from Structure from Motion algorithms and applied to extract growth traits, such as tree stem circumference and bole volume [12], number of plant leaves [13], root volume [14] and stem diameter at breast height [6]. However, due to the low resolution of 3D point clouds, methods to extract microdissections in nuts have not been established [15]. Several 3D imaging techniques using a computed tomography scanner were developed for nut phenotyping due to their high resolution [15], although the costs of purchase and maintenance are extremely high. For these reasons, 2-D image processing techniques are still commonly applied due to their low cost and high level of accuracy.
The aims of this study are to (i) develop a 2D image-based rapid phenotyping technique to characterise macadamia nut traits and (ii) explore the efficiency of image-based phenotyping of nutshells as a predictor of kernel recovery.

2. Materials and Methods

2.1. Plant Materials

Nut samples were collected in 2019 from 51 macadamia breeding progeny trees grown at the Bundaberg Research Station of the Department of Agriculture and Fisheries. These progeny trees were planted from 2012 to 2014 and consist of 23 families from 27 parents, including Hawaiian (HAES series), Hidden Valley Plantation (A-series), old Australian selections (i.e., Renown and Daddow) and Elites from the Australian National Macadamia Breeding Program.

2.2. Sample Preparation for Nut Characterisation

Twenty nuts from each tree were collected, dehusked and dried for measurements. The drying task took six days, including two days at 35 °C, two days at 45 °C and two days at 55 °C, in order to achieve 1.5% moisture content. Each nut was cracked into two halves by nut crackers in order to measure nut and kernel characteristics.

2.3. Manual Measurements

A ToolPRO digital slide calliper was used to measure nut length (hilum to micropyle); nut width (equator); and nutshell thickness of each half of an individual nut at three positions, including hilum, micropyle and equatorial regions (Figure 1). A scale was used to measure the weight of whole nut, nutshell and kernel. Measurement data were recorded in an Excel spreadsheet. The data analysis function was applied to data for each trait to generate descriptive statistical information, including minimum, maximum, mean and standard deviation.

2.4. Image-Based Measurements

For image-based analysis, ten nuts from each progeny were measured. Samples were categorised into groups based on the measurements of shell thickness at the equator: less than 2 mm, 2–3 mm, 3–4 mm and more than 4 mm. At least two progenies were selected from each group. Pictures of nut samples from each tree were captured with a digital camera (Canon 7D mark II, lens 18−135mm f/3.5–5.6 IS) held by a tripod and processed with ImageJ. A ruler was positioned in the pictures as a reference to set scales for measurement. The polygon selections function in ImageJ was applied to create a polygon around the outer bound and inner bound of nutshells (Figure 2). The software extracted several pieces of information from the polygons, including the outer-shell area (OA), perimeter (OP), length (OL), width (OW), circularity (OC) and roundness (OR), as well as the inner-shell area (IA), perimeter (IP), length (IL), width (IW), circularity (IC) and roundness (IR). Nut section area (NSA) is calculated from the difference between the outer-shell area and the inner-shell area. Average shell thickness (AST) is calculated in accordance with the following formula:
AST = NSA 0.5 × ( Outershell   perimeter + Innershell   perimeter )  

2.5. Trait Correlations

Histograms of all trait measurements were generated by RStudio software, and the results suggested all trait measurements were relatively normally distributed. The relationships among nut traits were examined with Pearson’s correlation efficient and significance testing in with the data analysis tool in Excel. When the coefficient approached 1 or −1, this indicated a strong positive or negative correlation, respectively, between two variables. Correlations of manual and image-based measurements of shell thickness were measured against whole-nut weight, shell weight, kernel weight and kernel recovery.

3. Results and Discussion

3.1. Extent of Variation across Genotypes

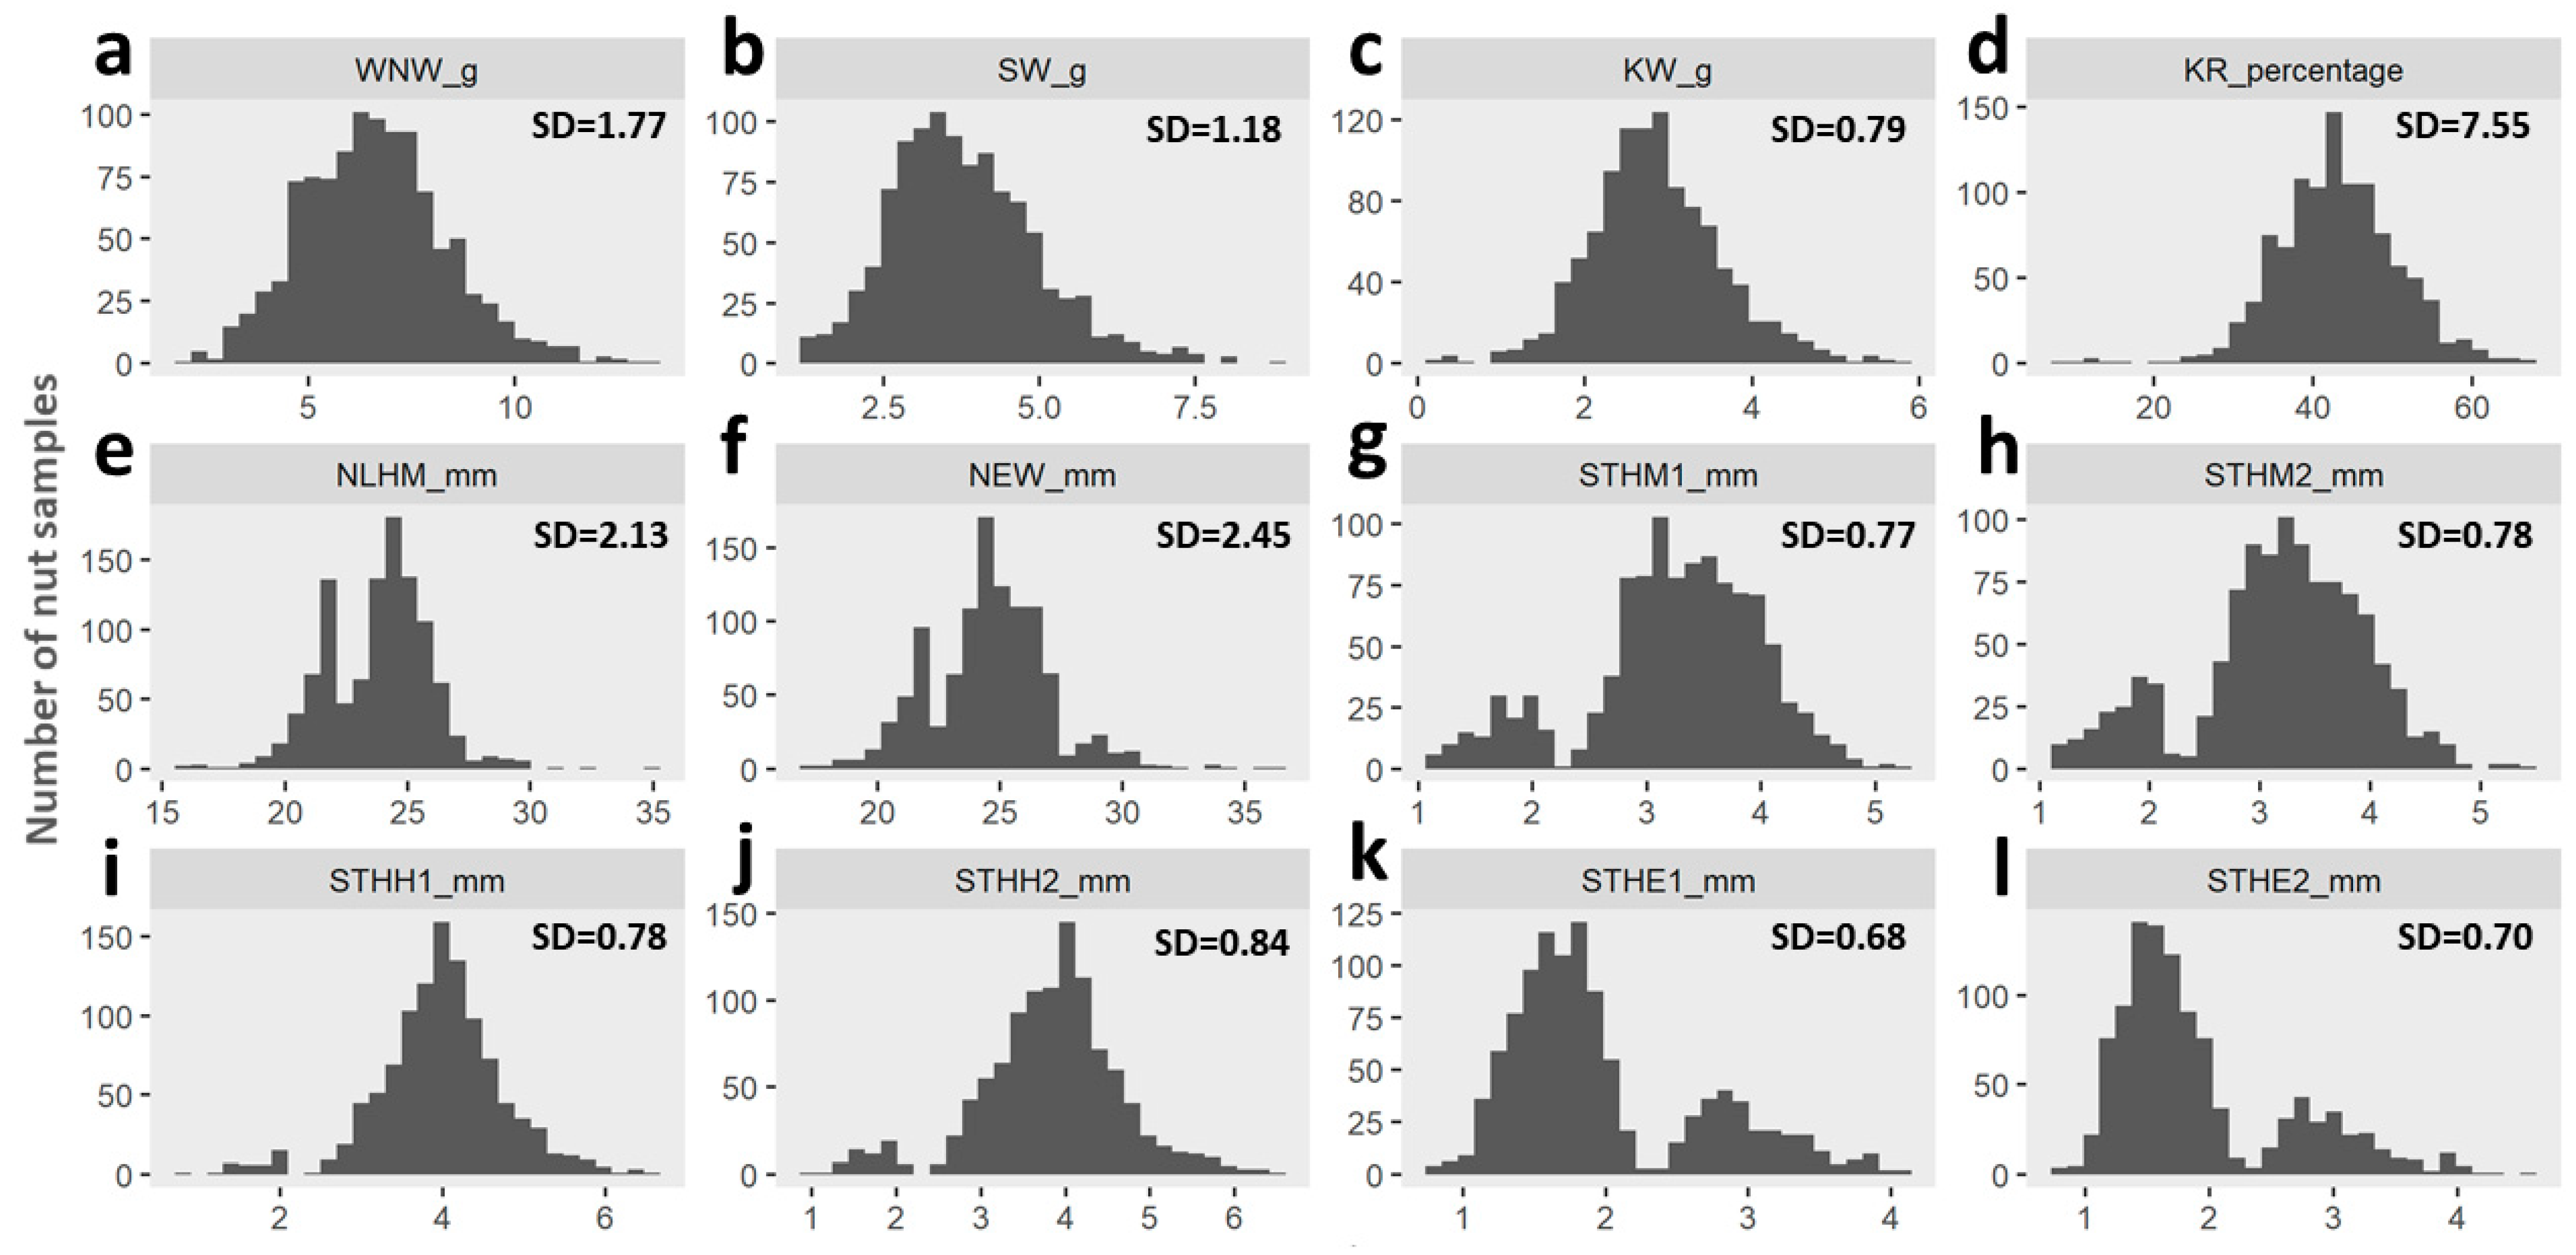
All traits presented in Figure 3 and Table 1 were measured manually on nut samples. Histograms and standard deviations of trait measurements indicated their normal distribution across genotypes. Weight of whole nut (WNW), shell weight (SW) and kernel weight (KW) had average values of 6.63 g, 3.80 g and 2.85 g and standard deviations (SDs) of 1.77, 1.18 and 0.79, respectively (Table S1). Nut sampling achieved a mean of kernel recovery (KR) of 43.06%, with standard deviation of 7.55%. Nut length from hilum to micropyle (NLHM) had a slightly smaller mean and standard deviation compared to nut width at equator (NEW). Shell thickness at hilum and micropyle had considerably higher means than shell thickness at equator. Shell thickness on hilum side 1 (STHH1) had the highest mean, at 3.97 mm, whereas shell thickness at equatorial region side 2 (STHE2) had the lowest mean, at 1.92 mm. Standard deviations of all shell thickness measurements ranged from 0.68 to 0.84. Means of shell thickness at different positions recorded in samples were consistent with the range of shell thickness of 1mm−4mm presented in the literature [3].

3.2. Extent of Variation within Genotypes

SD of WNW in most of genotypes was lower than SD of WNW across genotypes, except for genotypes TDN-2013-14 and TDN-2014-7. Genotype TDN-2013-5 had a slightly higher SD of SW than that of all other genotypes. A higher SD of KW in comparison with SD of KW across genotypes was observed in nine genotypes, including TDN-2013-8, TDN-2013-10, TDN-2013-15, TDN-2013-25, TDN-2014-7, TDN-2014-8, TDN-2014-11, TDN-2014-12 and TDN-2015-6. Among these nine genotypes, five had a higher SD of KR compared to SD of KR, namely TDN-2013-10, TDN-2013-25, TDN-2014-7, TDN-2014-8 and TDN-2014-12. Only two genotypes had a higher SD of NLHM than that of all other genotypes, whereas eight genotypes had a higher SD of NEW compared with that of all other genotypes. The majority of genotypes presented with a lower SD of shell thickness in comparison to the range of SD of shell thickness across genotypes, except for four genotypes, including TDN-2013-2, TDN-2013-8, TDN-2013-14 and TDN-2015-2.

3.3. Trait Corellations Based on Manual Measurements of Shell Thickness

Strong positive correlations were observed between NLHM and NEW with SW, KR and WNW, ranging from 0.67 to 0.82, although an insignificant correlation was recorded between these traits with KR (Table 2). The highest correlation coefficient in these two variables was with WNM, recorded at 0.82 and 0.80, respectively. Shell thickness measurements across different positions had relatively positive correlations with SW, ranging from 0.63 to 0.71. These traits had inconsiderably positive correlations with KW, with the highest and lowest coefficient recorded as 0.24 and 0.05, respectively. Relatively positive correlations were observed in shell thickness variables and WNW, ranging from 0.45 to 0.58. In contrast, negative correlations were recorded between shell thickness and KR. STHE1 had the highest correlation coefficient against KR, namely −0.59.

3.4. Correlations Based on Image-Based Measurements of Shell Thickness

The histograms of image-measured traits shown in Figure 4 indicated normal distribution of these trait measurements. Table 3 shows Pearson’s correlation coefficients between measurements extracted from ImageJ software and previously measured manually yield indicators. Image-based measurements of area, perimeter, width and length in both the outer shell and inner shell had strongly positive correlations with WNW, SW and KW. Among outer-shell parameters, the highest range of correlation coefficient was recorded for WNW, namely 0.94–0.95, followed by SW and KW, at 0.90–0.93 and 0.76–0.80, respectively. The highest range of correlation coefficients among inner-shell parameters was recorded for KW, namely 0.80–0.88, followed by WNW and SW, at 0.70–0.76 and 0.56–0.61, respectively. Outer-shell parameters had negative correlations with KR, ranging from −0.54 to −0.56, whereas there was an insignificant correlation recorded between inner-shell parameters and KR. Neither circularity nor roundness measurements of the outer shell and inner shell showed correlations with manual measurements.
Nut section area (NSA) had strong, positive correlations with WNW and SW, at 0.88 and 0.96, respectively. Similarly, ANT had positive correlations with both WNW and SW, at 0.77 and 0.89, respectively. Both parameters had a considerably negative correlation with KR, recorded as −0.82 for NSA and −0.87 for ANT. Insignificant correlations with KW were recorded for both NSA and ANT.

4. Discussion

In this study, we investigated the variability and relationships in nut traits in macadamia breeding progeny. Both manual and image-based measurements were conducted to explore the opportunities to increase efficiency of phenotyping for kernel recovery in breeding programs.
Our study identified significant variations in nut traits within and across genotypes. Variation within genotype could be due to the effect of pollen source (also known as xenia effects). Pollen parents can affect not only the embryo (kernel) but also tissues of or maternal origins, such as the husk and shell [16]. Variability in nutritional partitioning due to the variation in flowering and nut development period is another possible reason for this variation, even within the same genotype. It was reported that the nitrogen level in M. integrifolia was traced after injection into branches and soil application, revealing that the xylem sap N concentration changed depending on the season [17], which affected the physiology and fruit setting capacity of macadamia trees.
The relationship between shell thicknesses and kernel recovery has been well studied in other nut trees, such as walnut [18,19,20] and hazelnut [21]. However, only a few investigations have been undertaken in macadamia [8,9]. Phenotypic nut trait characterisations of different Persian walnut genotypes was studied in Srinagar, India, and the result recorded a significantly negative correlation between shell thickness and kernel recovery (R = −0.6186) [19]. This finding is aligned with results from a previous study on the morphology of Persian walnut accessions in Iran [18]. All these works in other nuts were undertaken in order to enhance the understanding of nut morphology and assist in breeding programs. The finding of negative correlations between shell thicknesses and kernel recovery of macadamia in this study provide important information for researchers and breeders with respect to their breeding programs. The correlation also indicates the possibility of using shell thicknesses as a predictor of KR.
A higher correlation coefficient with KR was shown in average nutshell thickness extracted from the image-based approach (R = −0.87) in comparison with shell thicknesses at particular positions (R = [−0.54; −0.58]). This indicates that the image-based approach offered higher accuracy than manual measurements. The difficulties associated with the manual approach can be explained by the non-uniform curve and shape of nuts, difficulty in recognizing the equatorial regions and degrading quality of calipers over time. Nevertheless, the amount of time taken for manual measurements was less than that for image-based measurements. It took approximately 80 s per nut to manually measure nutshell length, width and thickness at hilum, micropyle and equatorial regions. For the image-based approach, the amount of time used to take and process images was about 150–180 s for each nut. Introducing automation in image processing could speed up phenotyping [22]. Recent advancements in artificial intelligence and machine learning have provided new opportunities for automation in plant phenotyping [23].
The new method of phenotyping of nutshell thickness can be used as a predictor of kernel recovery, providing a foundation to advance phenotyping activities in macadamia genetic improvement programs. One potential pathway to improve the efficiency is to develop an automatic segmentation process for nutshells and kernels. This approach was developed for phenotyping of blueberry fruit [24] and leaf stomata [25,26]. Detection and segmentation of blueberries from 2D images was performed on a deep learning model built on a Mask R-Convolutional Neural Network (R-CNN) [24]. Information about berry count, maturity and compactness was extracted from the model and had a high correlation with manually measured values (R2 = 0.89). An automatic stomata detection algorithm based on Mask-CNN was developed to identify and count individual stomata [26]. High-precision percentage and F-score were recorded with this method. Additionally, a high-throughput software was developed to detect stomata cells from microscopic images of plant leaf surface based on template matching approach and measured morphological traits of stomata including stomatal opening length and width, as well as guard cell sizes. A similar approach can be developed to segment nutshells and kernels from images and measure nut traits, particularly nutshell thickness.
This phenotyping approach can be further developed as an application in mobile devices, as their computational capability has been improved significantly in recent years. A good example is SeedCounter, a mobile application that automatically measures morphological parameters of wheat grains under field conditions [11]. High correlation values between estimated values by SeedCounter and actual values were recorded (R = 0.93 in length and R = 0.77 in width), indicating a high level of accuracy of this application.

5. Conclusions

This is the first scientific report on image-based phenotyping in macadamia. Through this study, we developed a novel and accurate method of measuring shell thickness and kernel recovery. This method enhanced the understanding of macadamia nut morphology and created an opportunity for the utilisation of nutshell thickness as a predictor of kernel recovery. The image-based approach was found to be robust for the measurement of average nutshell thickness, with the highest correlation coefficient with KR (R = −0.87) compared with correlation between manual shell thickness measurements and KR (R = [−0.54; −0.58]). Although the presented image-based method took more time than manual measurement, it offered significantly higher accuracy. We suggest that automatic segmentation of nutshell can be explored in the future to improve the speed and efficiency.

Supplementary Materials

The following supporting information can be downloaded at: https://www.mdpi.com/article/10.3390/IECPS2021-12037/s1. Table S1: Variability in nut characteristics in 51 macadamia progeny. Table S2: Summary statistics of each accession.

Author Contributions

Conceptualization, T.D.N., B.T. and M.A.; methodology, T.D.N. and M.A.; writing—original draft preparation, T.D.N.; writing—review and editing, T.D.N., M.A. and B.T.; supervision, M.A. and B.T. All authors have read and agreed to the published version of the manuscript.

Funding

This research was funded by Hort Innovation, Australia and Queensland Alliance for Agriculture and Food Innovation. Hort Innovation funded this project through a grant ‘National Macadamia Breeding and Evaluation Program’ (MC19000). Queensland Alliance for Agriculture and Food Innovation provided funding for the summer scholarship of Truong Duc Nguyen.

Data Availability Statement

All data were provided in the supplementary Table S1.

Acknowledgments

This research has been funded by Hort Innovation, Australia, using the Macadamia research and development levy and contributions from the Australian Government. Hort Innovation is the grower owned, not-for-profit research and development corporation for Australian horticulture. The authors also acknowledge the support from Elise Elliott in conducting manual measurements of all nut samples.

Conflicts of Interest

The authors declare no conflict of interest. The funders had no role in the design of the study; in the collection, analyses, or interpretation of data; in the writing of the manuscript, or in the decision to publish the results.

References

  1. Hardner, C.M.; Peace, C.; Lowe, A.J.; Neal, J.; Pisanu, P.; Powell, M.; Schmidt, A.; Spain, C.; Williams, K. Genetic resources and domestication of macadamia. Hortic. Rev. 2009, 35, 1–125. [Google Scholar]
  2. Topp, B.L.; Nock, C.J.; Hardner, C.M.; Alam, M.; O’Connor, K.M. Macadamia (Macadamia spp.) breeding. In Advances in Plant Breeding Strategies: Nut and Beverage Crops; Springer Nature: Cham, Switzerland, 2019; pp. 221–251. [Google Scholar]
  3. Alam, M.; Neal, J.; O’Connor, K.; Kilian, A.; Topp, B. Ultra-high-throughput DArTseq-based silicoDArT and SNP markers for genomic studies in macadamia. PLoS ONE 2018, 13, e0203465. [Google Scholar] [CrossRef] [PubMed]
  4. Baek, J.; Lee, E.; Kim, N.; Kim, S.L.; Choi, I.; Ji, H.; Chung, Y.S.; Choi, M.-S.; Moon, J.-K.; Kim, K.-H. High throughput phenotyping for various traits on soybean seeds using image analysis. Sensors 2020, 20, 248. [Google Scholar] [CrossRef] [PubMed]
  5. Whan, A.P.; Smith, A.B.; Cavanagh, C.R.; Ral, J.-P.F.; Shaw, L.M.; Howitt, C.A.; Bischof, L. GrainScan: A low cost, fast method for grain size and colour measurements. Plant Methods 2014, 10, 23. [Google Scholar] [CrossRef]
  6. Marzulli, M.I.; Raumonen, P.; Greco, R.; Persia, M.; Tartarino, P. Estimating tree stem diameters and volume from smartphone photogrammetric point clouds. For. Int. J. For. Res. 2020, 93, 411–429. [Google Scholar] [CrossRef]
  7. Schüler, P.; Speck, T.; Bührig-Polaczek, A.; Fleck, C. Structure-function relationships in Macadamia integrifolia seed coats–fundamentals of the hierarchical microstructure. PLoS ONE 2014, 9, e102913. [Google Scholar] [CrossRef]
  8. Mai, T.T.; Hardner, C.; Alam, M.; Henry, R.; Topp, B. Phenotypic Characterisation for Growth and Nut Characteristics Revealed the Extent of Genetic Diversity in Wild Macadamia Germplasm. Agriculture 2021, 11, 680. [Google Scholar] [CrossRef]
  9. O’Connor, K.; Hayes, B.; Hardner, C.; Alam, M.; Topp, B. Selecting for nut characteristics in macadamia using a genome-wide association study. HortScience 2019, 54, 629–632. [Google Scholar] [CrossRef]
  10. Tanabata, T.; Shibaya, T.; Hori, K.; Ebana, K.; Yano, M. SmartGrain: High-throughput phenotyping software for measuring seed shape through image analysis. Plant Physiol. 2012, 160, 1871–1880. [Google Scholar] [CrossRef]
  11. Komyshev, E.; Genaev, M.; Afonnikov, D. Afonnikov, Evaluation of the SeedCounter, a mobile application for grain phenotyping. Front. Plant Sci. 2017, 7, 1990. [Google Scholar] [CrossRef]
  12. Akpo, H.A.; Atindogbé, G.; Obiakara, M.C.; Adjinanoukon, A.B.; Gbedolo, M.; Lejeune, P.; Fonton, N.H. Image Data Acquisition for Estimating Individual Trees Metrics: Closer Is Better. Forests 2020, 11, 121. [Google Scholar] [CrossRef]
  13. Itakura, K.; Hosoi, F. Automatic method for segmenting leaves by combining 2D and 3D image-processing techniques. Appl. Opt. 2020, 59, 545–551. [Google Scholar] [CrossRef] [PubMed]
  14. Koeser, A.K.; Roberts, J.W.; Miesbauer, J.W.; Lopes, A.B.; Kling, G.J.; Lo, M.; Morgenroth, J. Testing the accuracy of imaging software for measuring tree root volumes. Urban For. Urban Green. 2016, 18, 95–99. [Google Scholar] [CrossRef]
  15. Liu, W.; Liu, C.; Jin, J.; Li, D.; Fu, Y.; Yuan, X. High-throughput phenotyping of morphological seed and fruit characteristics using X-ray computed tomography. Front. Plant Sci. 2020, 11, 601475. [Google Scholar] [CrossRef]
  16. Herbert, S.W.; Walton, D.A.; Wallace, H.M. Pollen-parent affects fruit, nut and kernel development of Macadamia. Sci. Hortic. 2019, 244, 406–412. [Google Scholar] [CrossRef]
  17. Fletcher, A.; Rennenberg, H.; Schmidt, S. Nitrogen partitioning in orchard-grown Macadamia integrifolia. Tree Physiol. 2010, 30, 244–256. [Google Scholar] [CrossRef]
  18. Arzani, K.; Mansouri-Ardakan, H.; Vezvaei, A.; Roozban, M.R. Morphological variation among Persian walnut (Juglans regia) genotypes from central Iran. N. Z. J. Crop Hortic. Sci. 2008, 36, 159–168. [Google Scholar] [CrossRef]
  19. Chand, L.; Singh, D.B.; Kumawat, K.L.; Rai, K.M.; Sharma, O.C.; Sharma, A.; Saini, P.; Handa, A.K. Genetic variability, correlation and path-coefficient studies among Persian walnut (Juglans regia) genotypes. Indian J. Agric. Sci. 2020, 90, 28–33. [Google Scholar]
  20. Chand, L.; Singh, D.B.; Sharma, O.C.; Mir, J.I.; Kumawat, K.L.; Rai, K.M.; Rather, S.A.; Qureshi, I.; Lal, S.; Dev, I. Lateral bearing trait in Indian walnut (Juglans regia L.) germplasm: A potential yield contributing trait in early age of the tree. Int. J. Bioresour. Stress Manag. 2017, 8, 605–6010. [Google Scholar] [CrossRef]
  21. Bak, T.; Karadeniz, T. Effects of branch number on quality traits and yield properties of European hazelnut (Corylus avellana L.). Agriculture 2021, 11, 437. [Google Scholar] [CrossRef]
  22. Cheng, W. Automation of Axisymmetric Drop Shape Analysis Using Digital Image Processing. Ph.D. Thesis, University of Toronto, Toronto, ON, Canada, 1990. [Google Scholar]
  23. Tsaftaris, S.A.; Minervini, M.; Scharr, H. Machine learning for plant phenotyping needs image processing. Trends Plant Sci. 2016, 21, 989–991. [Google Scholar] [CrossRef] [PubMed]
  24. Ni, X.; Li, C.; Jiang, H.; Takeda, F. Deep learning image segmentation and extraction of blueberry fruit traits associated with harvestability and yield. Hortic. Res. 2020, 7, 1–14. [Google Scholar] [CrossRef] [PubMed]
  25. Laga, H.; Shahinnia, F.; Fleury, D. Image-based plant stomata phenotyping. In Proceedings of the 2014 13th International Conference on Control Automation Robotics & Vision (ICARCV), Singapore, 10–12 December 2014. [Google Scholar]
  26. Jayakody, H.; Petrie, P.; de Boer, H.J.; Whitty, M. A generalised approach for high-throughput instance segmentation of stomata in microscope images. Plant Methods 2021, 17, 1–13. [Google Scholar] [CrossRef] [PubMed]
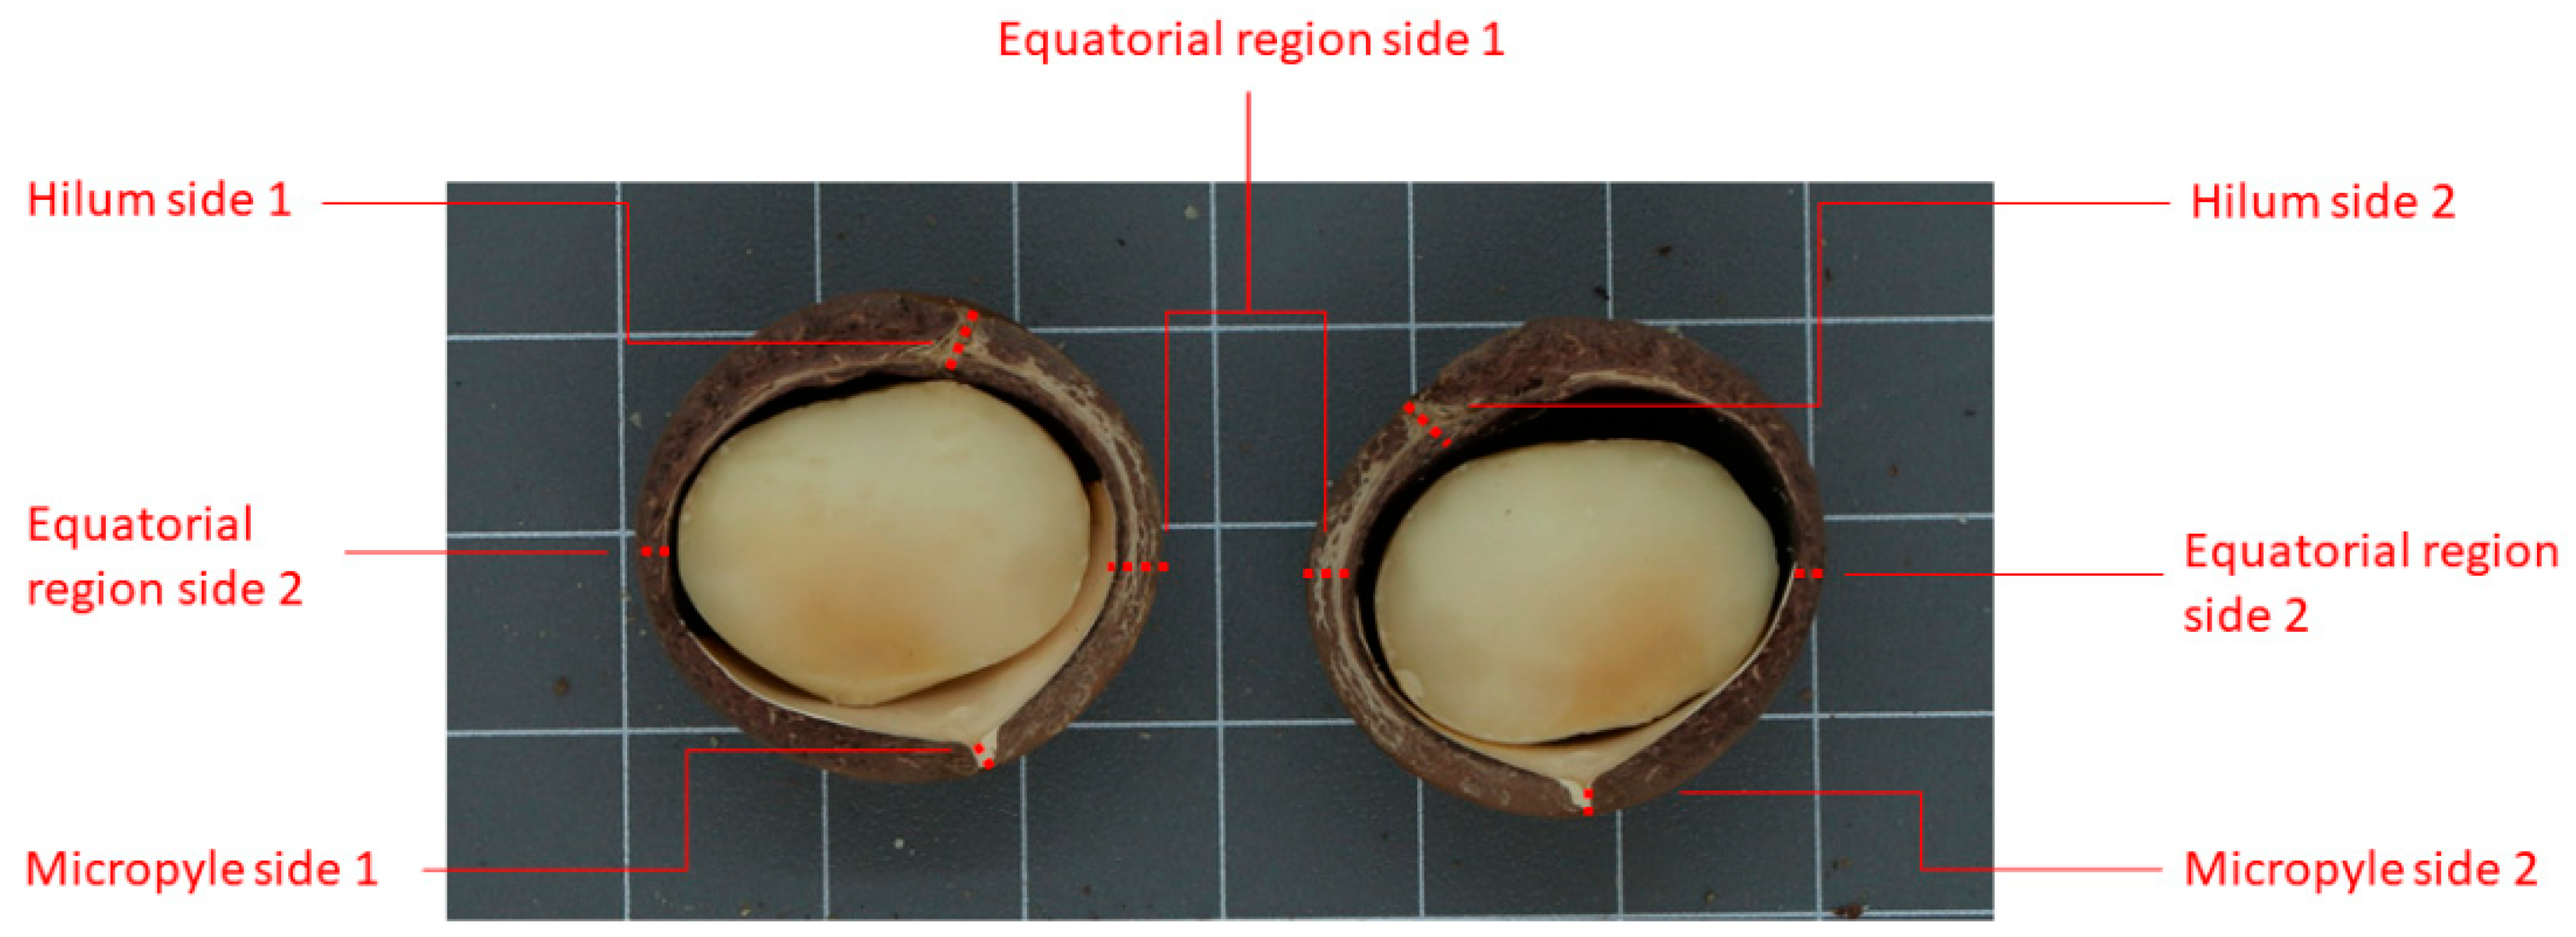
Figure 1. Measurement positions on an individual macadamia nut.
Blsf 11 00095 g001
Figure 2. Polygon selections function (yellow lines) in ImageJ: (a) a polygon around the outer bound; (b) a polygon around the inner bound.
Blsf 11 00095 g002
Figure 3. Histograms of trait measurements across genotypes: (a) weight of whole nut (WNW) in grams; (b) weight of shell (SW) in grams; (c) weight of kernel (KW) in grams; (d) kernel recovery (KR) in percentage; (e) nut length from hilum to micropyle (NLHM) in millimeters; (f), nut width at equator (NEW) in millimeters; (g) shell thickness micropyle side 1 (STHM1) in millimeters; (h) shell thickness micropyle side 2 (STHM2) in millimeters; (i) shell thickness hilum side 1 (STHH1) in millimeters; (j) shell thickness hilum side 2 (STHH2) in millimeters; (k) shell thickness equatorial region side 1 (STHE1) in millimeters; and (l) shell thickness equatorial region side 2 (STHE2) in millimeters.
Blsf 11 00095 g003
Figure 4. Histograms and standard deviations of image-measured traits: (a) outer-shell area (OA) in mm2; (b), outer perimeter (OP) in mm; (c), outer-shell width (OW) in mm; (d), outer-shell length (OL) in mm; (e), outer-shell circularity (OC) ranging from 0 to 1; (f), outer-shell roundness (OR) ranging from 0 to 1; (g), inner-shell area (IR) in mm2; (h), inner perimeter (IP) in mm; (i), inner-shell width (IW) in mm; (j), inner-shell length (IL) in mm; (k), inner-shell circularity (IC) ranging from 0 to 1; (l), inner-shell roundness (IR) ranging from 0 to 1; (m), nut section area (NSA) in mm2; (n), average nutshell thickness (ANT) in mm.
Blsf 11 00095 g004
Table 1. Extent of variations of traits across genotypes.
TraitMinimumMaximumMeanStandard Deviation
WNW (g)2.0313.406.631.77
SW (g)1.258.773.801.18
KW (g)0.285.892.850.79
KR (%)8.1767.1443.067.55
NLHM (mm)15.6734.8023.772.13
NEW (mm)16.9536.1124.582.45
STHM1 (mm)1.085.193.230.77
STHM2(mm)1.115.373.170.78
STHH1 (mm)0.836.613.970.78
STHH2 (mm)0.916.463.820.84
STHE1(mm)0.804.091.980.68
STHE2 (mm)0.834.621.920.70
Table 2. Pearson’s correlation coefficient between manually measured traits of macadamia nuts. Significance testing: p ≤ 0.001 (***); p ≤ 0.0001 (****); p > 0.05 (ns).
Correlation CoefficientSWKWWNWKR
NLHM0.75 ****0.67 ****0.82 ****−0.17 ****
NEW0.69 ****0.75 ****0.80 ****−0.03 ns
STHM10.69 ****0.24 ****0.57 ****−0.54 ****
STHM20.71 ****024 ****0.58 ****−0.55 ****
STHH10.63 ****0.12 ***0.49 ****−0.56 ****
STHH20.66 ****0.14 ****0.52 ****−0.56 ****
STHE10.64 ****0.05 ns0.45 ****−0.59 ****
STHE20.66 ****0.06 ns0.46 ****−0.58 ****
Table 3. Pearson’s correlation coefficient between image-measured traits and manually measured traits of macadamia nuts. Significance testing: p ≤ 0.05 (*); p ≤ 0.01 (**); p ≤ 0.0001 (****); p > 0.05 (ns).
Correlation CoefficientSWKWWNWKR
OA (mm2)0.93 ****0.80 ****0.97 ****−0.54 ****
OP (mm)0.93 ****0.79 ****0.97 ****−0.56 ****
OW (mm)0.91 ****0.79 ****0.95 ****−0.55 ****
OL (mm)0.90 ****0.76 ****0.94 ****−0.56 ****
OC−0.05 ns0.12 ns0.01 ns0.16 *
OR−0.06 ns−0.02 ns−0.05 ns0.07 ns
IA (mm2)0.58 ****0.88 ****0.73 ****−0.06 ns
IP (mm)0.61 ****0.88 ****0.76 ****−0.11 ns
IW (mm)0.60 ****0.82 ****0.73 ****−0.16 *
IL (mm)0.56 ****0.80 ****0.70 ****−0.07 ns
IC−0.18 **0.19 **−0.07 ns0.37 ****
IR−0.08 ns0.06 ns−0.04 ns0.22 **
NSA (mm2)0.96 ****0.47 ****0.88 ****−0.82 ****
ANT (mm)0.89 ****0.30 ****0.77 ****−0.87 ****
Publisher’s Note: MDPI stays neutral with regard to jurisdictional claims in published maps and institutional affiliations.