3.1. Aerodynamics Performance and Stability Analysis
As mentioned in the previous section, each fin configuration was paired with three different nose cones, and their aerodynamic performance was evaluated using OpenRocket. The simulation results, listed in
Table 6, were analyzed based on key aerodynamic characteristics, including apogee, drag coefficient, and stability margin. Among the tested configurations, the trapezoidal fin design paired with the ogive nose cone exhibited the most favourable aerodynamic performance in terms of drag reduction. This allowed the rocket to achieve the highest apogee (2639 m) among the tested configurations.
In rocketry, stability is typically ensured when the center of pressure (CP) is behind the center of gravity (CG) by a sufficient margin (larger separation, often measured in calibers). A larger stability margin, defined as the distance between the CG and CP, usually means the rocket will naturally self-correct more strongly (more stable), whereas a very small separation approaches neutral stability. In this study, the apex of the nose is defined as the origin, with positive distance extending toward the tail. Based on this definition,
Table 6 shows that the CP values are larger than the CG values; hence, CP is behind the CG for all configurations, indicating that all designs are statically stable.
Moreover, the stability margin was relatively large for the trapezoidal fin design paired with the ogive nose cone (CP = 202.000 cm, CG = 132.500 cm at apogee). While this larger CP–CG distance suggests a strong restoring moment and greater static stability, it may also lead to over-stability, which can cause the rocket to resist necessary course corrections.
In contrast, the conical and ellipsoid nose cone configurations exhibited higher drag coefficients at apogee, resulting in greater aerodynamic resistance. Both nose cone designs experienced higher pressure drag because of their blunt shape, which limited their maximum altitude compared with the ogive nose cone. However, the ellipsoid nose cone, when analyzed for stability margin, had the smallest CP–CG distance during engine burnout and at apogee, indicating a lower static stability margin. This could make the rocket more responsive to minor disturbances but also more susceptible to instability if not properly controlled.
The elliptical fin configuration exhibited lower aerodynamic efficiency than the trapezoidal fin design for all nose cone configurations, resulting in a lower apogee because of higher drag at maximum velocity and apogee. However, the ogive nose cone with elliptical fins showed a moderate stability margin, achieving a CP of 172.84 cm and a CG of 131.824 cm at apogee. This smaller CP–CG separation resulted in a lower static stability margin, making the configuration more manoeuvrable but potentially more prone to instability under external disturbances.
On the other hand, the tube form fin design consistently underperformed compared with the trapezoidal and elliptical fin designs, regardless of the nose cone used in the simulations. Even though the ogive nose cone resulted in the highest apogee and the lowest drag, the CP–CG distance or static margin for all nose cone designs in the tube–fin configuration was larger, leading to higher static stability but reduced manoeuvrability.
3.2. Structural Behaviour of Nose Cone Under Thermal Stress Load
The structural response of the ogive and ellipsoid nose cones under applied thermal stress loads was evaluated using three crucial parameters: resultant or total displacement (URES), equivalent strain (ESTRN), and von Mises stress.
Table 7 summarizes the key crucial parameters arising from the structural deformation simulations, including maximum displacement, equivalent strain, and von Mises stress.
Both the ogive and ellipsoid nose cone geometries exhibit comparable levels of maximum displacement—0.7249 mm and 0.7443 mm, respectively—suggesting that both are susceptible to deformation at the nose tip under thermal loads. However, the ellipsoid nose cone shows a slightly higher peak strain and a wider region of displacement, indicating a more distributed deformation pattern. The ogive, in contrast, exhibits more concentrated strain regions, which may result in higher local stresses but potentially less impact on overall shape retention.
Meanwhile,
Figure 6,
Figure 7, and
Figure 8 show the total displacement, equivalent strain, and von Mises stress distributions, respectively, for both nose cone configurations. As the deformation values are small relative to the overall rocket size, a deformation scale factor of 100 was applied in the visualizations to emphasize the effects of thermal stress and displacement. In
Figure 6, the red regions denote maximum displacement, concentrated near the nose cone apex, while the blue regions indicate minimal displacement, primarily at the rocket body because of its fibreglass material. The apex deformation is a result of thermal expansion and stress concentration in this slender region. Quantitatively, both nose cones exhibit similar maximum total displacement values. However, the ellipsoid shows a wider region of high maximum displacement compared with the ogive, suggesting comparable deformation levels, but with marginally higher susceptibility to the ellipsoid design because of its broader surface curvature.
Figure 7 shows the distribution of equivalent strain (ESTRN). For both geometries, strain is predominantly concentrated at the junction between the nose cone and cylindrical body, with values gradually tapering off toward the aft section. The ogive exhibits a more localized and slightly sharper strain concentration, whereas the ellipsoid displays a broader strain distribution along the same region. This indicates that the ogive nose cone is more prone to localized deformation, while the ellipsoid shape allows a more even dissipation of strain energy.
Figure 7 illustrates the von Mises stress distribution, highlighting critical areas where yielding may occur. Both nose cones experience maximum von Mises stress at the nose–body interface, reaching up to 7.54 × 10
7 N/m
2. The ogive exhibits a more sharply defined stress zone, whereas the ellipsoid presents a smoother gradient. This suggests that, although both geometries reach similar peak stress levels, the ellipsoid shape better distributes the stress, potentially offering enhanced resistance to localized failure.
Table 8 provides a comparative assessment of structural behaviour between the ogive and ellipsoid nose cones under identical thermal loading conditions. The maximum displacement for both is similar and exceeds 0.7 mm, indicating that thermal expansion significantly affects the nose tip region regardless of geometry. However, the ellipsoid nose cone shows more evenly distributed strain and stress contours, reducing the likelihood of localized failure and improving fatigue resistance. The von Mises stress values for both profiles reach up to 7.54 × 10
7 N/m
2, but in the ogive case, this stress is more localized around the nose–body junction. The ellipsoid profile, with its smoother curvature, better distributes stress, which could be advantageous in repetitive thermal cycling. On the other hand, the sharper ogive geometry exhibits slightly better shape retention, contributing to higher aerodynamic stability in precision flight applications.
3.3. Impact of Nose Cone Deformation on Aerodynamics Performance
For the undeformed (ideal) rocket configurations, the highest surface pressure was recorded at the stagnation point located at the tip of the nose cone. As shown in
Figure 9, this region experienced direct impingement of airflow, leading to maximum pressure accumulation. The ogive nose cone recorded a peak pressure of approximately 119,375.95 Pa, whereas the ellipsoid nose cone exhibited a higher stagnation pressure of 134,190.13 Pa (
Table 9). This difference reflects the blunter geometry of the ellipsoid profile, which results in a broader stagnation zone and consequently greater form drag.
Correspondingly, the undeformed ellipsoid nose cone generated the highest drag force of 181.352 N, compared with 173.532 N for the undeformed ogive configuration. This difference is also evident in the calculated drag coefficients, with values of 0.419 for the ellipsoid and 0.401 for the ogive, consistent in magnitude and trend with the estimates obtained using OpenRocket (see
Table 6).
Figure 9 illustrates the pressure distribution around the ideal (undeformed) rocket configurations with ogive and ellipsoid nose cones. For the ogive profile (see
Figure 9a), the pressure peaks at the stagnation point with a value of approximately 111,000 Pa, then decreases smoothly along the nose to the teal zone near the nose–body intersection (98,000 Pa). A slight pressure recovery occurs along the midsection (100,000 Pa), before the pressure drops again to about 95,000 Pa near the trailing edges of the fins, marking the onset of the wake. This smooth gradient, with only minor localized increases at the fin leading edges, indicates minimal flow separation and a well-controlled boundary layer. The confined wake and gradual pressure transitions contribute to the aerodynamic efficiency of the ogive configuration, with relatively low drag and stable flow.
In contrast, the ellipsoid nose cone (see
Figure 9b) exhibits a broader high-pressure region at the nose tip, reaching up to 134,190 Pa because of its blunt geometry. Similar to the ogive profile, the pressure then decreases downstream to around 98,000 Pa near the nose–body intersection, followed by a slight pressure recovery along the midsection to approximately 100,000 Pa. The wake region, identified by pressure values of about 95,000 Pa near the fin trailing edges, also resembles that of the ogive configuration in shape and extent. However, despite these similarities in flow behaviour, the ellipsoid nose cone generates higher form drag and exhibits less favourable pressure gradients overall, primarily because of its significantly higher stagnation pressure and larger frontal area. These characteristics confirm that the ellipsoid profile is aerodynamically less efficient than the ogive configuration under subsonic flight conditions.
Figure 10a shows the pressure distribution for the deformed ogive nose cone. The stagnation point remains clearly defined at the tip, with a peak pressure of approximately 111,000 Pa, slightly reduced from the undeformed case (119,375.95 Pa,
Table 9) because of minor surface distortions. The deformation introduces geometric asymmetry, causing the high-pressure region to shift slightly off-axis. This results in an uneven pressure field that may induce lateral aerodynamic forces, potentially affecting flight stability. Pressure then decreases steadily along the body, reaching about 98,000 Pa near the nose–body intersection, followed by a modest recovery along the midsection. Near the rocket base, pressure drops again to approximately 95,000 Pa at the trailing edges of the fins, indicating the onset of a confined wake. Compared with the undeformed case, the deformed ogive shows a minimal degradation in aerodynamic performance. The drag force increases slightly from 173.532 N to 174.951 N, and the drag coefficient rises marginally from 0.401 to 0.404 in
Table 9, suggesting the overall aerodynamic efficiency is largely preserved.
In contrast, the deformed ellipsoid nose cone, shown in
Figure 10b, exhibits more substantial aerodynamic penalties. Although the stagnation pressure drops from 134,190.13 Pa (undeformed) to about 111,000 Pa, the broader and blunter shape causes the high-pressure region to remain more expansive. Pressure decreases sharply to around 98,000 Pa near the shoulder, followed by a modest recovery, and ultimately falls to about 95,000 Pa at the fin trailing edges. While the drag force decreases from 181.352 N to 172.933 N, the drag coefficient also drops from 0.419 to 0.399 (
Table 9). However, this reduction does not indicate improved aerodynamic efficiency. Rather, it reflects the redistribution of flow energy into turbulent motion and enlarged wake structures. These outcomes are consistent with blunt-body aerodynamic theory, where flow separation occurs earlier and more severely, forming larger turbulent wakes and increasing pressure drag [
24,
25]. Deformation worsens these effects by introducing asymmetry and disturbing streamline attachment, leading to greater instability and energy loss. Similar conclusions have been drawn in studies of nose bluntness in hypersonic and re-entry configurations, which consistently show reduced aerodynamic performance for blunter shapes under compressible and viscous flow conditions [
24].
Additionally, a line graph was generated to compare the surface pressure distribution along the rocket body for different nose cone configurations.
Figure 11 presents the pressure coefficient (Cp) distributions along the surface of the rocket from aft to nose for both ideal and deformed configurations, comparing the ogive (
Figure 11a) and ellipsoid (
Figure 11b) nose cones. The Cp profiles reveal the effects of thermally induced geometric deformation on aerodynamic pressure behaviour.
In the ogive configuration, both the ideal and deformed cases follow a similar trend. Cp values are nearly constant (~0) along the cylindrical body, followed by a sharp increase approaching the nose. At the nose tip, the ideal ogive exhibits a maximum Cp close to 0.6, characteristic of a mild stagnation point pressure. The deformed case, while closely matching this profile, shows a slight reduction in peak Cp, indicating the redistribution of surface pressure due to geometric asymmetry. This aligns with the pressure field visualization shown in
Figure 10a and the numerical results reported in
Table 9, where drag and maximum pressure increase only marginally for the deformed ogive.
The ellipsoid configuration (
Figure 11b) shows more pronounced effects of deformation. The ideal ellipsoid has a higher peak Cp, reaching values above 1.1, reflecting a broader and more intense stagnation zone. In the deformed case, the Cp distribution is visibly dampened, causing the peak Cp to drop, and the curve becomes smoother and flatter around the nose. This softening indicates a wider pressure plateau, consistent with the larger stagnation area and pressure drag observed in
Figure 9b and
Figure 10b. While the average drag decreases, as shown in
Table 9, the pressure coefficient data reinforce that this is due to redistributed and dissipated aerodynamic forces, not improved aerodynamic efficiency. The broader wake and earlier separation associated with this flatter Cp profile confirm increased turbulence and energy loss, in line with blunt-body flow behaviour [
25,
26].
Overall, the Cp plots in
Figure 11 quantitatively validate the flow behaviour discussed earlier: the ogive nose cone maintains its aerodynamic sharpness under deformation, while the ellipsoid nose cone exhibits stronger performance degradation because of its inherently blunt and deformation-sensitive profile.
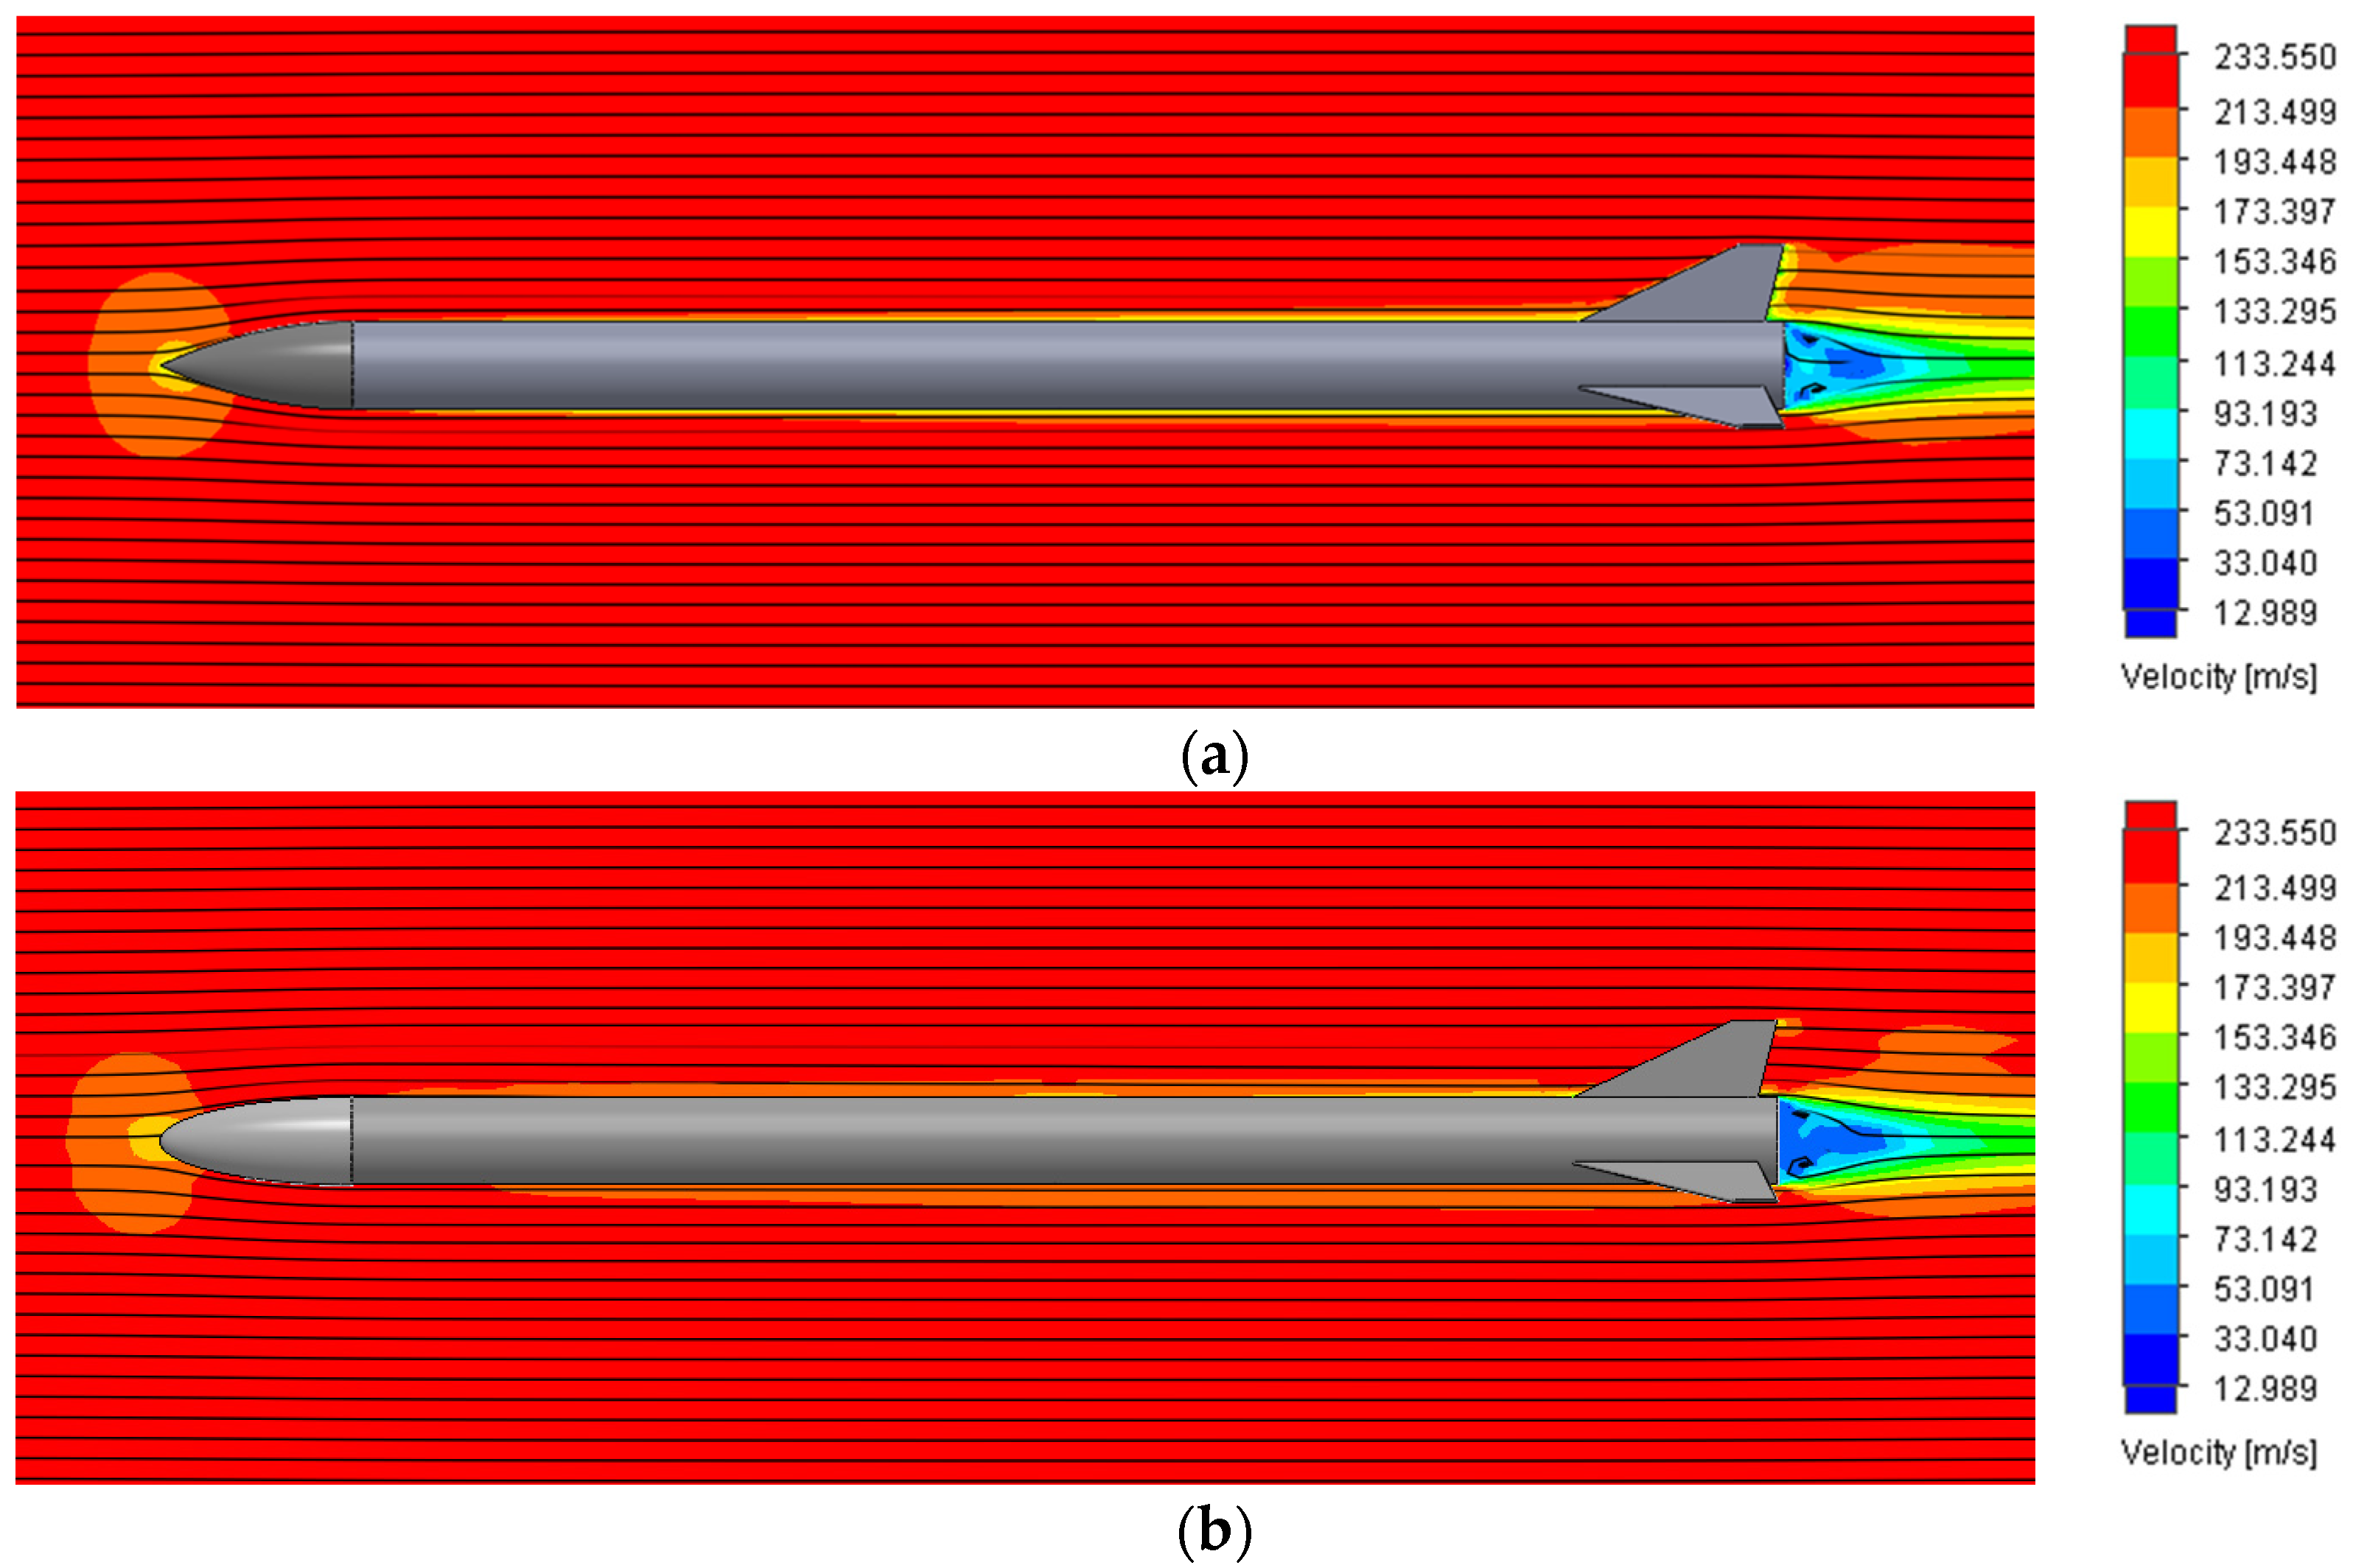
Figure 12 presents the velocity magnitude contours and streamlines around the deformed ogive and ellipsoid nose cone rockets. Both configurations show a comparable freestream velocity field around the rocket body and a visible stagnation zone at the nose tip. The velocity drops sharply in the wake region behind the rocket base, with the lowest velocity values (~13 m/s) concentrated in the base and fin areas for both geometries. The streamlines remain aligned with the flow direction and do not exhibit significant divergence or recirculation zones.
The similarity in streamline behaviour and wake structure suggests that, under the simulated subsonic conditions, nose cone deformation alone does not drastically alter the external velocity field in a way that is easily distinguishable in streamline visualizations. However, when considered alongside pressure distribution (
Figure 9 and
Figure 10) and pressure coefficient trends (
Figure 11), subtle differences in surface pressure behaviour and stagnation region intensity still support the conclusion that the ogive nose cone maintains better aerodynamic performance.
3.4. Fin Analysis
In this analysis, only two fins were focused on, trapezoidal and elliptical, because only these fins gave the best performance aerodynamically when studied using OpenRocket software, as mentioned in
Section 3.1. The analysis focuses on pressure distribution around each fin, obtained via CFD simulations, as illustrated in
Figure 13 and
Figure 14.
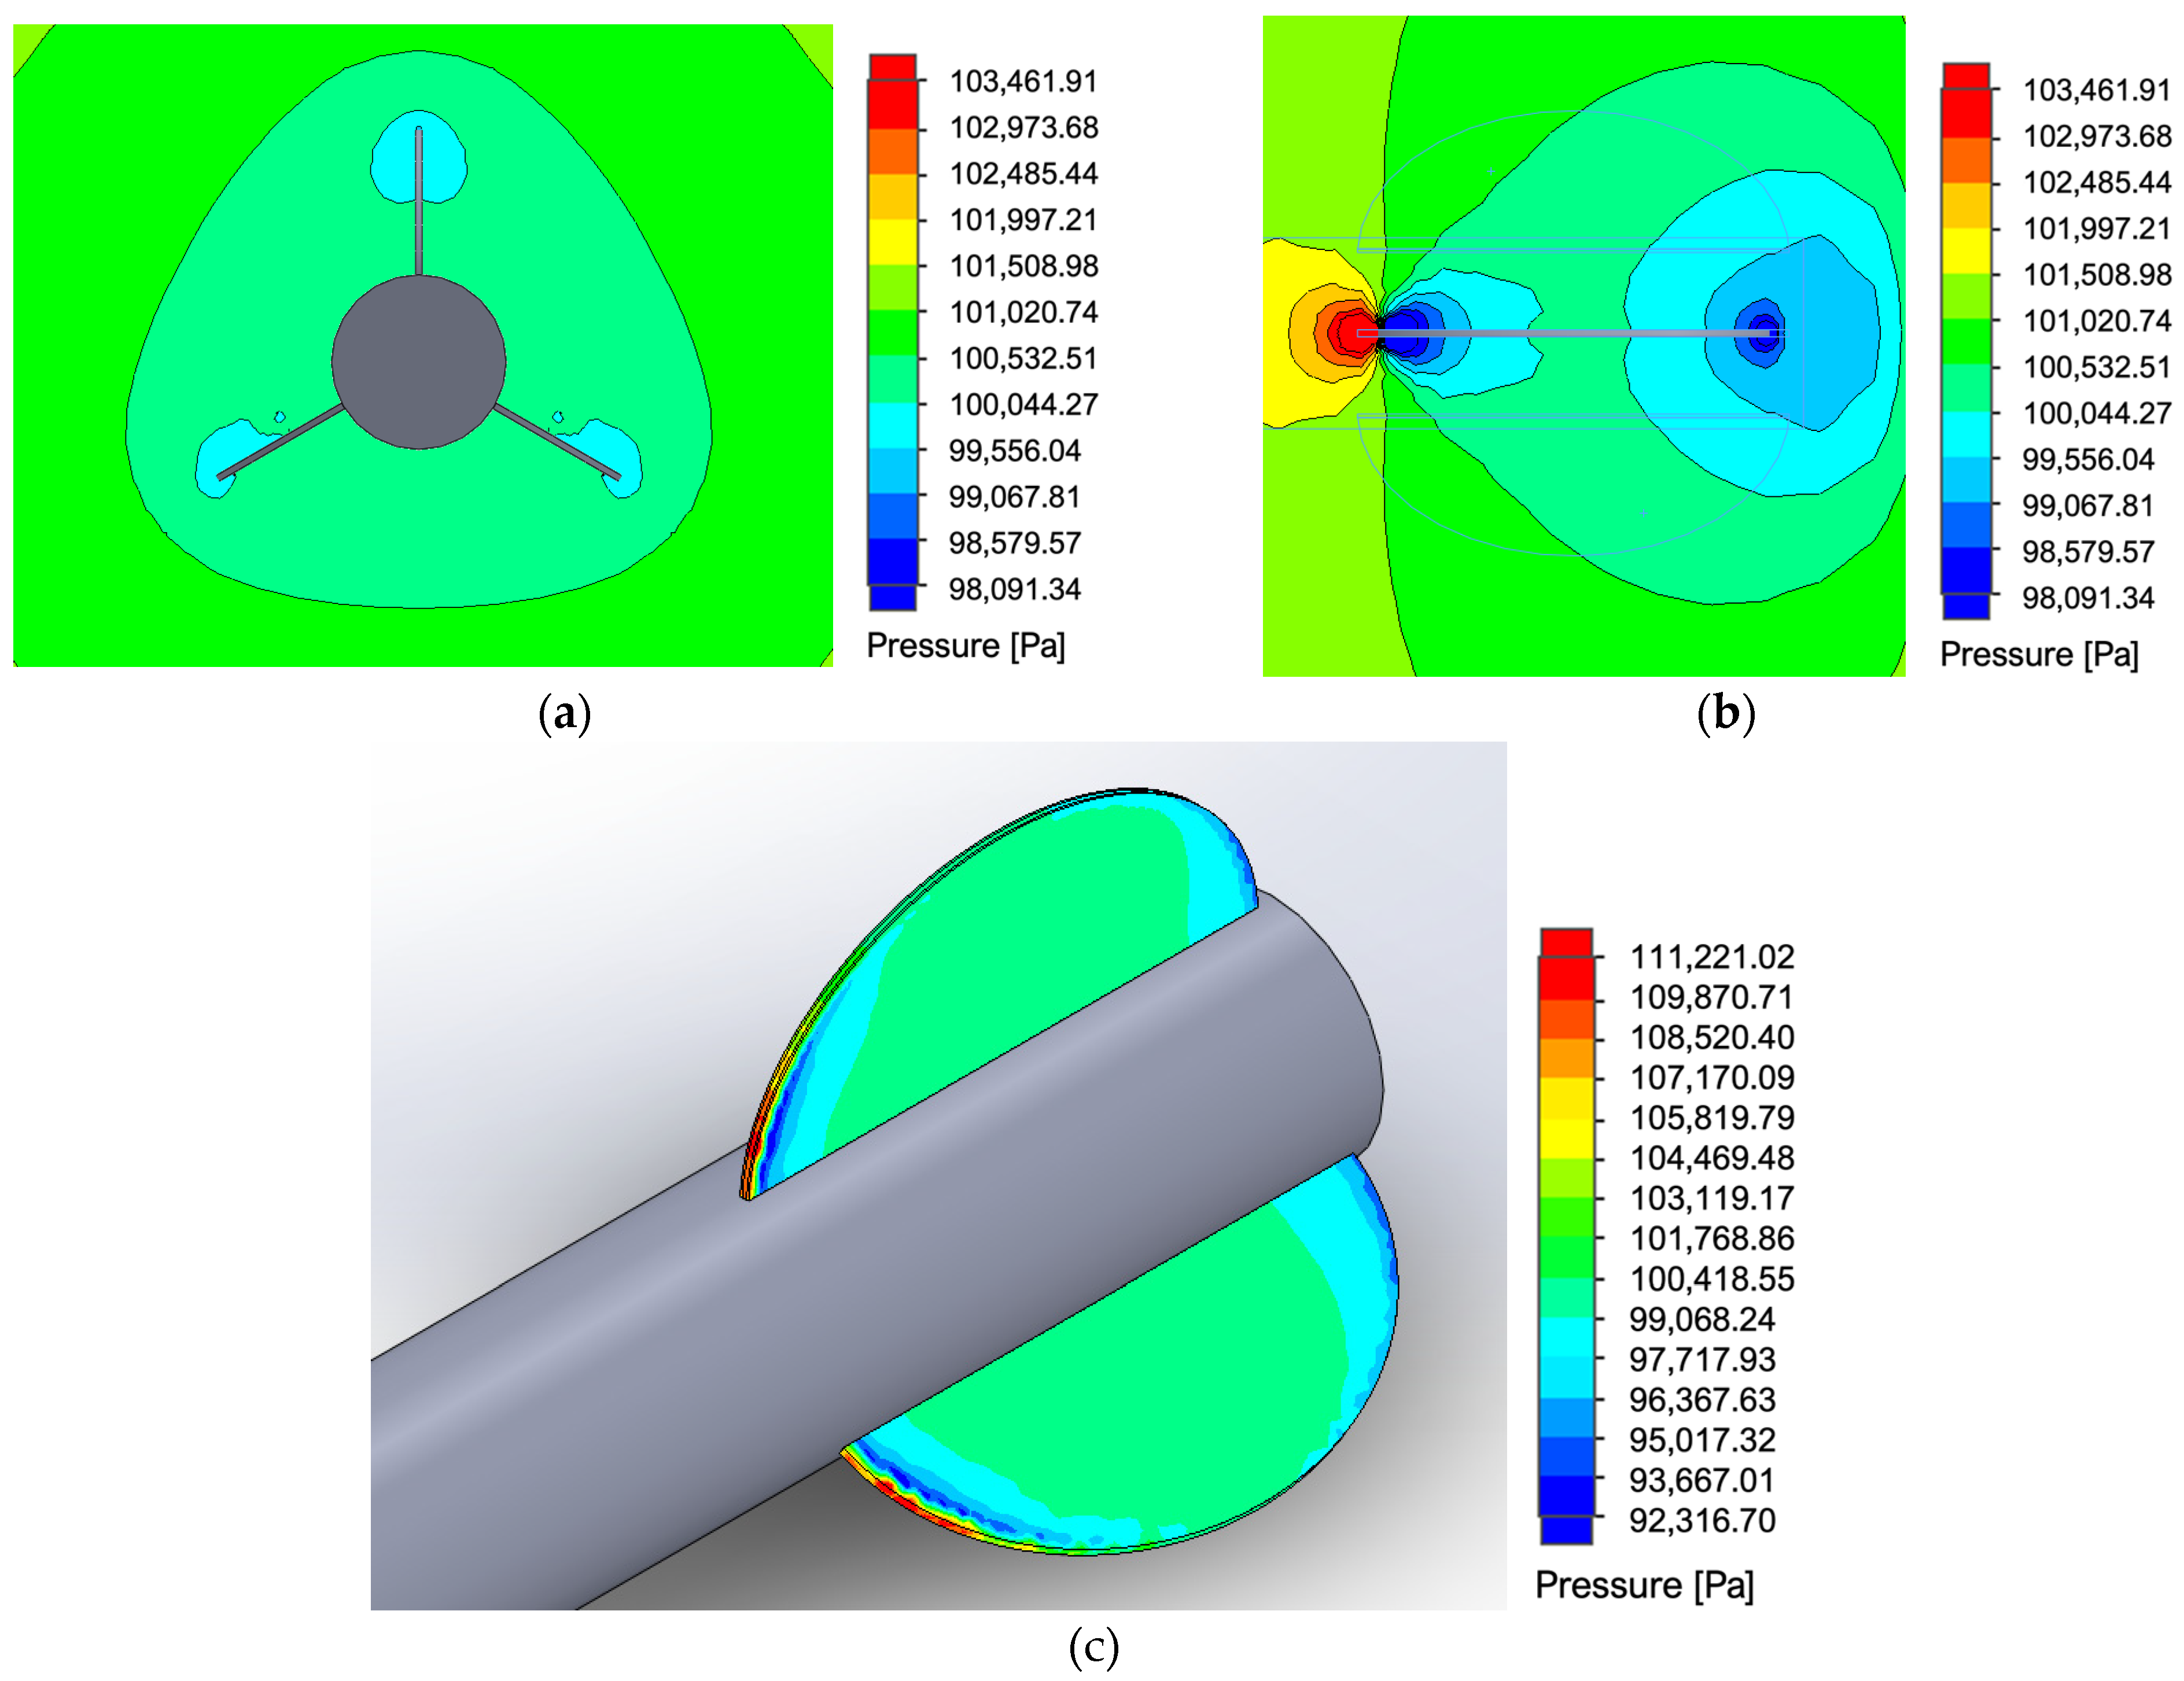
Figure 13 illustrates the pressure distribution around the trapezoidal fin from three different perspectives: rear (a), side (b), and surface (c). In the rear view, distinct high-pressure zones are visible near the fin tips, indicating the presence of localized aerodynamic loading and tip vortex formation. The side view highlights a concentrated stagnation region at the leading edge, where the oncoming flow decelerates sharply. This is followed by a steep pressure gradient along the fin surface, suggesting early flow separation. On the fin surface, pressure is highest at the leading edge and decreases toward the trailing edge, resulting in asymmetrical loading that may contribute to side forces and rolling moments. Despite this, the trapezoidal fin maintains good pressure anchoring and flow stability, as seen from the contour transitions.
In comparison,
Figure 14 shows the pressure distribution for the elliptical fin. Compared with the trapezoidal fin, the rear view reveals a more symmetrical and smoother pressure field with less tip-induced pressure distortion. The side view depicts a broader, more evenly distributed stagnation region at the leading edge, reflecting improved flow attachment. Surface contours show a gradual and continuous pressure gradient along the chord, with minimal abrupt changes. This behaviour is consistent with the aerodynamic characteristics of elliptical fins, which typically promote smoother boundary layer development and reduced flow separation across the surface.
However, when comparing the aerodynamic performance quantitatively, the trapezoidal fin demonstrates a lower drag. CFD results in
Table 10 show that the trapezoidal fin generates an average drag force of 33.120 N, while the elliptical fin produces a higher drag force of 41.412 N, a difference of over 25%. This is supported by OpenRocket simulation results (see
Table 6), where the trapezoidal configuration also recorded lower drag coefficients, 0.480 versus 0.539 for the elliptical fin when paired with an ogive nose cone. The higher drag observed in the elliptical fin is likely due to its larger wetted surface area and increased frontal curvature, which contribute to greater form drag despite its favorable surface pressure characteristics.
In summary, although CFD visualization indicates that the elliptical fin provides a smoother pressure distribution and potentially better directional stability, the trapezoidal fin offers superior aerodynamic efficiency by generating lower drag forces and drag coefficients. This reinforces the importance of integrating both visual flow diagnostics and quantitative simulation data when evaluating fin designs for sounding rocket applications.


 ,
, 


