1. Introduction
Wind power science has seen tremendous development and growth over the last 40 years. Advancements in the design, manufacturing, installation, and operation of wind turbines have enabled the rapid commercial deployment of wind power generation systems. The large-scale commercial deployment of wind turbines has led to a decline in the levelized cost of energy (LCOE) [
1]. This reduction in the LCOE has primarily been driven by advancements in wind turbine technology, particularly the increased hub height, rotor diameter, and, consequently, rated power. These economies-of-scale factors have been augmented by innovations in wind turbine blades. Modern blades are sophisticated aerodynamic structures, manufactured using highly advanced materials and processes. The blades today also possess the modular capabilities of incorporating several after-market upgrades with relative ease. These developments have ensured that today’s wind turbines are able to maximize power production while keeping costs low.
However, even with these advancements, some of the classical problems still remain. Especially the well-known “square-cube law” associated with the upscaling of wind turbines. For a particular wind speed, the mass of the rotor scales with the cube of the rotor radius (the volume) whereas the power generated scales with the square (rotor area). Moreover, even though the increasing costs can be balanced elsewhere in this large wind energy conversion system, future advancements are bound by this law.
Maximizing the energy extraction process for the future calls for a holistic view of all aspects of a wind power system. Developmental efforts need to be broadened to include not just single turbines but also the optimization of the collective wind farm and, moreover, the fleet of wind farms connected to the overall electricity grid. This calls for comprehensive analyses of the various multi-scale phenomena involved, beginning from the local flow and response of the turbines to the complex flows through a wind farm, and, finally, the regional and global weather phenomena. To this end, the IEA Wind TCP has articulated the
Grand Challenges that position wind power as the primary form of electricity, providing one-third to (potentially) one-half of the demand, as reported by Dykes et al. [
2] and Veers et al. [
3]. The first grand challenge emphasizes the need for an improved understanding of the physics of the complex flows within wind farms. The simplification of the complex physics involved has allowed for the proliferation of wind power plants; however, there are major gaps in our thorough understanding of all the underlying phenomena. This understanding is critical for ensuring the optimal design and operation of the next generation of wind farms.
Fundamental to the design of a wind farm is the understanding of the evolution, interaction, and consequent impact, of the wakes of turbines in the farm. Intuitively, the presence of the wakes of upstream turbines significantly impacts the power production of downstream turbines. These wakes also lead to varying loads on the downstream turbine. The complex wakes vary according to the size and type of turbine, and the prevalent wind and turbine operating conditions. Hence, their analyses are crucial in order to maximize energy production and lower the capital and operational costs.
Studying the wakes at scale, in “test” wind farms is impossible because of the uncontrollable, transient, and spatially varying nature of wind. Computational models and simulations are indispensable tools available for the understanding of wind turbine wakes for the design and development of wind farms.
Several models have been developed for the analyses of the wind turbine wakes, from simplified techniques [
4] to the various types of CFD techniques, such as Reynolds-Averaged Navier–Stokes (RANS) [
5,
6,
7] and Large Eddy Simulation (LES) (such as EllipSys3D [
8], PALM [
9], SOWFA [
10], and NALU [
11,
12]). All of these models have varying degrees of fidelity and associated computational costs. Typically, higher-fidelity models tend to require increasing amounts of computational resources leading up to Direct Numerical Simulation (DNS) codes [
13], which are practically intractable for wind-farm simulations. While LES has been a favored candidate in contemporary research [
14,
15], it still requires a large amount of computational power (albeit far less than DNS).
One family of techniques that can fill this gap is vortex methods, which for several decades have been formulated for wind turbines and other types of open-flow turbomachinery, such as propellers, helicopter rotors, and hydrokinetic turbines. These models are based on representations of the turbine blades and their wakes by assemblies of vortex filaments, or by a set of the so-called vortex “blobs”. More detailed descriptions of different alternatives for the vortex modeling approach can be found in Leishman [
16], in particular when applied to helicopter rotors.
Vortex methods do not involve the large number of simplifications inherent to low-fidelity models, and, at the same time, do not require the large modeling and computational resources of conventional high-fidelity CFD-based techniques (LES). Belonging to the Lagrangian framework, vortex methods, in contrast to the Eulerian techniques, significantly reduces the computational requirements since the computations are performed only at the Lagrangian markers. These Lagrangian markers (or the nodes of the vortex filaments) are naturally tracked along their evolution exactly where they are, instead of the really large computational domain of conventional Eulerian techniques. These methods can compute the velocity field at any arbitrary location as a simple, independent post-processing operation. After a certain limit, the Eulerian (or grid-based) methods are completely ill-suited for such complex flows.
Focus of this Study
As we already discussed in the previous paragraphs, tremendous progress has been made in the design and development of a diverse set of modeling tools that individually address the different multi-physics aspects of wind power systems. The structural dynamics of the turbine can be studied using reduced order models and modal analysis all the way up to complete 3D finite elements. The aeroelastic response of the blades can be studied using the models belonging to the BEM family (see Manwell et al. [
17] and Burton et al. [
18], among others), or 3D, coupled FSI codes.
However, the continued growth in the deployment of new wind energy systems rests on the successful integration of interlinked multi-scale physics. The coupling of the aero–elasto–inertial physics of an individual turbine with the farm flow models is an indispensable step for any coupled multi-physics modeling system. With such a system, other aspects of the wind farm dynamics, such as farm-collective control strategies involving different electro–mechanical components, the farm microgrid, and, ultimately, the overall grid dynamics, can then be successfully included. This unified modeling framework shall enable the development and deployment of future wind farms.
The comprehensive modeling system needs to have the capability to solve all the non-linear, coupled, physics involved at their appropriate spatial and temporal scales—using manageable computational resources. Thus, the challenge is to develop a coupled, multi-physics, transient modeling system that can provide solutions of appropriate fidelity at a reasonable computational cost.
Various modeling techniques integrate a subset of the different physics of wind energy systems, at varying levels of abstraction and fidelity. It is the aim of the current endeavor to expand on a system based on a multi-physics unified paradigm building on the existing Common ODE Framework (CODEF) technique introduced in Ponta et al. [
19]. Leveraging the capabilities of Lagrangian, vortex lattice-based methods, this article describes the development and validation of a novel free vortex lattice technique called the Gaussian-core Vortex Lattice Model (GVLM). A further step in the development of wind turbine modeling systems, the GVLM accurately represents the complex dynamics of wind turbine wake evolution, capturing features of wake structure and meandering that are extremely challenging and computationally expensive to represent by the existing models mentioned above.
Seamlessly integrating with CODEF, the new GVLM module expands CODEF’s capabilities to accurately represent the collective farm flow, and the turbine-to-turbine interaction, with a high level of fidelity and a moderate computational cost. Thus, the GVLM introduces into CODEF a feature that is essential for representing the collective farm dynamics in simulations run under different operational scenarios. The CODEF-GVLM combination provides researchers in the wind energy discipline with a tool that allows the testing and implementation of innovative control strategies for the farm collective. This would ultimately translate into an optimization of the entire farm’s efficiency and reliability as a power generation plant.
2. The Common ODE Framework (CODEF)
In this section, we shall discuss CODEF, the multi-physics virtual test environment for wind turbines whose capabilities have been expanded by the body of work presented here. We shall also briefly describe its underlying structural and aerodynamic modules.
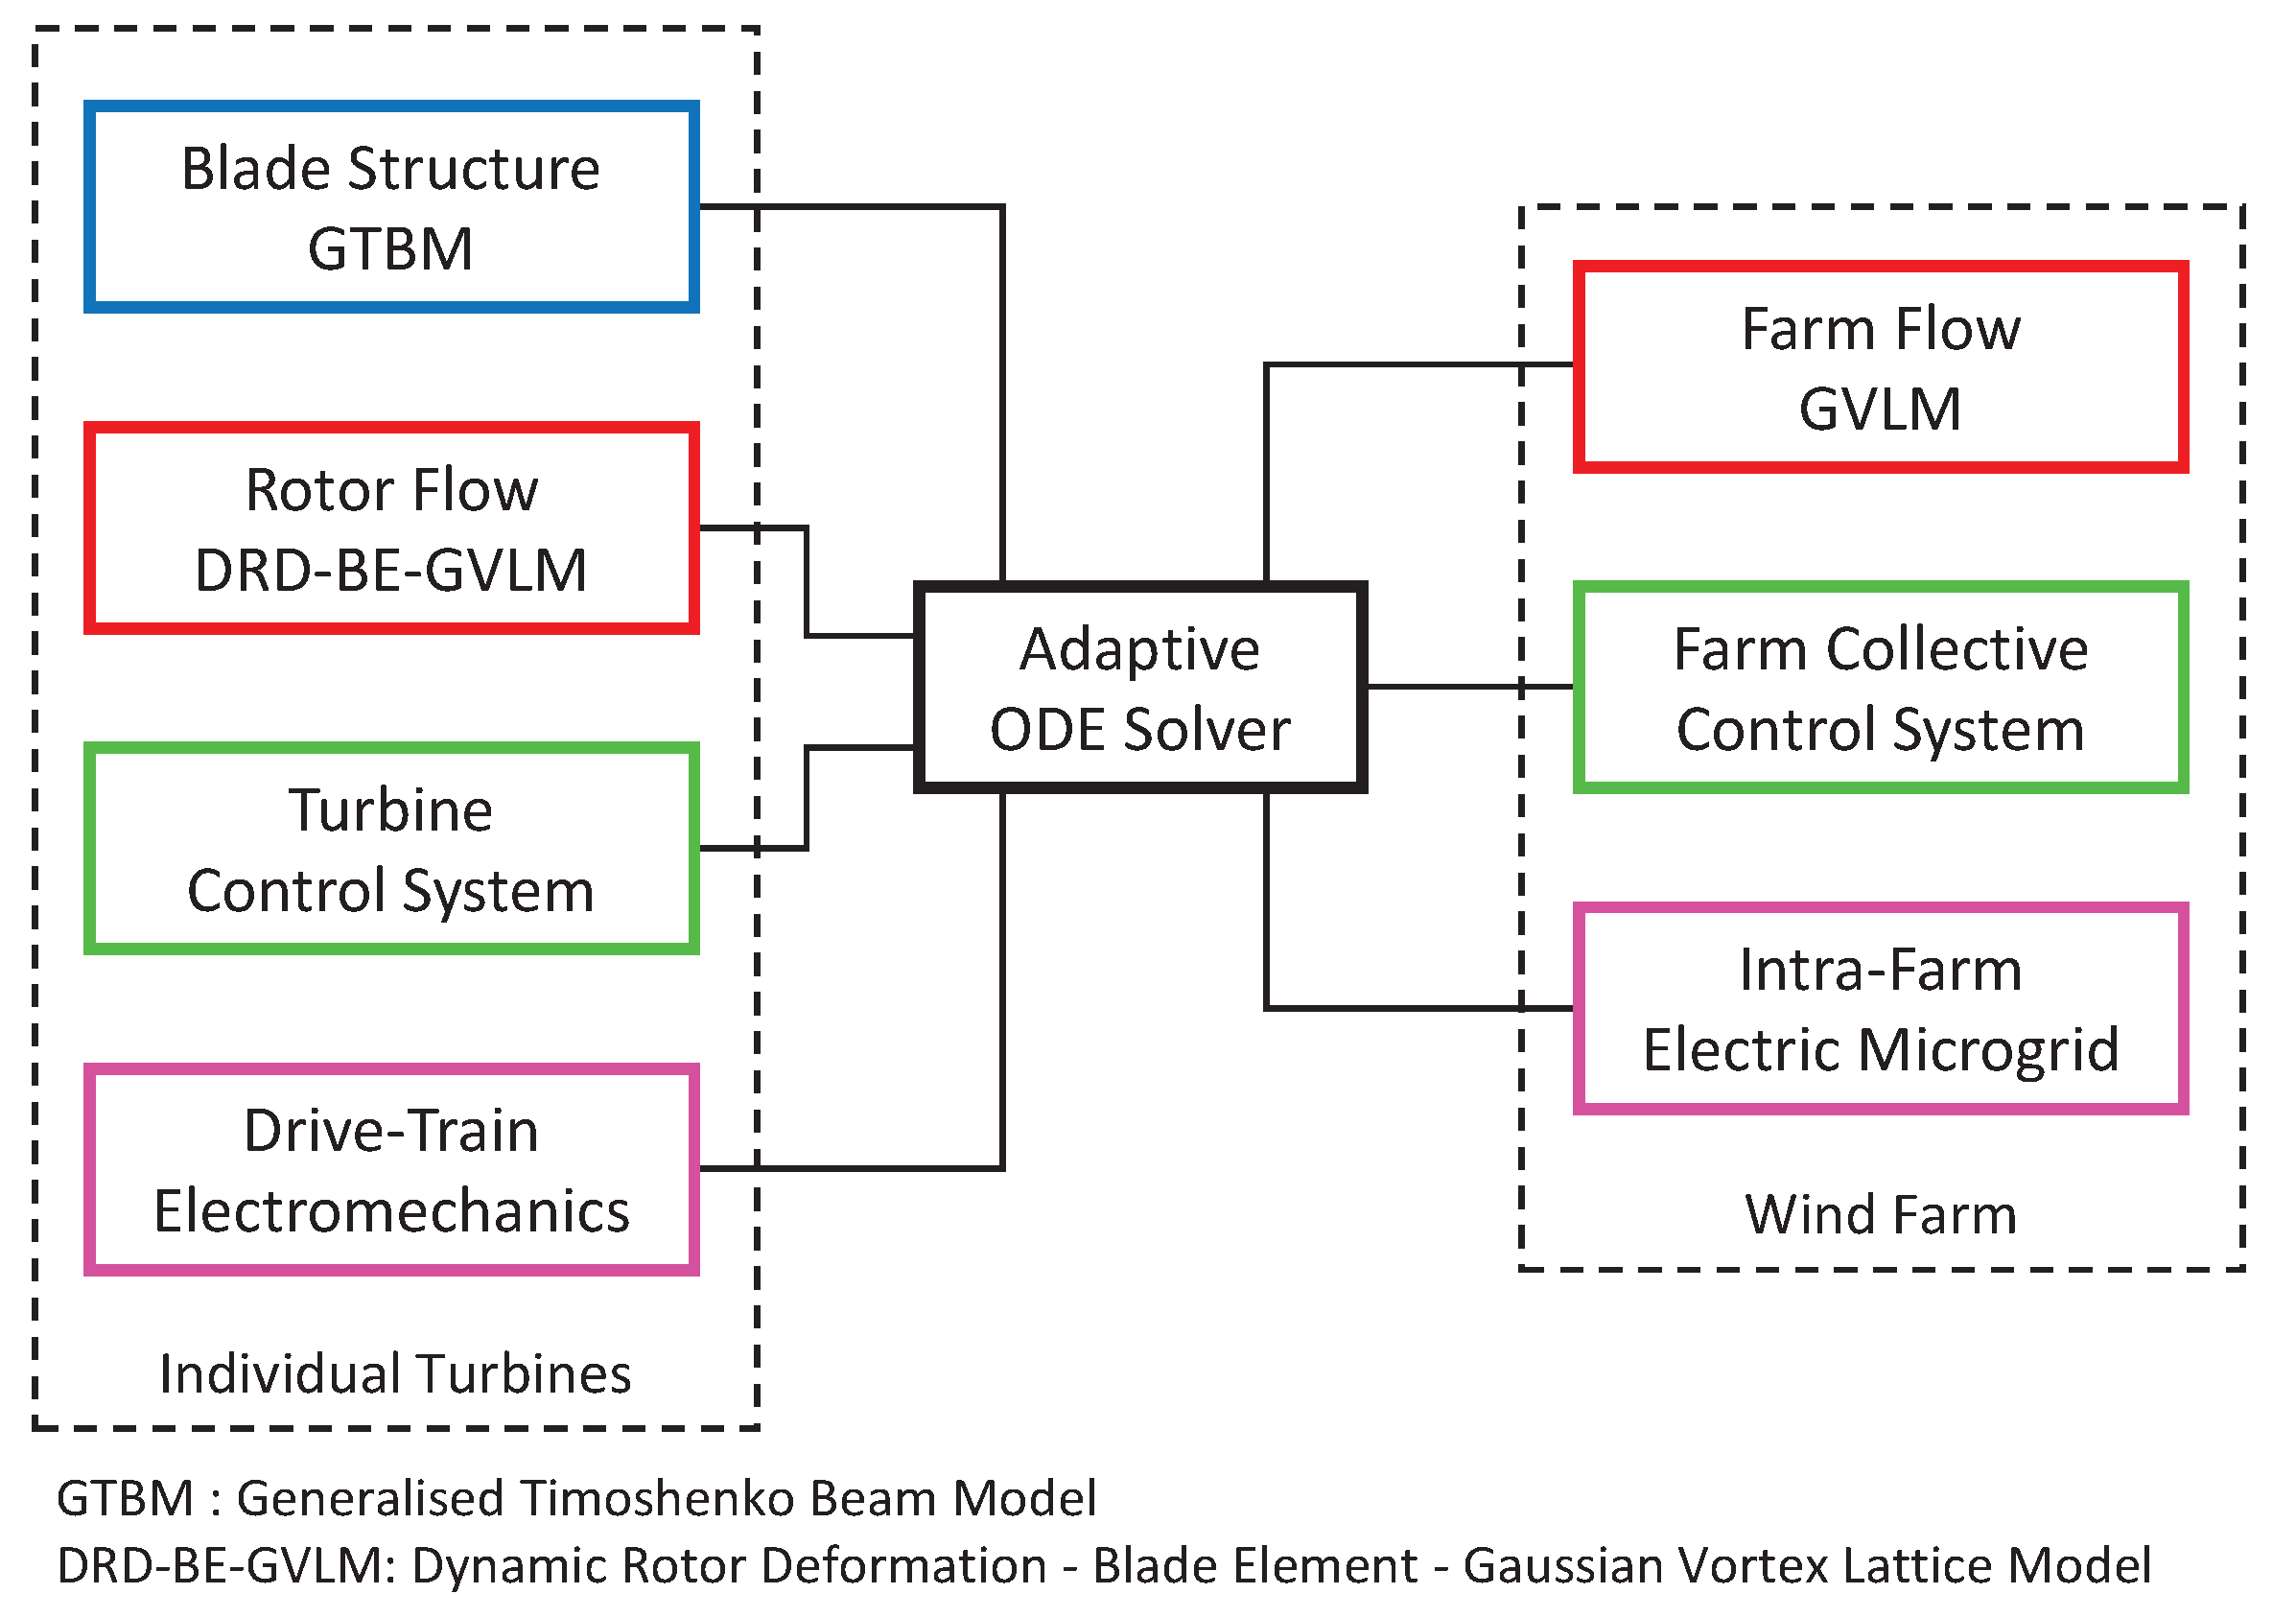
CODEF is an adaptive, variable-time step/variable-order ODE solver for wind turbine dynamics. The modularity of this common framework allows for easy integration of all of the dynamic components of a wind turbine to solve a master ODE system. Aspects affecting the dynamics of the turbine, such as the rotor flow, blade structure, control system, and electro–mechanical device, can be added to the feedback system in the form of modules comprised their representative differential equations and modifications to the boundary conditions. CODEF thus is able to treat these modules individually while interfacing with them using a computationally efficient, non-linear, adaptive ODE routine. By monitoring the local truncation error at each time step, it integrates all of the different multi-physics aspects of the problem, improving the efficiency and ensuring the stability of the time-marching numerical scheme.
Such modularity supports the independent development of the existing modules, and, at the same time, promotes the expansion of CODEF’s capabilities. CODEF is perfectly suited for seamlessly interconnecting the dynamics of an individual turbine with new modules intended for the farm-scale flow, the wind farm collective control system, and the intra-farm microgrid.
Figure 1 is a flow-diagram of CODEF outlining the interrelations between the different modules along with the newly added capabilities to simulate wind farms.
3. The Gaussian-Core Vortex Lattice Model
Many classical vortex lattice schemes that have been used for years are generally based on the Biot–Savart law to compute the swirling velocity induced by a single vortex filament in its surroundings (see Strickland et al. [
24], Ponta and Jacovkis [
25], Karamcheti [
26], and Cottet and Koumoutsakos [
27], among others). The Biot–Savart formulation is essentially an idealized model in which the velocity induced by a vortex filament of a finite length at any generic point P in its surrounding space is given by
where, as indicated in
Figure 2,
is the circulation of the vortex,
h is the distance perpendicular to the filament to any generic point P in space,
is the unit vector given by the cross product between the axis of the filament and the distance axis to that P point, and
and
are the internal angles between the axis of the filament and the distance axes to point P from each one of the filament’s ends.
An inspection of Equation (
1) indicates that, as a generic point in space moves closer to a Biot–Savart filament, the induced velocity at that point increases dramatically, to the extent that it becomes infinite if the point lies on the axis of the filament itself (i.e., when
h becomes zero). This is completely unrealistic. In fact, in any real vortex, the velocity induced at a point located at the center of the vortex core is zero.
When a filament operates as part of an assembly in the context of a vortex lattice method, these unrealistically high velocities induced in the immediate vicinity of each individual filament will ultimately destabilize the mutual advection of all the filaments in the lattice. This ultimately leads to an absolutely chaotic advection pattern that has no resemblance to the actual evolution of the vortex wake structure.
An alternative representation of the vortex core behavior was proposed by Lamb [
28] (Chap. XI, Art. 334a), and it is known as the “Lamb-Vortex Model” (see also Ponta [
29], Batchelor [
30], Hooker [
31], Flór and van Heijst [
32], and Trieling et al. [
33] for more details about this model and its applications).
Based on an analogy with a classical solution of transient head conduction in a homogeneous medium, the Lamb-Vortex Model provides a more realistic representation of the radial distribution of the swirling velocity via the adoption of a Gaussian radial distribution for the vorticity in the vortex core. In Lamb’s model, the vorticity evolves over time, spreading radially into the flow domain, in a manner analogous to temperature in the two-dimensional diffusion of heat from a point-concentrated heat source emerging instantaneously at time zero. This Gaussian vorticity distribution is given as a function of the radial distance from the vortex axis
r and the time
t since the moment of the emergence of the vortex singularity:
where
is the kinematic viscosity of the fluid media. The corresponding magnitude of the induced swirling velocity along the radial distance is given by
At any instant in time,
V is maximum for a radius
such that
while the peak vorticity at the center of the vortex core at any instant in time is
The parameter can be interpreted as the measure of an equivalent core radius for the vortex. The radius expands as the vortex evolves in time via the vorticity diffusion process, at a rate controlled by the kinematic viscosity of the fluid media . The same diffusion process controls the rate of decay of the peak vorticity .
Substituting Equation (
4) into Equation (
3), an expression for the swirling induced velocity in terms of
can be obtained
and we shall return to this expression later on in our discussion of real vortices in
Section 3.1.
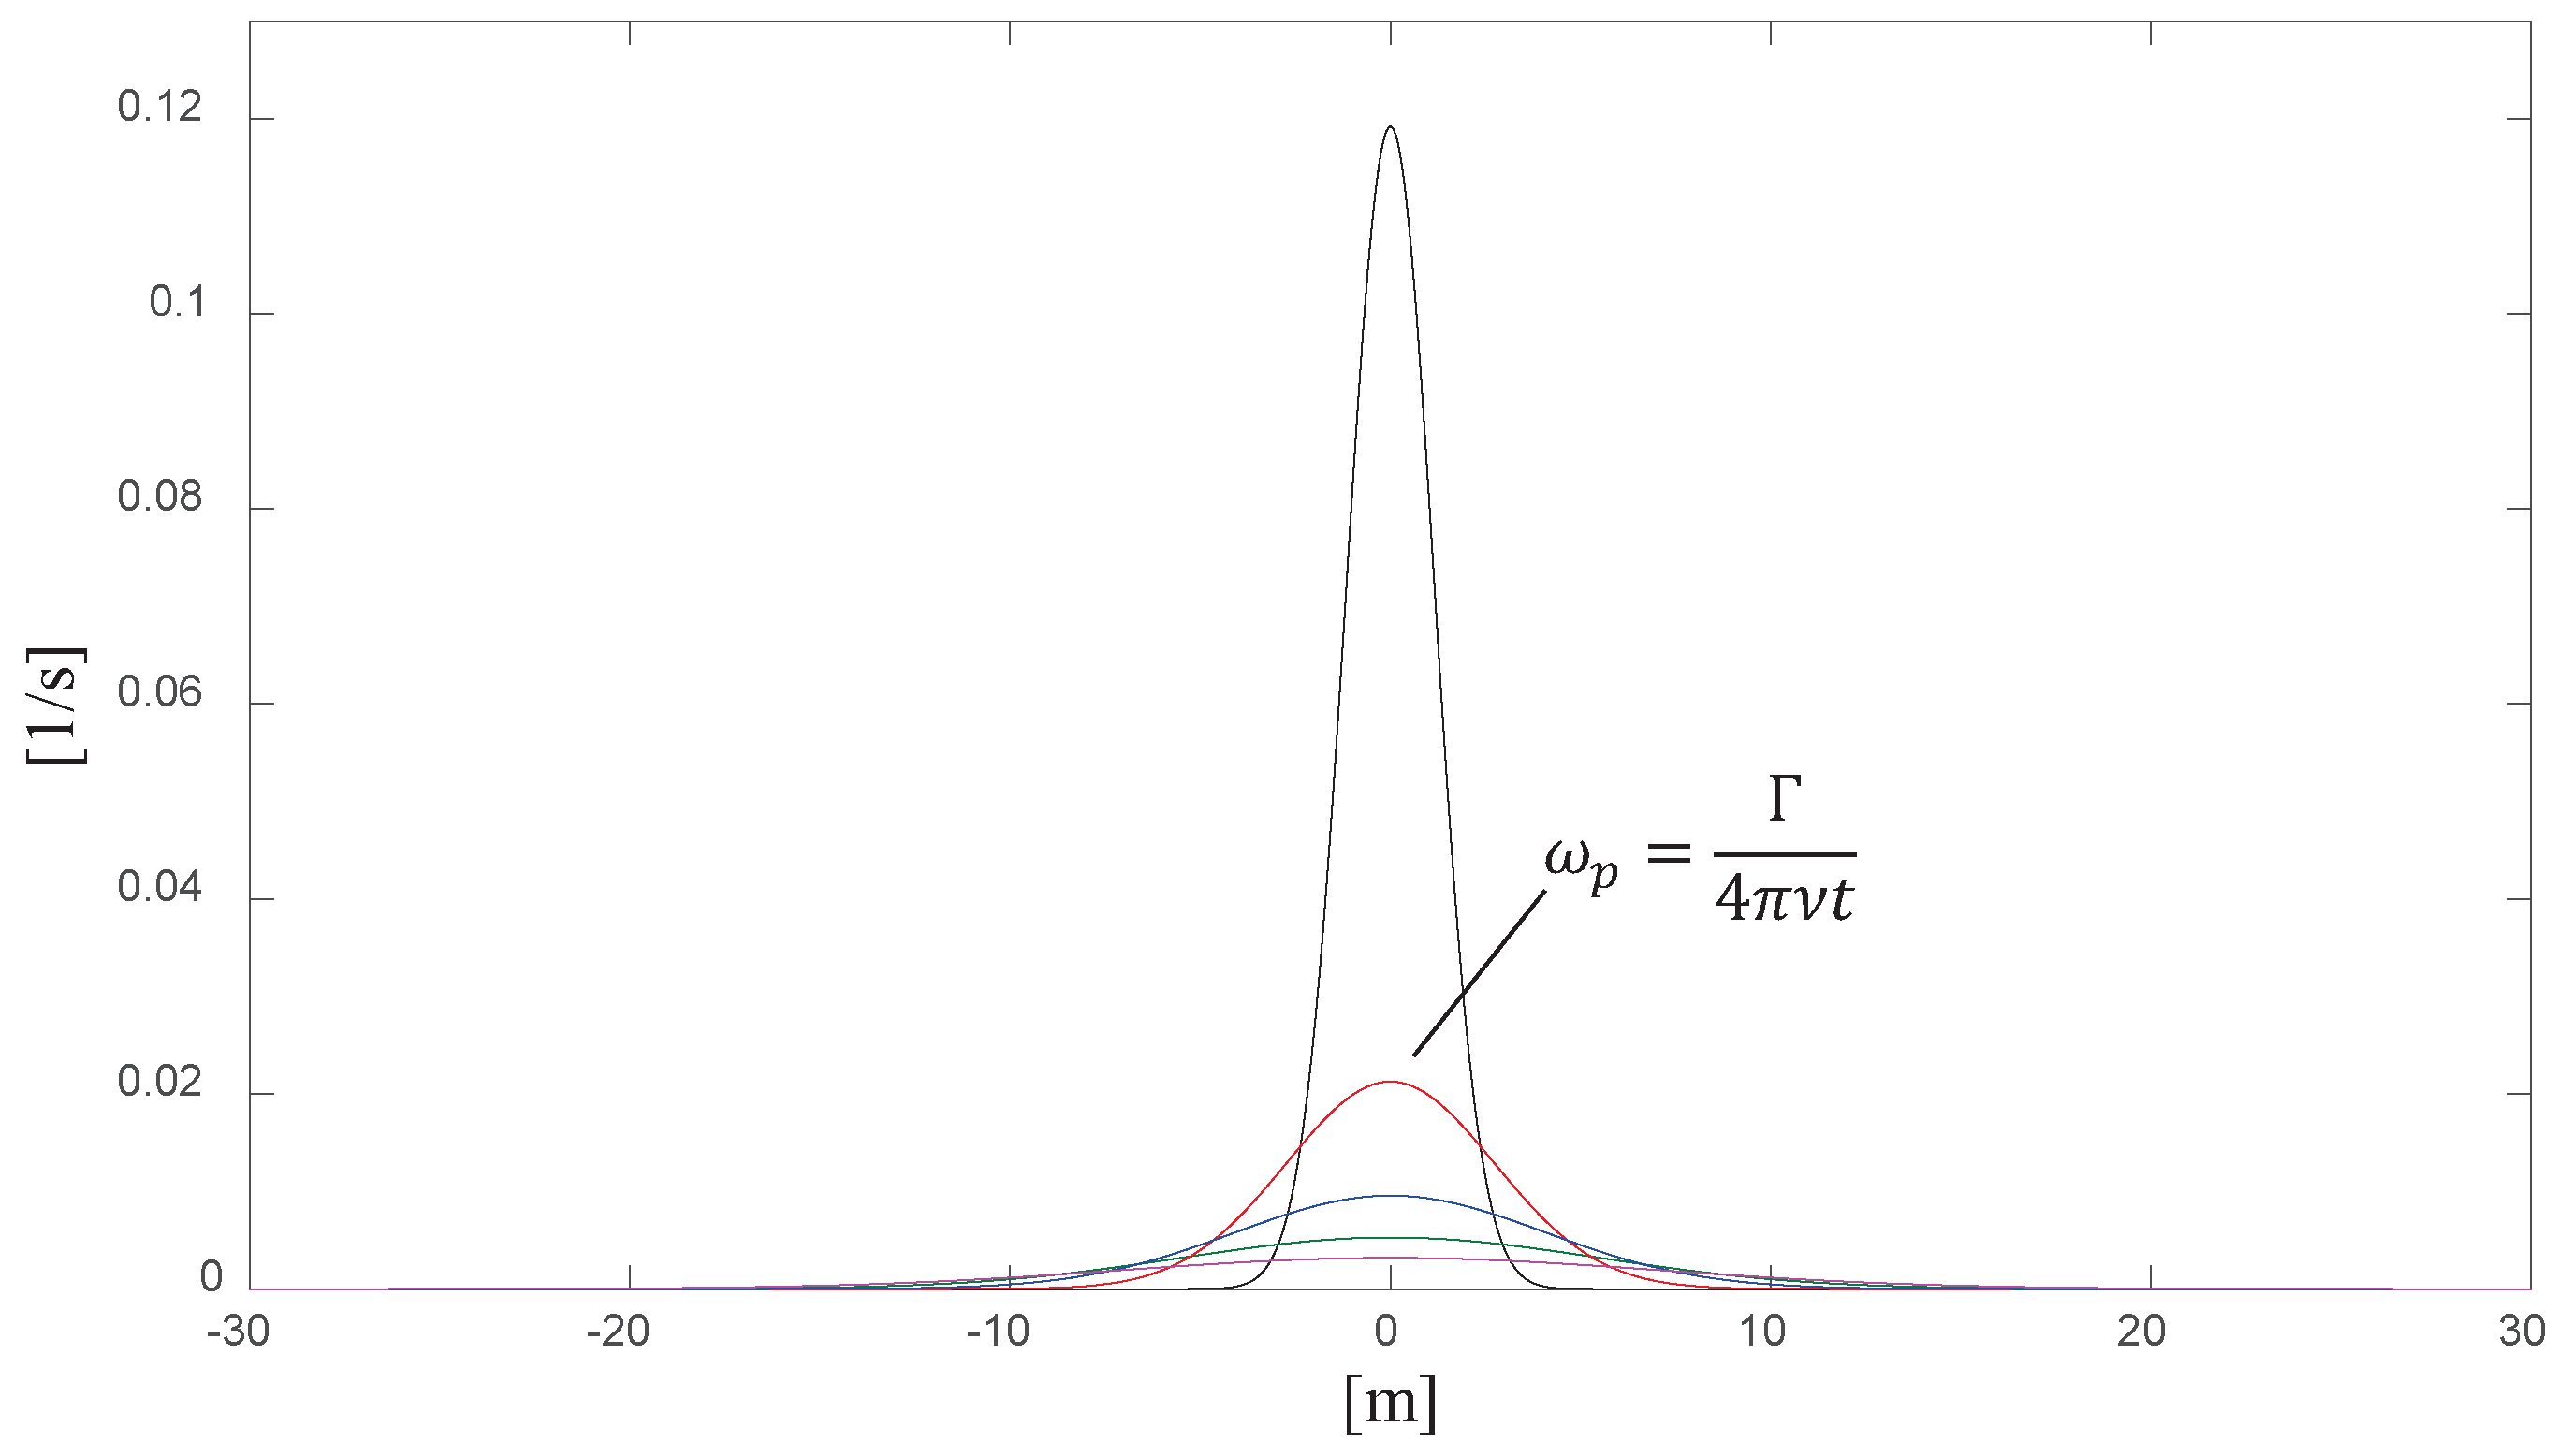
Figure 3 shows the radial vorticity distribution for a generic Gaussian vortex filament as it evolves over time. The series of curves corresponds to a progression of successive instances, showing qualitatively how the vorticity peak decreases, and the core radius increases, with time.
Figure 4 shows the corresponding radial distributions of the swirling velocity induced by the generic filament at those same progressive instances in time.
The following two key features of the Gaussian-core model enable its use for accurate representation of the underlying physics:
The Gaussian distribution of vorticity enables the representation of the natural viscous decay of the vortex filaments. This allows the freeing up of the memory from vortices that have significantly “dissipated” or “aged”.
The Guassian distribution also avoids the mutual high-speed satellization of vortex filaments in close proximity, thereby avoiding unrealistically high tangential velocities. This ensures the stability of the vortex lattice, which enables it to be extended to a large distance downstream from the rotor.
As proved in Ponta [
29] with this Gaussian distribution of vorticity, the viscous core expands due to diffusion, thereby resulting in a better representation of the vortex evolution process. Ponta [
29] also provides a comparison between the direct numerical simulation and experimental data of the effect of viscosity on the vorticity distribution and its rate of decay in a Karman vortex street behind a circular cylinder. By decomposing the incompressible velocity field in the frame of reference of the cylinder into its solenoidal and harmonic components (see also Ponta [
34] and Ponta and Aref [
35]), Ponta [
29] identifies the conditions at which a stable vortex core is reached. It is then demonstrated that, after the stability condition is achieved, the vortex cores exhibit a Gaussian profile for their vorticity distribution, and, from then on, it follows the Lamb-vortex solution.
As we shall discuss in the next section, the determination and proper modeling of the equivalent core radius , at the moment when the vortex core becomes stable, is particularly useful in the development of vortex lattice methods. This is because it ensures a realistic representation of the process of vortex filament creation and further decay, and the subsequent interaction of vortex filaments within the lattice assembly. This constitutes the basis of the GVLM technique described here.
3.1. Core Radius at the Formation of Real Vortices
From Equation (
3), it can be seen that, if the time of the creation of the vortex filament is set to zero, the Gaussian distribution of vorticity becomes a Delta function. That is, vorticity at its center is essentially a singularity, and the vortex filament represents a vortex tube of finite circulation, with infinitesimal thickness and infinite vorticity at its center. This leads to unrealistically high swirling velocities at the early vortex stages, which essentially resembles the Biot–Savart law. That is, even though the Gaussian model is still realistic in its representation of the vortex decay process and its induced velocities in later stages of the vortex’s life, this Delta distribution of vorticity in its initial stage will lead to the same unrealistically extreme velocities in the immediate vicinity of the vortex core that are observed in the Biot–Savart model. This will ultimately create the same problems of chaotic wake instability and wake pattern misrepresentation that we have discussed before.
In reality, vortices in the wake of an object do not emerge as singularities in the Biot–Savart sense. They are created by the rolling up of free shear layers [
36,
37] and the progressive homogenization of the vorticity radial distribution until a stable vortex core emerges [
34,
35]. In order to address this loophole in the Lamb-Vortex Model, the authors introduced a finite value for the equivalent core radius at the moment of creation of the
real vortex (i.e., at
). In terms of the
parameter defined in Equation (
4), this means that
This notion of
is one of the fundamental distinctions of the GVLM, and its implementations are based on an extensive series of research work performed in the past, where the process of vortex creation and shedding is analyzed in detail [
29,
34,
35]).
Ponta [
29] demonstrated that, in the context of the Lamb-Vortex Model, the notion that vortices have a finite value of the core radius
at the moment when they are created (instead of infinitesimal, as in the original Lamb formulation), is the equivalent of assuming that there exists a hypothetical time of vortex creation,
. This is, essentially, the time that it would take for a Lamb-vortex core to expand until the value of its
becomes equivalent to
.
It is important to notice that the value of
is not identical to the time taken by the actual process of vortex creation (i.e., the time during which the actual rolling up of the free shear layers occurs until a stable vortex core emerges). It is, instead, the time by which the Lamb-vortex solution should be shifted in order to properly reproduce the actual core size at which a vortex is created in the real process of the shear layer rolling up. We can obtain
in terms of Equation (
4) as
From this, we obtain an alternative expression for the value of
, now as a function of the corrected time,
, counted from the moment of creation of a
real vortex with a core of the finite radius
Then, substituting Equation (
8) into Equation (
9)
Now, substituting Equation (
10) into Equation (
6), an expression for the radial distribution of the swirling velocity induced by a
real Gaussian vortex can be obtained
In the context of wind turbine rotor analysis, we currently define
on a scaling of the thickness of the airfoil section of the blade element that corresponds to a particular vortex filament (see the discussion on vortex lattice creation in
Section 3.4). This relates the geometrical size of the vortex core with the characteristic size of the body that produces it. The scaling of
was finally calibrated by comparing the GVLM results with LiDAR measurements of the wake velocity patterns obtained at Sandia National Lab’s SWiFT facility in Lubbock, TX, for the test-case scenarios reported in Herges et al. [
38] (see also
Section 4.2). In this manner,
provides a realistic approach to the actual radius of the vortex core at the moment when the vortex-formation process is finished and the vortex is shed from the blade section.
3.2. Turbulent Diffusivity Coefficient
In addition to this unique implementation of
, there is a need to augment the molecular viscosity that appears in the formulas of the original Lamb-Vortex Model, which is defined in the context of purely laminar flow, to account for the additional diffusivity of the turbulent flow. This parameter is essentially an analog to the so-called “eddy viscosity” in typical turbulence-model implementations, such as k-
or LES, but, in this case, applied in the context of a Gaussian vortex lattice model. To this end, we introduce a parameter called the Vortex Turbulent Diffusivity coefficient,
, as a replacement for the laminar viscosity
in the original Lamb formulas (i.e., Equations (
2) through (
4)). The
coefficient controls the diffusion process, which affects both the rate of expansion of the vortex core and the rate of decay of the peak vorticity at the center of the vortex filament.
Very much akin to the k- model, it can be seen that the current Gaussian-core implementation involves two calibration parameters: the vortex filament’s equivalent core radius at the time of creation, , and the vortex turbulent diffusivity coefficient, . These parameters are based on the wind turbine blade, the operational conditions, and the inflow inputs to the model. Of particular care is the choice of since it must also consider the inflow inputs—specifically, how the inflow turbulence is introduced in the model. This can be thought to be similar to the modeled and resolved scales of turbulence for contemporary LES codes. The value of was calibrated by comparing the GVLM results with LiDAR measurements of the wake velocity patterns, in the same manner described before for .
When the
parameter described above is incorporated into Equation (
11), the magnitude of the radial distribution of the swirling velocity induced by a
real Gaussian filament in turbulent conditions becomes
Finally, when this induced velocity distribution is applied to a vortex filament of a finite length, as discussed in
Figure 2 and Equation (
1), the velocity induced by each individual filament in the lattice at a generic point P in its surroundings is given by
3.3. Vortex Transport and Stretching
The Lagrangian markers of the vortex filaments (i.e., the “nodes” of the vortex lattice), are advected through the flow field, which causes strain in the vortex filaments. The stretching (or contraction) of the vortex filaments, in turn, modifies the vortex filament core and, ultimately, the induced velocities. Since the flow is incompressible, the net circulation of any filament remains constant. In the current implementation, the vorticity is assumed to be concentrated inside a corresponding cylinder of its viscous core radius, and the length is assumed to be equal to the length of the filament. The conservation of this filament “volume” provides the change in the radius due to the change in the length of the filament. This modified core radius is then used to compute the induced velocities by the stretched vortex filaments.
The lattice nodes are advected by their local flow velocity. This velocity is the vector sum of the wind-free stream velocity (including any fluctuations present in the atmospheric flow),
, plus the velocity induced at each node by the vortex lattice assembly as a whole,
as follows
where
for each node is obtained as the result of the velocity induced at its location by the addition of the velocities induced by all of the individual filaments in the entire lattice assembly,
, as given by Equation (
13).
The advected positions of the filament nodes are obtained from the second-order explicit Adams–Bashforth (AB2) time integration:
where
and
are, respectively, the indexes of the current and the previous steps in the time-solution iterative process.
Being an “open” method, the AB2 scheme offers an acceptable trade-off between stability, accuracy, and computational cost. Hence, it is suitable for the simulation of the vortex wakes of multiple wind turbines in a wind farm.
3.4. Computation of the Circulation of Vortex Filaments and Vortex Lattice Creation
The GVLM combined with CODEF’s blade structural and rotor flow models leads to highly accurate farm simulations when compared to traditional BEM-based codes but at significantly reduced computational costs when compared to DNS/LES codes. The general approach of a vortex lattice technique involves the division of the wind turbine blade into a number of segments (commonly referred to as
blade elements) along their span (for more details, see Strickland et al. [
24] and Ponta and Jacovkis [
25]). Each blade element is represented by a
Bound vortex filament. In the context of free vortex lattice models, the use of a single Bound vortex filament is commonly accepted to adequately represent the blade-element flow field at distances equal to or greater than one chord length from the airfoil blade section, which is sufficient for the purposes of these methods.
The circulation of this Bound vortex filament,
, is obtained via the Kutta–Joukowski theorem. At each time step, the DRD-BEM provides an accurate computation of the relative velocity of the flow incident on each blade section. This provides the velocity magnitude of the incident flow and its angle of attack,
, which consequently provides the value of its aerodynamic coefficients. Using the Kutta–Joukowski theorem, we obtain
as
where
is the magnitude of the relative velocity of the incident flow for the airfoil section,
is the lift coefficient, and
c is the airfoil section chord.
In order to satisfy Helmholtz’s Theorem [
30], a
Trailing filament is created at the boundary between two blade-elements. The circulation of each Trailing filament has to be equal to the difference between the circulation of its two adjacent Bound filaments at the moment when the Trailing filament emerges. On the other hand, in order to satisfy Kelvin’s Theorem [
30], a
Shed filament emerges from each blade-element at every time step. The circulation of each Shed filament has to be equal to the difference between the circulation of its corresponding Bound filament at the current instance in time and at the previous instance.
Figure 5 shows a schematic of the construction of a vortex lattice consisting of an assembly of Bound, Shed, and Trailing filaments for a generic wind turbine blade. Following the principles stated above, the circulations of the Shed and Trailing filaments associated with the current time step
are obtained as follows:
At every time step, the induced velocity for each filament node is obtained by obtaining the induction from all of the other filaments of the vortex lattice. In this manner, a system of Shed and Trailing vortex filaments is created and advected.
This implies that as the vortex shedding process progresses, the vortex lattice extends with time. This leads to an increase in the computational time per time step. We manage this increase in several ways that will be discussed in the following subsections.
3.5. Lattice Wake Growth
In the current implementation of the GVLM, the time step of the aeroelastic solver, the DRD-BEM, and the vortex wake module, the GVLMs are different but coupled. The method retains the capability of shedding a vortex filament system at every aeroselastic time step, but such small time steps could lead to a vortex lattice with a large number of filaments. For the purpose of studying the wake of the turbine and its interaction with other turbines in the farm, such large vortex lattice ensembles are superfluous and render the method computationally prohibitive. Furthermore, the scales of the vortex dynamics phenomena of interest do not necessitate such numerous steps. Small-scale phenomena can be represented very effectively through model parameters such as , akin to the sub-grid scale modeling in LES. Hence, having different time steps effectively compartmentalizes the two different, yet closely related, aspects of the overall simulation. Currently, the vortex shedding process takes places upon completion of a certain number of DRD-BEM steps. This relationship can be implicitly or explicitly specified as inputs to the solver.
Since the GVLM is a Lagrangian method, the flow domain is essentially infinite. The lattice nodes are added to the lattice by the physical process of vortex generation itself and follow the fundamental features of the vortex wake in its evolution in a self-advecting manner, similar to a naturally adaptive mesh. This means that nodes are only added to the solution when and where they are necessary, making the vortex lattice methods extremely efficient from the computational point of view.
The choice of the maximum lattice size is a balance of the domain required for an appropriate/acceptable description of the vortex wake and the computational expense incurred. Some of the factors considered in arriving at this size limit include the age and distance downstream of the filaments at the tale of the lattice, which, after a certain level of decay, lose any influence in terms of their capacity to induce velocity and become irrelevant. At this point, those filaments can be deleted for memory and to save computational resources. The determinant factors to establish that cap are the operating conditions, including the input wind speed and level of turbulence (which affects turbulent diffusivity and, hence, the rate of vortex decay), the turbine’s operational parameters, and the relative location of the vortex wake filaments.
In the current implementation of the GVLM, the growth of the lattice is capped at a certain number of shedding events. This number can be implicitly or explicitly specified as an input, depending on the determinant factors mentioned above. Beyond this cap number, the older vortex filaments are deleted and replaced by new ones, keeping the number of data in memory constant.
5. Conclusions and Outlook for Future Work
Through the endeavor presented here, we have seen the successful integration of the Gassian-core Vortex Lattice Model (GVLM) with the high-fidelity aeroelastic routines of the DRD-BEM/GTBM modules, thereby expanding the capabilities of the CODEF multi-physics suite.
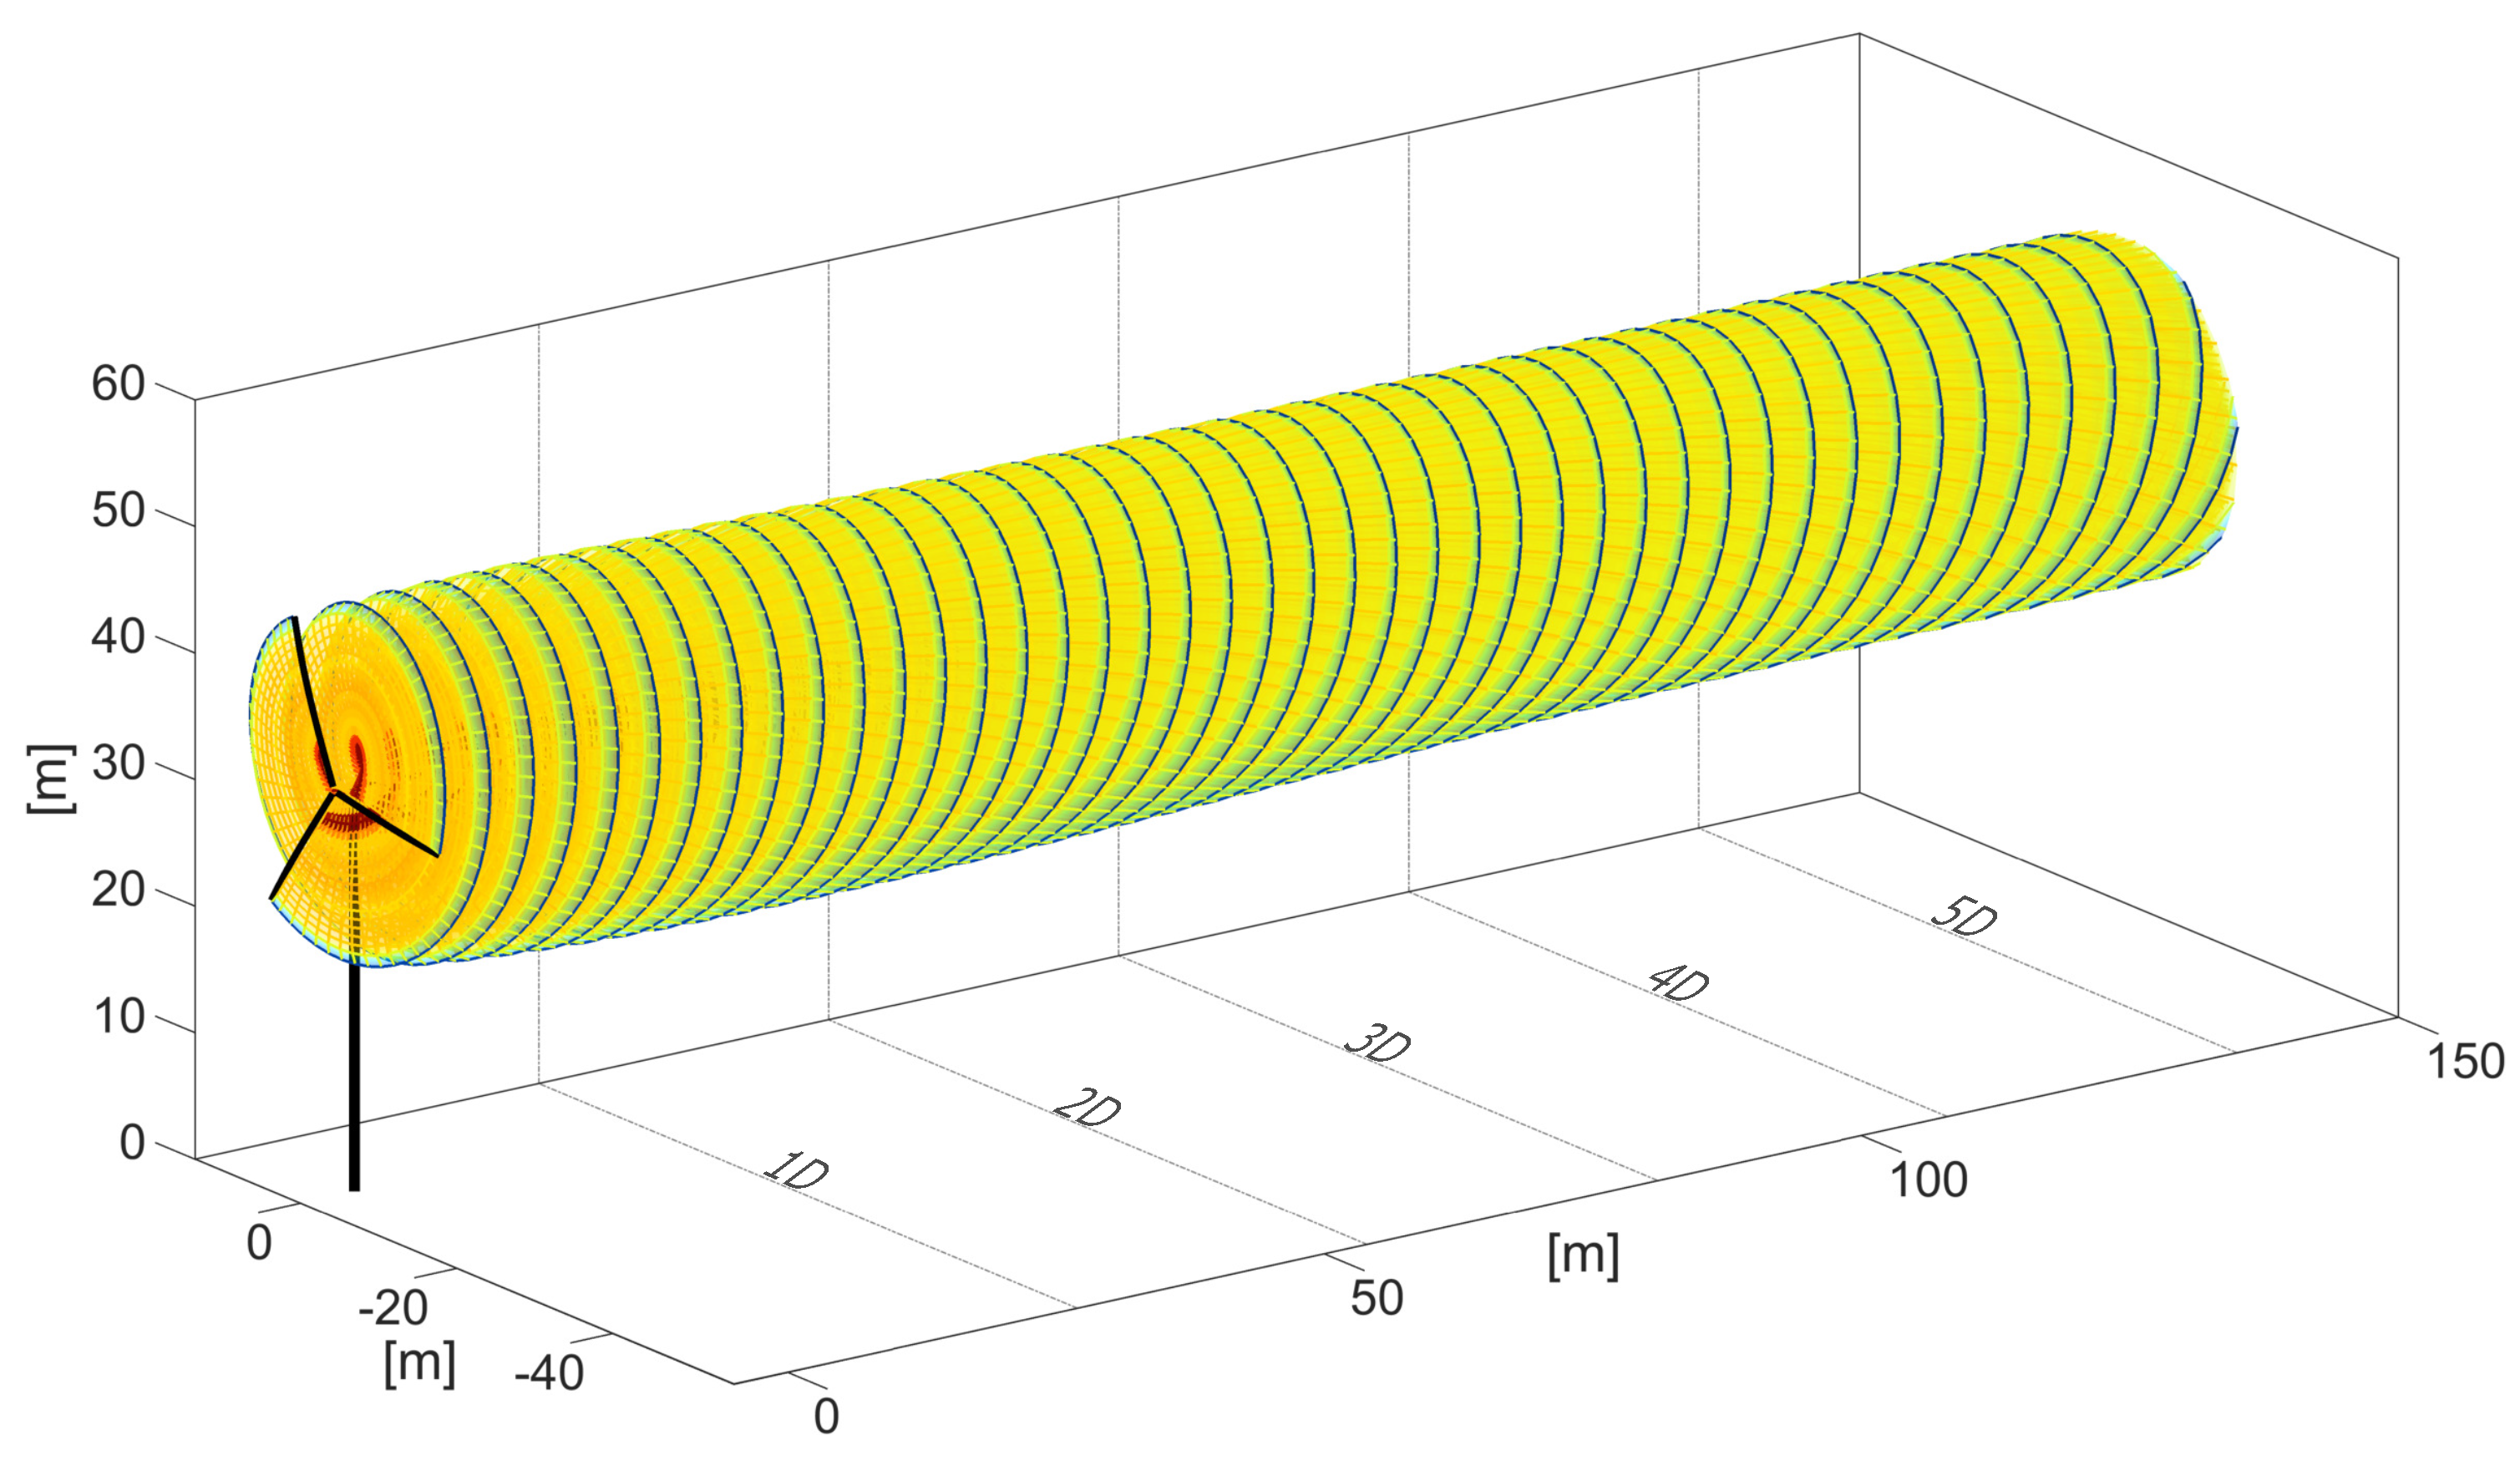
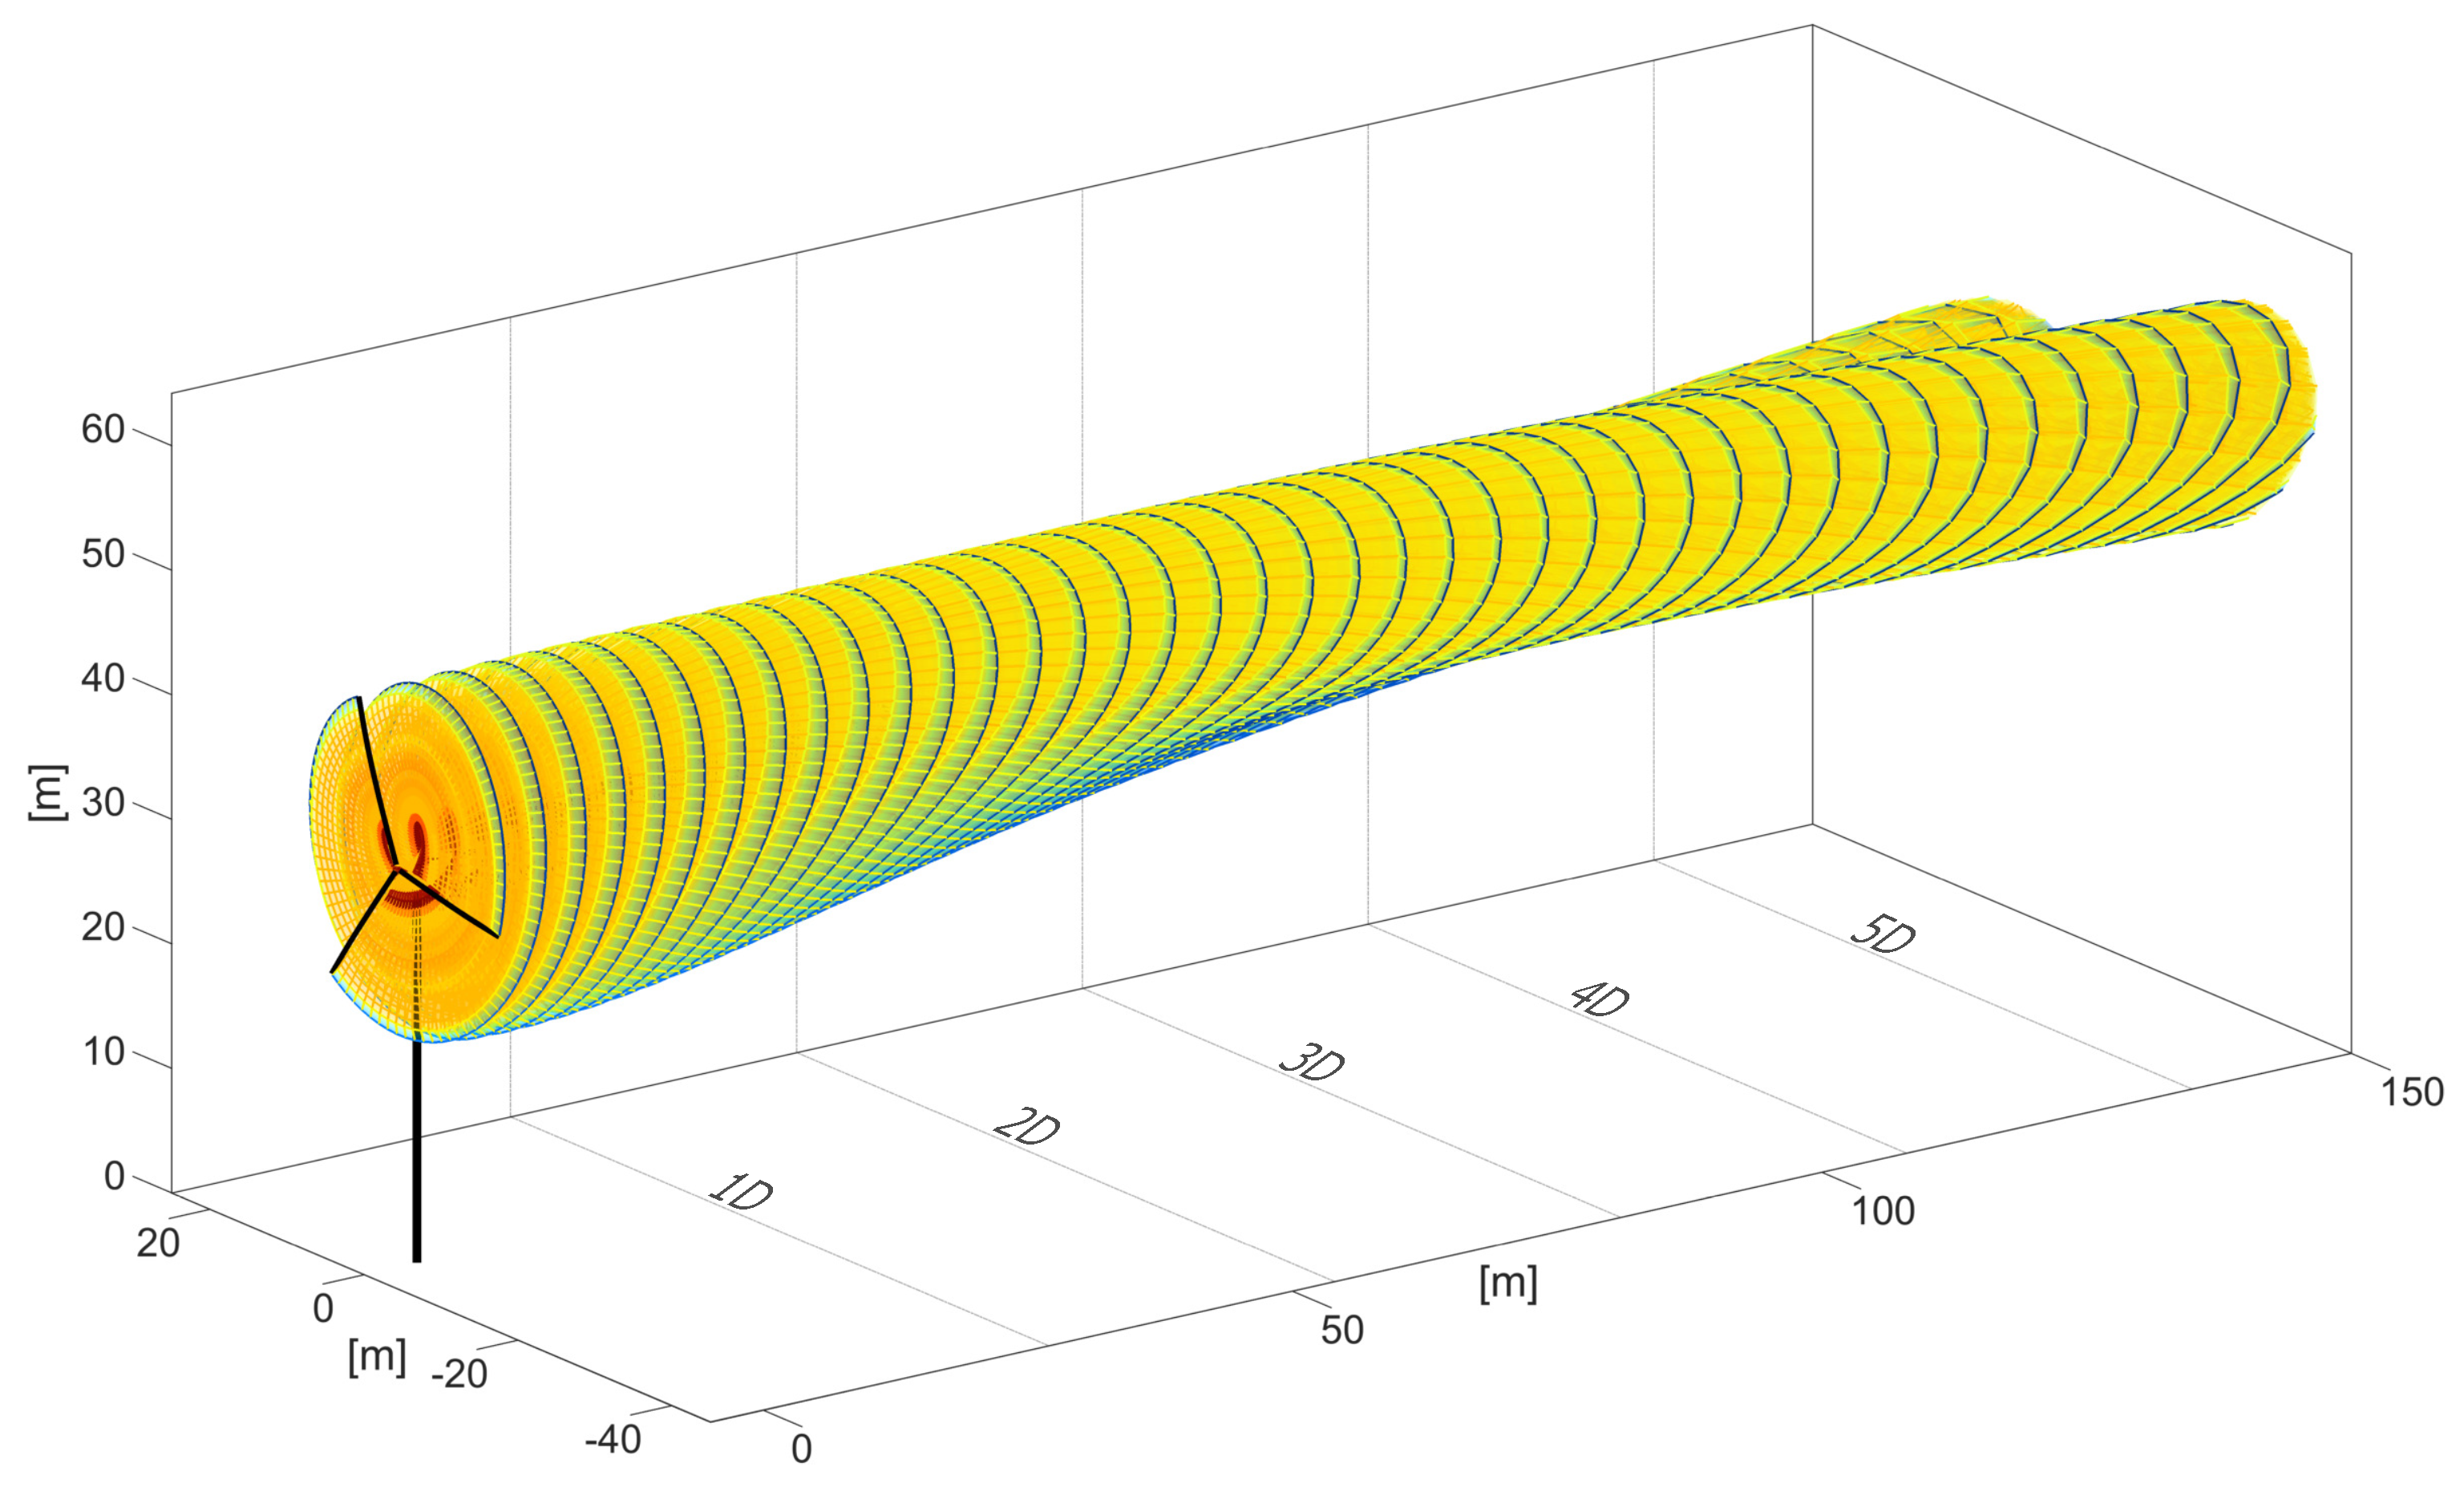
The stability of the model was demonstrated for the N5M-RWT with a vortex wake extending more than 15D downstream. This initial model validation paved the way for simulations with complex inflows and comparisons with field measurements.
The simulations of the SNL-SWiFT turbines showcase the model’s responsiveness to the varying inflow parameters. The current GVLM implementation involves the use of the same flow details obtained from the met tower (or as experienced at the turbine) to compute the propagation of every filament node of all lattices. Despite this approach, there are remarkable qualitative and quantitative similarities in terms of the magnitude of the velocity patterns and the location and shape of the spots of velocity deficit between the GVLM-computed and its LiDAR-measured counterpart. This demonstrates the GVLM’s capabilities for accurately capturing the complex evolution of the vortex wake and the highly dynamic wake-to-wake interaction. Such similarities in the absence of any spatially varying transient wind flow inputs reinforce the strength of the model and its responsiveness to the calibration parameters. Hence, even in its current form, the model can be extremely useful for quick, moderately high-fidelity engineering design stages involving wind turbine wakes.
The current model is stable to run farms comprised multiple wind turbines using computational hardware that is available at a mere fraction of the cost (human, capital, and operational) of contemporary LES without significantly compromising its fidelity/results.
The vortex wake implementation is devoid of any singularities/computational irregularities. The current model is stable to run multiple turbines in a wind farm and capture the complex turbine-to-turbine vortex wake interactions. The addition of the transient wind flow information over the entire region of a wind farm shall enable accurate quantitative comparisons with the LiDAR wake measurements. These future efforts position CODEF to be well suited for high-fidelity wind farm simulations that incorporate farm-collective and electric microgrid control strategies to optimize the overall output.
