Article

Social Vulnerability and Access to Kidney Transplantation

by
Oluwafisayo Adebiyi
1,*,
Yang Li
2,
Kathleen Lane
2,
Raza Ahsan
1,
Asif Sharfuddin
1,
Priya Yenebere
1,
Muhammad Y. Jan
1 and
Muhammad Sohail Yaqub
1
1
Division of Nephrology and Hypertension, Indiana University School of Medicine, Indianapolis, IN 46222, USA
2
Department of Biostatistics and Health Data Science, Indiana University School of Medicine, Indianapolis, IN 46222, USA
*
Author to whom correspondence should be addressed.
Kidney Dial. 2025, 5(3), 27; https://doi.org/10.3390/kidneydial5030027
Submission received: 12 March 2025 / Revised: 28 May 2025 / Accepted: 29 May 2025 / Published: 30 June 2025

Abstract

Background Socioeconomic factors significantly influence access to kidney transplantation, with socially vulnerable populations experiencing delays in receiving transplants, resulting in prolonged dialysis duration and poorer post-transplant outcomes. This study evaluates the relationship between social vulnerability and disparities in preemptive kidney transplantation using the Social Vulnerability Index (SVI), a composite measure developed by the Centers for Disease Control and Prevention (CDC). Methods Utilizing data from the Scientific Registry of Transplant Recipients (SRTR) from 2012 to 2020, we analyzed 155,424 adult kidney transplant recipients. The primary exposure was SVI, categorized into quartiles, while primary outcomes included preemptive transplant status and dialysis vintage. Multivariable regression models were adjusted for clinical covariates such as age, gender, BMI, diabetes, and peripheral vascular disease. Result Findings indicate that higher social vulnerability is significantly associated with a reduced likelihood of preemptive kidney transplantation (p < 0.0001) and an increased duration of dialysis prior to transplantation. Patients in the highest SVI quartile (0.75–1.00) were more than twice as likely to undergo dialysis before transplantation compared to those in the lowest quartile (OR = 2.21, 95% CI: 1.89–2.57). Similarly, increased SVI was strongly correlated with prolonged dialysis duration (OR = 3.43, 95% CI: 3.31–3.55, p < 0.0001). Conclusions These results highlight the impact of socioeconomic disparities on access to timely kidney transplantation. Addressing social vulnerability factors—such as poverty, education, and healthcare access—may help reduce inequities and improve transplantation outcomes. Future interventions should target high-SVI communities to facilitate earlier transplant access and reduce reliance on prolonged dialysis.

1. Background

Socioeconomic factors significantly influence health outcomes, shaping individuals’ access to medical resources and the quality of care they receive. These factors include income, education, race, ethnicity, and geographic location, which collectively impact individuals’ overall health and susceptibility to disease [1]. In kidney transplantation, socioeconomic factors are linked to significant disparities, with marginalized populations often facing barriers to timely transplants [2]. Patients from lower socioeconomic backgrounds are less likely to receive preemptive kidney transplants, contributing to longer dialysis durations and poorer outcomes post-transplant [3].
The relationship between socioeconomic factors and prolonged dialysis before transplant is well-documented. Studies indicate that longer dialysis vintage, often due to delays in transplant access, adversely affects transplant success A structured review of cohort studies found that longer dialysis duration prior to transplantation is associated with reduced graft survival and increased mortality risk [4]. Patients with over five years on dialysis face significantly higher risks of death and graft loss, underscoring the importance of timely transplant access to improve patient outcomes [5].
The Social Vulnerability Index (SVI), developed by the Centers for Disease Control and Prevention (CDC) in 2003, is a composite measure of socioeconomic vulnerability that includes factors such as SES, race, ethnicity, and geographic location [6]. This index provides a valuable framework for examining the collective impact of these socioeconomic variables on healthcare access, including preemptive kidney transplantation. By focusing on SVI, researchers can better assess the influence of social determinants on the likelihood of preemptive transplants and prolonged dialysis duration.
This study aims to evaluate socioeconomic disparities in preemptive kidney transplantation and dialysis vintage using CDC’s SVI data. Specifically, the study seeks to determine if social vulnerability, as quantified by the SVI, impacts access to preemptive transplants and is associated with extended dialysis periods before transplantation. Through this analysis, the study intends to identify the association between SVI and preemptive transplants and which SVI components are most significantly associated with SVI, and to propose strategies for enhancing equitable access to kidney transplants for vulnerable populations.

2. Methods

2.1. Study Design and Participants

The study period spanned from 1 January 2012 to 31 December 2020. This study used data from the Scientific Registry of Transplant Recipients (SRTR). The SRTR data system includes data on all donor, wait-listed candidates, and transplant recipients in the US, submitted by the members of the Organ Procurement and Transplantation Network (OPTN). Oversight of the OPTN and SRTR contractors is provided by the Health Resources and Services Administration (HRSA) of the U.S. Department of Health and Human Services [3]. This rich dataset enables an in-depth analysis of SES disparities in kidney transplantation and the impact of social vulnerability on access to transplant and post-transplant outcomes.
The study participants included were adult patients (≥18 years old) who received a single organ kidney transplant. We excluded 0.3% (n = 448) who did not provide a zip code and 1.2% (n = 1858) who were in a zip code with incalculable SVI. We excluded 0.9% (n = 1358) with questionable dialysis vintage ranging from 15 to 64 years. In those with multiple kidney transplants within the study period, only the first transplant data was used (n = 1753; 1.1%) observations were dropped). The final analyzable sample consisted of 155,424 unique transplants.

2.2. Exposure and Outcome Measures

The primary exposure variable in this study was the SVI. The SVI is a metric used to assess the susceptibility of communities to hazards and disasters. It incorporates 15 indicators that contribute to a community’s level of social vulnerability, including community percentage or value of
  • Poverty rate;
  • Population with no diploma;
  • Per capita income;
  • Single parent household;
  • No vehicle;
  • People of color;
  • More than 1 person per room;
  • Unemployment rate;
  • Population with disability;
  • No English language;
  • Age under 18;
  • Multi-unit structures;
  • Age 65 up;
  • Mobile homes;
  • In group quarters.
The data on the 15 indicators of community vulnerability were obtained from the United States Census Bureau’s American Community Survey (ACS) and were processed at the 2010 Zip Code Tabulation Area Level. All indicators are based on the 2018 definition from CDC for the purpose of the Social Vulnerability Index. Next, each indicator’s data was standardized to a common scale, ensuring comparability across different indicators. After standardization, weights were assigned to each indicator based on its relative importance in contributing to social vulnerability. Each indicator was weighted equally in determining a community’s vulnerability.
The standardized indicators were then aggregated, by summing them up based on the assigned weights, resulting in an overall social vulnerability score for each zip-code. The SVI scores range from 0 to 1 with higher scores indicating greater socioeconomic vulnerability. Communities with the highest SVI scores are the most vulnerable, while those with the lowest scores are the least vulnerable [7].

2.3. Primary Outcomes

The primary outcomes of this study were to identify associations between SVI and both the risk for prolonged dialysis vintage and the rate of access to pre-emptive kidney transplant.

2.4. Data Collection

The SRTR data provided detailed information about patients and their transplants. Demographic variables included age at transplant, gender, and race. Clinical variables included body mass index (BMI) at the time of transplant, presence of diabetes (types I, II, other, and unknown), and symptomatic peripheral vascular disease. Transplantation variables included type of donor (deceased vs. living) and year of transplant.

2.5. Statistical Analysis

Descriptive statistics, including frequencies and percentages for categorical variables and means, standard deviations, medians, and interquartile ranges for continuous variables, were calculated. SVI was treated both continuously and categorically by splitting it into four groups [0, 0.25); [0.25, 0.5); [0.5, 0.75); [0.75, 1]. Subjects were classified as having pre-emptive kidney transplant or pre-transplant dialysis, where dialysis vintage was categorized as less than 1 year, 1–3 years, and more than 3 years of dialysis. Association between SVI groups and status of pre-emptive kidney transplant was first evaluated by the Cochran–Mantel Haenszel test using each donor as a stratum. Linear mixed regression was used to compare mean SVI between subjects with pre-emptive kidney transplant versus those with pre-transplant dialysis after including donor ID as a random effect. Then, adjusted by investigator-specified covariates (risk factors that could confound the relationship between social vulnerability and the need for dialysis before transplantation including gender, BMI, age, diabetes, and peripheral vascular disease) and potential differences from distinct donors, the association was further assessed by multivariable conditional logistic regression and ordinal logistic regression, where continuous and categorical SVI were modeled separately when both considered. Odds ratios (ORs) for having status of pre-transplant dialysis and increased duration of dialysis vintage were reported with 95% confidence intervals (CIs). Diagrams of comparative boxplots and heat maps were displayed to visually represent the associations using categorical and continuous measurements, respectively. Spearman correlation coefficients were calculated between SVI and each of its 15 indicators.

2.6. Ethical Considerations

The study was conducted in compliance with ethical standards and was approved by the Indiana University Institutional Review Board (Approval code #12457, Approval Date 10 September 2021).

3. Results

3.1. Participants and Descriptive Data

The study included 155,424 adult patients (aged 18 years and older) who received a kidney transplant between 1 January 2012 and 31 December 2020 (Table 1), as recorded in the SRTR. The mean (sd) age at transplant was 52.1 (13.8) years, with a median of 54.0 years (interquartile range [IQR]: 42.0–63.0). The gender distribution of the participants showed that 39.1% were female (n = 60,777). The racial composition was predominantly White (46.8%), followed by Black or African American (26.9%) and Hispanic/Latino (17.3%). Smaller proportions include Asian (6.9%), American Indian or Alaska Native (0.9%), multi-racial (0.6%), and Native Hawaiian or Other Pacific Islander (0.4%). The mean (sd) BMI was 28.2 (5.4), with 12.0% (n = 18,425) having a BMI of 35 or higher. Additionally, 9.8% (n = 15,083) of participants had symptomatic peripheral vascular disease and 34.4% (n = 53,417) had diabetes of any type. The mean (sd) SVI was 0.67 (0.25), with a median of 0.72 (IQR: 0.47–0.89). The SVI distribution was as follows: [0, 0.25) (7.6%, n = 11,787), [0.25, 0.5) (19.7%, n = 30,638), [0.5, 0.75) (26.3%, n = 40,855), and [0.75, 1] (46.4%, n = 72,144). There were 114,046 unique donors as 82,756 donors provided kidneys to two individuals in this study.

3.2. Main Results

3.2.1. Social Vulnerability and Its Association with Preemptive Transplant Access and Dialysis History (Table 2 and Table 3)

The analysis shows a difference in mean SVI between patients receiving preemptive kidney transplants (n = 26,721; 18.2%) and those with a history of dialysis before transplant (n = 128,703; 82.8%; p < 0.0001). Patients in the preemptive transplant group had a mean SVI of 0.57 (sd = 0.26, Figure 1), while those who underwent dialysis before transplantation presented a higher mean SVI of 0.69 (sd = 0.25; Table 2).
SVI was significantly associated with the likelihood of having dialysis vintage before transplant (p < 0.0001). The proportion of patients with a history of dialysis before transplant increases across SVI categories. Among patients in the lowest SVI category [0, 0.25), 69.6% required dialysis prior to transplant, which increased to 75.4% in the [0.25, 0.5) quartile, 81.4% in the [0.5, 0.75) quartile, and 88.9% in the highest SVI category [0.75, 1] Table 3.
Conditional logistic regression analysis (Table 4) revealed that higher social vulnerability was significantly associated with increased odds of requiring dialysis before transplantation after adjusting for gender, BMI, age, diabetes status, and peripheral vascular disease status. Each 0.1 increase in SVI corresponded to 13% higher odds of dialysis versus preemptive transplant (OR = 1.13; 95% CI: 1.11–1.15; p < 0.0001). When SVI was categorized by quartiles, individuals in the highest SVI category [0.75, 1] have more than double the odds of dialysis compared to those in the lowest quartile [0, 0.25) (OR = 2.21, 95% CI: 1.89–2.57, p < 0.0001).
Table 2. Descriptive statistics of Social Vulnerability Index (SVI) by preemptive kidney transplant versus dialysis vintage history.
Dialysis VintageNMeanStd DevMinimum25th PctlMedian75th PctlMaximum
Preemptive kidney transplant26,7210.570.260.000.350.570.791.00
Pre-transplant dialysis 128,7030.690.250.000.510.750.911.00
Table 3. Descriptive statistics of preemptive kidney transplant versus pre-transplant dialysis by Social Vulnerability Index (SVI) categories.
SVI[0, 0.25)
(n = 11,787)
[0.25, 0.5)
(n = 30,638)
[0.5, 0.75)
(n = 40,855)
[0.5, 0.75)
(n = 72,144)
Total
(n = 155,424)
Preemptive Kidney
transplant
3581 (30.4%)7536 (24.6%)7599 (18.6%)8085 (11.1%)26,721
Pre-transplant
Dialysis
8206 (69.6%)23,102 (75.4%)33,256 (81.4%)64,139 (88.9%)128,703
Table 4. Results from multivariable conditional logistic regression models of Social Vulnerability Index (SVI, both continuously and categorically) on pre-transplant dialysis vs. preemptive transplant clustered by Donor_id and adjusted for pre-selected covariates (n = 152,728).
Model #Independent VariableOdds Ratio95% CIp-Value
1BMI ≥ 351.261.11–1.420.0002
1Patient/s Gender M vs. F1.701.57–1.84<0.0001
1Age at transplant (yrs)0.970.97–0.97<0.0001
1Symptomatic peripheral vascular disease1.531.32–1.76<0.0001
1Candidate had diabetes of any type1.721.58–1.88<0.0001
1Social Vulnerability Index (0–1) per 0.1 increase1.131.11–1.15<0.0001
2BMI ≥ 351.261.12–1.420.0002
2Patient/s Gender M vs. F1.691.56–1.83<0.0001
2Age at transplant (yrs)0.970.97–0.97<0.0001
2Symptomatic peripheral vascular disease1.531.32–1.76<0.0001
2Candidate had diabetes of any type1.711.57–1.87<0.0001
2Social Vulnerability Index 4 groups-overall <0.0001
2Social Vulnerability Index:
[0.75, 1] vs. [0, 0.25)
2.231.91–2.60<0.0001
2Social Vulnerability Index:
[0.5, 0.75) vs. [0, 0.25)
1.491.27–1.74<0.0001
2Social Vulnerability Index: [0.25, 0.5) vs. [0, 0.25)1.181.00–1.390.0479

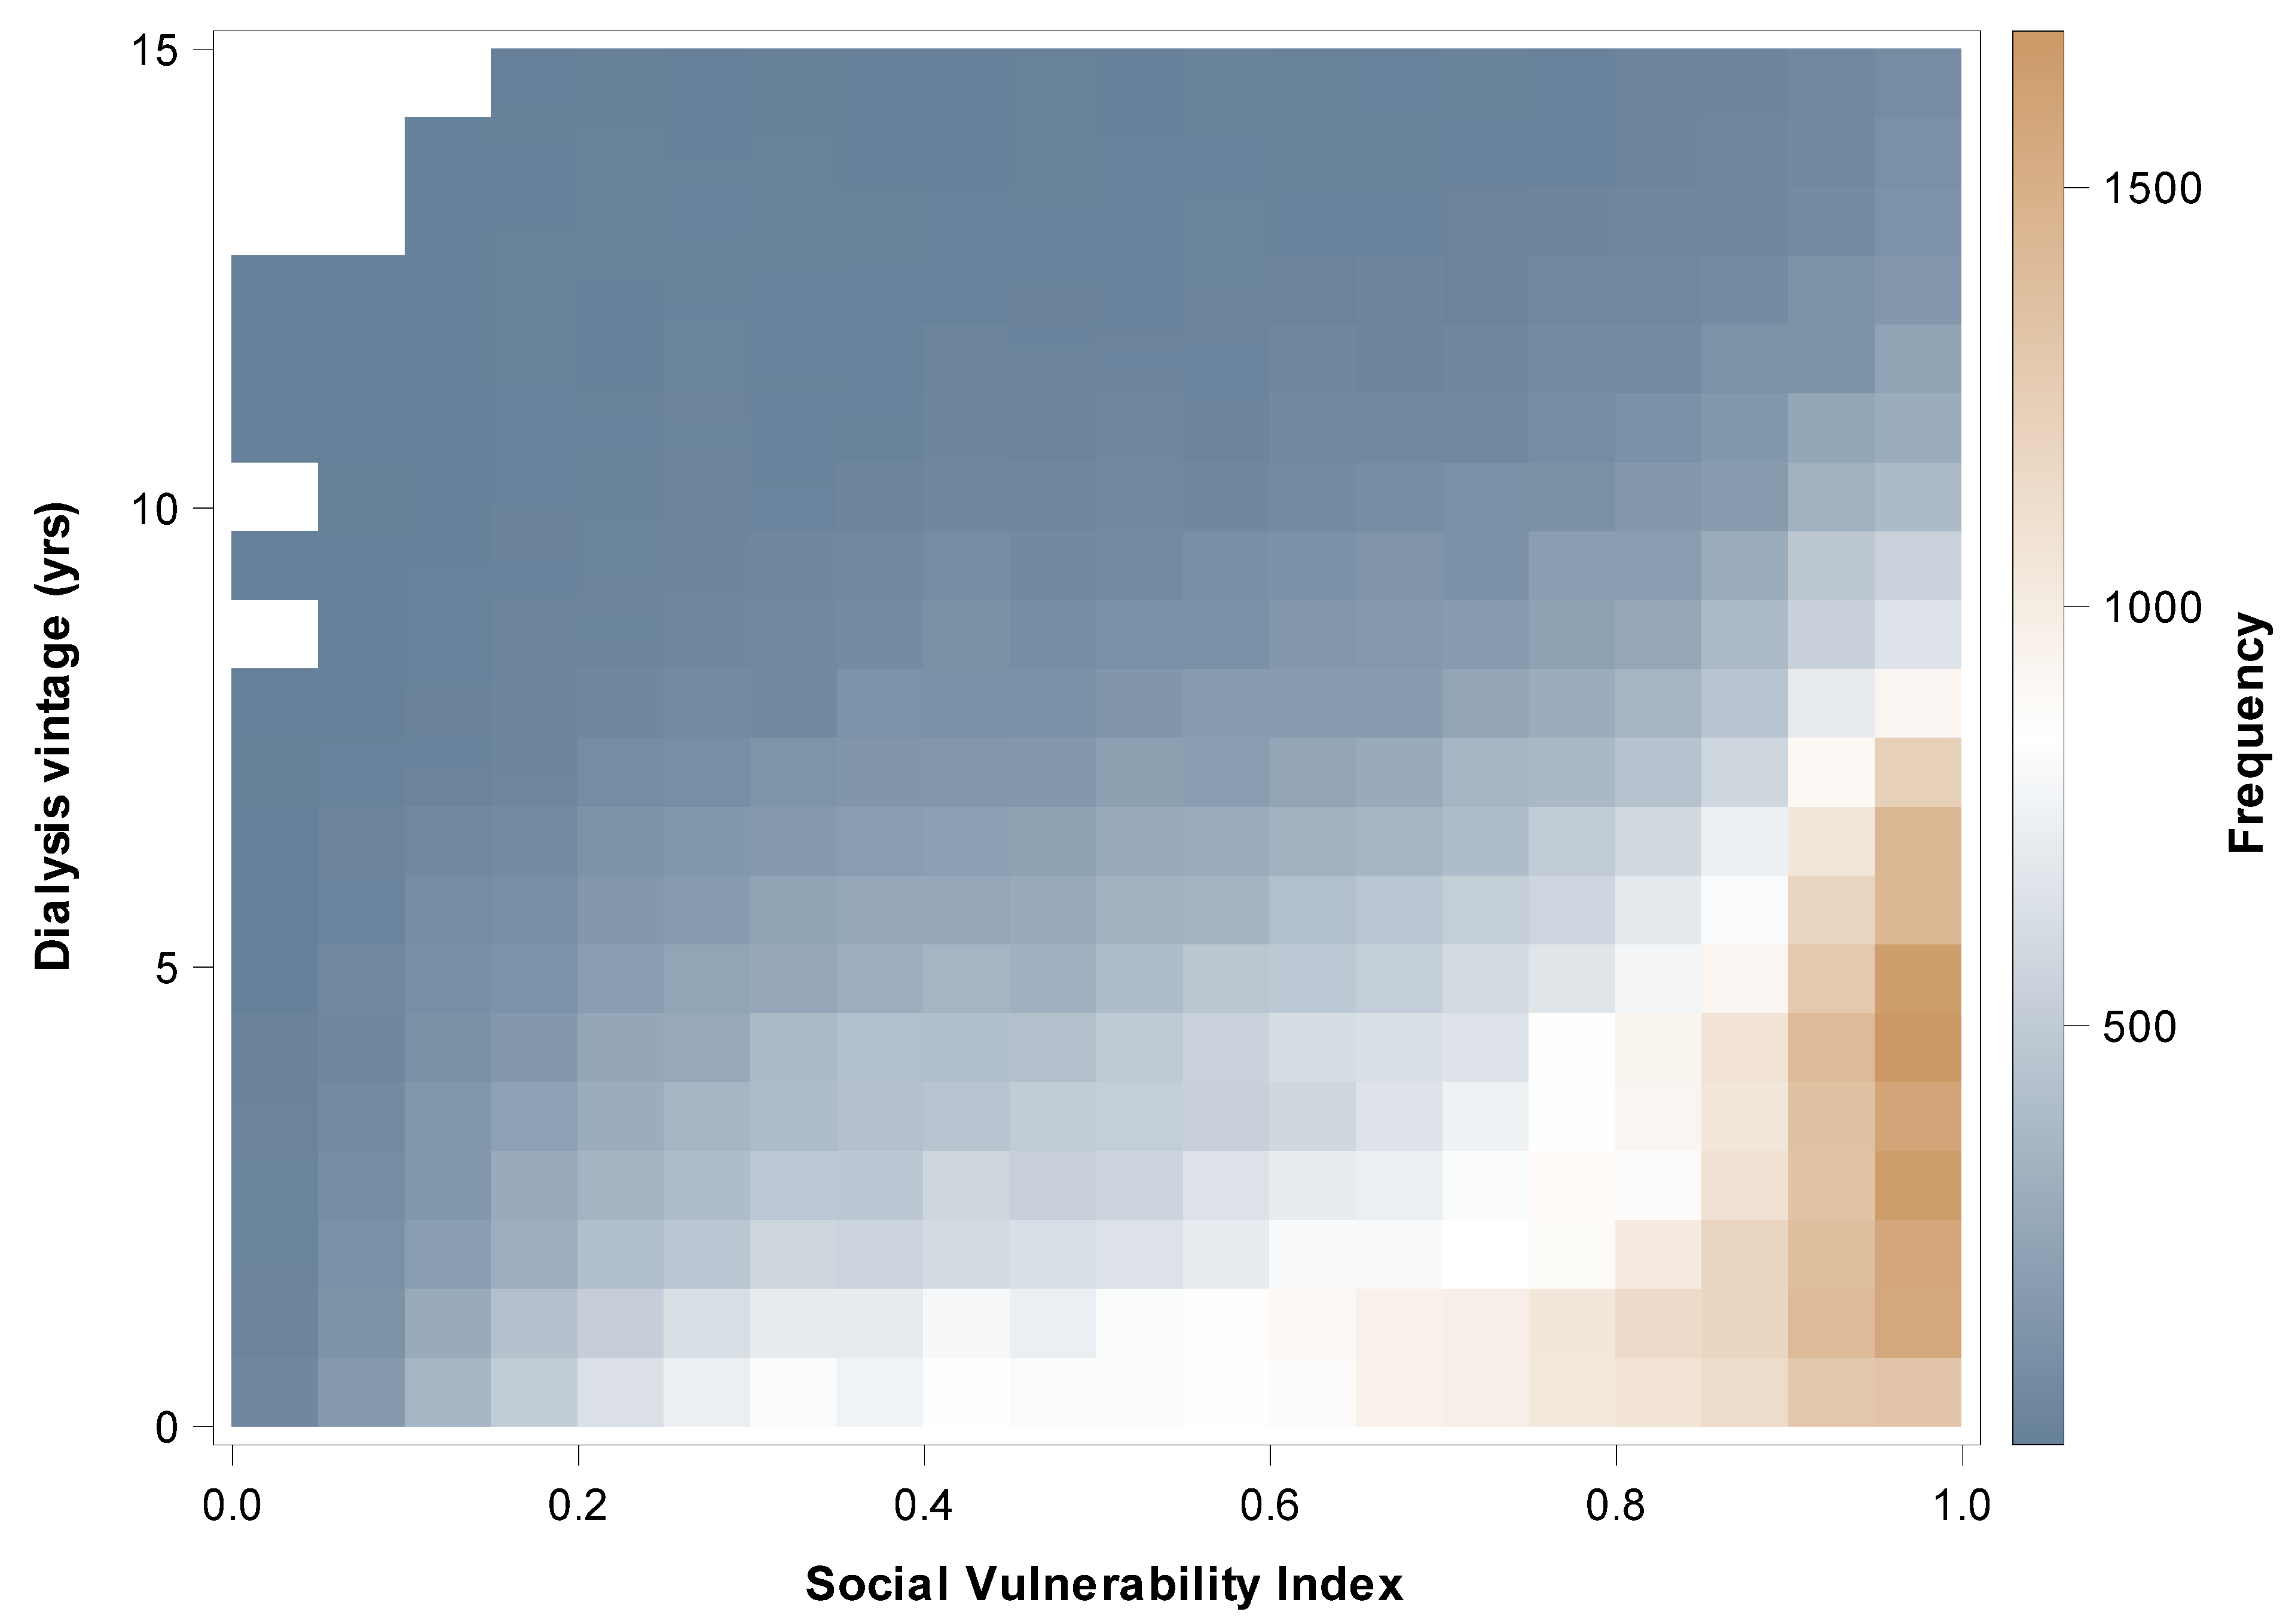
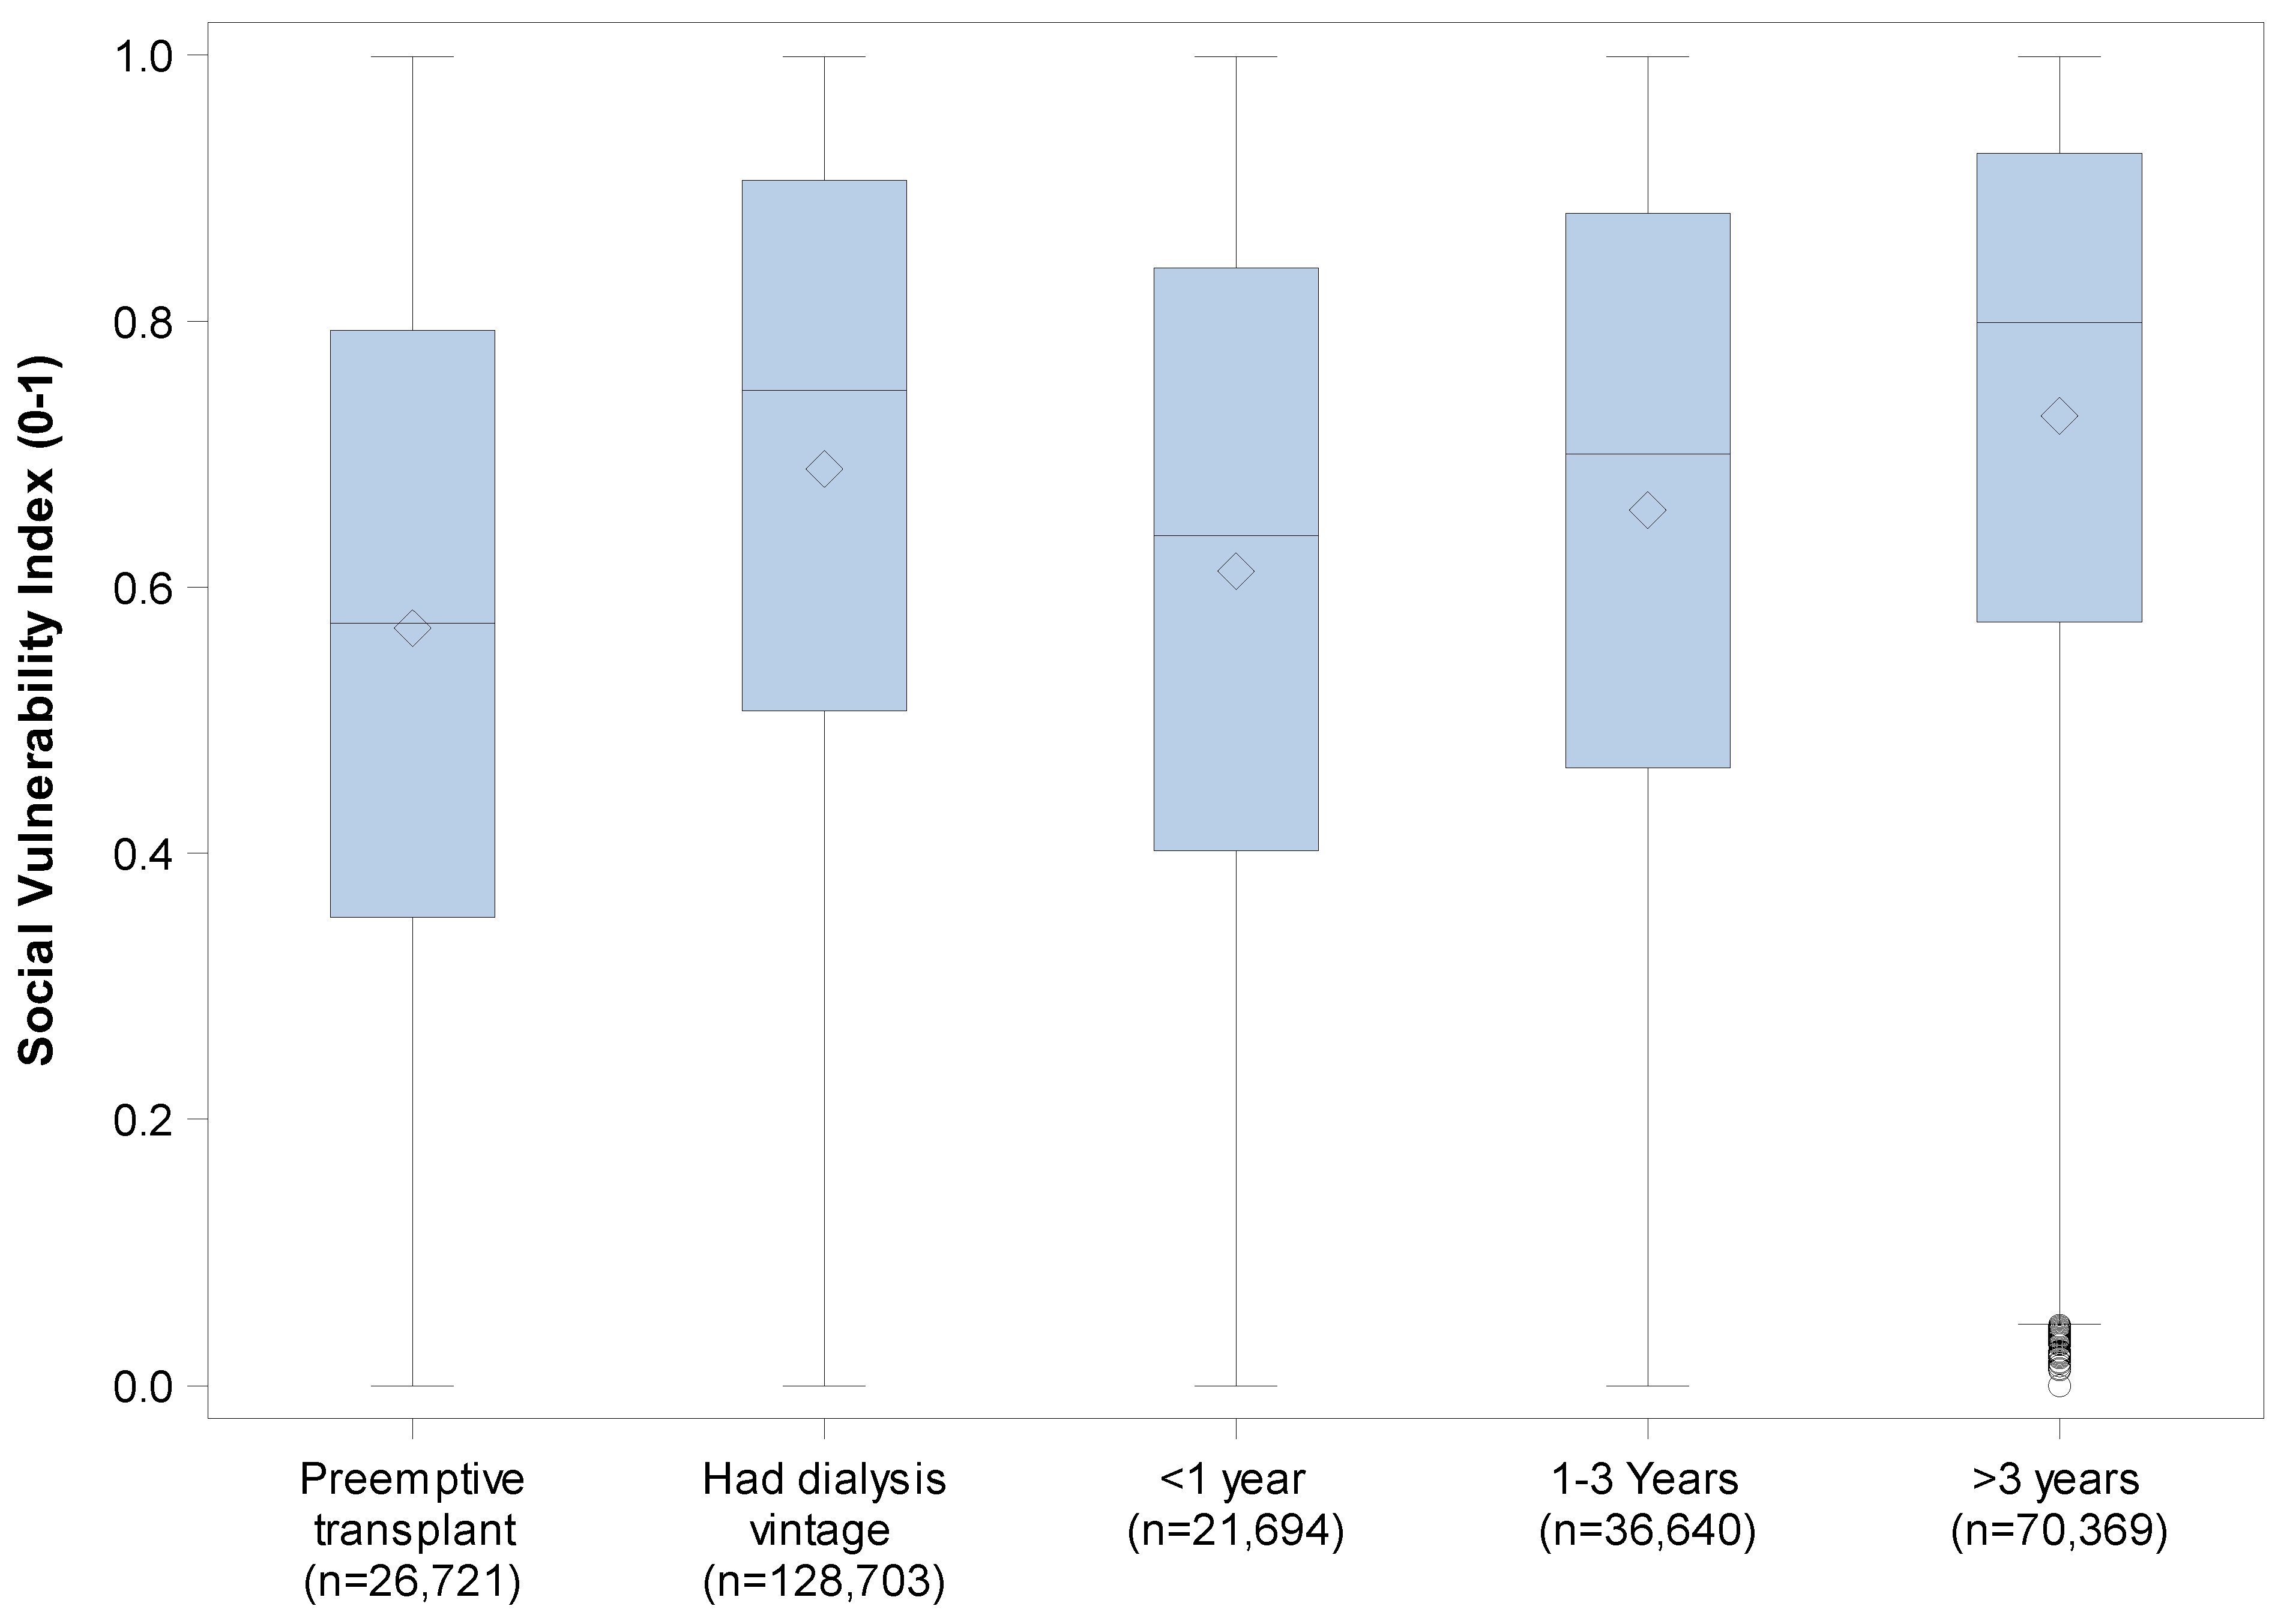
3.2.2. Pre-Transplant Dialysis Duration and SVI (Table 5, Table 6 and Table 7, Figure 1 and Figure 2)

In those subjects with pre-transplant dialysis history (dialysis vintage), the descriptive statistics in Table 5 showed that patients with longer dialysis vintage had higher mean SVI scores, and such association was confirmed to be significant by repeated-measure multinomial logistic regression for higher SVI categories (p < 0.0001). For those with less than one year on dialysis (n = 21,694), the mean SVI was 0.61, while patients with 1–3 years on dialysis (n = 36,640) had a mean SVI of 0.66. In the group with more than three years on dialysis (n = 70,369), the mean SVI increases to 0.73. Median SVI scores also rise with dialysis vintage, from 0.64 in the shortest vintage group to 0.80 in the longest (Figure 1).
Table 5. Descriptive statistics of Social Vulnerability Index (SVI) by duration of dialysis vintage categories (n = 128,703).
Dialysis VintageNMeanStd DevMinimum25th PctlMedian75th PctlMaximum
<1 year21,6940.610.260.000.400.640.841.00
1–3 Years36,6400.660.250.000.460.700.881.00
>3 years70,3690.730.230.000.570.800.931.00
Table 6. Descriptive Statistics of Years of dialysis vintage by Social Vulnerability Index (SVI) categories (n = 128,703).
Social Vulnerability Index Four GroupsNMeanStd DevMinimum25th PctlMedian75th PctlMaximum
[0, 0.25)82062.842.520.000.892.204.1314.93
[0.25, 0.5)23,1023.252.700.001.102.624.7114.98
[0.5, 0.75)33,2563.662.840.001.373.075.3015.00
[0.75, 1]64,1394.463.070.001.984.036.3815.00
Table 7. Results from multivariable ordinal logistic regression on increased duration * of dialysis vintage by Social Vulnerability Index (SVI) clustered by Donor_id and adjusted for pre-selected covariates * (n = 152,728).
Independent VariableOdds Ratio95% CIp-Value
SVI: [0.75, 1] vs. [0, 0.25)3.433.31–3.55<0.0001
SVI: [0.5, 0.75) vs. [0, 0.25)1.941.87–2.02<0.0001
SVI: [0.25, 0.5) vs. [0, 0.25)1.371.32–1.43<0.0001
BMI ≥ 351.221.18–1.26<0.0001
Male vs. Female1.201.17–1.22<0.0001
Age at transplant (yrs)0.9990.998–1.00000.0130
Symptomatic peripheral vascular disease1.201.16–1.24<0.0001
Candidate had diabetes of any type1.271.24–1.30<0.0001
* Duration of dialysis vintage had four levels: 0 years meaning had preemptive kidney transplant was the reference, <1 year, 1–3 years, and >3 years.
Figure 2. Association between Social Vulnerability Index (SVI) and dialysis vintage duration in those with dialysis vintage (n = 128,703).
Kidneydial 05 00027 g002
Table 6 presents SVI categories in relation to years on dialysis. Patients in the lowest SVI category [0, 0.25) showed an average dialysis duration of 2.84 years (median = 2.20 years), while those in the highest quartile [0.75, 1] had an average duration of 4.46 years (median = 4.03 years). The maximum dialysis duration across all groups reached 15 years, with the highest SVI category having the longest dialysis times.
Figure 2 is the heatmap showing the association between SVI and dialysis vintage among patients with pre-transplant dialysis. While patients with low SVI have low frequencies of pre-transplant dialysis, and their frequencies of receiving prolonged pre-transplant dialysis were in general lower, a notable cluster of patients with high SVI values experience pre-transplant dialysis, and their frequencies receiving 5–10 years’ pre-transplant dialysis, were denser than those with low SVIs. This pattern presents a visual trend for ranges of pre-transplant dialysis vintage across patients with varied social vulnerability.
The multivariable ordinal logistic regression model indicates significantly higher odds for patients with higher SVI to undergo increased dialysis vintage to pre-transplant, after adjusting for age, gender, BMI, diabetes, and peripheral vascular disease (Table 7). Using the lowest [0, 0.25) SVI category as the reference, individuals in the second quartile [0.25, 0.5) have 1.37 times the odds of prolonged dialysis (95% CI: 1.32–1.43, p < 0.0001). The odds increase in the [0.5, 0.75) SVI category to 1.94 (95% CI: 1.87–2.02, p < 0.0001). In the highest [0.75, 1] SVI category, individuals have over three times the odds of extended dialysis compared to those in the lowest SVI category (OR = 3.43, 95% CI: 3.31–3.55, p < 0.0001).

3.2.3. Spearman Correlation Coefficients Between 15 Indicators and SVI (Table 8)

Spearman correlation analysis assessed the strengths of associations between various socioeconomic indicators and SVI. For positive associations, the poverty rate showed the strongest positive correlation with SVI (ρ = 0.89), followed by the population with no diploma (ρ = 0.84) and single-parent households (ρ = 0.79). In contrast, per capita income had a strong negative correlation with SVI (ρ = −0.80).
Table 8. Spearman Correlation Coefficients between Each of the 15 Socio-economic Indicators and Social Vulnerability Index (SVI).
ItemNRho
Poverty rate %155,3830.89
Population with no diploma %155,3940.84
Per capita income155.367−0.80
Single parent households %133.3500.79
No vehicle %155.3710.70
People of color %155,3960.65
More than one person per room %155,3710.64
Unemployment rate155,3700.64
Population with disability %155,3890.50
No English language %155,3960.46
Age under 18%155,3960.24
Multi unit structures %155,3820.22
Age 65 up %155,396−0.20
Mobile homes %155,3820.16
In group quarters %155,3960.14

4. Discussion

This study examined the impact of social vulnerability, as measured by the CDC’s Social Vulnerability Index (SVI), on preemptive kidney transplantation and dialysis vintage among kidney transplant recipients. Patients with higher social vulnerability are less likely to receive preemptive transplants and more likely to undergo pre-transplant dialysis compared to those with lower vulnerability [4,8].

4.1. Socioeconomic Factors and Access to Kidney Transplant

Socioeconomic factors have been widely studied in relation to transplant outcomes. Our study’s findings align with and expand upon prior research that highlights the significant impact of socioeconomic factors on access to kidney transplantation. Lower socioeconomic status—measured by income, education, and insurance coverage—has been shown to negatively influence kidney transplant eligibility and outcomes [2]. For instance, a study demonstrated that disparities in socioeconomic status contribute to substantial variations in transplant waitlisting and receipt of transplants across different demographic groups [2]. Similarly, patients from lower-income households and underrepresented racial groups experience greater challenges in accessing transplant services [9].
Our research supports these findings by showing that the Social Vulnerability Index (SVI), which integrates multiple socioeconomic indicators, provides a more comprehensive measure of social determinants affecting transplant access [8,10]. By capturing broader socioeconomic vulnerabilities beyond just income and insurance coverage, the SVI offers a more nuanced understanding of how social determinants collectively impact healthcare access and kidney transplant disparities.

4.2. Benefits of Using the Social Vulnerability Index (SVI) Compared to Other Indices

The SVI is a robust tool that surpasses traditional socioeconomic status (SES) indices, the Area Deprivation Index (ADI), and the Health Disparities Index (HDI) in measuring social vulnerability. While SES indices typically assess income and education levels, the SVI incorporates 15 indicators, including income, education, housing stability, and racial demographics, offering a broader and more detailed view of a community’s vulnerability [8,11]. The ADI, although useful, primarily measures area-level deprivation through factors like income, employment, education, and housing quality [12]. Similarly, the HDI focuses on health-related disparities, such as mortality rates, disease prevalence, and access to healthcare services. Unlike these indices, the SVI includes additional critical factors such as household composition, minority status, language, housing type, and transportation, which provide deeper insights into healthcare access disparities [6].
Current research indicates that the SVI has been effectively used to identify disparities in access to kidney transplantation and other organ transplants, such as liver, heart, and lung. Studies have shown that patients from high social vulnerability areas, as measured by the SVI, experience lower rates of preemptive kidney transplantation and longer dialysis vintage, leading to poorer transplant outcomes [10]. For example, a study demonstrated that patients from high-vulnerability areas had lower rates of liver transplantation and higher post-transplant mortality rates [13]. These findings reinforce the SVI’s value in identifying and mitigating social vulnerabilities that hinder equitable healthcare access [10].

4.3. Key Indicators Within the SVI and Access to Kidney Transplant

Key indicators of the SVI significantly influence access to kidney transplantation and dialysis duration. Our study assessed the relationship between SVI and pre-transplant dialysis, ranking the most significant socioeconomic contributors to social vulnerability. Our findings revealed that poverty rate ranked highest among the contributors to SVI, underscoring that individuals in impoverished areas face substantial barriers to accessing kidney transplants [6]. These barriers include financial constraints that limit access to medical care, transportation, and necessary healthcare referrals [1].
Education level also plays a critical role, as individuals without a diploma often struggle with health literacy, making it more challenging to navigate the complex transplant referral process [4]. Lower per capita income further reinforces economic challenges, as financial limitations reduce access to high-quality healthcare and timely transplant evaluations [2]. Additionally, single-parent households often experience difficulties balancing caregiving responsibilities with seeking medical care, leading to delays in referrals and transplant access [6].
Limited access to transportation, as indicated by households without a vehicle, can hinder regular medical visits and delay transplant evaluations, further reducing referral rates [6,14]. The proportion of people of color within the SVI framework reflects systemic racial disparities and healthcare biases, which adversely impact minority groups’ referral rates and access to transplants [15]. Other significant factors include overcrowded living conditions, which increase exposure to infections and stress, potentially affecting transplant eligibility and post-transplant recovery [10]. Finally, high unemployment rates contribute to unstable health insurance coverage and financial insecurity, further restricting access to medical treatment and transplant referrals [6].
These findings demonstrate that poverty, education, low income, single parenthood, lack of transportation, racial demographics, overcrowding, and unemployment are the most influential socioeconomic factors affecting kidney transplant access. Addressing these factors is crucial for reducing prolonged dialysis duration and improving equitable transplant opportunities.

4.4. Use of SVI and Suggested Target Interventions for Improving Access to Kidney Transplant

In recent years, several initiatives have sought to mitigate the socioeconomic barriers affecting pre-transplant access to kidney transplantation. Expanding Medicaid coverage, implementing community-based health programs, and increasing patient education have been instrumental in reducing disparities [16]. Programs providing transportation assistance and financial support for low-income patients have significantly improved access to transplant evaluations and procedures [16].
One key strategy involves targeted outreach in high-vulnerability communities to raise awareness and facilitate pre-transplant access [16]. Mobile health clinics, community health fairs, and collaborations with local organizations can enhance patient education and provide on-site evaluations. Additionally, increasing funding for community health worker programs can help vulnerable patients navigate the healthcare system by assisting with scheduling, transportation, and adherence to medical regimens [16].
Policymakers should also prioritize reducing systemic biases in healthcare through mandatory anti-racism training for healthcare providers. This can enhance cultural competency and minimize implicit biases in clinical decision-making [17,18]. Increasing minority representation in medical professions can further build trust within communities and ensure that healthcare providers are attuned to the unique challenges faced by underrepresented populations.
Integrating SVI data into healthcare planning and policy development is crucial for targeted resource allocation [16]. Healthcare systems can use SVI data to prioritize funding for infrastructure improvements, such as establishing healthcare facilities in underserved areas and expanding telehealth services for remote populations [10].
Developing financial assistance programs specifically for pre-transplant evaluations can also alleviate economic burdens. These programs should cover costs related to medical tests, travel expenses, and transplant-related evaluations [16]. Additionally, advocating for job protection policies and caregiver support programs can help families manage the financial and logistical burdens of the pre-transplant process.
By expanding current efforts and implementing these data-driven strategies, significant progress can be made toward achieving equitable pre-transplant access to kidney transplantation, ultimately improving patient outcomes and saving lives [16].

4.5. The Uniqueness of Our Study

Our study stands out due to its comprehensive integration of the SVI and its significance in kidney transplant outcomes. While previous studies have assessed the impact of individual socioeconomic factors—such as income, education, and insurance status—on transplant access [2], our research uniquely incorporates all 15 SVI indicators, offering a holistic assessment of social vulnerability in kidney transplantation.
Unlike studies that rely on single factor measures or generalized deprivation indices like the ADI or the HDI [10], our study leverages the SVI to capture the complex interplay of multiple social determinants. This approach provides a more nuanced understanding of how poverty, education, race, language barriers, transportation access, and neighborhood conditions collectively shape transplant access and outcomes [8].
A key finding of our study is that higher SVI, which is much pronounced by its highly correlated components, is significantly associated with pre-transplant dialysis. This is probably a reflection that these components such as poverty rate and education level have strong correlations with disparities in kidney transplant access. For reference, prior research has shown that low-income individuals and those with limited education experience delays in referral and transplant evaluation, leading to prolonged dialysis and poorer post-transplant outcomes [1].
Additionally, while previous research has focused primarily on waitlisting disparities [11,19,20], our study goes further by directly evaluating preemptive transplantation, which is critical for improving long-term graft survival and reducing mortality [7]. By emphasizing preemptive transplant disparities, our study highlights an area where intervention strategies can have an immediate and profound impact on patient outcomes.
Furthermore, our findings underscore the importance of geospatial analyses using SVI data to identify high-risk communities where targeted policy changes and healthcare interventions can be implemented. This data-driven approach is particularly valuable for policymakers and healthcare providers aiming to reduce social inequities in transplant access [6].
By building on the foundation laid by previous research, our study advocates for a shift from isolated socioeconomic assessments to a multifaceted, index-based evaluation, paving the way for more effective, targeted interventions in kidney transplantation [16].

4.6. Study Limitations

Despite its strengths, our study has several limitations that warrant consideration.
First, the retrospective cohort design inherently limits the ability to establish causality between social vulnerability and access to kidney transplantation. While we observed significant associations between higher SVI scores and lower access to preemptive kidney transplant, causal relationships cannot be definitively inferred due to potential unmeasured confounders.
Second, while the Social Vulnerability Index (SVI) is a comprehensive measure of socioeconomic status (SES) and related factors, it may not fully capture all dimensions of social vulnerability relevant to health outcomes. For instance, factors such as trust in the healthcare system, provider biases, and cultural perceptions of transplantation may influence patient decision-making but are not explicitly included in the SVI framework.
Another limitation is the potential inaccuracies in secondary data sources. Our study relied on data from the SRTR, which, while extensive, may contain missing or incomplete entries that could impact the accuracy of our findings [21].
Geographic variability in healthcare infrastructure, Medicaid expansion, and transplant center practices may also introduce bias, as patients in rural areas or states with fewer transplant centers may experience additional barriers unrelated to their SVI classification. Future studies should explore regional differences in transplant access and consider state-level policy variations that may influence disparities in kidney transplantation [7].
Finally, while our study employed multivariate models to control for potential confounders, unmeasured social and behavioral factors—such as patient adherence, social support networks, and provider bias—may still impact the observed associations.
To enhance the generalizability of our findings, future research should incorporate prospective study designs, qualitative analyses, and more granular data on social determinants of health. Expanding this research to other solid organ transplants (e.g., liver, heart, lung) could further validate the applicability of the SVI in identifying healthcare access disparities.

5. Conclusions

Our study’s unique focus on the SVI highlights the significant impact of social determinants on access to pre-emptive kidney transplants and dialysis duration. By addressing these factors, healthcare providers and policymakers can develop targeted, evidence-based strategies to improve equity and outcomes for vulnerable populations. Future research should continue to explore the effectiveness of targeted interventions and expand to other types of solid organ transplantation to provide a comprehensive understanding of the role of social determinants in healthcare access and outcomes.

Author Contributions

O.A. conceptualized and designed the study, supervised the research process, and contributed to manuscript drafting and revision. Y.L. performed data extraction, statistical analyses, and interpretation of results. K.L. contributed to the methodology, including data standardization and application of the Social Vulnerability Index (SVI). R.A. critically reviewed and edited the manuscript for intellectual content and clarity. A.S. critically reviewed and edited the manuscript for intellectual content and clarity; he also provided clinical expertise on kidney transplantation and its socioeconomic implications. P.Y. critically reviewed and edited the manuscript for intellectual content and clarity. M.Y.J. critically reviewed and edited the manuscript for intellectual content and clarity. M.S.Y. conceptualized and designed the study, supervised the research process, and contributed to manuscript drafting and revision. All authors have read and agreed to the published version of the manuscript.

Funding

This was funded by the Indiana University Department of Medicine Promoting Inclusion and Equity grant (Grant no: 1182516 OAPIE).

Institutional Review Board Statement

The study was conducted in compliance with ethical standards in accordance with the declaration of Helsinki and was approved by the Indiana University Institutional Review Board (Approval code #12457, Approval Date 10 September 2021).

Informed Consent Statement

Patient’s consent to participate is waived. The study used deidentified data from the national kidney transplant records (SRTR). Patient confidentiality was maintained by anonymizing data and ensuring that individual patients could not be identified.

Data Availability Statement

Data used in this study were obtained from the Scientific Registry of Transplant Recipients (SRTR) under a data use agreement. Access to SRTR data is subject to regulatory and institutional requirements. Interested researchers may request the relevant data directly from SRTR, contingent on fulfilling the appropriate conditions and approvals. Further inquiries can be directed to the corresponding author.

Acknowledgments

The authors gratefully thank the Scientific Registry of Transplant Recipients (SRTR) for providing the essential data that contributed significantly to this research. The authors also thank the Polis Center in Indianapolis for its assistance in calculating the Social Vulnerability Index used in this project.

Conflicts of Interest

The data reported here have been supplied by the Hennepin Healthcare Research Institute (HHRI) as the contractor for the Scientific Registry of Transplant Recipients (SRTR). The interpretation and reporting of these data are the responsibility of the author(s) and in no way should be seen as an official policy of or interpretation by the SRTR or the U.S. Government.

Abbreviations

ACSAmerican Community Survey
CDCCenters for Disease Control and Prevention
SESSocio-economic status
SVISocial Vulnerability Index
U.S.United States
SVISocial Vulnerability Index
SRTRScientific Registry of Transplant Recipients

References

  1. Schold, J.D.; Gregg, J.A.; Harman, J.S.; Hall, A.G.; Patton, P.R.; Meier-Kriesche, H.U. Barriers to evaluation and wait listing for kidney transplantation. Clin. J. Am. Soc. Nephrol. 2011, 6, 1760–1767. [Google Scholar] [CrossRef] [PubMed]
  2. Patzer, R.E.; McClellan, W.M. Influence of race, ethnicity, and socioeconomic status on kidney disease. Nat. Rev. Nephrol. 2012, 8, 533–541. [Google Scholar] [CrossRef] [PubMed]
  3. Singh, G.K. Area deprivation and widening inequalities in US mortality, 1969–1998. Am. J. Public Health 2003, 93, 1137–1143. [Google Scholar] [CrossRef] [PubMed]
  4. Berkman, N.D.; Sheridan, S.L.; Donahue, K.E.; Halpern, D.J.; Crotty, K. Low health literacy and health outcomes: An updated systematic review. Ann. Intern. Med. 2011, 155, 97–107. [Google Scholar] [CrossRef] [PubMed]
  5. Aufhauser, D.D.J.; Peng, A.W.; Murken, D.R.; Concors, S.J.; Abt, P.L.; Sawinski, D.; Bloom, R.D.; Reese, P.P.; Levine, M.H. Impact of prolonged dialysis prior to renal transplantation. Clin. Transplant. 2018, 32, e13260. [Google Scholar] [CrossRef] [PubMed]
  6. Flanagan, B.E.; Gregory, E.W.; Hallisey, E.J.; Heitgerd, J.L.; Lewis, B. A social vulnerability index for disaster management. J. Homel. Secur. Emerg. Manag. 2011, 8, 3. [Google Scholar] [CrossRef]
  7. Meier-Kriesche, H.U.; Kaplan, B. Waiting time on dialysis as the strongest modifiable risk factor for renal transplant outcomes: A paired donor kidney analysis. Transplantation 2002, 74, 1377–1381. [Google Scholar] [CrossRef] [PubMed]
  8. Park, C.; Schappe, T.; Peskoe, S.; Mohottige, D.; Chan, N.W.; Bhavsar, N.A.; Boulware, L.E.; Pendergast, J.; Kirk, A.D.; McElroy, L.M. A comparison of deprivation indices and application to transplant populations. Am. J. Transplant. 2023, 23, 377–386. [Google Scholar] [CrossRef] [PubMed]
  9. Butani, L.; Perez, R.V. Effect of pretransplant dialysis modality and duration on long-term outcomes of children receiving renal transplants. Transplant. 2011, 91, 447–451. [Google Scholar] [CrossRef] [PubMed]
  10. Cutter, S.L.; Boruff, B.J.; Shirley, W.L. Social vulnerability to environmental hazards. Soc. Sci. Q. 2003, 84, 242–261. [Google Scholar] [CrossRef]
  11. Axelrod, D.A.; Guidinger, M.K.; Finlayson, S.; Schaubel, D.E.; Goodman, D.C.; Chobanian, M.; Merion, R.M. Rates of solid-organ wait-listing, transplantation, and survival among residents of rural and urban areas. JAMA 2008, 299, 202–207. [Google Scholar] [CrossRef] [PubMed]
  12. Kind, A.J.H.; Buckingham, W.R. Making neighborhood-disadvantage metrics accessible—the Neighborhood Atlas. N. Engl. J. Med. 2018, 378, 2456–2458. [Google Scholar] [CrossRef] [PubMed]
  13. Braveman, P.A.; Cubbin, C.; Egerter, S.; Chideya, S.; Marchi, K.S.; Metzler, M.; Posner, S. Socioeconomic status in health research: One size does not fit all. JAMA 2005, 294, 2879–2888. [Google Scholar] [CrossRef]
  14. Patzer, R.E.; Paul, S.; Plantinga, L.; Krisher, J.; Pastan, S.O. Variation in dialysis facility referral for kidney transplantation among patients with end-stage renal disease in Georgia. JAMA 2015, 314, 582–594. [Google Scholar] [CrossRef]
  15. Epstein, A.M.; Ayanian, J.Z.; Keogh, J.H.; Noonan, S.J.; Armistead, N.; Cleary, P.D.; Weissman, J.S.; David-Kasdan, J.A.; Carlson, D.; Fuller, J.; et al. Racial disparities in access to renal transplantation—Clinically appropriate or due to underuse or overuse? N. Engl. J. Med. 2000, 343, 1537–1544. [Google Scholar] [CrossRef]
  16. Taylor, L.A.; Coyle, C.E.; Ndumele, C.; Rogan, E.; Canavan, M.; Curry, L.A.; Bradley, E.H. Leveraging the social determinants of health: What works? PLoS ONE 2016, 11, e0160217. [Google Scholar] [CrossRef] [PubMed]
  17. Beach, M.C.; Price, E.G.; Gary, T.L.; Robinson, K.A.; Gozu, A.; Palacio, A.; Smarth, C.; Jenckes, M.W.; Feuerstein, C.; Bass, E.B.; et al. Cultural competence: A systematic review of healthcare provider educational interventions. Med. Care 2005, 43, 356–373. [Google Scholar] [CrossRef] [PubMed]
  18. Nutbeam, D. Health literacy as a public health goal: A challenge for contemporary health education and communication strategies into the 21st century. Health Promot. Int. 2000, 15, 259–267. [Google Scholar] [CrossRef]
  19. Grams, M.E.; Massie, A.B.; Schold, J.D.; Chen, B.P.; Segev, D.L. Trends in the inactive kidney transplant waitlist and implications for candidate survival. Am. J. Transplant. 2017, 17, 3134–3141. [Google Scholar] [CrossRef] [PubMed]
  20. Massie, A.B.; Caffo, B.S.; Gentry, S.E.; Hall, E.C.; Axelrod, D.A.; Lentine, K.L.; Schnitzler, M.A.; Gheorghian, A.; Salvalaggio, P.R.; Segev, D.L. MELD exceptions and rates of waiting list outcomes. Am. J. Transplant. 2011, 11, 2362–2371. [Google Scholar] [CrossRef] [PubMed]
  21. Health Resources and Services Administration (HRSA). Scientific Registry of Transplant Recipients (SRTR). 2020. Available online: https://www.srtr.org/ (accessed on 10 October 2023).
Figure 1. Social Vulnerability Index (SVI) by Dialysis Vintage Categories* (n = 155,424). * Had dialysis vintage (dialysis history before kidney transplantation) includes “<1 year”, “1–3 Years”, and “>3 years” subcategories.
Kidneydial 05 00027 g001
Table 1. Descriptive statistics of the cohort (n = 155,424).
Patient CharacteristicsnStatisticsMedian (IQR) Min Max
Patient’s Gender, n (%)155,424
  Female 60,777 (39.1%)
  Male 94,647 (60.9%)
Age at transplant (yrs), mean (sd)155,42452.1 (13.8)54.0 (42.0–63.0) 18.0 89.0
Patient’s Race, n (%)155,424
  White 72,809 (46.8%)
  Black or African American 41,884 (26.9%)
  Hispanic/Latino 26,944 (17.3%)
  Asian 10,772 (6.9%)
  American Indian or Alaska Native 1354 (0.9%)
  Multi-racial 1005 (0.6%)
  Native Hawaiian or Other Pacific Islander 656 (0.4%)
Social Vulnerability Index (0–1), mean (sd)155,4240.67 (0.25)0.72 (0.47–0.89) 0.0 1.0
Social Vulnerability Index, n (%)155,424
  [0, 0.25) 11,787 (7.6%)
  [0.25, 0.5) 30,638 (19.7%)
  [0.5, 0.75) 40,855 (26.3%)
  [0.75, 1] 72,144 (46.4%)
First graft for patient, n (%)155,424138,500 (89.1%)
Had previous Transplants, n (%)155,42419,262 (12.4%)
Donor Type, n (%)155,424
  Deceased 106,463 (68.5%)
  Living 48,961 (31.5%)
Pre-transplant dialysis, n (%)155,424128,703 (82.8%)
Dialysis Vintage duration, n (%)155,424
  <1 year 21,694 (14.0%)
  1–3 Years 36,640 (23.6%)
  >3 years 70,369 (45.3%)
  Preemptive transplant 26,721 (17.2%)
Dialysis Vintage duration (yrs), mean (sd)155,4243.3 (3.1)2.6 (0.6–5.1) 0.0 15.0
Dialysis Vintage duration in those who had dialysis (yrs), mean (sd)128,7033.9 (3.0)3.4 (1.5–5.7) 0.0 15.0
Symptomatic peripheral vascular disease, n (%)154,23015,083 (9.8%)
Diabetes of any type, n (%)155,30553,417 (34.4%)
Disclaimer/Publisher’s Note: The statements, opinions and data contained in all publications are solely those of the individual author(s) and contributor(s) and not of MDPI and/or the editor(s). MDPI and/or the editor(s) disclaim responsibility for any injury to people or property resulting from any ideas, methods, instructions or products referred to in the content.

