Article

The Transcription of Transposable Elements Differentially Regulated by SVAs in the Major Histocompatibility Complex Class I Region of a Parkinson’s Progression Markers Initiative Cohort

by
Jerzy K. Kulski
1,2,
Abigail L. Pfaff
3,4 and
Sulev Koks
3,4,*
1
Faculty of Health and Medical Sciences, School of Biomedical Science, The University of Western Australia, Crawley, WA 6009, Australia
2
Department of Molecular Life Science, Division of Basic Medical Science and Molecular Medicine, Tokai University School of Medicine, Isehara 259-1193, Japan
3
Centre for Molecular Medicine and Innovative Therapeutics, Murdoch University, Perth, WA 6150, Australia
4
Perron Institute for Neurological and Translational Science, Perth, WA 6009, Australia
*
Author to whom correspondence should be addressed.
J. Mol. Pathol. 2025, 6(1), 1; https://doi.org/10.3390/jmp6010001
Submission received: 13 September 2024 / Revised: 9 December 2024 / Accepted: 2 January 2025 / Published: 6 January 2025

Abstract

:
Background/Objectives: The highly polymorphic Major Histocompatibility Complex (MHC) genomic region, located on the short arm of chromosome 6, is implicated genetically in Parkinson’s disease (PD), a progressive neurodegenerative disorder with motor and non-motor symptoms. Previously, we reported significant associations between SINE-VNTR-Alu (SVA) expression quantitative trait loci (eQTLs) and Human Leucocyte Antigen (HLA) class I genotypes in PD. In this study, we aimed to evaluate SVA associations and their regulatory effects on transposable element (TE) transcription in the MHC class I region. Methods: Transcriptome data from the peripheral blood cells of 1530 individuals in the Parkinson’s Progression Markers Initiative (PPMI) cohort were reanalyzed for TE and gene expression using publicly available bioinformatics tools, including Salmon and Matrix-eQTL. Results: Four structurally polymorphic SVAs regulated the transcription of 18 distinct clusters of 235 TE loci, comprising LINEs (33%), SINEs (19%), LTRs (35%), and ancient transposon DNA elements (12%) located near HLA genes. The transcribed TEs were predominantly short, with an average length of 445 nucleotides. The regulatory effects of these SVAs varied significantly in terms of TE types, numbers, and transcriptional activation or repression. The SVA-regulated TE RNAs in blood cells appear to function as enhancer-like elements, differentially influencing the expression of HLA class I genes, non-HLA genes, and noncoding RNAs. Conclusions: These findings highlight the roles of SVAs and their associated TEs in the complex regulatory networks governing coding and noncoding gene expression in the MHC class I region, with potential implications for immune function and disease susceptibility.

Graphical Abstract

1. Introduction

Integrated transposable elements (TEs), also known as dispersed repetitive sequences, make up at least 50% of the human genome content [1,2]. They are divided into two major classes: DNA transposons and retroelements (REs) or retrotransposons, which include three subclasses, namely, long terminal repeats (LTRs)/endogenous retroviruses (ERVs), long interspersed elements (LINEs), and short interspersed elements (SINEs) [3,4,5]. Most TE sequences have lost their ability to re-transpose within the genome due to evolutionary changes such as nucleotide mutations, truncated open reading frames, fragmentation, and structural rearrangements [6,7]. Nevertheless, TEs are widely transcribed in both normal and cancerous human tissues, raising critical questions about their regulatory functions and genetic actions [8,9,10,11]. In addition, various reliable bioinformatic tools have been developed and used to identify, classify, and annotate the many millions of TE sequence loci in the human genome [2,3,9,10].
Recent studies have revealed that TE transcription is more pervasive and diverse than previously thought, with differential expression in all human tissues. The highest levels are observed in medullary thymic epithelial cells, suggesting a role in self-tolerance mechanisms for potential immunogenic TEs [10]. Moreover, these and other studies [9,12] have shown that transcripts from TEs, such as Alu, L1, and various LTR sequences, can produce short immunogenic peptides. These peptides, as part of the immunopeptidome, bind to Human Leukocyte Antigen (HLA) class I molecules and are presented to circulating immune cells. This suggests that the HLA system regulates genomic TE expression and an ‘endogenous viriome’ in ways that remain underexplored [13,14,15,16].
The human Major Histocompatibility Complex (MHC) genomic region, located on the small arm of chromosome 6, contains over 140 coding genes including 9 highly polymorphic classical HLA genes within the class I and class II subregions. These genes play a critical role in antigen presentation at the cell surface, enabling circulating T cells to initiate immune responses [17,18,19]. The classical class I HLA genes (HLA-A, -B, and -C) encode glycoproteins that present antigens to CD8+ cytotoxic T cells, which, when activated, directly eliminate infected or targeted cells [20]. In contrast, the classical class II HLA genes (HLA-DR, -DQ, and -DP) encode glycoproteins that present antigens to CD4+ helper T cells. These helper cells regulate immune activity, influencing macrophages, B cells, and cytotoxic T cells [21].
The MHC region is a significant genetic factor associated with Parkinson’s disease (PD), a progressive neurodegenerative condition characterized by motor and non-motor symptoms [22]. HLA gene transcription and polymorphic variant expression in circulating blood cells are significantly influenced by expression quantitative trait loci (eQTLs) including SINE-VNTR-Alu (SVA) retrotransposon insertions [23,24]. Four structurally polymorphic SVA eQTLs within the MHC class II region have been linked to the expression of the three classical class II HLA genes and 20 distinct clusters of 235 nearby TE loci. These TE loci include LINEs (37%), SINEs (28%), LTR/ERVs (23%), and ancient transposon DNA elements (12%) [16]. In addition, TE RNAs expressed under SVA regulation in blood cells appear to be enhancer-like elements, coordinating the differential regulation of HLA-DR, -DQ, and -DP genes. These highly polymorphic HLA class II genes are essential for antigen presentation by macrophages, dendritic cells, B cells, and some endothelial and thymic cells to CD4 T cells, ensuring a diverse and adaptable immune response.
Given that specific SVAs regulate the differential expression of TEs in the MHC class II region [16], this study aimed to explore the relationship between regulatory SVA insertions and TE transcription in the MHC class I region. This class I region, which is highly polymorphic with many indels, including SVAs and other TEs [25], harbors four polymorphic SVA eQTLs—NR_SVA_377, R_SVA_24, R_SVA_25, and R_SVA_26—that regulate class I HLA genes [23] and may influence the transcription of neighboring TE loci.
To investigate the putative relationship between these SVA eQTLs and the expression of TEs, we reanalyzed transcriptome data from the peripheral blood cells of 1530 subjects in the Parkinson’s Progression Markers Initiative (PPMI) for TE and gene RNA expression [16]. Using publicly available computational tools including Melt-Del, Delly2, DESeq2, Salmon, and Matrix-eQTL, we generated statistical outputs such as false discovery rate (FDR)-corrected p-values and logistic regression β estimates to evaluate SVA associations and their regulatory effects on TE expression [16,24,25,26,27,28,29,30,31,32].
Our analysis confirmed that the four SVAs in the MHC class I region regulate the transcription of 18 distinct clusters of 235 TE loci. These clusters include a variety of TEs, with LINEs (33%), SINEs (19%), LTRs/ERVs (35%), and ancient transposon DNA elements (12%) located near HLA genes. These findings suggest that SVAs play a critical role in coordinating TE transcription in this region.

2. Materials and Methods

This study was approved by the University of Western Australia Human Research Ethics Office (RA/4/0/5595, 24 July 2019) and conducted in accordance with the local legislation and institutional requirements. Participants in the Parkinson’s Progression Markers Initiative (PPMI) database provided written informed consent to participate in this and other international studies. For the latest information on the PPMI, visit www.ppmi-info.org (accessed 20 November 2024).
HLA and TE sequences within the blood transcriptome of a PPMI cohort were identified and annotated from RNA-seq BAM files prepared previously for 1530 individuals, without stratifying by case or control status [23,24,26]. The cohort primarily consists of individuals of European ancestry, with 65% males and 35% females, and an average age of 60 years at onset and 61 years at diagnosis. HLA class I gene transcripts were detected and quantified by arcasHLA.v0.6.0 software [27]. TE expression was analyzed using the GenomicAlignments package from Bioconductor [28] in R, which processed BAM RNA files in conjunction with a GTF input file containing TE annotations. The annotations included attributes such as class_id, family_id, and unique transcript_id (e.g., L1Md_Gf_dup1), which were downloaded from the Hammell laboratory resource (https://labshare.cshl.edu/shares/mhammelllab/www-data/TEtranscripts/TE_GTF/, accessed 11 September 2024).
Reference and non-reference SVAs and their regulatory effects on gene and TE transcription levels were analyzed using Melt-Del, Delly2, and DESeq2, as described previously [29,30]. A transcript-based analysis of pair-ended Fastq files was performed using Salmon [31], and outputs were reformatted for Matrix-eQTL analysis [32]. This calculated the statistically significant SVA loci associated with the regulation of transcript variants. Statistical outputs included FDR-corrected p-values and logistic regression beta effects to evaluate SVA associations and their regulatory impacts on TE expression. Only significant results after FDR correction are reported here (Tables S1 and S2).
Additional data, including counts, statistical summaries (means, standard deviations), and visualizations (e.g., plots, graphs, charts) were generated using Excel and PowerPoint (Microsoft v16.78). Ridge line density plots were created with SRplot [33]. Genome Browser images and layered tracks were sourced from the University of California, Santa Cruz (UCSC) Genomics Institute, accessed at https://genome.ucsc.edu (accessed 11 September 2024).

3. Results

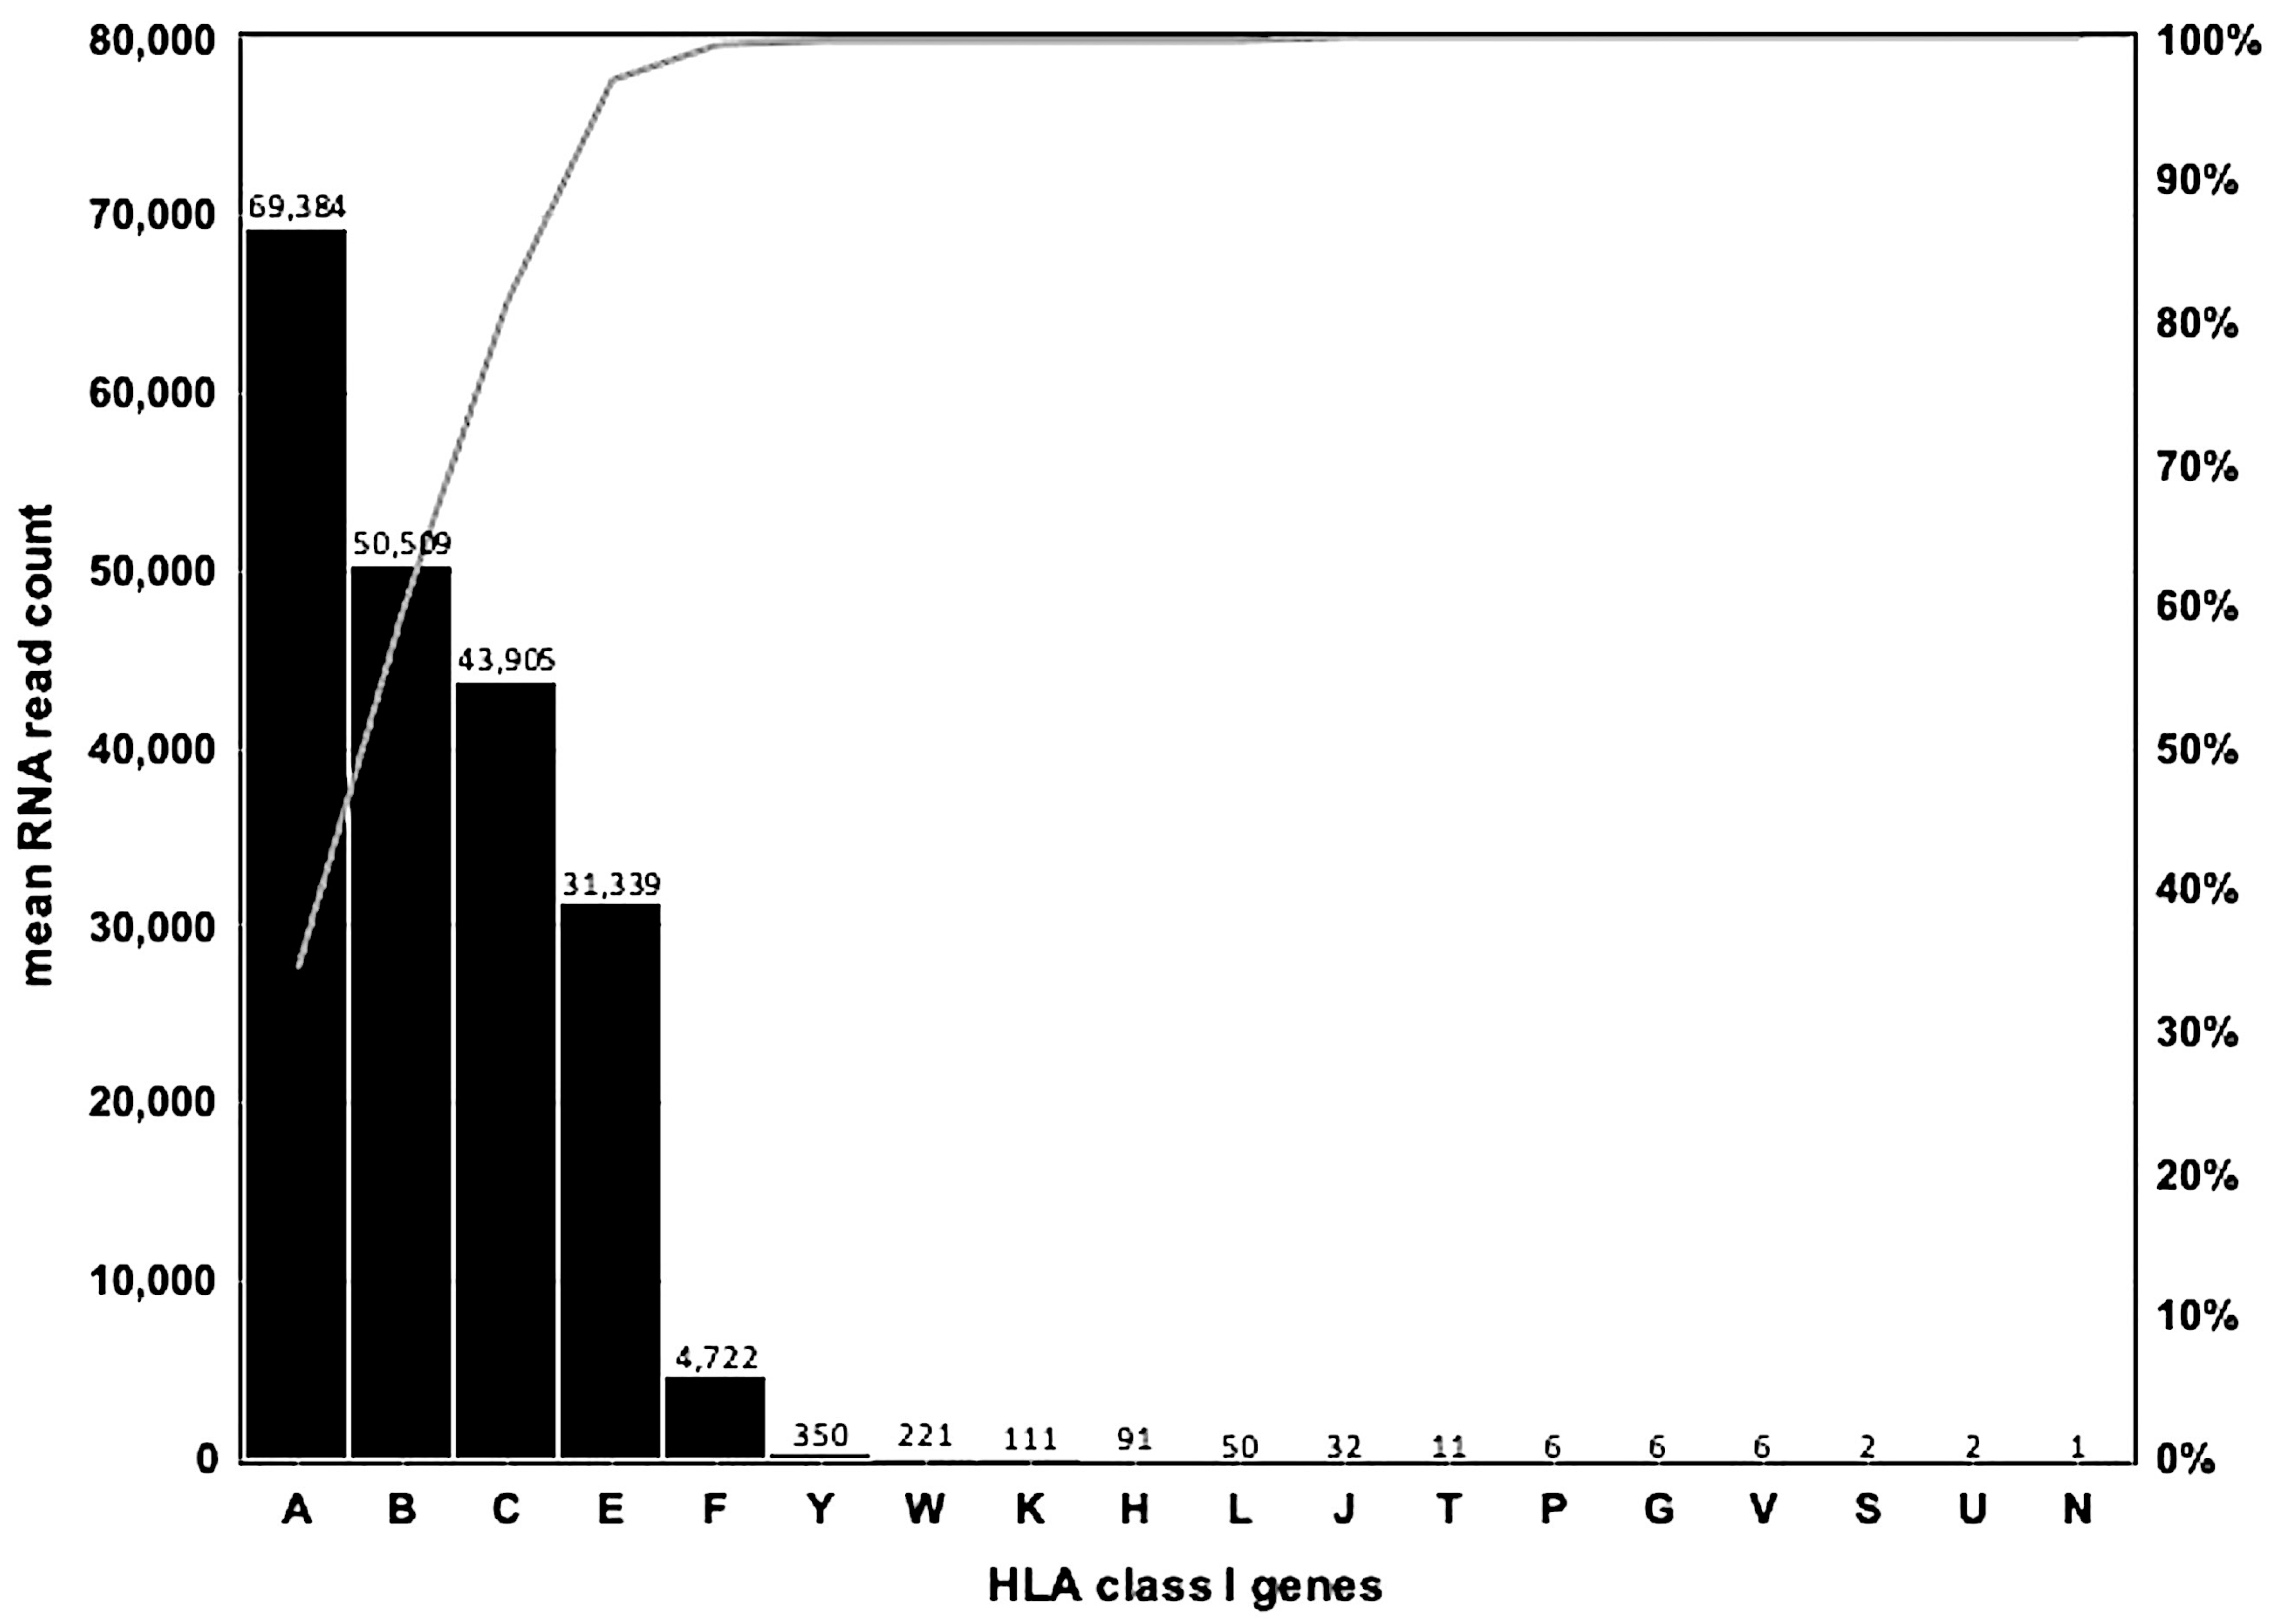
3.1. HLA Class I Gene Transcription Levels in Whole Blood Samples of 1530 PPMI Subjects

The transcription levels of 18 HLA class I genes and pseudogenes were analyzed using arcasHLA v0.6.0 software on RNA-seq data from the PPMI cohort (Figure 1, Table 1). Among the classical class I genes, HLA-A transcripts were detected in all 1530 samples, with the highest average read count (69,384 reads). HLA-B and HLA-C transcripts were identified in 1528 of the 1530 samples, with the second (50,509 reads) and third (43,905 reads) highest average read counts, respectively.
For the non-classical HLA class I genes, HLA-F and HLA-E were detected in 1528 samples, with relatively low (HLA-F: 4723 reads) and high (HLA-E: 31,339 reads) average read counts. In contrast, HLA-G transcripts were detected in only 1243 samples (81.2%) and at very low average levels (six reads).
Among the 12 HLA pseudogenes, HLA-W, -J, and -L were transcribed in nearly all samples, with average counts ranging from 32 for HLA-J to 221 for HLA-W. More than 50% of samples had detectable transcripts for HLA-V and -U, while HLA-P, -Y, -N, and -S were transcribed in fewer than 50% of samples. HLA-N had the lowest detection rate, with transcripts found in only 75 samples (4.9%). Among the pseudogenes, only HLA-Y (350 reads), HLA-W (221 reads), and HLA-K (111 reads) had average read counts exceeding 100, while all others had fewer than 100 reads (Table 1).
Notably, 97% of the total transcriptional output of the 18 HLA class I genes and pseudogenes in the PPMI cohort was attributed to the classical HLA-A, -B, and -C genes, along with the non-classical HLA-E gene (Figure 1).

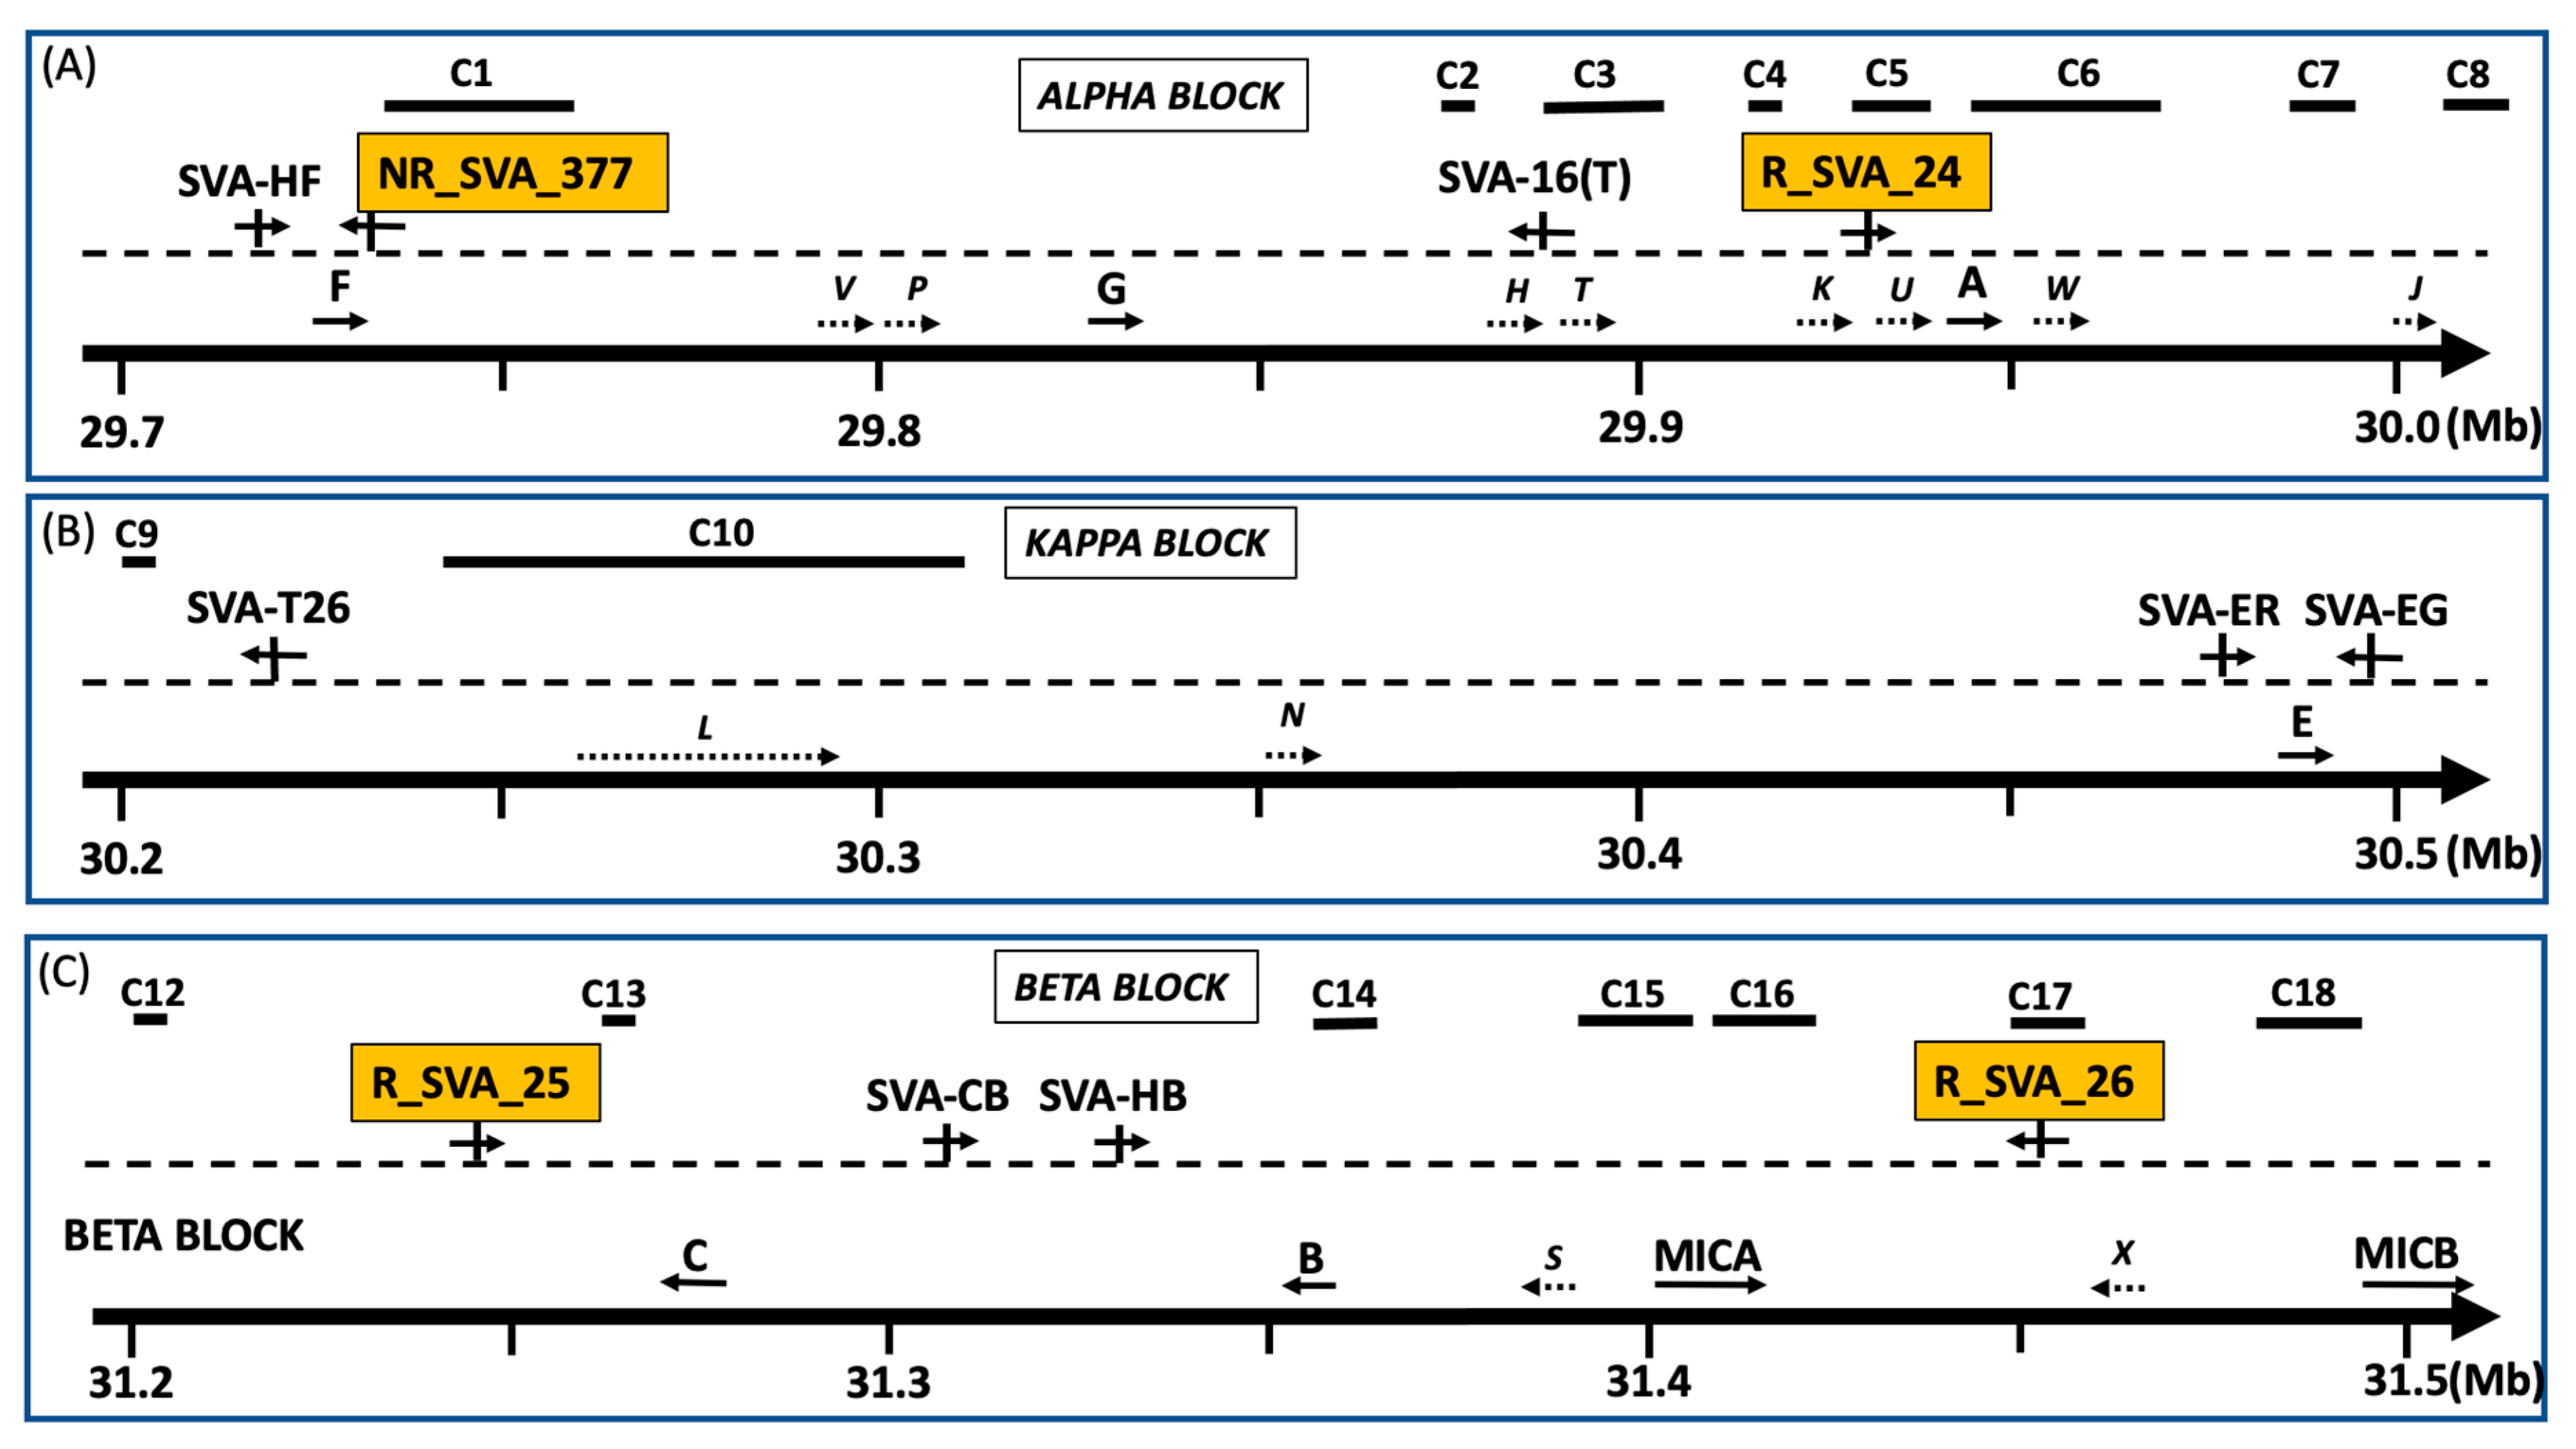
3.2. HLA and TE Clusters Regulated by Four SVA Retrotransposons Within MHC Class I Region

Figure 2 shows the organization and relative locations of SVA repeat elements, HLA class I genes and pseudogenes, and 18 clusters of expressed TEs (C1 to C18) modulated by four specific SVAs within the alpha, kappa, and beta HLA duplication blocks of the MHC class I genomic region. The four SVAs—NR_SVA_377, R_SVA_24, R_SVA_25, and R_SVA_26—regulated transcription variants of all the MHC class I genes and pseudogenes, except for HLA-P, -Y, -N, and -E (Supplementary Table S1).
In addition to HLA genes, these SVAs influenced the transcription of non-HLA genes (GABBR1, ZFP57, POLR1H, PPP1R11, PAIP1P1, POU5F1, MICA, MICB, DDX39B, DDAH2) and several long noncoding RNAs (lncRNAs) (HLA-F-AS1, HCP5, HCP5B, HCG4B, MICB-DT, LINC01149). Supplementary Table S2 lists the ID-annotated individual TEs transcribed within clusters C1 to C18 modulated by the four SVAs. The table also provides eQTL statistics, including a test statistic, p-value, FDR, beta effect size, and chromosomal positions for each annotated TE.
Further details of the number and types of TEs (name, class, family, length, DNA strand) within clusters, as well as their chromosomal positions, sizes, nearest genes, and TE counts per cluster, are provided in Supplementary Tables S3–S6.
The DNA strand bias for transcribed TEs within their cluster positions in the GRCh38 reference genome is summarized in Table 2. Eight of eighteen clusters exhibited 100% expression from either the negative or positive strand. Only three clusters—C3 regulated by R_SVA_24, and C14 and C15 regulated by R_SVA_26—had less than 60% expression from both strands. Overall, there was noticeable strand bias, with 64% of the expressed TEs having been transcribed from the positive strand (146 of 228). In addition, only 228 of the 437 (52%) TE loci within the GRCh38 reference genome positions were transcribed. The number of expressed TEs per cluster varied significantly, ranging from 2 in C3 to 35 in C6. A direct positive correlation was observed between the number of expressed TEs per cluster and cluster width (r2 = 0.6246, p = 9.39 × 10⁻⁷), with some scatter around the regression line (Figure 3).
The nucleotide distances between adjacent transcribed TE clusters regulated by different SVAs are listed in Table 3. The distances between different clusters were generally greater than the average distances between TEs within the same clusters. The largest distance between adjacent transcribed TE clusters was 148.5 kb, separating C8 in the alpha block and C9 in the kappa block, both regulated by R_SVA_24 (Figure 2). Within the alpha block, the longest distance between adjacent transcribed TE clusters regulated by NR_SVA_377 was 130.4 kb, separating C1 from C2. In the beta block, the longest distance between clusters regulated by R_SVA_26 was 93.7 kb, separating C13 from C14.

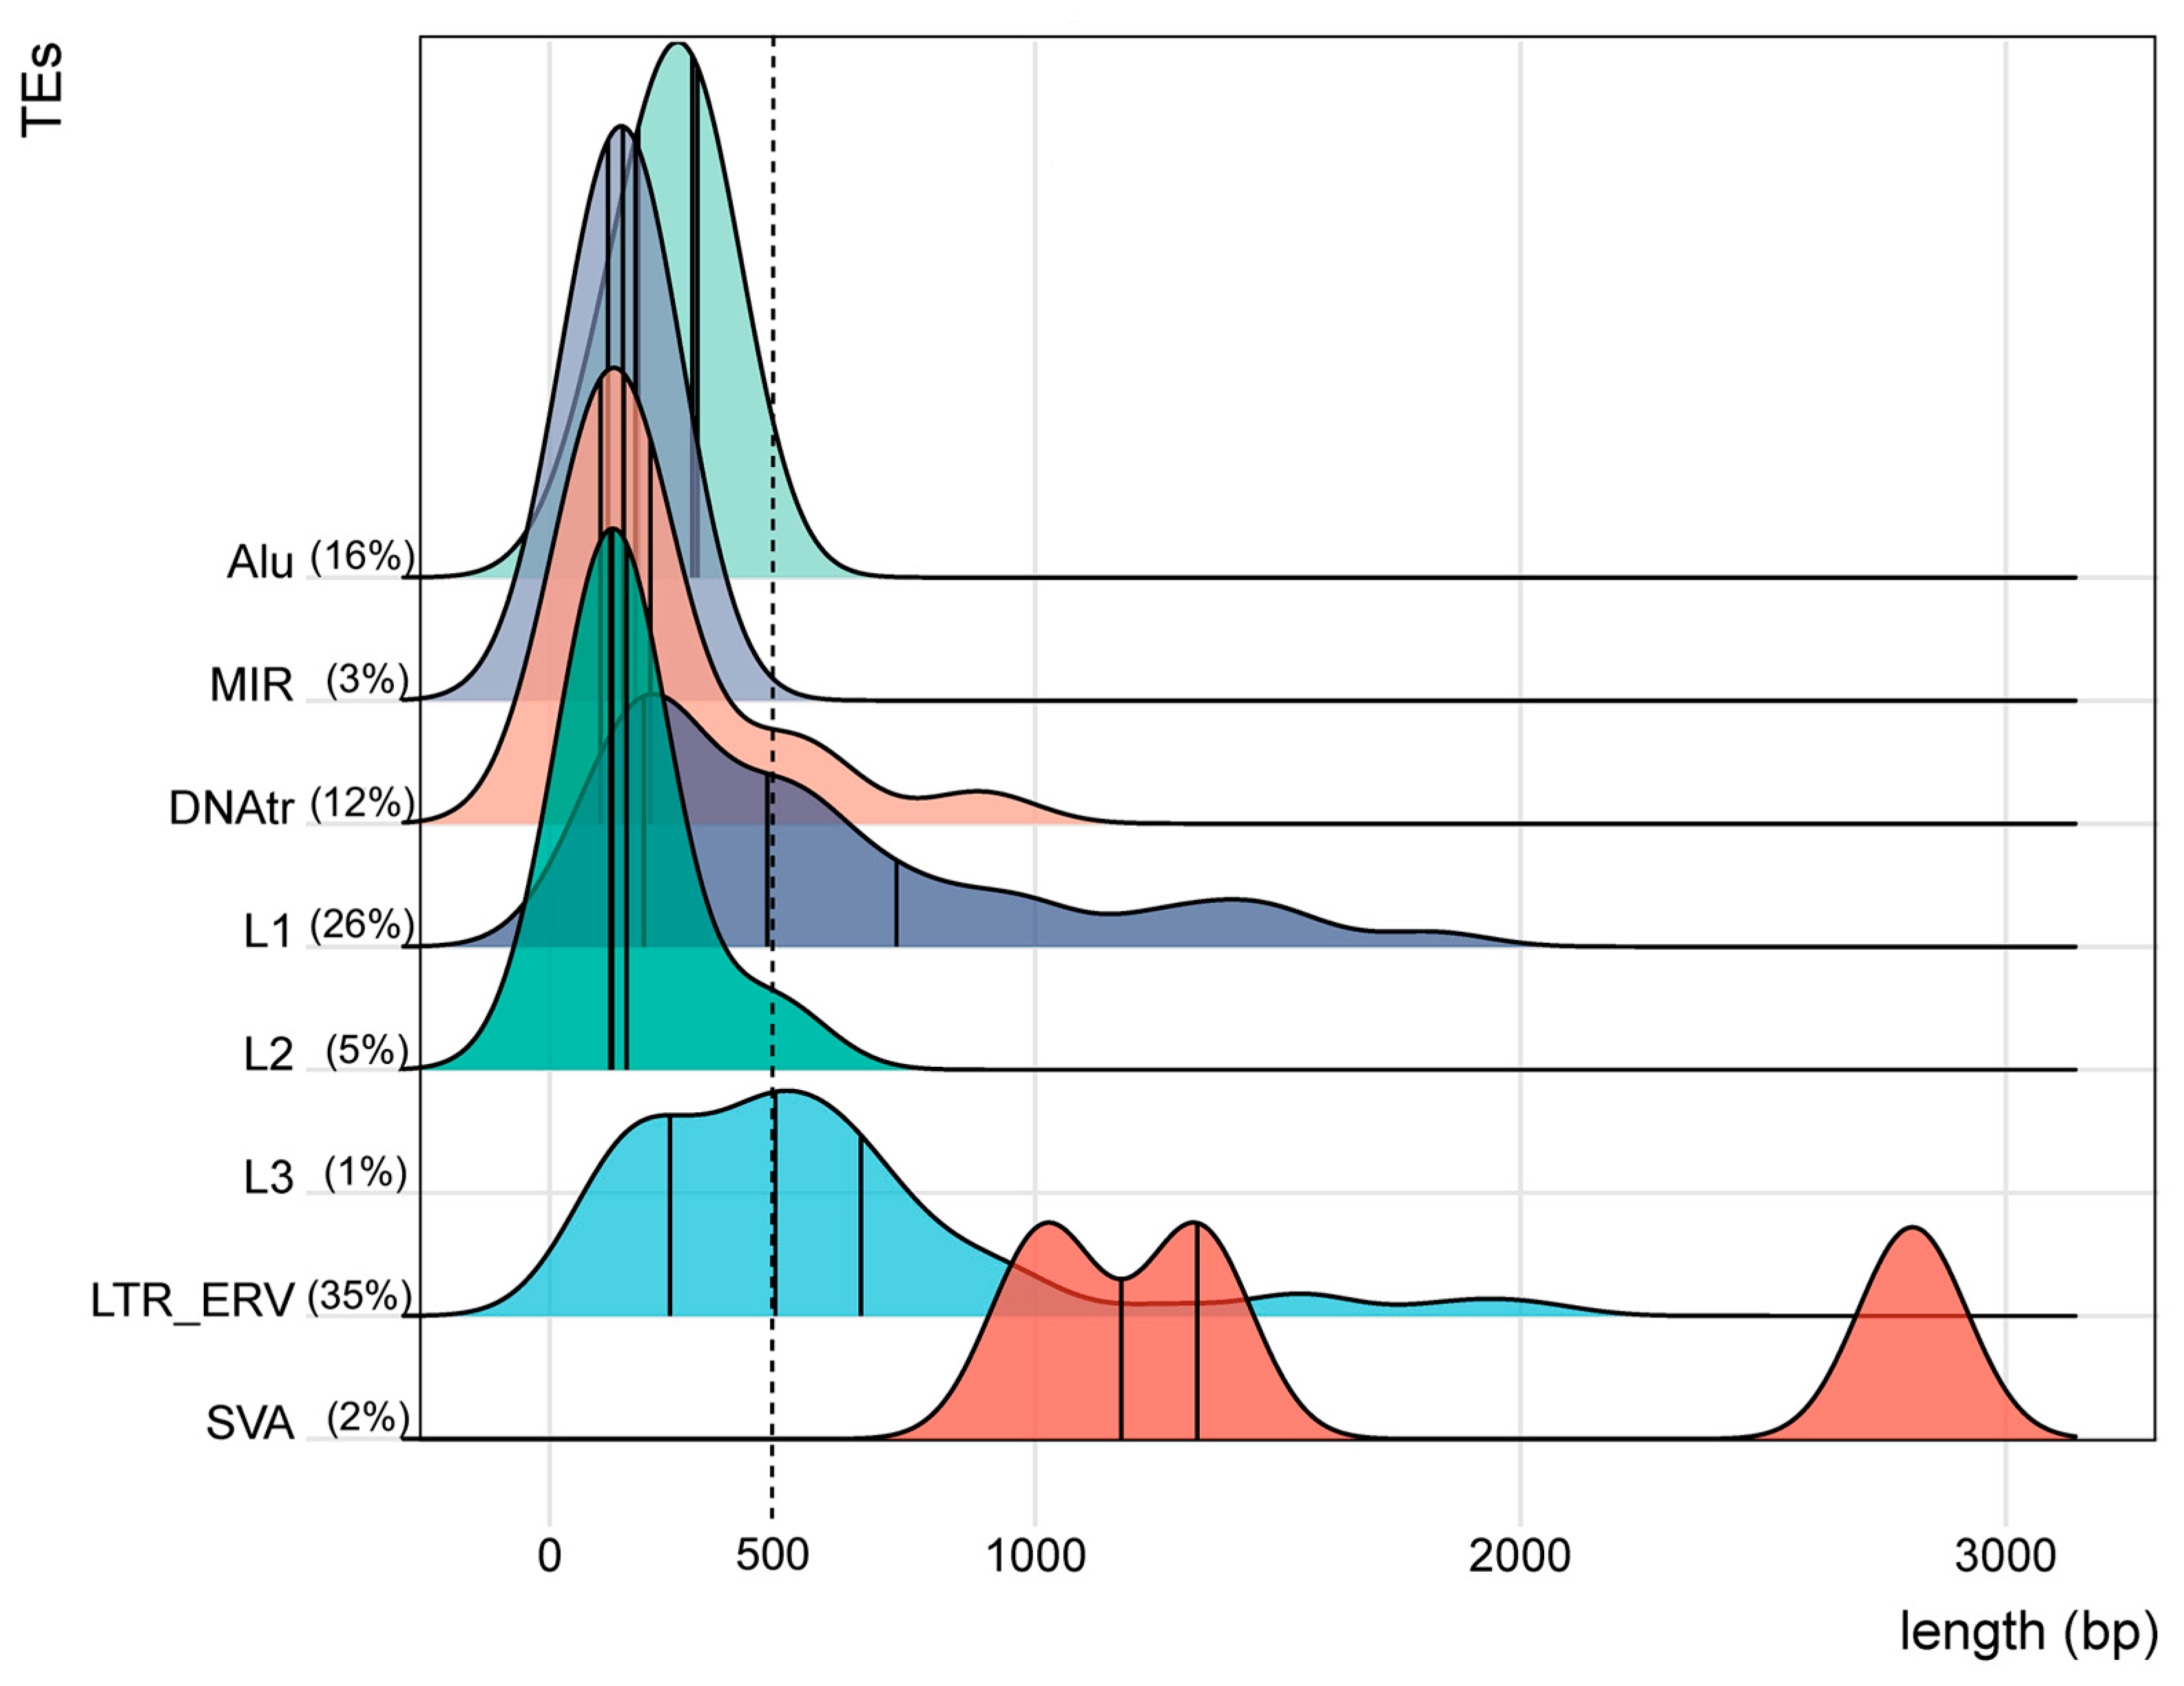
3.3. TE Families, Classes, and Individual Annotated Elements Transcribed Within Clusters

The expressed TEs regulated by the four SVAs were predominantly members of four families: LTR_ERV (35%), L1 (26%), Alu (16%), and DNA transposons (12%), with smaller contributions from the L2 (5%) and MIR (3%) families. These TEs had an overall average length of 445 bp (Figure 4). The number, percentage, length (bp), and classifications (class, family, name) of the 169 transcribed TEs within the 18 clusters regulated by the four SVAs are presented in Table 4.
Of the 59 transcribed LTR_ERV elements, 39 were expressed in the alpha block and 20 in the beta block. The three most common families within this class were ERV1 (44%), ERVL-MaLR (31%), and ERVL (22%). The longest sequences in this class were fragments of the HARLEQUIN element, with an average length of 1100 bp. The transcribed LTRs in the alpha block included MER21, LTR13, ERV3-16A3, LTR16, HERVP71A, LTR18B, LTR71B, and LTR84b, while the beta block contained HARLEQUIN, MER41D, MER61E, LTR8, LTR12C, LTR43-int, LTR6, LTR22, HUERS-P3-int, and LTR9D.
The 18 ERVL-MaLR subfamily members were predominantly represented by 14 MLT subtypes. Of the 20 DNA transposons, the hAT-Charlie family was the most common (95%), comprising eight Charlie elements, seven MER5s, two MER30s, and one each of the MER20 and MER102 fragments. DNA transposons were expressed predominantly in the alpha block (n = 14), with one in the kappa block and five in the beta block.
The 27 Alus, with an average length of 234 bp, consisted of five subgroups: 7 AluJs (26%), 11 AluSs (41%), 6 AluYs (22%), 2 FLAMs (7%) and 1 FRAM (4%). The 45 L1 fragmented subfamilies, ranging in length from 54 to 1820 nucleotides (average: 545 bp), predominantly belonged to the L1M and L1P categories. Of these, 20 were upregulated and 25 were downregulated by the SVAs. Most of the short, fragmented L1 RNAs (30 of 45, 67% within clusters) were aligned to the 3’ end of a full-length reference L1 sequence, specifically between nucleotide positions 4861 and 6152 bp, within the 3′ end of ORF2 (Figure 5). Notably, 36 (80%) of the 45 transcribed L1 sequences were found within lncRNA sequences such as HLA-F_AS1, HCG9, MICA-AS1, and MICB-DT, or were located within the introns of genes, including TRIM26, HLA-B, and MICA.
Not all adjacent TEs within a cluster were expressed or regulated, with only 52% of the 228 TE loci expressed within the clusters (Table 2). However, Table 5 lists the number and percentage of transcribed TEs within each family or class as a proportion of the 431 TE loci within the alpha block and the 568 TE loci within the beta blocks of the GRCh38 reference genome. In the alpha block, 16% and 17% of the TE loci were expressed and regulated by NR_SVA_377 and R_SVA_24, respectively. In contrast, only 10% and 7% of the TE loci in the beta block were expressed and regulated by these SVAs. These findings highlight that SVA regulatory effects are limited in scope and highly selective.

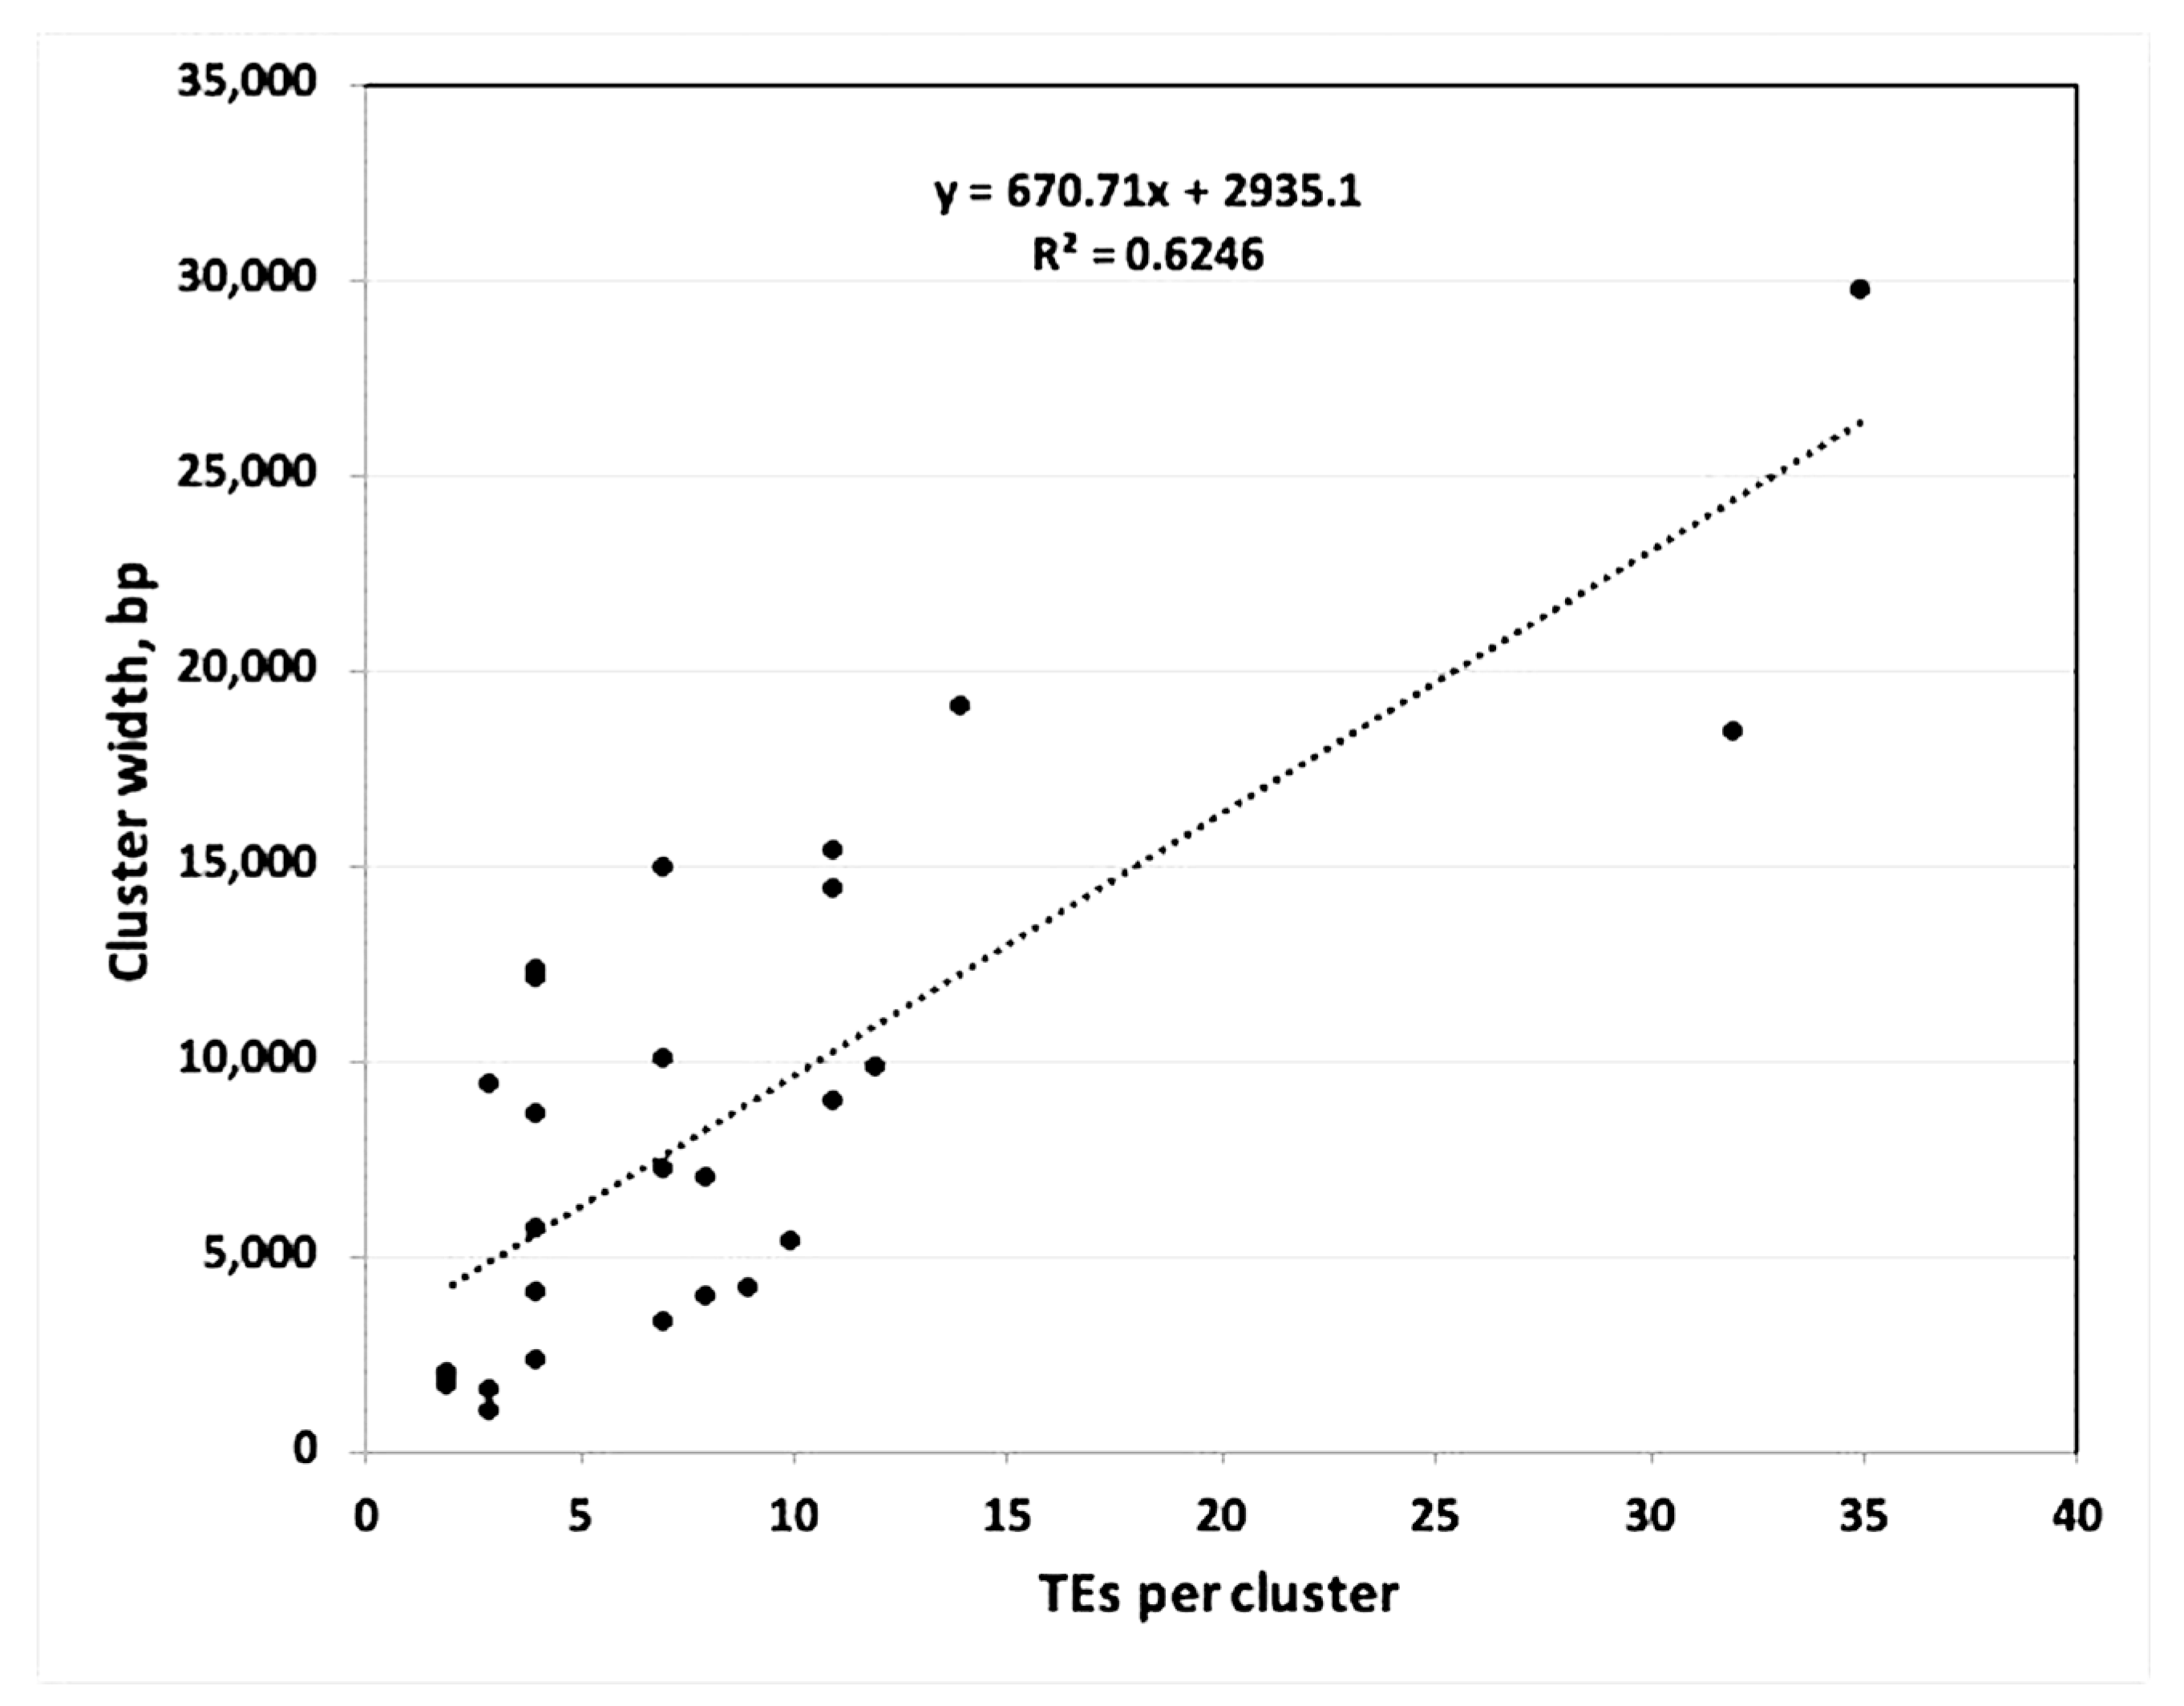
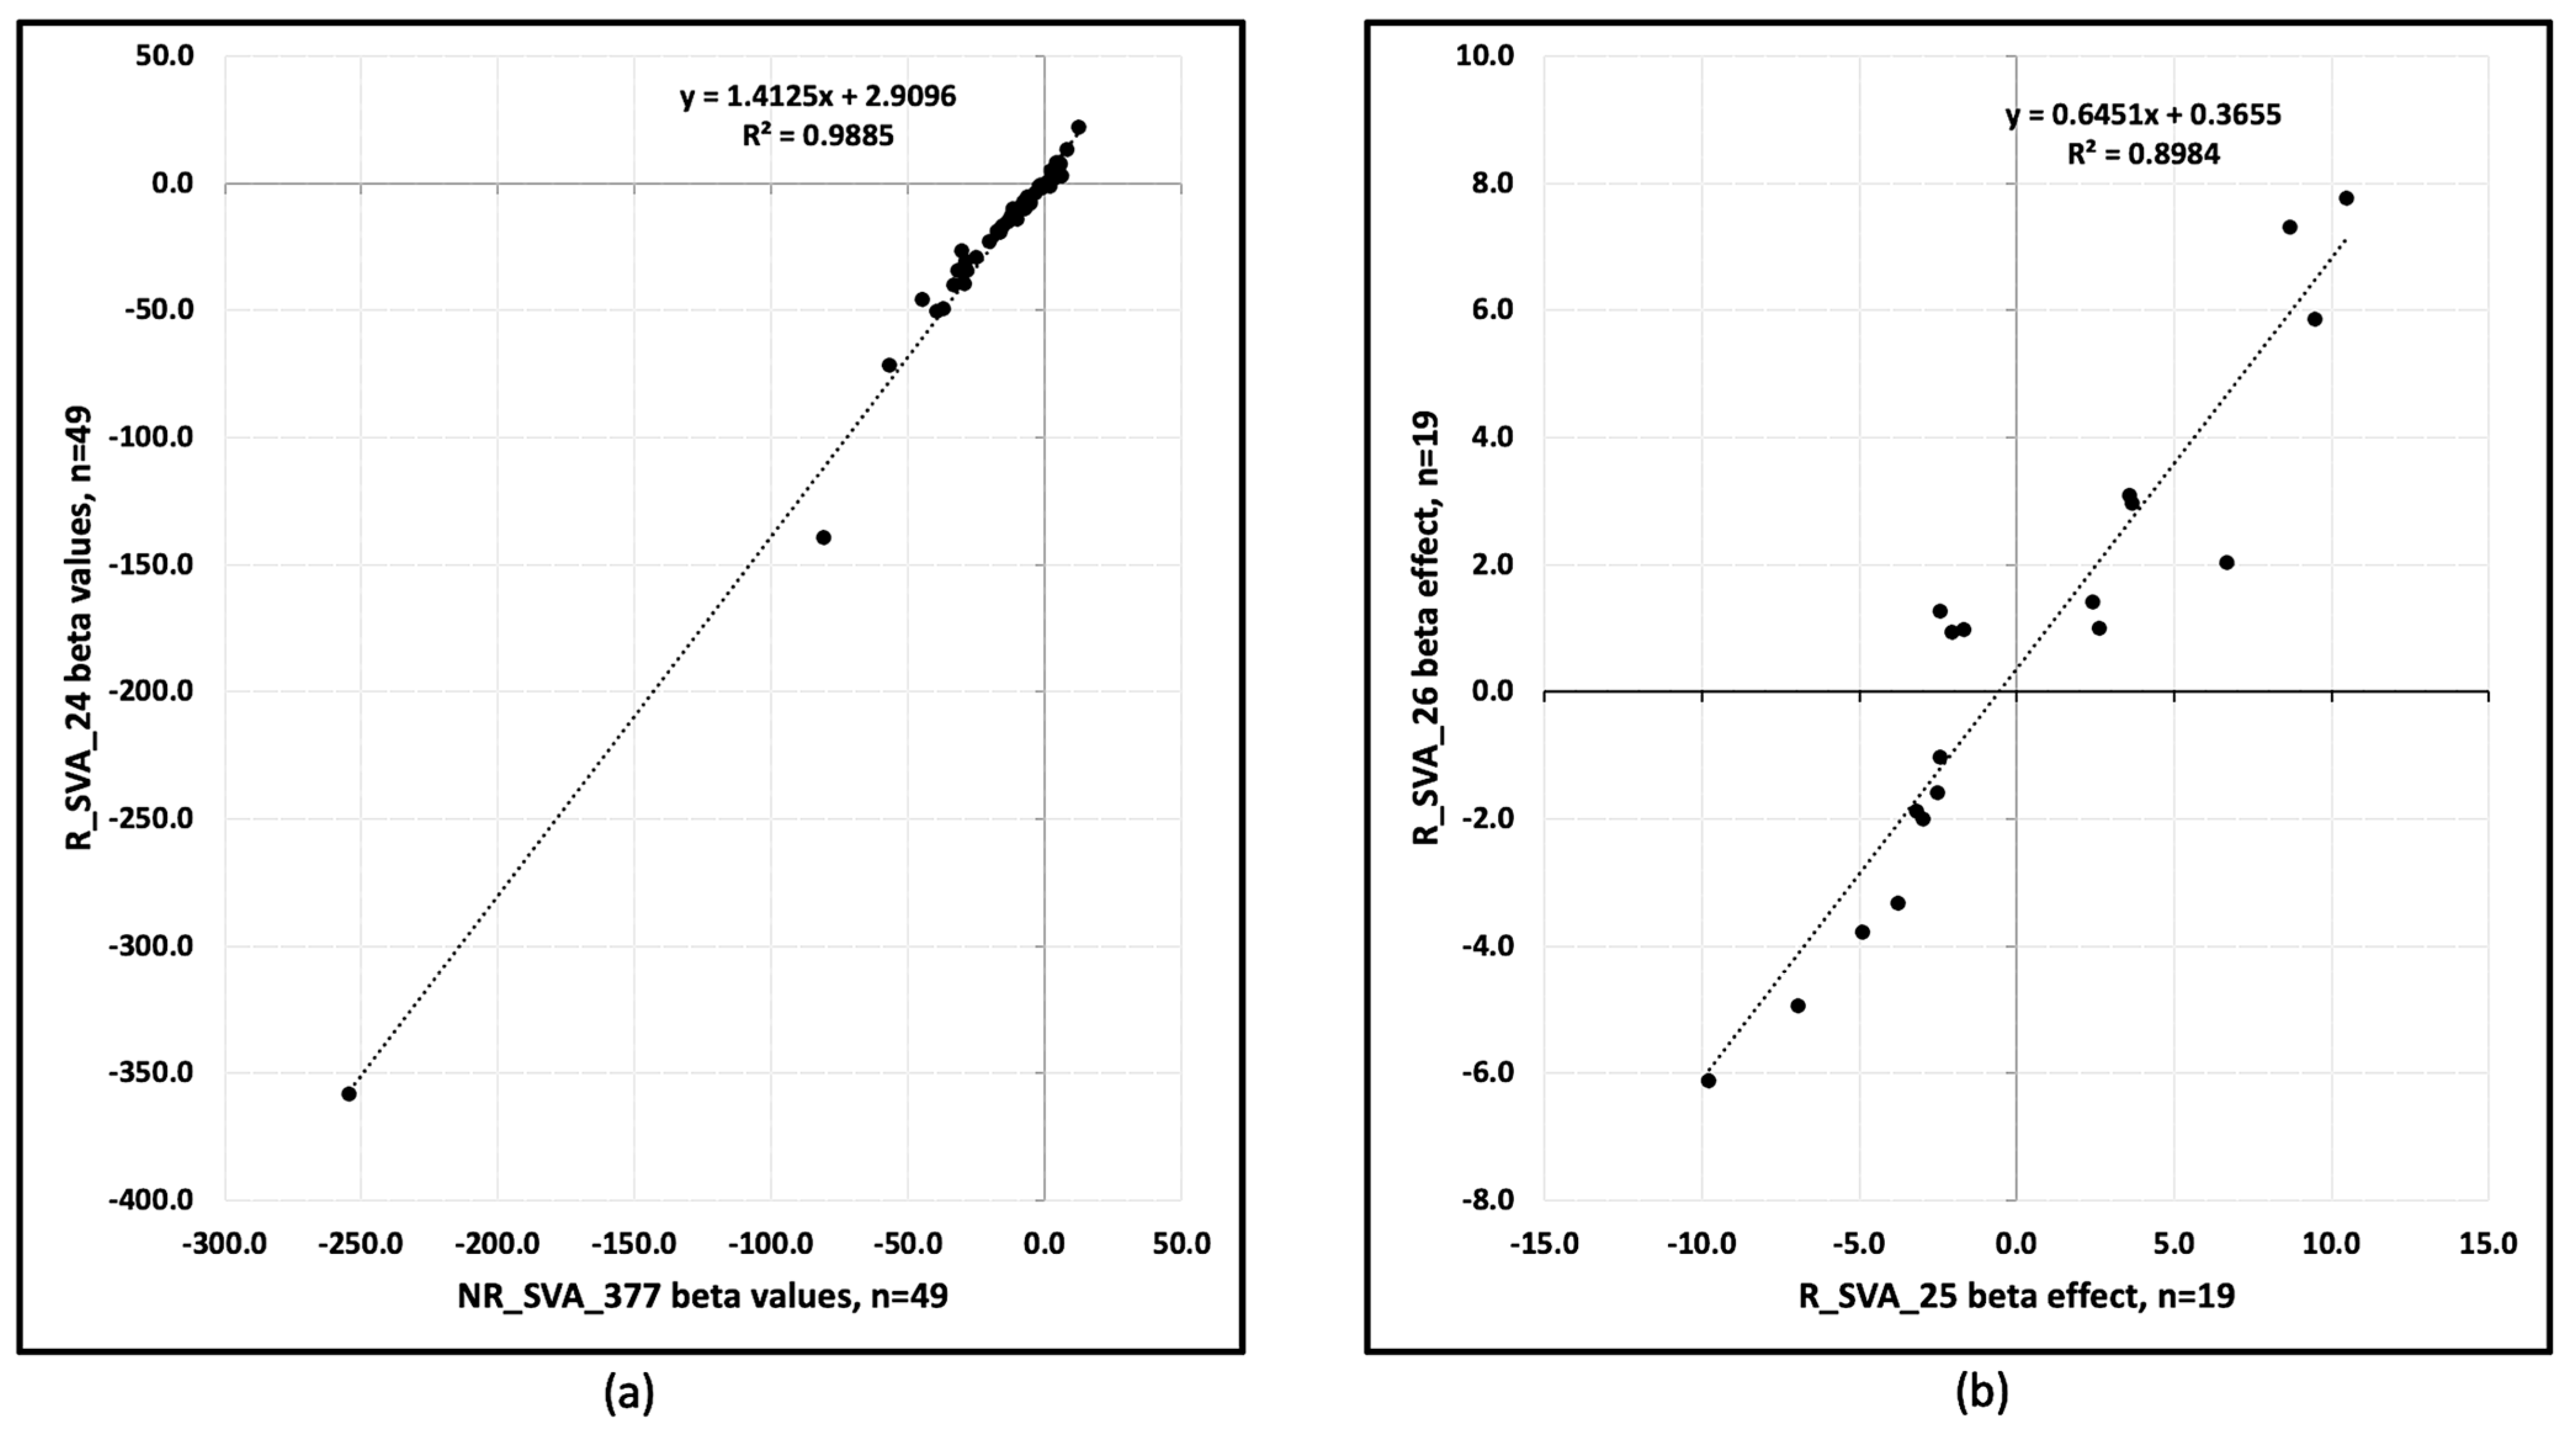
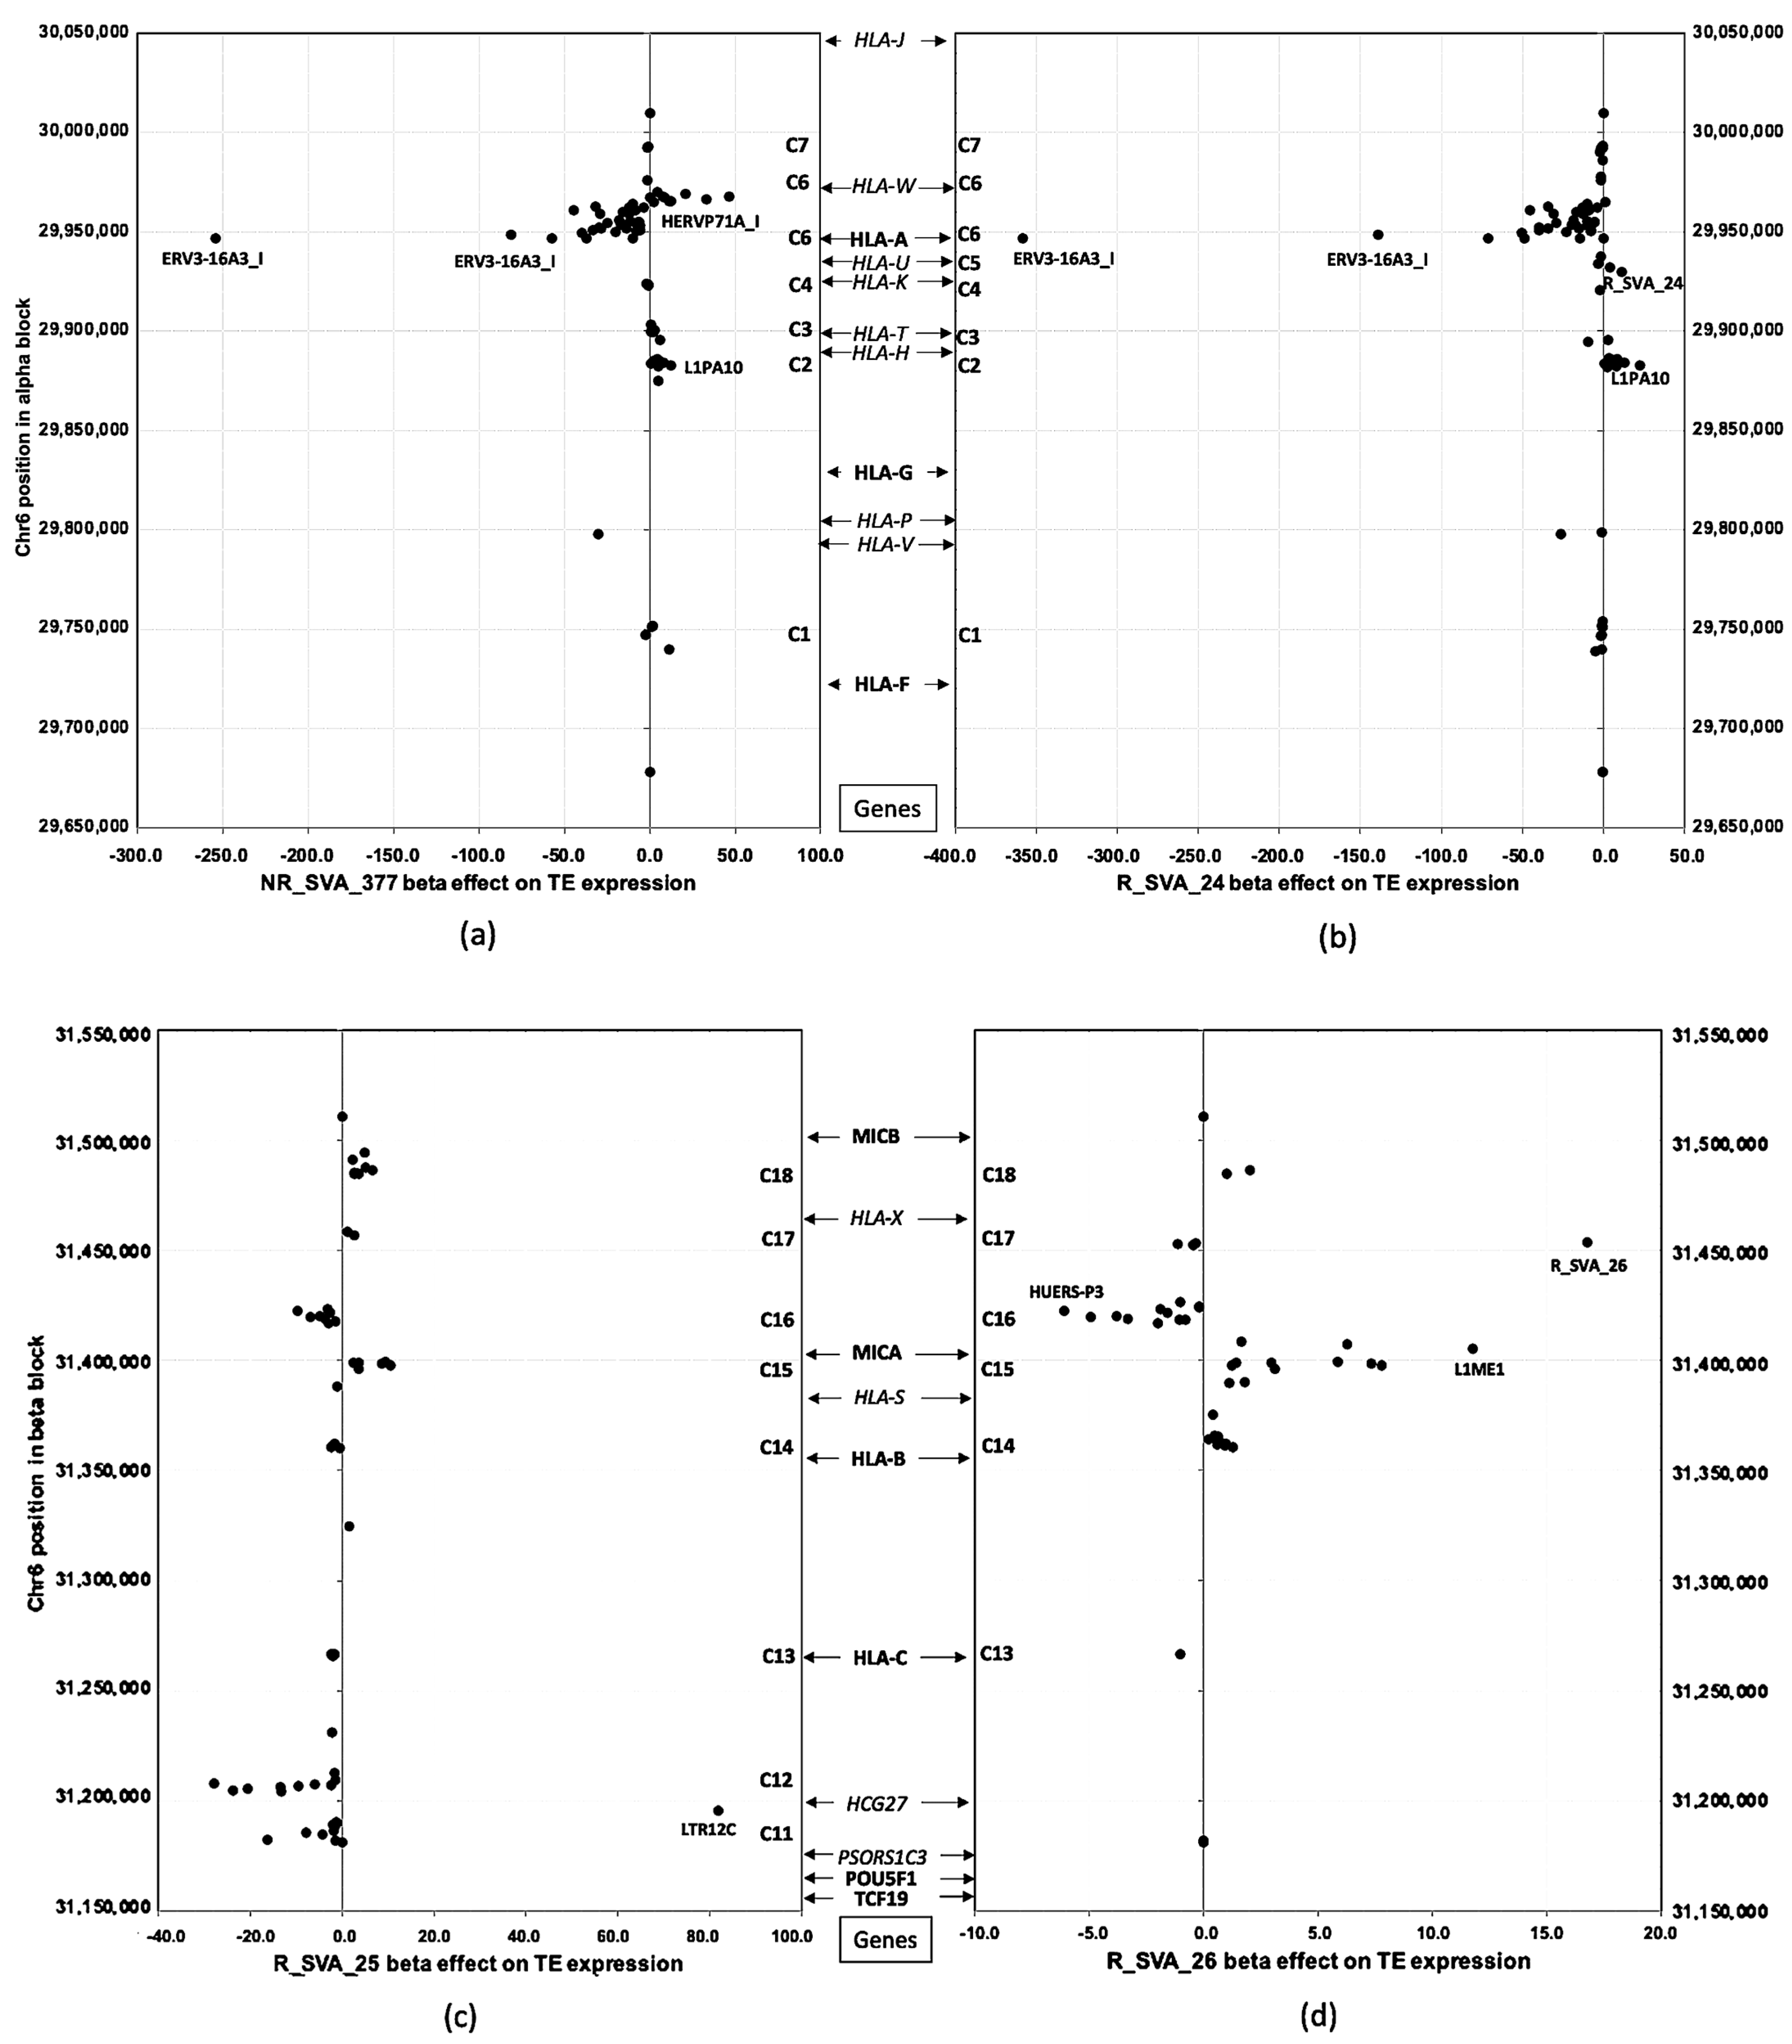
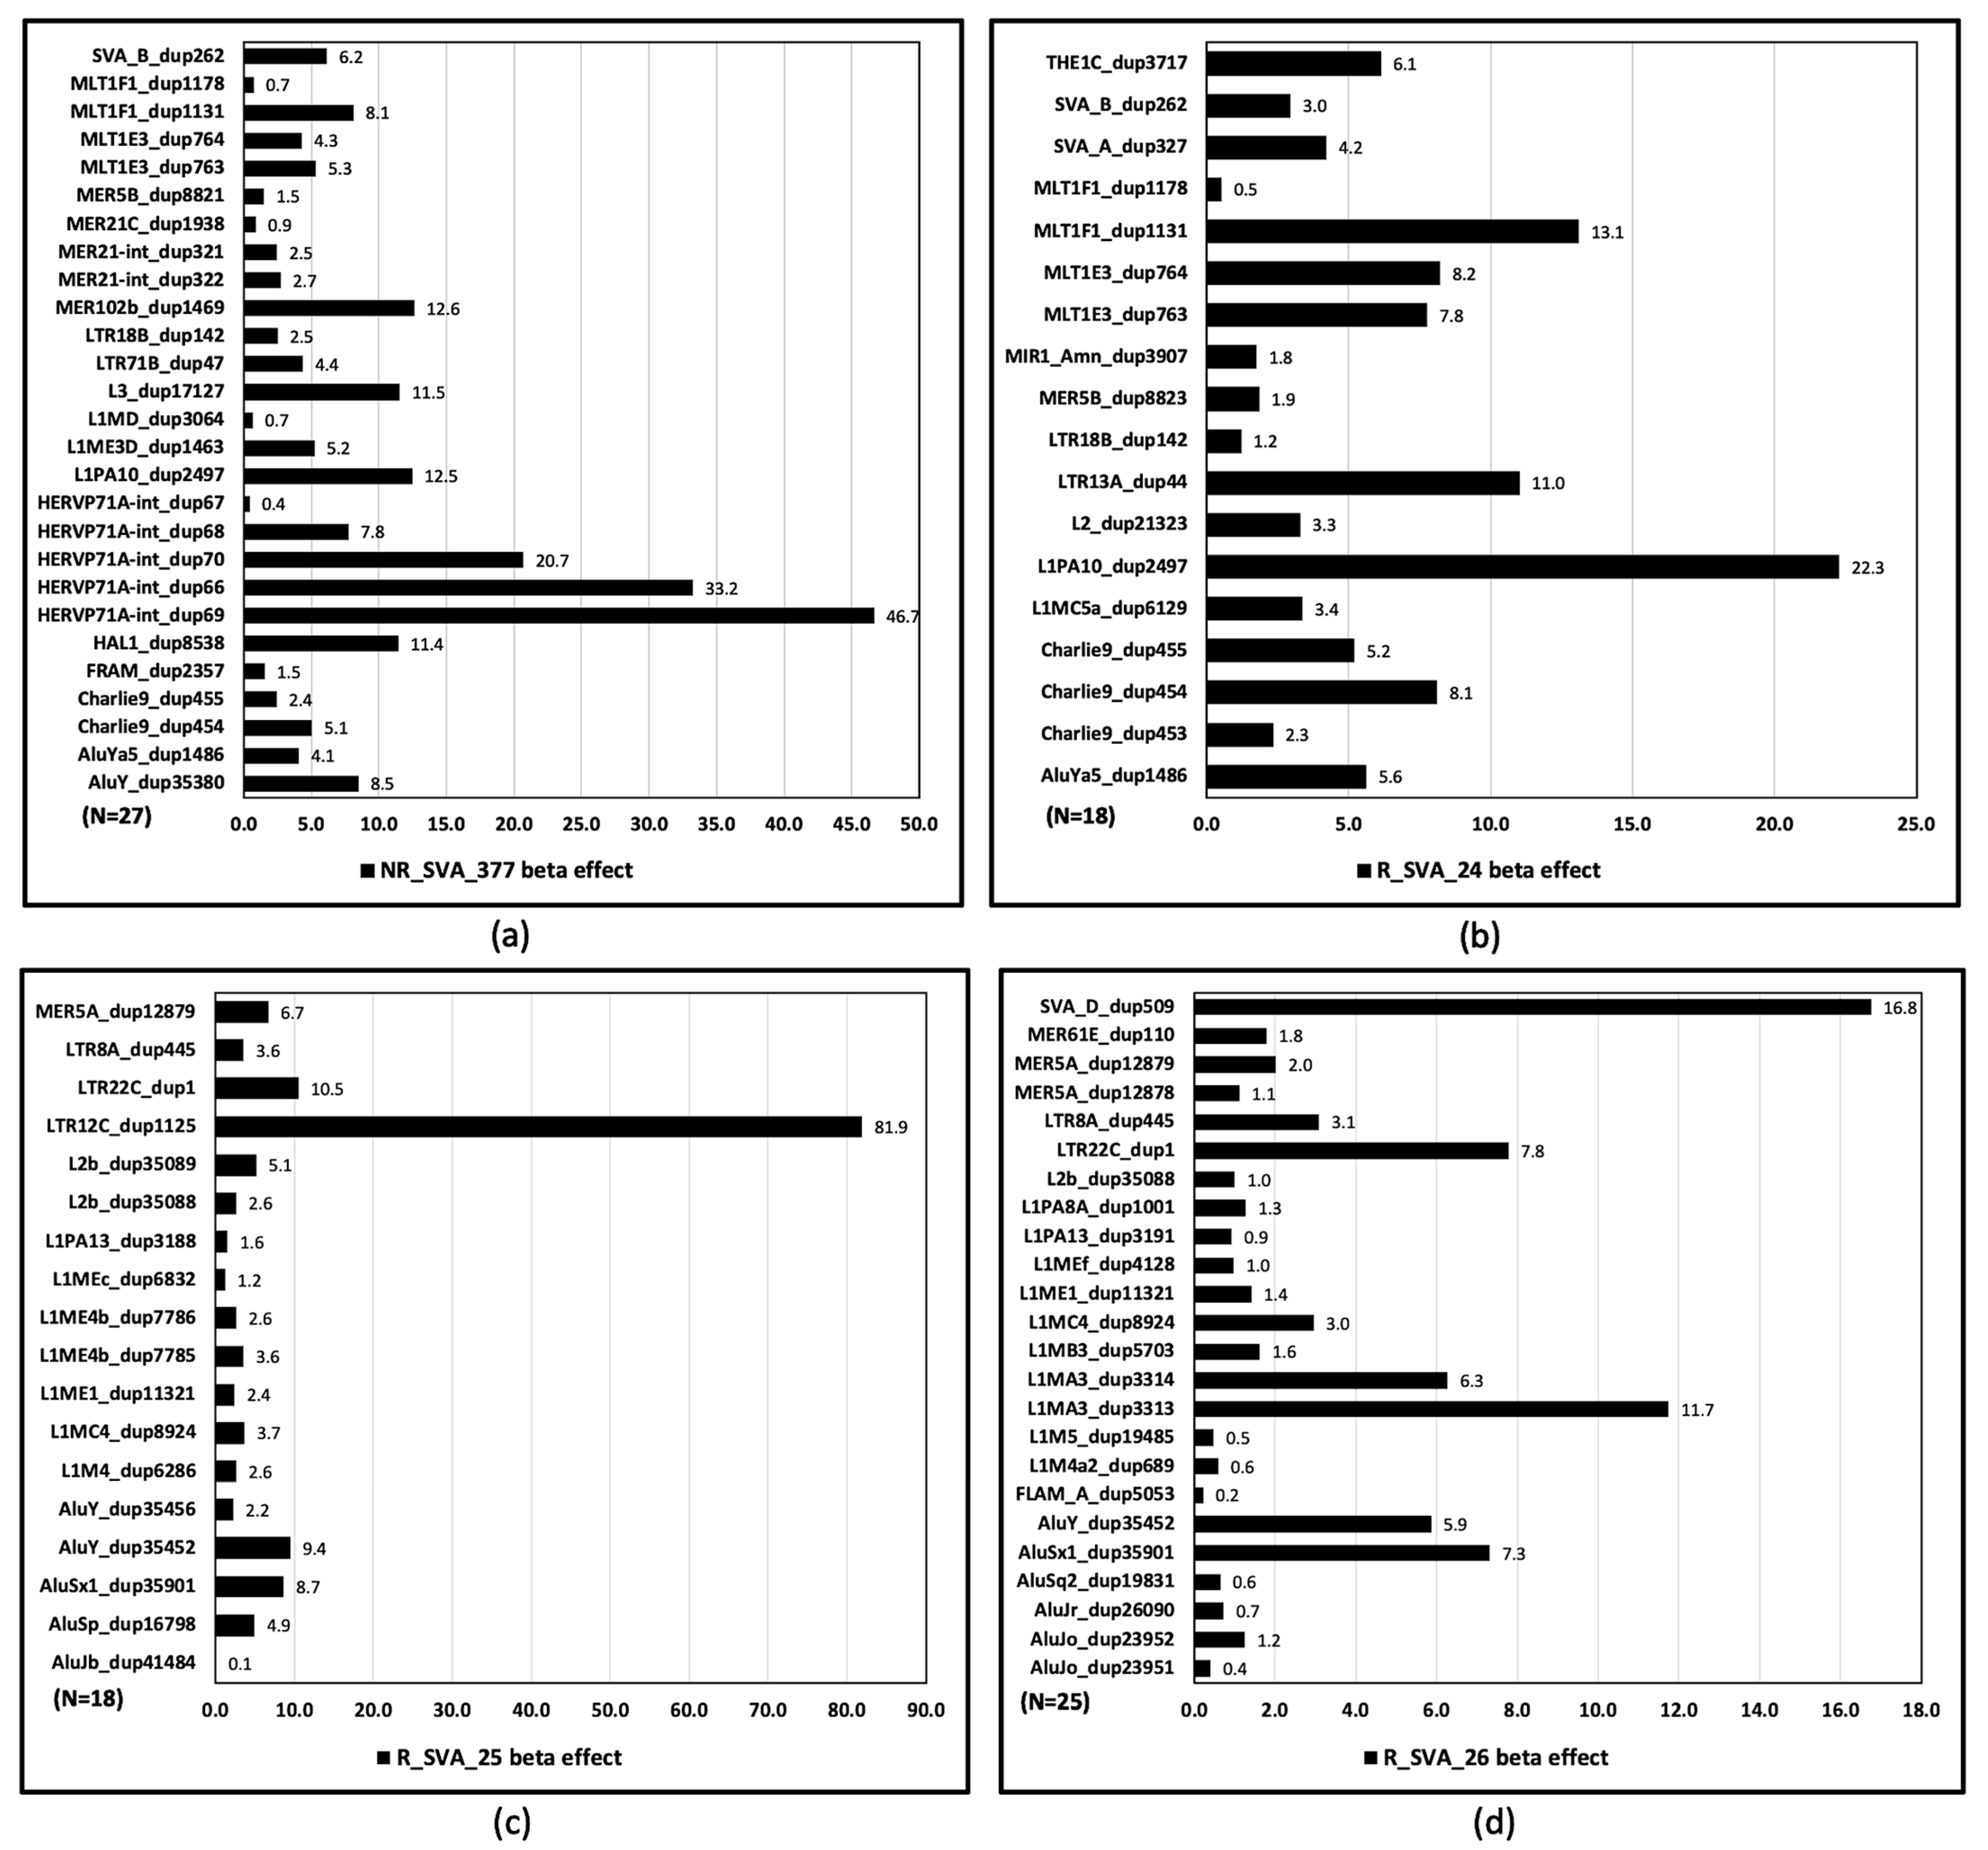
3.4. Beta Regulatory Effects of SVA on Clusters of TE Transcription Within Alpha and Beta Blocks

The differential expression levels of TEs at various loci, as calculated by Matrix eQTL (ver 2.3) software, provided regression coefficients (beta effects) to evaluate the positive or negative regulation of TE transcription by SVAs (Tables S2–S6). A comparison of beta effects between NR_SVA_377 and R_SVA_24, and between R_SVA_25 and R_SVA_26, revealed significant (p < 0.0001) positive linear correlations with R2 values of 0.98 and 0.9, respectively (Figure 6).
Scatter plots of the beta effect sizes versus genomic positions of TE transcription indicate that the regulatory effects of the four SVAs on TE transcription were primarily concentrated within distinct groups or clusters. These clusters include C1 to C8, which corresponds to 11 HLA genes and 90 expressed TE loci within the alpha block spanning from HLA-F to HLA-J; and C11 to C18, which encompasses 4 HLA genes, 2 MIC genes, and 76 expressed TE loci within the beta block (Figure 7).
The largest cluster in the alpha block, C6, consists of 43 TE loci located between the HLA-A gene and the HLA-W pseudogene (Figure 7a,b). This cluster contains diverse TE family members, including Alu, L1, L2, L3, MER30, MER21, MLT1, and MSTA and multiple fragments of Charlie9, ERV3-16A3, and HERVP71A (Tables S2–S6). The TE lengths range from 34 bp (MER30B) to 1864 bp (ERV3-16A3) with an average length of 413 bp. The second-largest cluster, C2, near HLA-H contains nine TE loci, including fragments of Charlie9, L1PA10, MLT1, and a full-length AluYa5 sequence (305 bp). The average length of the TE fragments in C2 is 368 bp.
The two most upregulated TEs in the alpha block were HERVP71A-int_dup69 (beta 46.7) and HERVP71A-int_dup66 (beta 33.2), both upregulated by NR_SVA_377. In contrast, ERV3-16A3_I-int_dup2627 was the most downregulated expressed TE sequence, with beta values of -358.4 and -254.6, regulated by R_SVA_24 and NR_SVA_377, respectively.
Clusters C8 and C10 are on the centromeric side of HLA-J, extending to HCG17, and overlapping with the HLA-L pseudogene within the kappa block (Figure 8). R_SVA_24 downregulated four TEs in C8 (Charlie, FLAM, MLTC, and MIR) near the POLR1H gene and upregulated three TEs in C9 (L1MC5, MER5, and MIR) overlapping with the TRIM26 gene. Cluster C10 is represented by the lncRNA HCG17, which was downregulated by NR_SVA_377, R_SVA_24, and R_SVA_25 (Table S2). This cluster consists of 148 different TE fragments within a 92 kb sequence (Figure 8).
Of the eight TE clusters in the beta block, C16 near MICA is the largest, with seven LINE fragments, three LTRs, two Alus, and one MER20 DNA fragment. Cluster C12, downregulated by R_SVA_25 within the beta block, consists almost exclusively of seven fragmented LTR43 sequences, interrupted by two AluS sequences, AluSx_dup36601 and AluSz_dup32569 (Figure 9). The most upregulated TE in the beta block was LTR12C_dup1125 (beta of 81.9), which is 1544 bp in length and located between PSORS1C3 and HCG27, approximately 72 kb telomeric to HLA-C.
Overall, the four SVAs regulated the expression of TEs at 228 annotated loci (Table 2). NR_SVA_377 and R_SVA_24 regulated the expression of 67 and 72 loci, respectively, with 49 of these loci regulated by both SVAs (Tables S3 and S4). R_SVA_25 and R_SVA_26 regulated the expression of 55 and 40 loci, respectively, with 17 loci regulated by both SVAs (Tables S5 and S6). The number and percentage of the transcribed TE families and classes upregulated or downregulated by the SVAs are shown in Table 6. NR_SVA_377, R_SVA_24, and R_SVA_25 primarily favored the downregulation of 63%, 81%, and 68% of TEs, respectively. In contrast, R_SVA_26 upregulated 60% of the TEs. Figure 10a–d show bar plots of the individual annotated TEs that were upregulated by the SVAs, together with their relative beta effects within the alpha and beta blocks.

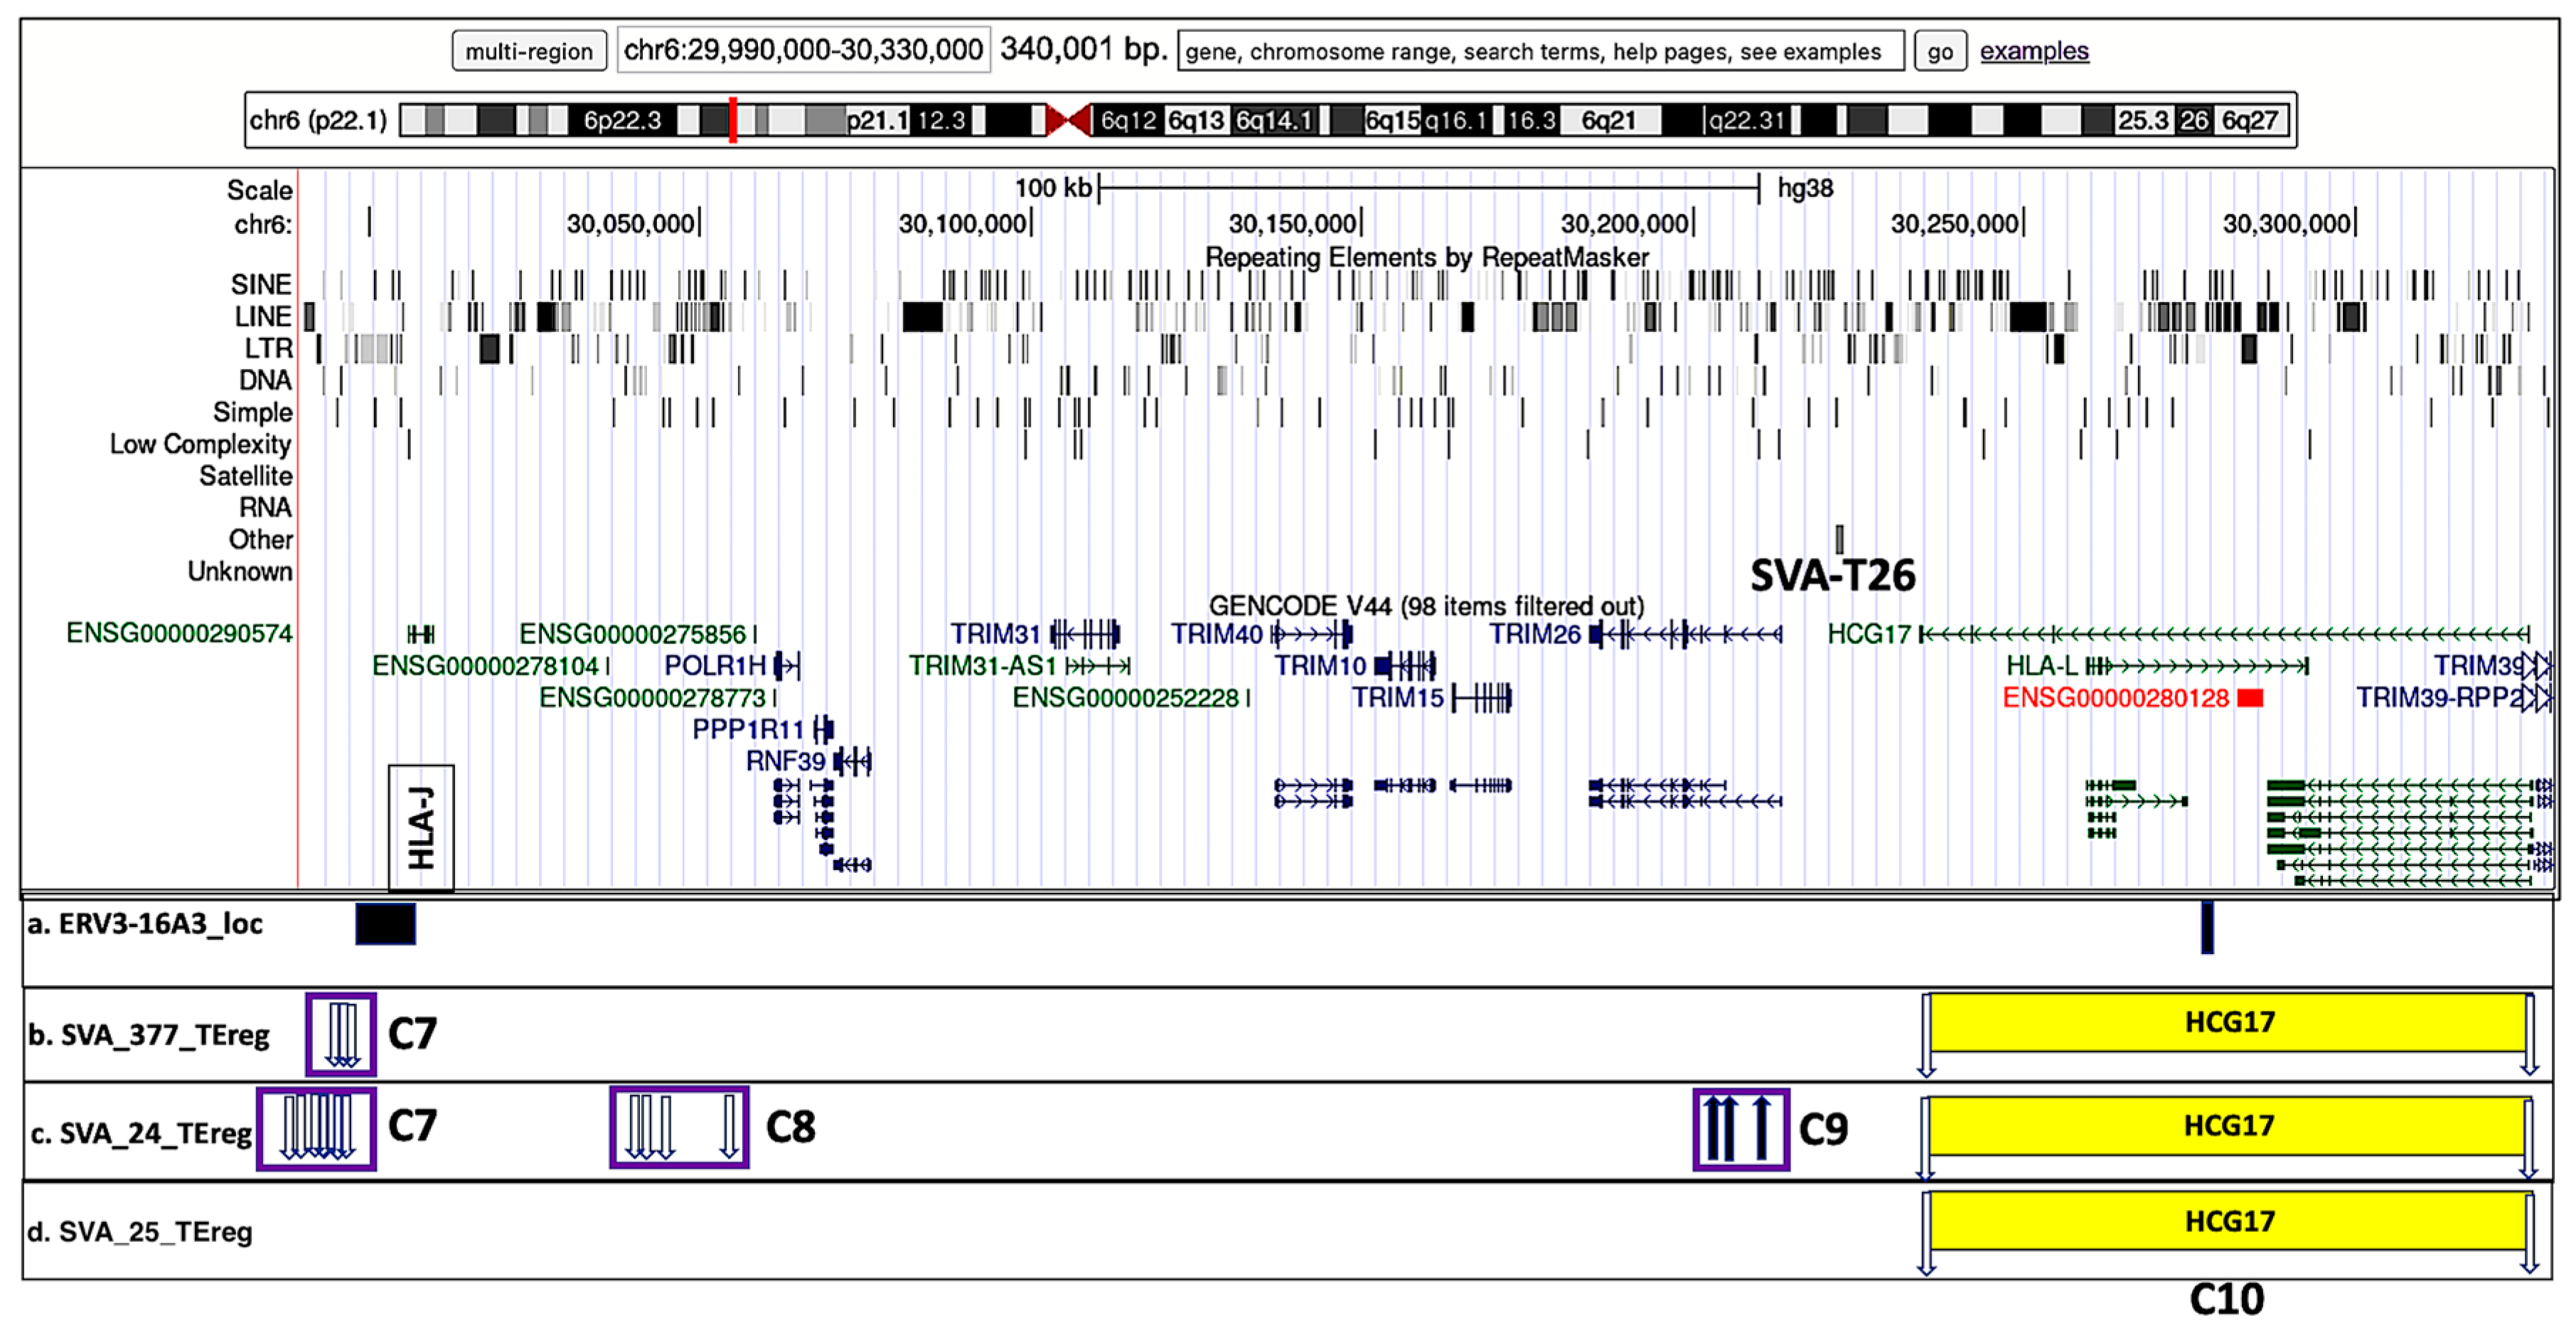
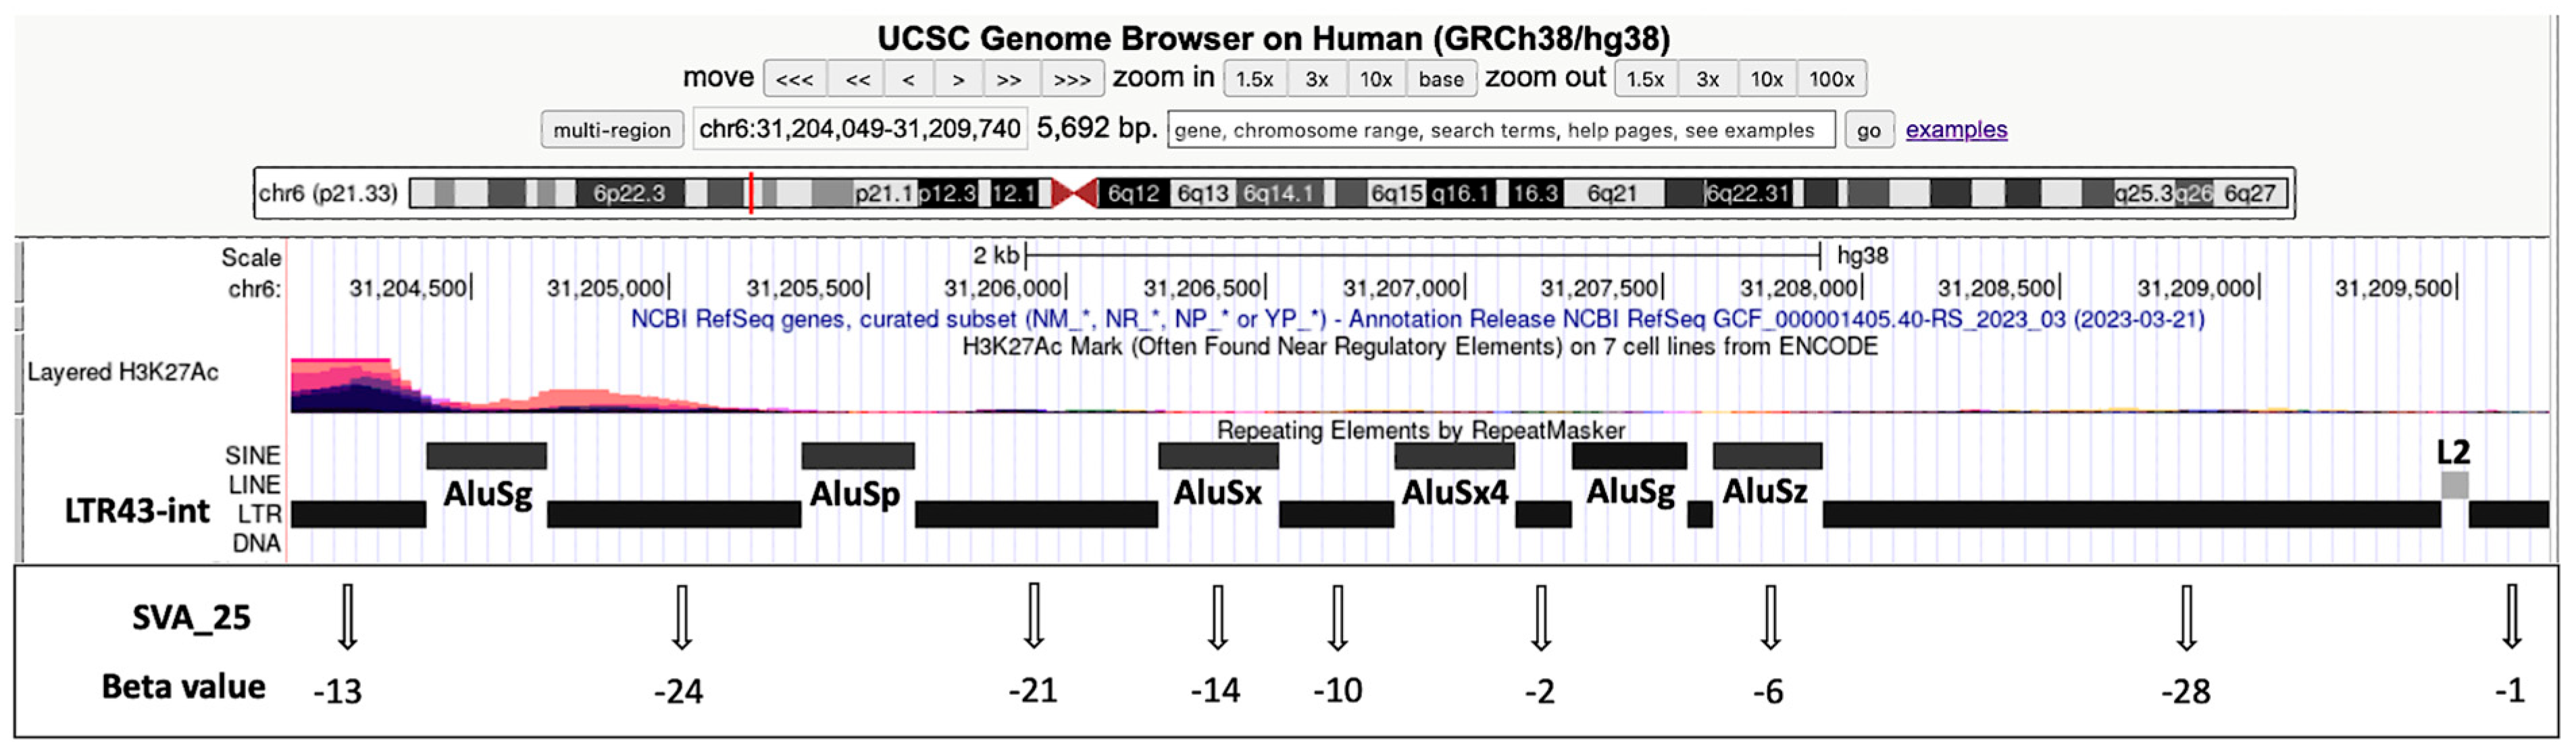
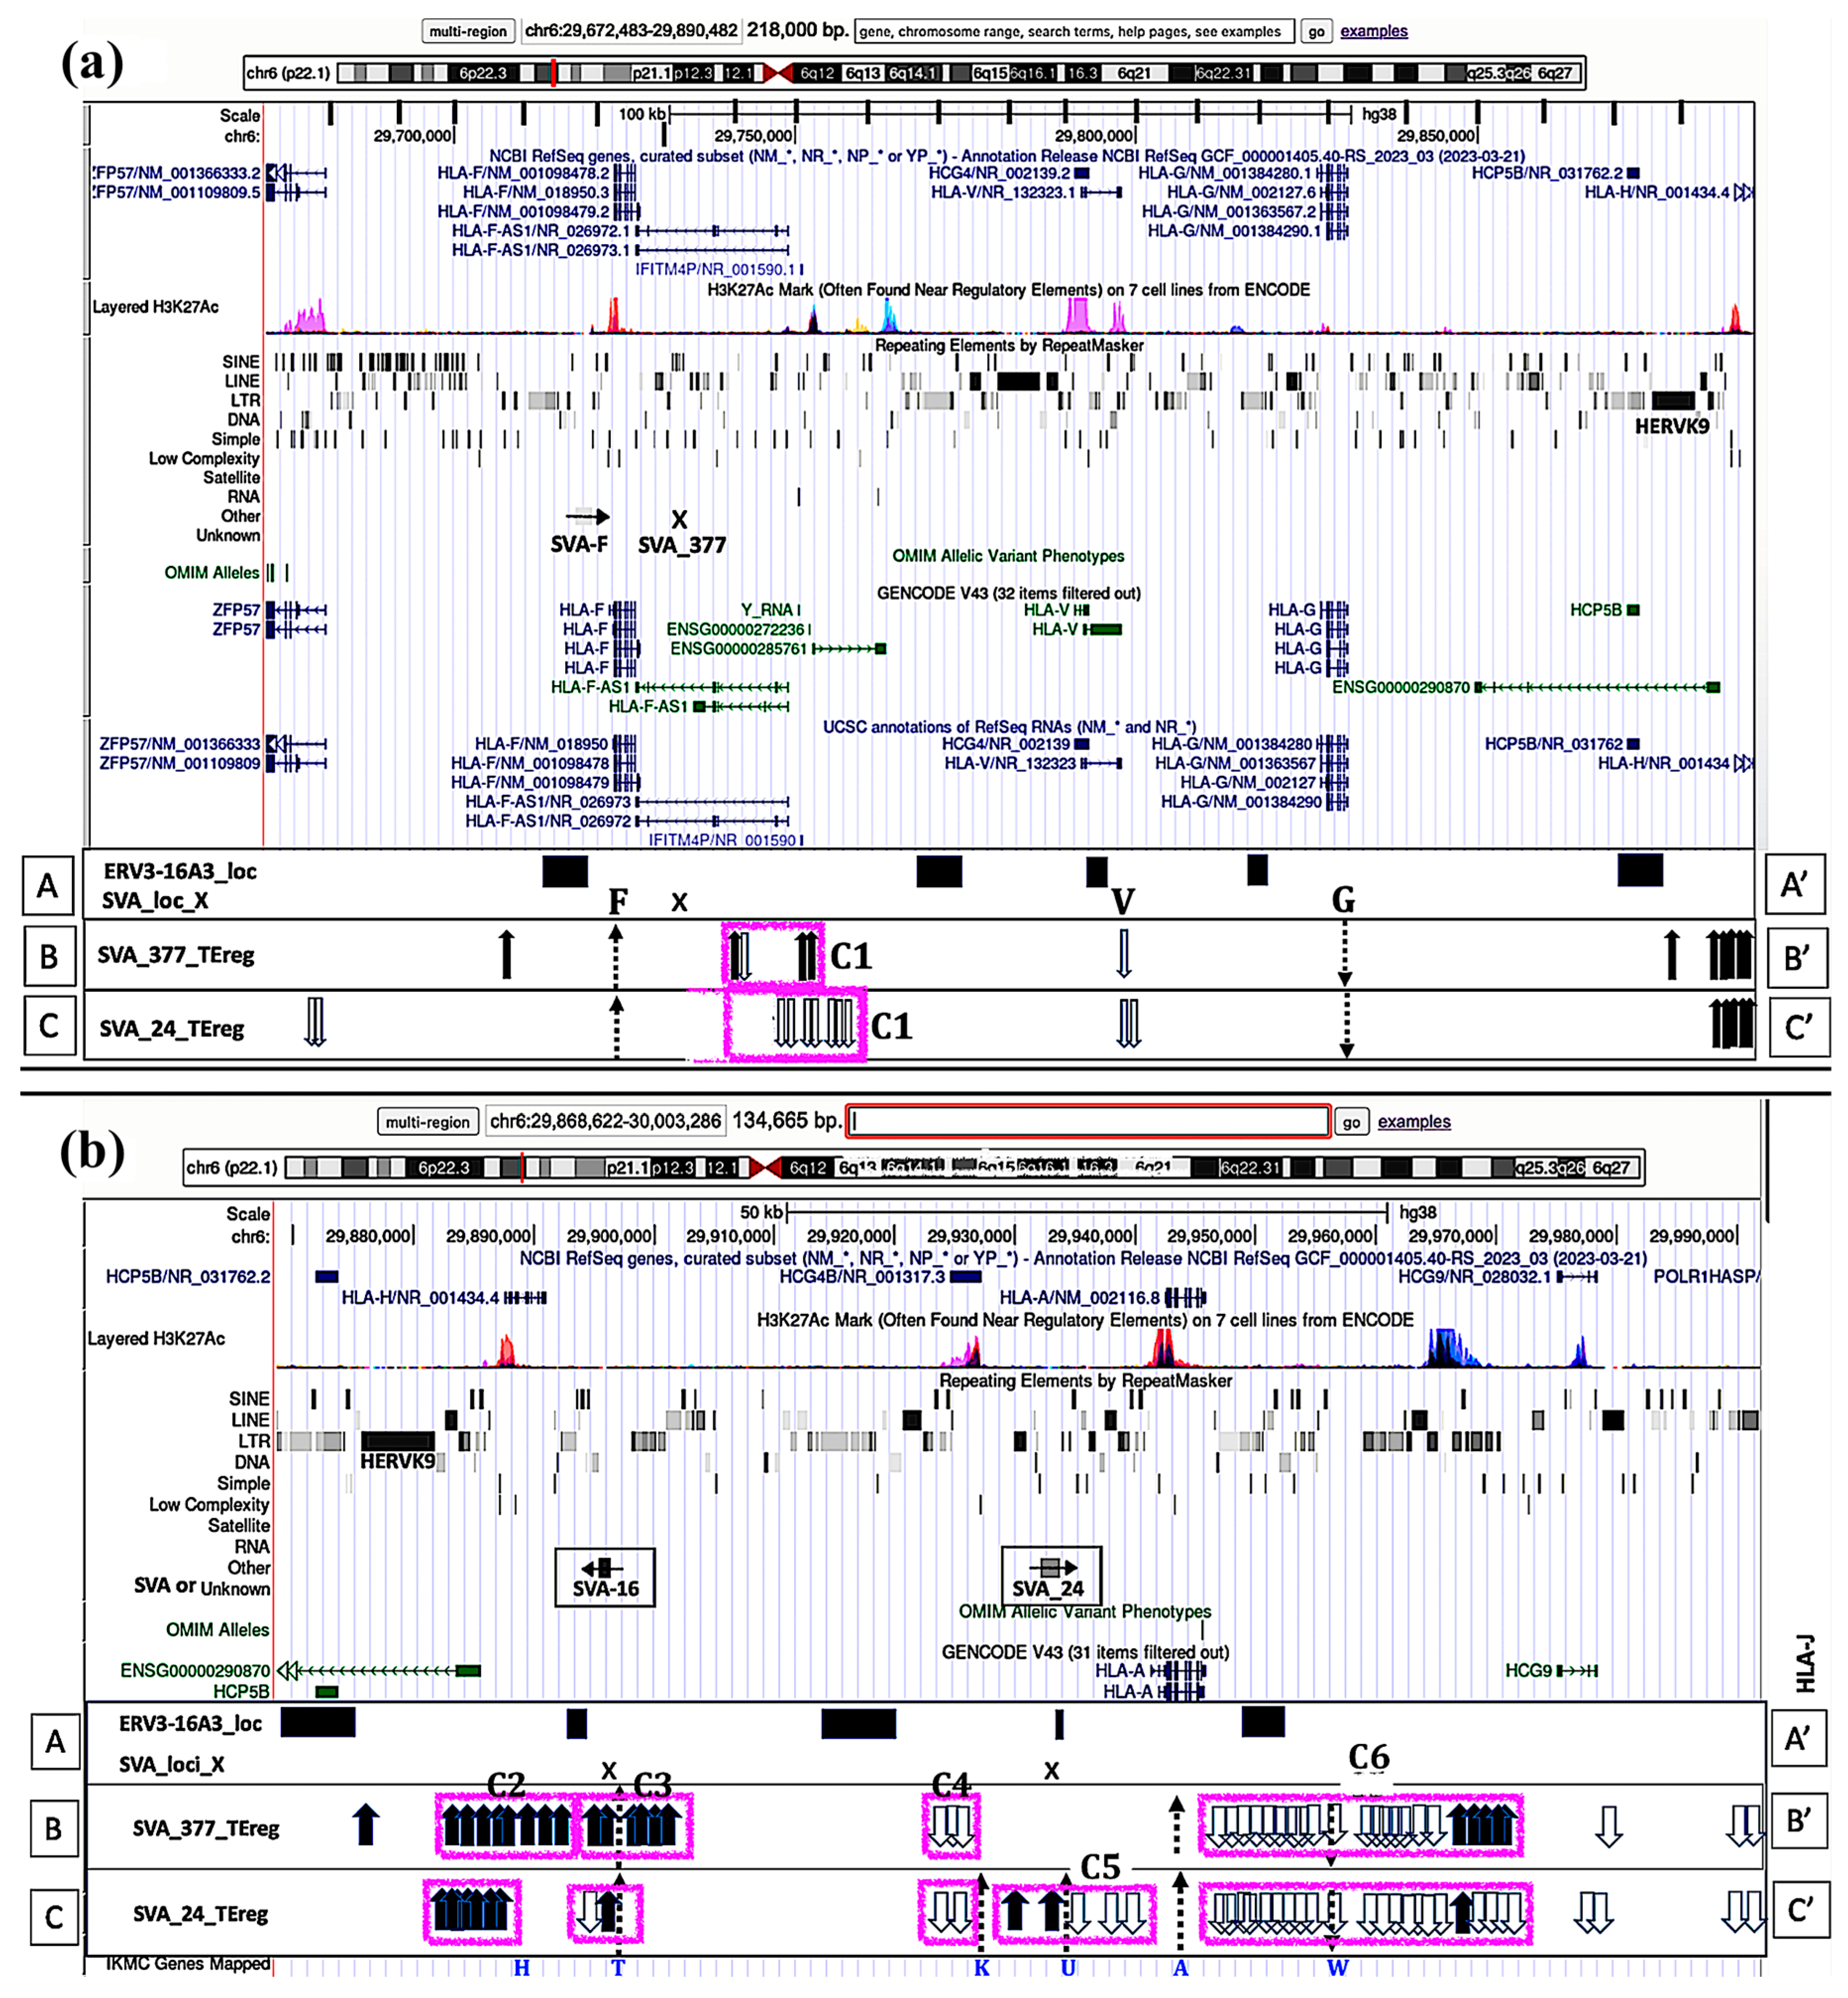
3.5. Visualization of Transcribed TE Clusters and Candidate Cis-Regulatory Elements (cCREs) Using the UCSC GRCh38 Genome Browser

Genomic maps of transcribed TE clusters regulated by the four SVAs were generated using tracked images from the UCSC Genome Browser (University of California, Santa Cruz Genomics Institute) and are shown in Figure 11 and Figure 12. These overlays display the positions of transcribed TE clusters in relation to gene tracks and layered H3K27Ac histone enrichment data from ENCODE, providing insights into the regulatory features of SVA-mediated TE expression within these clusters. The H3K27Ac tracks highlight regions of chromatin associated with active transcriptional regulation and their close proximity to SVA-regulated TE clusters. The expressed TE clusters are highly concentrated near epigenetic cCREs, including enhancer and promoter sites, DNase I hypersensitivity peak clusters, and numerous H3K27Ac regions. Supplementary Figures S1 and S2 provide additional visualizations, and the Genome Browser can be accessed at https://genome.ucsc.edu (accessed 11 September 2024).

4. Discussion

HLA gene duplications facilitated by TE activity during primate evolution have led to the formation of three distinct HLA duplication blocks—alpha, kappa, and beta—interspersed among non-HLA gene clusters within the MHC class I genomic region [25,34,35,36]. Notably, 97% of the total transcription carried out by the eighteen HLA class I genes and pseudogenes in the blood cells of the PPMI cohort originates from the three classical HLA class I genes, HLA-A, -B, and -C, along with the non-classical gene HLA-E (Figure 1).
The four regulatory SVAs—NR_SVA_377, R_SVA_24, R_SVA_25, and R_SVA_26—are strategically located near the highly polymorphic classical HLA genes within the alpha and beta blocks (Figure 2). These SVAs not only regulate the expression of nearby genes and TEs but also influence the kappa block and adjacent regions, impacting the expression of C8 to C10 TEs and their associated genes, POLR1H, PPP1R11, RNF39, TRIM26, HLA-L, HCG17, and TRIM39 (Figure 8). Interestingly, these SVAs appear to exert no regulatory effect on the transcription of TEs near the non-classical HLA-E gene. This gene is characterized by low polymorphism, universal expression, and the presentation of conserved peptides to CD94/NKG2 receptors on natural killer (NK) cells [37]. Additionally, HLA-E is flanked by two distinct SVA insertions, SVA-ER and SVA-EG (Figure 2), whose regulatory functions and expression activities remain to be elucidated [38].
The insertion frequencies of NR_SVA_377, R_SVA_24, R_SVA_25, and R_SVA_26 among the 1266 individuals in the PPMI cohort were previously reported as being 0.12, 0.40, 0.17, and 0.66, respectively [23]. These SVA eQTLs were also found to be differentially associated with specific HLA alleles and haplotypes [24]. For instance, in the alpha block, R_SVA_24 showed strong associations with HLA-A*03, -A*11, and -A*30, while NR_SVA_377 was associated with HLA-A*11 in over 93% of cases. In the beta block, R_SVA_26 demonstrated strong associations with HLA-C*03, -C*07, -C*12, -C*14, -C*15, and -C*18, whereas R_SVA_27 was strongly associated solely with HLA-C*07. Although some expressed HLA and TE loci were co-regulated by multiple SVAs in this study, it is evident that their regulatory effects were largely influenced by their insertion frequencies within distinct MHC haplotypes. Also, differences between the SVAs were evident in the number of affected TE clusters and loci (Table 2 and Table 3). In the alpha block, NR_SVA_377 regulated five TE clusters and 67 TE loci, while R_SVA_24 regulated seven TE clusters and 72 TE loci, with 49 TE loci co-regulated by both SVAs. Similarly, in the beta block, R_SVA_25 regulated eight TE clusters and 55 TE loci, compared to five TE clusters and 40 TE loci regulated by R_SVA_24, with 17 TE loci co-regulated by both of these SVAs.
In a previous study, we found that four polymorphic SVAs regulated the expression of 235 of 1040 (22.6%) TE loci within a 689.2 kb MHC class II region of the GRCh38/hg38 reference genome (chr6:3,2439,887–3,3129,112), spanning HLA-DRA to HLA-DPB2 [16]. The expressed TEs in the MHC class II region were LINEs (37%), SINEs (28%), LTR/ERVs (23%), and DNA elements (12%) with an average size of 389 bp. These loci were grouped into 20 distinct clusters located near various expressed genes. Similarly, in the present study, a different set of four SVA eQTLs regulated the expression of 90 of 431 (20.9%) TE loci in the alpha block and 76 of 568 (13.4%) TE loci in the beta block of the MHC class I region of GRCh38. However, here, the proportion of expressed LTR/ERVs (35%) exceeded that of LINEs (33%) and SINEs (19%), with the average size of the expressed TEs slightly larger at 445 bp. The LTR12, LTR43, MLT, and MST elements were expressed in both the MHC class I and class II regions (present data and [16]). The longest and most numerous LTR/ERV fragments expressed included ERV3-16A3, HERP71A, LTR43, HARLEQUIN, and MER21 (Table 4). Among the 20 expressed DNA elements, 9 Charlie fragments, all expressed in the alpha block, were predominant. Additionally, seven short MER5 sequences (95–177 bp) were expressed in both the alpha and beta blocks, and in intron 1 of the TRIM26 gene, positioned between the alpha and kappa blocks.
Transcribed LTRs, short L1 fragments, and full-length Alu elements are known to possess cell-type-specific enhancer or promoter functions [6,39,40,41]. Therefore, many of the expressed TEs in the MHC class I and class II regions may act as enhancers regulating the expression of genes within or beyond the MHC region. Most of the expressed TEs identified in this study are located near previously characterized regulatory elements, including DNase I hypersensitivity peak cluster sites and numerous H3K27Ac regions (see UCSC genome browser, https://genome.ucsc.edu, accessed 11 September 2024). The transcription of L1 fragments is particularly noteworthy as L1 RNA sequences can influence gene expression, affect genomic stability, and partake in various diseases [8,42,43]. None of the expressed L1 sequences identified in this study were full-length (~6 kb); all were truncated, with an average length of 490 bp, and the majority (67% of 45 L1 fragments) were 3’ fragments. These short 3’ L1 fragments are known to deacetylate histones and suppress gene expression [44]. Only four L1 fragments retained 5’ homology to the first kilobase of the L1 sequence. Additionally, 36 (80%) of the 45 transcribed L1 sequences were located within lncRNA sequences or within the introns of genes, including TRIM26, HLA-B, and MICA. On the other hand, MIR sequences, which function as enhancers and insulators [45], were relatively scarce, with only five expressed in the class I region: four in the alpha block, one in the kappa block, and one in the beta block. Alu RNAs, by contrast, act as epigenetic ribozymes with self-cleaving activity during T-cell activation and in response to heat or endoplasmic reticulum stress [46]. Some Alu RNAs may also function as rapid-acting enhancer RNAs or transcriptional switches [47,48,49,50].
We used blood RNA datasets from the PPMI cohort to analyze correlations between SVA eQTLs and the expression of HLA genes and TEs. The expressed TE RNAs in blood cells appear to function as enhancer-like elements, differentially coordinating the regulation of highly polymorphic HLA class I genes such as HLA-A, -B, and -C, which are critical for diverse antigen presentation to CD8+ cytotoxic T cells. In a previous study, we observed significant, albeit limited, associations between specific HLA class I alleles and SVA genotypes, as well as differential HLA and SVA profiles between individuals with PD and healthy controls [24]. For instance, HLA-A*31:01, -A*24:02, -C*07:01, -B*38:01, -B*40:02, and R_SVA_25 were significantly associated (p < 0.05, Fisher’s exact test) with certain PPMI subgroups compared to healthy controls, whereas NR_SVA_377, R_SVA_24, and R_SVA_26 showed no significant associations. The current PPMI cohort size (1530 individuals), however, provides limited statistical power to effectively stratify analyses by disease subgroups, TE loci, and SVA insertion frequencies. Future studies with large sample sizes are necessary to determine whether the HLA alleles associated with PD also correlate with specific TE expression markers. Another limitation of relying solely on the PPMI cohort is that the observed effects may not be representative of other populations. The HLA region is highly polymorphic and structurally complex, presenting challenges in accurately mapping and interpreting TE-related findings. Additionally, genetic variation in the HLA region, environmental exposures, and other factors could influence the expression of individual HLA alleles, SVA insertions, and co-expressed TE loci to potentially confound the observed associations. Nevertheless, both this and our previous study [16] represent a pioneering investigation into the effects of SVA on TE expression within the MHC genomic region of blood cells. Future research should replicate these findings in diverse populations, employ functional approaches to validate the results, and delve deeper into the underlying molecular mechanisms.
An important question remains largely unanswered: do these TE expressions have a direct role in human health and diseases such as PD, or are they merely ancillary to the more critical expressions of HLA and non-HLA genes within the MHC genomic region? Recent studies suggest that some expressed TEs may be translated into short peptides that act as immunogens [10,12,43]. If so, some of the expressed TEs identified in our study could be immunogenic. TE expression in blood cells and normal tissues is typically low, with some TEs falling below the detection threshold of RNA sequencing techniques [10]. However, high levels of TE expression are observed in gametes, stressed cells, and cancers, with the highest expression found in medullary thymic epithelial cells. This high expression in the thymus suggests a potential self-tolerance mechanism for immunogenic TEs [10]. Moreover, transcripts from certain TEs, including Alu, L1, and various LTR/ERV sequences, can produce short immunogenic peptides that become part of the immunopeptidome. These TE peptides bind to HLA class I molecules and are presented to circulating immune cells. In this context, the expressed TE loci may be considered part of the human endogenous viriome [11,14,51,52]. This implies that the MHC system not only regulates TE expression but also interacts with the endogenous viriome in ways that have yet to be resolved [13].
While NR_SVA_377, R_SVA_24, R_SVA_25, and R_SVA_26 can regulate the expression of classical HLA class I genes directly or indirectly [23,24,29], these SVAs also modulate the expression of non-HLA genes (e.g., GABBR1, ZFP57, POLR1H, PPP1R11, PAIP1P1, POU5F1, MICA, MICB, DDX39B, DDAH2) and several lncRNAs (e.g., HLA-F-AS1, HCG17, HCP5, HCP5B, HCG4B, MICB-DT, LINC01149). NR_SVA_377 and R_SVA_25 appear to upregulate four TEs (HAL1, AluY, MER5B, and FRAM) within the C1 cluster and the HLA-F-AS1 lncRNA sequence (Figure 11). Variants of the HLA-F-AS1 sequence have been strongly associated with the onset of acute graft-versus-host disease (aGVHD) in Japanese unrelated bone marrow transplantation patients [53]. Additionally, HLA-F-AS1 expression has been linked to the production and migration of macrophages via intermediates such as microRNA and profilin 1 in colorectal cancer [54,55]. Thus, the role of HLA-F-AS1 in the MHC represents an alternative immune response, distinct from the antigen presentation system mediated by HLA molecules and their associated antigenic peptides.
The regulatory influence of R_SVA_24 on the HLA-A gene and TE expression within the alpha block [23,24,29] extends into the kappa block and adjacent regions, affecting the expression of TEs in C8 to C10 and their proximal genes, including POLR1H, PPP1R11, RNF39, TRIM26, HLA-L, HCG17, and TRIM39 (Figure 8). R_SVA_24 downregulated four C8 TEs (Charlie, FLAM, MLTC, and MIR) near the POLR1H gene, and upregulated three C9 TEs (L1MC5, MER5, and MIR) overlapping with the TRIM26 gene. POLR1H (alias ZNRD1) contains two zinc-binding motifs and is implicated in cancer progression and viral immunity [56,57]. TRIM26 appears to have antiviral and antifungal functions, potentially interconnected with HLA genes, TE expression, and other regulatory mechanisms involving intermolecular cross talk [58,59,60]. The strong downregulation of the 92 kb HCG17 lncRNA sequence by NR_SVA_377, R_SVA_24, and R_SVA_25 is particularly noteworthy because this sequence consists of 143 TEs, including SINEs, LINEs, LTRs, and DNA elements (Supplementary Table S7). Moreover, HCG17 single-nucleotide variants have been associated with liver cancers [61].
The strongest TE upregulation in the beta block was for LTR12C_dup1125 (beta value of 81.9). This 1544 bp LTR, upregulated by R_SVA_25, is located between PSORS1C3 and HCG27, approximately 72 kb telomeric to HLA-C. The differential expression of the HCG27 lncRNA has been associated with pemphigus, independent of HLA alleles [62], while PSORS1C3, which can be upregulated by glucocorticoids, has been associated with various immune-related diseases including psoriasis [63,64]. Although the role of the LTR12 in proximity to PSORS1C3 and HCG27 is unclear, LTR12 sequences are known to exert significant promoter and immunoregulatory effects in the MHC and other genomic regions, influencing immune-related diseases and cancer progression [11,52,65].
The reliability of TE annotation and locus identification in the human genome is a significant challenge, primarily due to the vast number of TE sequences that need to be identified, classified, and annotated [2,3,9,10,66]. In this study, we used a TE genomic annotation file designed for the TEtranscripts software package v2.2.3 [67] to assign unique TE IDs (e.g., AluSx3_dup10815, AluSx1_dup35983; see Table S2) to each annotated TE RNA sequence. This facilitates the cross-referencing of individual TEs between this and other RNA sequencing studies, potentially providing a reliable method of TE annotation and comparative genomic analysis. The experimental induction of TE expression in cell lines could further validate the utility and robustness of the TE annotations and ID GTF file prepared by the Hammell laboratory (available at https://labshare.cshl.edu/shares/mhammelllab/www-data/TEtranscripts/TE_GTF/, accessed 11 September 2024).
For comparative purposes, it is noteworthy that our current study shares similarities with our previous report [16], which found that four polymorphic SVA eQTLs regulated the expression of 235 of 1040 (22.6%) TE loci within a 689.2 kb MHC class II region of the GRCh38/hg38 reference genome (chr6:32439887-33129112) spanning HLA-DRA to HLA-DPB2. While both studies investigated the regulation of TEs by expressed SVA eQTLs, they are distinct in their focus on different regions of the MHC genomic landscape [19]. Specifically, the current study investigated the transcriptional regulation of TEs by SVA eQTLs within the MHC class I region, which is separated from the class II region by approximately 201 kb of the MHC class III region. Although some methodological and presentational overlap (e.g., figures and analyses) is inevitable due to the shared research framework, the genomic regions analyzed and the resulting findings are unique to each study. This distinction aligns with the broader goal of systematically dissecting the regulatory roles of SVA eQTLs across the entire MHC region, with each study contributing to a more comprehensive understanding of this complex genomic landscape [19]. Furthermore, much work remains to be conducted to validate or refute our hypotheses regarding the expression and regulatory roles of TE RNAs within the MHC. TE RNA sequencing data do not capture critical aspects of TE activity, such as post-transcriptional modifications, regulatory mechanisms, or differences in chromatin accessibility. To address these limitations, functional validation is needed, potentially using experimental tools such as CRISPR-based editing or reporter assays in cell lines. For example, one approach could involve deleting an SVA using the CRISPR-Cas9 system, measuring the expression levels of TEs presumably regulated by the SVA eQTL, and comparing these levels before and after the deletion [68]. Alternatively, previously described homozygous cell lines with distinct SVA genotypes within the MHC genomic region could be employed to explore these regulatory relationships in more detail [38].
In conclusion, this study has confirmed that four structurally polymorphic SVA eQTLs within the class I region of the MHC have differential effects on the transcription of TE loci and lncRNA loci, as well as HLA and non-HLA gene expression. These findings suggest that SVAs and their associated TEs may play a pivotal role in the intricate regulatory networks governing both coding and noncoding gene expression in the MHC class I genomic region of blood cells, potentially influencing immune function, health, and disease susceptibility.

Supplementary Materials

The following supporting information can be downloaded at https://www.mdpi.com/article/10.3390/jmp6010001/s1, Figure S1: Genomic map of expressed TE clustered loci C1 to C8 relative to gene loci and various regulatory elements within the MHC alpha block ranging from HLA-F to HLA-J; Figure S2: Genomic map of expressed TE clustered loci C11 to C18 relative to gene loci and various regulatory elements within the MHC beta block ranging from POU5F to MICB; Table S1: HLA genes regulated by structurally polymorphic SVA in the MHC class I genomic region; Table S2: SVA regulation (beta) of transposable element (TE) targets in MHC class I region genomic alpha, beta, and kappa blocks; Table S3: Sixty-seven transcribed TE loci regulated (beta value) by NR_SVA_377, and 49 co-regulated with R_SVA_24 within the alpha block (HLA-F to HLA-J); Table S4: Seventy-two transcribed TE loci regulated (beta value) by R_SVA_24, and 49 co-regulated with NR_SVA_377 within the alpha block (HLA-F to HLA-J); Table S5: Fifty-five transcribed TE loci regulated (beta value) by R_SVA_25, and 17 co-regulated with R_SVA_26 within the beta block from PSORS1C3 lncRNA to MICB; Table S6: Forty transcribed TE loci regulated (beta value) by R_SVA_26, and 17 co-regulated with R_SVA_25 within the beta block from PSORS1C3 lncRNA to MICB; Table S7: RepeatMasker output of repeat elements within the HCG17 lncRNA sequence chr6:chr6:30234039–30326133 (92,095 bp).

Author Contributions

J.K.K. performed analyses and prepared figures, tables, and the text for the draft manuscript. S.K. performed analyses and provided the overall genomic datasets. A.L.P. generated the SVA genotype data from the PPMI cohort. All authors have read and agreed to the published version of the manuscript.

Funding

AP and SK are funded by MSWA and the Perron Institute for Neurological and Translational Science. This work was supported by resources provided by the Pawsey Supercomputing Centre with funding from the Australian Government and the Government of Western Australia. PPMI—a public–private partnership—is funded by the Michael J. Fox Foundation for Parkinson’s Research and funding partners, including 4D Pharma, Abbvie, AcureX, Allergan, Amathus Therapeutics, Aligning Science Across Parkinson’s, AskBio, Avid Radiopharmaceuticals, BIAL, BioArctic, Biogen, Biohaven, BioLegend, BlueRock Therapeutics, Bristol-Myers Squibb, Calico Labs, Capsida Biotherapeutics, Celgene, Cerevel Therapeutics, Coave Therapeutics, DaCapo Brainscience, Denali, Edmond J. Safra Foundation, Eli Lilly, Gain Therapeutics, GE HealthCare, Genentech, GSK, Golub Capital, Handl Therapeutics, Insitro, Jazz Pharmaceuticals, Johnson & Johnson Innovative Medicine, Lundbeck, Merck, Meso Scale Discovery, Mission Therapeutics, Neurocrine Biosciences, Neuron23, Neuropore, Pfizer, Piramal, Prevail Therapeutics, Roche, Sanofi, Servier, Sun Pharma Advanced Research Company, Takeda, Teva, UCB, Vanqua Bio, Verily, and Voyager v. 25MAR2024.

Institutional Review Board Statement

The studies involving humans were approved by the University of Western Australia Human Research Ethics Office (RA/4/0/5595, 24 July 2019). The studies were conducted in accordance with the local legislation and institutional requirements.

Informed Consent Statement

The participants in the Parkinson’s Progression Markers Initiative (PPMI) database provided their written informed consent to participate in this and other international studies. For up-to-date information on the study, visit www.ppmi-info.org (accessed 20 November 2024). PPMI is sponsored and partially funded by The Michael J. Fox Foundation for Parkinson’s Research.

Data Availability Statement

Data used in the preparation of this article were obtained from the Parkinson’s Progression Markers Initiative (PPMI) database [(www.ppmi-info.org/access-dataspecimens/download-data, RRID:SCR 006431, URL (accessed on 10 May 2023)]. For up-to-date information on the study, visit www.ppmi-info.org (accessed 9 September 2024). The original contributions presented in the study are included in the article/Supplementary Materials. This analysis used data openly available from PPMI and also whole-genome and RNA sequencing data, obtained from PPMI upon request. Further inquiries can be directed to the corresponding author.

Conflicts of Interest

The authors declare no conflicts of interest.

References

  1. De Koning, A.P.J.; Gu, W.; Castoe, T.A.; Batzer, M.A.; Pollock, D.D. Repetitive Elements May Comprise Over Two-Thirds of the Human Genome. PLoS Genet. 2011, 7, e1002384. [Google Scholar] [CrossRef] [PubMed]
  2. Fernandes, J.D.; Zamudio-Hurtado, A.; Clawson, H.; Kent, W.J.; Haussler, D.; Salama, S.R.; Haeussler, M. The UCSC Repeat Browser Allows Discovery and Visualization of Evolutionary Conflict across Repeat Families. Mob. DNA 2020, 11, 13. [Google Scholar] [CrossRef]
  3. Piégu, B.; Bire, S.; Arensburger, P.; Bigot, Y. A Survey of Transposable Element Classification Systems—A Call for a Fundamental Update to Meet the Challenge of Their Diversity and Complexity. Mol. Phylogenetics Evol. 2015, 86, 90–109. [Google Scholar] [CrossRef]
  4. Kapitonov, V.V.; Jurka, J. A Universal Classification of Eukaryotic Transposable Elements Implemented in Repbase. Nat. Rev. Genet. 2008, 9, 411–412. [Google Scholar] [CrossRef]
  5. Anwar, S.; Wulaningsih, W.; Lehmann, U. Transposable Elements in Human Cancer: Causes and Consequences of Deregulation. Int. J. Mol. Sci. 2017, 18, 974. [Google Scholar] [CrossRef] [PubMed]
  6. Mills, R.E.; Bennett, E.A.; Iskow, R.C.; Devine, S.E. Which Transposable Elements Are Active in the Human Genome? Trends Genet. 2007, 23, 183–191. [Google Scholar] [CrossRef]
  7. Balachandran, P.; Walawalkar, I.A.; Flores, J.I.; Dayton, J.N.; Audano, P.A.; Beck, C.R. Transposable Element-Mediated Rearrangements Are Prevalent in Human Genomes. Nat. Commun. 2022, 13, 7115. [Google Scholar] [CrossRef]
  8. Bourque, G.; Burns, K.H.; Gehring, M.; Gorbunova, V.; Seluanov, A.; Hammell, M.; Imbeault, M.; Izsvák, Z.; Levin, H.L.; Macfarlan, T.S.; et al. Ten Things You Should Know about Transposable Elements. Genome Biol. 2018, 19, 199. [Google Scholar] [CrossRef]
  9. Bonté, P.-E.; Arribas, Y.A.; Merlotti, A.; Carrascal, M.; Zhang, J.V.; Zueva, E.; Binder, Z.A.; Alanio, C.; Goudot, C.; Amigorena, S. Single-Cell RNA-Seq-Based Proteogenomics Identifies Glioblastoma-Specific Transposable Elements Encoding HLA-I-Presented Peptides. Cell Rep. 2022, 39, 110916. [Google Scholar] [CrossRef] [PubMed]
  10. Larouche, J.-D.; Trofimov, A.; Hesnard, L.; Ehx, G.; Zhao, Q.; Vincent, K.; Durette, C.; Gendron, P.; Laverdure, J.-P.; Bonneil, É.; et al. Widespread and Tissue-Specific Expression of Endogenous Retroelements in Human Somatic Tissues. Genome Med. 2020, 12, 40. [Google Scholar] [CrossRef]
  11. Gao, Y.; Yu, X.; Chen, T. Human Endogenous Retroviruses in Cancer: Expression, Regulation and Function (Review). Oncol. Lett. 2021, 21, 121. [Google Scholar] [CrossRef] [PubMed]
  12. Goyal, A.; Bauer, J.; Hey, J.; Papageorgiou, D.N.; Stepanova, E.; Daskalakis, M.; Scheid, J.; Dubbelaar, M.; Klimovich, B.; Schwarz, D.; et al. DNMT and HDAC Inhibition Induces Immunogenic Neoantigens from Human Endogenous Retroviral Element-Derived Transcripts. Nat. Commun. 2023, 14, 6731. [Google Scholar] [CrossRef]
  13. Kulski, J.K. Next-Generation Sequencing—An Overview of the History, Tools, and “Omic” Applications. In Next Generation Sequencing—Advances, Applications and Challenges; Kulski, J.K., Ed.; IntechOpen: London, UK, 2016; pp. 3–60. ISBN 978-953-51-2240-1. [Google Scholar]
  14. Liang, G.; Bushman, F.D. The Human Virome: Assembly, Composition and Host Interactions. Nat. Rev. Microbiol. 2021, 19, 514–527. [Google Scholar] [CrossRef]
  15. Teresi, S.J.; Teresi, M.B.; Edger, P.P. TE Density: A Tool to Investigate the Biology of Transposable Elements. Mob. DNA 2022, 13, 11. [Google Scholar] [CrossRef]
  16. Kulski, J.K.; Pfaff, A.L.; Koks, S. SVA Regulation of Transposable Element Clustered Transcription within the Major Histocompatibility Complex Genomic Class II Region of the Parkinson’s Progression Markers Initiative. Genes 2024, 15, 1185. [Google Scholar] [CrossRef]
  17. Shiina, T.; Inoko, H.; Kulski, J.K. An Update of the HLA Genomic Region, Locus Information and Disease Associations: 2004. Tissue Antigens 2004, 64, 631–649. [Google Scholar] [CrossRef] [PubMed]
  18. Shiina, T.; Hosomichi, K.; Inoko, H.; Kulski, J.K. The HLA Genomic Loci Map: Expression, Interaction, Diversity and Disease. J. Hum. Genet. 2009, 54, 15–39. [Google Scholar] [CrossRef] [PubMed]
  19. Kulski, J.K.; Suzuki, S.; Shiina, T. Human Leukocyte Antigen Super-Locus: Nexus of Genomic Supergenes, SNPs, Indels, Transcripts, and Haplotypes. Hum. Genome Var. 2022, 9, 49. [Google Scholar] [CrossRef] [PubMed]
  20. Kedzierska, K.; Koutsakos, M. The ABC of Major Histocompatibility Complexes and T Cell Receptors in Health and Disease. Viral Immunol. 2020, 33, 160–178. [Google Scholar] [CrossRef]
  21. Anaya, J.; Shoenfeld, Y.; Rojas-Villarraga, A.; Levy, R.; Cervera, R. (Eds.) Autoimmunity: From Bench to Bedside [Internet]; El Rosario University Press, 2013. Available online: https://www.ncbi.nlm.nih.gov/books/NBK459447/ (accessed on 1 January 2025).
  22. Gu, R.; Pan, J.; Awan, M.U.N.; Sun, X.; Yan, F.; Bai, L.; Bai, J. The Major Histocompatibility Complex Participates in Parkinson’s Disease. Pharmacol. Res. 2024, 203, 107168. [Google Scholar] [CrossRef]
  23. Kulski, J.K.; Pfaff, A.L.; Marney, L.D.; Fröhlich, A.; Bubb, V.J.; Quinn, J.P.; Koks, S. Regulation of Expression Quantitative Trait Loci by SVA Retrotransposons within the Major Histocompatibility Complex. Exp. Biol. Med. 2023, 248, 2304–2318. [Google Scholar] [CrossRef] [PubMed]
  24. Kulski, J.K.; Suzuki, S.; Shiina, T.; Pfaff, A.L.; Kõks, S. Regulatory SVA Retrotransposons and Classical HLA Genotyped-Transcripts Associated with Parkinson’s Disease. Front. Immunol. 2024, 15, 1349030. [Google Scholar] [CrossRef]
  25. Kulski, J.K.; Shigenari, A.; Inoko, H. Genetic Variation and Hitchhiking between Structurally Polymorphic Alu Insertions and HLA-A, -B, and -C Alleles and Other Retroelements within the MHC Class I Region. Tissue Antigens 2011, 78, 359–377. [Google Scholar] [CrossRef]
  26. Fröhlich, A.; Pfaff, A.L.; Middlehurst, B.; Hughes, L.S.; Bubb, V.J.; Quinn, J.P.; Koks, S. Deciphering the Role of a SINE-VNTR-Alu Retrotransposon Polymorphism as a Biomarker of Parkinson’s Disease Progression. Sci. Rep. 2024, 14, 10932. [Google Scholar] [CrossRef]
  27. Orenbuch, R.; Filip, I.; Comito, D.; Shaman, J.; Pe’er, I.; Rabadan, R. arcasHLA: High-Resolution HLA Typing from RNAseq. Bioinformatics 2020, 36, 33–40. [Google Scholar] [CrossRef] [PubMed]
  28. Sepulveda, J.L. Using R and Bioconductor in Clinical Genomics and Transcriptomics. J. Mol. Diagn. 2020, 22, 3–20. [Google Scholar] [CrossRef]
  29. Pfaff, A.L.; Bubb, V.J.; Quinn, J.P.; Koks, S. Reference SVA Insertion Polymorphisms Are Associated with Parkinson’s Disease Progression and Differential Gene Expression. NPJ Park. Dis. 2021, 7, 44. [Google Scholar] [CrossRef]
  30. Kõks, S.; Pfaff, A.L.; Singleton, L.M.; Bubb, V.J.; Quinn, J.P. Non-Reference Genome Transposable Elements (TEs) Have a Significant Impact on the Progression of the Parkinson’s Disease. Exp. Biol. Med. 2022, 247, 1680–1690. [Google Scholar] [CrossRef] [PubMed]
  31. Patro, R.; Duggal, G.; Love, M.I.; Irizarry, R.A.; Kingsford, C. Salmon Provides Fast and Bias-Aware Quantification of Transcript Expression. Nat. Methods 2017, 14, 417–419. [Google Scholar] [CrossRef]
  32. Shabalin, A.A. Matrix eQTL: Ultra Fast eQTL Analysis via Large Matrix Operations. Bioinformatics 2012, 28, 1353–1358. [Google Scholar] [CrossRef] [PubMed]
  33. Tang, D.; Chen, M.; Huang, X.; Zhang, G.; Zeng, L.; Zhang, G.; Wu, S.; Wang, Y. SRplot: A Free Online Platform for Data Visualization and Graphing. PLoS ONE 2023, 18, e0294236. [Google Scholar] [CrossRef]
  34. Kulski, J.K.; Gaudieri, S.; Bellgard, M.; Balmer, L.; Giles, K.; Inoko, H.; Dawkins, R.L. The Evolution of MHC Diversity by Segmental Duplication and Transposition of Retroelements. J. Mol. Evol. 1997, 45, 599–609. [Google Scholar] [CrossRef]
  35. Kulski, J.K.; Gaudieri, S.; Dawkins, R.L. Using Alu J Elements as Molecular Clocks to Trace the Evolutionary Relationships Between Duplicated HLA Class I Genomic Segments. J. Mol. Evol. 2000, 50, 510–519. [Google Scholar] [CrossRef]
  36. Kulski, J.K.; Gaudieri, S.; Martin, A.; Dawkins, R.L. Coevolution of PERB11 (MIC) and HLA Class I Genes with HERV-16 and Retroelements by Extended Genomic Duplication. J. Mol. Evol. 1999, 49, 84–97. [Google Scholar] [CrossRef] [PubMed]
  37. He, W.; Gea-Mallorquí, E.; Colin-York, H.; Fritzsche, M.; Gillespie, G.M.; Brackenridge, S.; Borrow, P.; McMichael, A.J. Intracellular Trafficking of HLA-E and Its Regulation. J. Exp. Med. 2023, 220, e20221941. [Google Scholar] [CrossRef] [PubMed]
  38. Kulski, J.K.; Shigenari, A.; Inoko, H. Polymorphic SVA Retrotransposons at Four Loci and Their Association with Classical HLA Class I Alleles in Japanese, Caucasians and African Americans. Immunogenetics 2010, 62, 211–230. [Google Scholar] [CrossRef]
  39. Thompson, P.J.; Macfarlan, T.S.; Lorincz, M.C. Long Terminal Repeats: From Parasitic Elements to Building Blocks of the Transcriptional Regulatory Repertoire. Mol. Cell 2016, 62, 766–776. [Google Scholar] [CrossRef]
  40. Gebrie, A. Transposable Elements as Essential Elements in the Control of Gene Expression. Mob. DNA 2023, 14, 9. [Google Scholar] [CrossRef] [PubMed]
  41. Zhang, X.-O.; Gingeras, T.R.; Weng, Z. Genome-Wide Analysis of Polymerase III–Transcribed Alu Elements Suggests Cell-Type–Specific Enhancer Function. Genome Res. 2019, 29, 1402–1414. [Google Scholar] [CrossRef]
  42. Luqman-Fatah, A.; Miyoshi, T. Human LINE-1 Retrotransposons: Impacts on the Genome and Regulation by Host Factors. Genes Genet. Syst. 2023, 98, 121–154. [Google Scholar] [CrossRef]
  43. Zhao, K.; Du, J.; Peng, Y.; Li, P.; Wang, S.; Wang, Y.; Hou, J.; Kang, J.; Zheng, W.; Hua, S.; et al. LINE1 Contributes to Autoimmunity through Both RIG-I- and MDA5-Mediated RNA Sensing Pathways. J. Autoimmun. 2018, 90, 105–115. [Google Scholar] [CrossRef] [PubMed]
  44. Boyboy, B.A.G.; Ichiyanagi, K. Insertion of Short L1 Sequences Generates Inter-Strain Histone Acetylation Differences in the Mouse. Mob. DNA 2024, 15, 11. [Google Scholar] [CrossRef] [PubMed]
  45. Wang, J.; Vicente-García, C.; Seruggia, D.; Moltó, E.; Fernandez-Miñán, A.; Neto, A.; Lee, E.; Gómez-Skarmeta, J.L.; Montoliu, L.; Lunyak, V.V.; et al. MIR Retrotransposon Sequences Provide Insulators to the Human Genome. Proc. Natl. Acad. Sci. USA 2015, 112, E4428–E4437. [Google Scholar] [CrossRef] [PubMed]
  46. Hernandez, A.J.; Zovoilis, A.; Cifuentes-Rojas, C.; Han, L.; Bujisic, B.; Lee, J.T. B2 and ALU Retrotransposons Are Self-Cleaving Ribozymes Whose Activity Is Enhanced by EZH2. Proc. Natl. Acad. Sci. USA 2020, 117, 415–425. [Google Scholar] [CrossRef]
  47. Mandal, A.K.; Pandey, R.; Jha, V.; Mukerji, M. Transcriptome-Wide Expansion of Non-Coding Regulatory Switches: Evidence from Co-Occurrence of Alu Exonization, Antisense and Editing. Nucleic Acids Res. 2013, 41, 2121–2137. [Google Scholar] [CrossRef]
  48. Daniel, C.; Behm, M.; Öhman, M. The Role of Alu Elements in the Cis-Regulation of RNA Processing. Cell. Mol. Life Sci. 2015, 72, 4063–4076. [Google Scholar] [CrossRef] [PubMed]
  49. Meng, H.; Bartholomew, B. Emerging Roles of Transcriptional Enhancers in Chromatin Looping and Promoter-Proximal Pausing of RNA Polymerase II. J. Biol. Chem. 2018, 293, 13786–13794. [Google Scholar] [CrossRef]
  50. Cheng, Y.; Saville, L.; Gollen, B.; Veronesi, A.A.; Mohajerani, M.; Joseph, J.T.; Zovoilis, A. Increased Alu RNA Processing in Alzheimer Brains Is Linked to Gene Expression Changes. EMBO Rep. 2021, 22, e52255. [Google Scholar] [CrossRef]
  51. Bai, G.-H.; Lin, S.-C.; Hsu, Y.-H.; Chen, S.-Y. The Human Virome: Viral Metagenomics, Relations with Human Diseases, and Therapeutic Applications. Viruses 2022, 14, 278. [Google Scholar] [CrossRef]
  52. Li, Y.; Fan, T.; Cui, J. Human Endogenous Retroviruses in Viral Disease and Therapy. Clin. Transl. Dis. 2022, 2, e38. [Google Scholar] [CrossRef]
  53. Suzuki, S.; Morishima, S.; Murata, M.; Tanaka, M.; Shigenari, A.; Ito, S.; Kanga, U.; Kulski, J.K.; Morishima, Y.; Shiina, T. Sequence Variations Within HLA-G and HLA-F Genomic Segments at the Human Leukocyte Antigen Telomeric End Associated With Acute Graft-Versus-Host Disease in Unrelated Bone Marrow Transplantation. Front. Immunol. 2022, 13, 938206. [Google Scholar] [CrossRef] [PubMed]
  54. Huang, Y.; Sun, H.; Ma, X.; Zeng, Y.; Pan, Y.; Yu, D.; Liu, Z.; Xiang, Y. HLA-F-AS1/miR-330-3p/PFN1 Axis Promotes Colorectal Cancer Progression. Life Sci. 2020, 254, 117180. [Google Scholar] [CrossRef] [PubMed]
  55. Zhang, J.; Li, S.; Zhang, X.; Li, C.; Zhang, J.; Zhou, W. LncRNA HLA-F-AS1 Promotes Colorectal Cancer Metastasis by Inducing PFN1 in Colorectal Cancer-Derived Extracellular Vesicles and Mediating Macrophage Polarization. Cancer Gene Ther. 2021, 28, 1269–1284. [Google Scholar] [CrossRef] [PubMed]
  56. Hong, L.; Han, Y.; Shi, R.; Shao, X.; Sun, L.; Zhang, Y.; Huang, D.; Chen, Z.; Zhang, G.; Liang, J.; et al. ZNRD1 Gene Suppresses Cell Proliferation through Cell Cycle Arrest in G1 Phase. Cancer Biol. Ther. 2005, 4, 67–71. [Google Scholar] [CrossRef]
  57. Ballana, E.; Senserrich, J.; Pauls, E.; Faner, R.; Mercader, J.M.; Uyttebroeck, F.; Palou, E.; Mena, M.P.; Grau, E.; Clotet, B.; et al. ZNRD1 (Zinc Ribbon Domain–Containing 1) Is a Host Cellular Factor That Influences HIV-1 Replication and Disease Progression. Clin. Infect. Dis. 2010, 50, 1022–1032. [Google Scholar] [CrossRef]
  58. Zhao, G.; Li, Y.; Chen, T.; Liu, F.; Zheng, Y.; Liu, B.; Zhao, W.; Qi, X.; Sun, W.; Gao, C. TRIM26 Alleviates Fatal Immunopathology by Regulating Inflammatory Neutrophil Infiltration during Candida Infection. PLoS Pathog. 2024, 20, e1011902. [Google Scholar] [CrossRef] [PubMed]
  59. Shen, Z.; Wei, L.; Yu, Z.; Yao, Z.; Cheng, J.; Wang, Y.; Song, X.; Li, M. The Roles of TRIMs in Antiviral Innate Immune Signaling. Front. Cell. Infect. Microbiol. 2021, 11, 628275. [Google Scholar] [CrossRef]
  60. Zhang, M.; Tan, H.; Gong, Y.; Faleti, O.D.; Li, D.; Yang, J.; Huang, J.; Long, J.; Luo, Q.; Wu, G.; et al. TRIM26 Restricts Epstein–Barr Virus Infection in Nasopharyngeal Epithelial Cells through K48 -linked Ubiquitination of HSP-90β. FASEB J. 2024, 38, e23345. [Google Scholar] [CrossRef] [PubMed]
  61. Liu, S.-C. Comprehensive Analysis of Clinical and Biological Value of ING Family Genes in Liver Cancer. World J. Gastrointest. Oncol. 2024, 16, 2592–2609. [Google Scholar] [CrossRef] [PubMed]
  62. Salviano-Silva, A.; Becker, M.; Augusto, D.G.; Busch, H.; Adelman Cipolla, G.; Farias, T.D.-J.; Bumiller-Bini, V.; Calonga-Solís, V.; Munz, M.; Franke, A.; et al. Genetic Association and Differential Expression of HLA Complex Group lncRNAs in Pemphigus. J. Autoimmun. 2021, 123, 102705. [Google Scholar] [CrossRef]
  63. Mirzadeh Azad, F.; Malakootian, M.; Mowla, S.J. lncRNA PSORS1C3 Is Regulated by Glucocorticoids and Fine-Tunes OCT4 Expression in Non-Pluripotent Cells. Sci. Rep. 2019, 9, 8370. [Google Scholar] [CrossRef] [PubMed]
  64. Linh, N.T.T.; Giang, N.H.; Lien, N.T.K.; Trang, B.K.; Trang, D.T.; Ngoc, N.T.; Nghia, V.X.; My, L.T.; Mao, C.V.; Hoang, N.H.; et al. Association of PSORS1C3, CARD14 and TLR4 Genotypes and Haplotypes with Psoriasis Susceptibility. Genet. Mol. Biol. 2022, 45, 20220099. [Google Scholar] [CrossRef] [PubMed]
  65. Krönung, S.K.; Beyer, U.; Chiaramonte, M.L.; Dolfini, D.; Mantovani, R.; Dobbelstein, M. LTR12 Promoter Activation in a Broad Range of Human Tumor Cells by HDAC Inhibition. Oncotarget 2016, 7, 33484–33497. [Google Scholar] [CrossRef]
  66. Goerner-Potvin, P.; Bourque, G. Computational Tools to Unmask Transposable Elements. Nat. Rev. Genet. 2018, 19, 688–704. [Google Scholar] [CrossRef] [PubMed]
  67. Jin, Y.; Hammell, M. Analysis of RNA-Seq Data Using TEtranscripts. In Transcriptome Data Analysis; Wang, Y., Sun, M., Eds.; Methods in Molecular Biology; Springer New York: New York, NY, USA, 2018; Volume 1751, pp. 153–167. ISBN 978-1-4939-7709-3. [Google Scholar]
  68. Fröhlich, A.; Hughes, L.S.; Middlehurst, B.; Pfaff, A.L.; Bubb, V.J.; Koks, S.; Quinn, J.P. CRISPR deletion of a SINE-VNTR-Alu (SVA_67) retrotransposon demonstrates its ability to differentially modulate gene expression at the MAPT locus. Front. Neurol. 2023, 14, 1273036. [Google Scholar] [CrossRef] [PubMed]
Figure 1. This Pareto plot shows the transcription levels (Y-axis: mean RNA read count) for eighteen HLA class I genes and pseudogenes (X-axis). The mean RNA read count is indicated at the top of each vertical bar, showing the expression level of each HLA gene in the bar plot. A cumulative line across the bars shows the cumulative percentage (Y-axis: 0–100%) of the total mean RNA read counts. Additional data are presented in Table 1.
Jmp 06 00001 g001
Figure 2. Genomic loci maps of the SVA retrotransposons and HLA class I genes and pseudogenes in the alpha (A), kappa (B), and beta (C) block regions, respectively. The telomeric to centromeric orientation of the regions and blocks is from left to right, respectively. The distance (Mb) from the telomeric end is indicated by the numbers beneath the horizontal thick arrows. C1 to C18 labeled horizontal bars show the cluster locations of expressed TEs modulated by the SVAs in orange boxes labeled as NR_SVA_377, R_SVA_24, R_SVA_25, or R_SVA_26. The other labeled SVAs are present in the class I region of all or a few particular HLA haplotypes but had no detected regulator roles in this study. The horizontal arrows below the SVA labels indicate their presence on the forward or reverse strands. The location of the C11 cluster (chr6:31,176,234-31,190,529) telomeric to the beta block (C), overlapping with the PSORS1C3 lncRNA locus (chr6:31,173,735–31,177,899, reverse strand), and near the POU5F1 gene (chr6:31,164,337–31,180,731, reverse strand) is not shown.
Jmp 06 00001 g002
Figure 3. Cluster and correlation plot showing the relationship between the nucleotide width of TE clusters (bp) on the Y-axis and the number of TEs in each cluster on the X-axis (n = 27 pairs), regulated by the SVAs listed in Table 2.
Jmp 06 00001 g003
Figure 4. Density plot showing the distribution of subfamily groups, Alu, MIR, DNAtr, L1, L2, L3, LTR_ERV, and SVA, along the Y-axis, compared to their relative length (bp) along the X-axis.
Jmp 06 00001 g004
Figure 5. Map of L1 fragmented insertions (n = 45) regulated by four SVAs within the MHC class I alpha and beta blocks. L1 insertion lengths (TE_width in Table S2) were derived from RepeatMasker outputs of the GRCh38/hg38 reference genome using the UCSC genome browser and its Table Browser tool for downloads sourced from the University of California, Santa Cruz (UCSC) Genomics Institute. The L1HS (6064 bp) Repbase consensus sequence, shown at the bottom of the image, highlights the positions of the 5′- and 3′-UTR and open reading frame (ORF1 and ORF2) features relative to nucleotide scale (kb) at the top of the image. Horizontal lines between the nucleotide scale and the L1HS map indicate the positions and lengths of the L1 fragments listed in Table S2, mapped relative to the full-length reference L1 sequence. Sixty-seven percent of the 45 L1 fragments are located within the 3′-end region (4861–6152 bp) of the L1HS reference sequence.
Jmp 06 00001 g005
Figure 6. Scatter and correlation plots showing beta effects for co-regulated TE loci: (a) the R_SVA_24 beta effect (Y-axis) versus the NR_SVA_377 beta effect (X-axis) for 49 co-regulated TE loci (R2 = 0.9885, p < 0.0001); and (b) the R_SVA_26 beta effect (Y-axis) versus the R_SVA_25 beta effect (X-axis) for 19 co-regulated TE loci (R2 = 0.8984, p < 0.0001).
Jmp 06 00001 g006
Figure 7. Scatter plots illustrating the effects of SVAs on TE expression for NR_SVA_377 (a), R_SVA_24 (b), R_SVA_25 (c), and R_SVA_26 (d). These plots show the chromosomal positions of TEs (Y-axis) relative to the SVA beta expression effect (X-axis) in the alpha (a, b) and beta (c, d) blocks. Gene loci and TE cluster positions (C1 to C18) are indicated on the vertical axis between panels (a) and (b), and (c) and (d). Pseudogenes are indicated in italics. Outlier TEs are labeled within the scatter matrices.
Jmp 06 00001 g007
Figure 8. Genomic loci map of expressed TE cluster C7 at the centromeric end of the alpha block near HLA-J extending to C10, which incorporates the HLA-L and HCG17 lncRNA within the kappa block, differentially regulated by NR_SVA_377 (b), R_SVA_24 (c), and R_SVA_25 (d). The Genome Browser image is sourced from the University of California, Santa Cruz (UCSC) Genomics Institute. From top to bottom, the browser tracks display the following: the nucleotide scale for chr6, ten tracks representing repeating elements (from SINE to Unknown), the location of the SVA-T26 retrotransposon within the matrix, and Gencode v44 gene annotations. The four consecutive lower panels, a to d: ‘a. ERV3-16A3 loc’ shows two ERV3-16A3 loci as black boxes; ‘b. SVA_377_TEreg’ depicts the positions of expressed TEs (vertical arrows) within the boxed TE cluster C7 and the HCG17 TE region (C10) regulated by NR_SVA_377; ‘c. R_SVA_24_TEreg’ depicts the positions of expressed TEs (vertical arrows) within the boxed TE clusters C7 to C10 regulated by R_SVA_24; ‘d. SVA_25_TEreg’ depicts the positions of expressed TEs (vertical arrows) within the boxed HCG17 TE cluster (C10) regulated by R_SVA_25. Black vertical arrows indicate upregulated TEs, and white vertical arrows denote downregulated TEs.
Jmp 06 00001 g008
Figure 9. Genomic map of the expressed Alu and LTR43 fragmented matrix within TE cluster C12, regulated by R_SVA_25. This cluster is located between the POU5F1 and HLA-C genes in the beta block. The Genome Browser image, sourced from the University of California, Santa Cruz (UCSC) Genomics Institute, displays the following tracks from top to bottom: the nucleotide scale for chr6, a selected track for the H3K27Ac mark with layered peaks, and the locations of repetitive elements (SINE, LINE, and LTR). The horizontal panel below the browser image shows the relative positions of the downregulated LTR43 and Alu TEs (indicated by vertical open arrows) regulated by R_SVA_25. The negative beta value for each of the indicated repeat elements is given below the arrow. The combined length of the interspersed LTR43 fragments is 3794 bp, separated across a total span of 5692 bp by six Alu insertions and one L2 insertion.
Jmp 06 00001 g009
Figure 10. Clustered horizontal bar graphs showing the differential positive beta effect of SVAs (X-axis) on the expression of different TE subfamily members (Y-axis) for NR_SVA_377 (a), R_SVA_24 (b), R_SVA_25 (c), and R_SVA_26 (d).
Jmp 06 00001 g010
Figure 11. Genomic loci maps of expressed TE clusters C1 (a) and C2 to C6 (b) in the alpha block, ranging from ZFP57 to HLA-J, regulated by NR_SVA_377 and R_SVA_24. The Genome Browser image (a) shows the genomic region chr6:29,672,483 to 29,890,482 (218,000 bp), and image (b) shows the genomic region chr6:29,868,622 to 30,003,286 (134,665 bp). The Genome Browser image is sourced from the University of California, Santa Cruz (UCSC) Genomics Institute. The following tracks are displayed from top to bottom in images (a) and (b): the nucleotide scale for chr6, NCBI reference genes, the Layered H3K27Ac mark with coloured peaks (red and blue correspond to high and low signal intensity, respectively), repetitive elements, Genecode gene annotations, and UCSC RefSeq RNAs. The locations of NR_SVA_377 and R_SVA_24 are shown in the repetitive element track of image (a) and image (b) respectively. Below the browser image (a) or (b) are the relative positions of expressed TEs (shown as vertical arrows within the violet boxed clusters C1 to C6), regulated by NR_SVA_377 and R_SVA_24 in each horizontal panel labeled [B] to [B’] and {C] to [C’}, respectively. Black vertical arrows indicate upregulated TEs, and white vertical arrows indicate downregulated TEs. The broken vertical arrows indicate the upregulation or downregulation of the expressed HLA genes. The horizontal panel, [A] to [A’}, shows the location of the LTR/ERV repeat sequence ERV-16A3, which separates the HLA genes into distinct duplicated segments.
Jmp 06 00001 g011
Figure 12. Genomic loci maps of expressed TE clusters C11 to C13 (a) and C13 to C18 (b) in the beta block, ranging from POU5F1 to MICB, and regulated by R_SVA_25 and R_SVA_26. The Genome Browser image (a) shows the genomic region chr6:31,171,234 to 31,290,274 (119,041 bp), and image (b) shows the genomic region chr6:31,243,518 to 31,532,123 (288,606 bp). The Genome Browser image is sourced from the University of California, Santa Cruz (UCSC) Genomics Institute. The following tracks are displayed from top to bottom in images (a,b): the nucleotide scale for chr6, Genecode or NCBI reference genes, the Layered H3K27Ac mark with coloured peaks (red and blue correspond to high and low signal intensity, respectively), repetitive elements, and Genecode V43 gene annotations. The locations of R_SVA_25 and R_SVA_26 are labeled in orange boxes at the bottom of the repeating element track in browser image (b). Below the browser images (a,b) are the relative positions of expressed TEs (shown as vertical arrows) within the boxed clusters C11 to C18 that are regulated by R_SVA_25 and R_SVA_26 within each horizontal panel. Black vertical arrows indicate upregulated TEs, and white vertical arrows indicate downregulated TEs. The broken vertical arrows in browser image (b) indicate the upregulation of the expressed HLA and MIC genes. The top horizontal panel labeled ERV-16A3 loci above the TE cluster positions shows the locations of the LTR/ERV repeat sequence ERV-16A3, which separate the HLA genes into distinct duplicated segments.
Jmp 06 00001 g012
Table 1. HLA class I gene transcription (read counts) in blood cell RNA sequences of PPMI cohort.
HLA GeneNumber% TotalMean RNASTDEV *Max ReadMin ReadBlock Loci
SamplesSamplesRead CountCount
F152899.94723186214,258411Alpha
V13939167541Alpha
P72947.668451Alpha
G124381.2610731Alpha
H150798.591503581Alpha
T145395117511Alpha
K150798.5111655601Alpha
U81253.12181Alpha
A153010069,38419,326137,6532694Alpha
W1530100221127127410Alpha
Y50232.835040720991Alpha
J152999.932171271Alpha
L153010050241992Kappa
N754.91141Kappa
E152899.931,33912,45797,7001890Kappa
C152899.943,90520,626146,6595125Beta
B152899.950,50921,624151,4723204Beta
S4893222251Beta
* STDEV is standard deviation of the mean for cohort population samples.
Table 2. DNA strand bias for transcribed TEs within clusters.
RegulatoryClusterNumber % % Total No. ExpNo. TEs in Cluster Genome LocationCluster
SVA ExpressedExpressedExpressedand % of GenomeGRCh38Width (bp)
Pos and NegPosNegGenomeReference
StrandsStrandsStrandsReference No.GRCh38
NR_SVA_377C13 and 175%25%4 (40%)10chr6:29,739,704–29,751,75712,053
chr6:29731783C28 and 0100%0%8 (80%)10chr6:29,882,170–29,886,0793909
C30 and 40%100%4 (50%)8chr6:29,895,386–29,900,9515565
C42 and 167%23%3 (75%)4chr6:29,922,776–29,924,2841508
C6A26 and 681%19%32 (97%)33chr6:29,946,554–29,964,91718,363
C6B9 and 190%10%10 (100%)10chr6:29,965,033–29,970,3665333
R_SVA_24C15 and 271%29%7 (54%)13chr6:29,739,009–29,753,86314,854
chr6:29932088–C29 and 0100%0%9 (82%) 11chr6:29,881,965–29,886,0794114
29933753C31 and 150%50%2 (100%)2chr6:29,894,876–29,896,4491573
C53 and 175%25%4 (29%)14chr6:29,929,971–29,938,5048533
C628 and 780%20%35 (70%)50chr6:29,946,554–29,976,23529,681
C72 and 529%71%7 (44%)16chr6:29,986,094–29,993,2127118
C84 and 0100%0%4 (13%)31chr6:30,041,551–30,053,76812,217
C93 and 0100%0%3 (10%)29chr6:30,202,312–30,211,6699357
R_SVA_25C112 and 929%71%11 (33%)33chr6:31,176,234–31,190,52914,295
chr6:31243861–C1210 and 191%9%11 (42%)26chr6:31,204,049–31,212,8828833
31245322C133 and 0100%0%3 (100%)3chr6:31,265,965–31,266,852887
C143 and 175%25%4 (80%)5chr6:31,360,364–31,362,6112247
C154 and 357%43%7 (100%)7chr6:31,396,358–31,399,5593201
C160 and 80%100%8 (47%)17chr6:31,417,163–31,424,0866923
C170 and 20%100%2 (50%)4chr6:31,456,841–31,458,6171776
C187 and 0100%0%7 (44%) 16chr6:31,484,911–31,494,8509939
R_SVA_26C146 and 555%45%11 (44%)25chr6:31,360,458–31,375,71315,255
chr6:31453746–C156 and 843%57%14 (52%)27chr6:31,389,735–31,408,72518,990
31456553C160 and 120%100%12 (50%)24chr6:31,417,163–31,426,9049741
C170 and 40%100%4 (80%)5chr6:31,452,575–31,456,5533978
C182 and 0100%0%2 (50%)4chr6:31,484,911–31,486,8371926
total146 and 8264%36%228 (52%)437
Table 3. Distance (bp) between adjoining transcribed TE clusters regulated by different SVAs.
AdjoiningDistanceAv Distance Distance Av Distance Separated Gene
ClustersBetween Between TEsBetween Between TEsRegions
Clusters, bpin Clusters, bpClusters, bpin Clusters, bp
Alpha BlockNR_SVA_377R_SVA_24Gene1—Gene2
C1-C2130,4133013–489128,1022122–457HLA-F—HLA-H
C2-C39307489–13918797457–786HLA-H—HLA-T
C3-C421,8251391–503 HLA-T—HLA-K
C3-C5 33,522786–2133HLA-T—HLA-U
C4-C622,270503–574 HLA-K—HLA-A
C5-C6 80502133–506HLA-U—HLA-A
C6-C7 9859506–1017HLA-A—HLA-J
C7-C8 48,3391017–3054HLA-J
C8-C9 148,5443054–3119TRIM26
Beta BlockR_SVA_25R_SVA_26Gene1—Gene2
C11-C1296361300–1156 PSORS1C3—HCG27
C12-C1353,0831156–296 HCG27—HLA-C
C13-C1493,512296–56293,722147–1387HLA-C—HLA-B
C14-C1531,678562–71514,0221387–1365HLA-B—MICA-AS1
C15-C1617,604753–86584381357–812MICA-AS1—MICA
C16-C1732,755865–88825,671812–995MICA—HLA-X
C17-C1821,356888–124228,358995–963HLA-X—MIC-DT
Table 4. The number, percentage, length (bp), and classifications (class, family, name) of transcribed TEs (n, 169) that are regulated by SVAs in the alpha and beta blocks of the MHC class I region of the PPMI cohort.
Class or Family (%)NameNo.LengthNo. % on (+)
TEs* Av bpClustersStrand
DNA (11.8%)Class202241185
hAT-Charlie (95%) 1923210
Charlie83804
MER20, MER10221552
MER302461
MER571395
TcMar-Tigger (5%)Tigger171661
LTR/ERV (34.9%)Class595481263
ERV1 (44%) 266655
HERP71A77351
LTR4375421
HARLEQUIN411001
LTR2, LTR8, LTR936022
LTR12, LTR7129501
MER41, 1 MER6123732
HUERS-P317921
ERVK (3%) 27132
LTR13. LTR2227132
ERVL (22%) 135464
ERV3-16A348072
MER2155372
LTR8421892
LTR16, LTR1822401
ERVL-MaLR (31%) 1826310
MLT143556
MST44751
LINE (32.5%)Class554671353
L1 (80%) 4554513
L2 (16%) 91794
L3 (4%) 21031
SINE (18.9%)Class322341253
Alu (84%) 2725111
MIR (16%) 51783
SVA (1.8) 31721333
* Av is averageav n, 169445
Table 5. SVA-regulated TE family transcription as a percentage of TE family loci within the alpha and beta blocks.
(a) Alpha Block (302,579 bp) 431 TE loci
TE Family (Class)Alpha BlockTE ExpressedTE Expressed
Number (%)by SVA_377by SVA_24
hAT-Charlie (DNA)49 (11%)16%20%
TcMar-Tigger (DNA)6 (1%) 17%
ERVL-MaLR (LTR)71 (17%)21%21%
ERV (LTR)84 (20%)24%15%
L1 (LINE)87 (20%)7%13%
L2 (LINE)39 (9%)10%18%
L3-CR1 (LINE)4 (1%)50%25%
Alu (SINE)70 (16%)13%11%
MIR (SINE)16 (4%)13%19%
SVA (retroposon)3 (<1%) 33%100%
Total431 (100%)67 (15.5%)72 (16.7%)
(b) Beta Block (354,000 bp) 568 TE loci
TE Family (Class)Beta BlockTE ExpressedTE Expressed
Number (%)by SVA_25by SVA_26
hAT-Charlie (DNA)22 (4%)18%18%
MULE-MuDR (DNA)1 (<1%)
ERVL-MaLR (LTR)31 (5%)3%
ERV (LTR)142 (25%)12%4%
L1 (LINE)157 (28%)11%12%
L2 (LINE)25 (4%)12%8%
L3-CR1 (LINE)1 (<1%)
Alu (SINE)161 (28%)8%5%
MIR (SINE)15 (3%)7%
SSU-rRNA_Hsa (rRNA)1 (<1%)
Total568 (100%)55 (10%)40 (7%)
Table 6. Number and percentage of transcribed TEs upregulated or downregulated by SVA within the alpha and beta blocks.
Alpha Block (302,579 bp)
TE Family (Class)NR_SVA_377: TE Number and % RegulatedNR_SVA_24: TE Number and % Regulated
UpDownTotal/TE% of 67UpDownTotal/TE% of 72
hAT-Charlie (DNA)4 (50%)4 (50%)812%2 (20%)8 (80%)1014%
TcMar-Tigger (DNA) 1 (100%)11%
ERVL-MaLR (LTR)4 (27%)11 (73%)1522%4 (36%)11 (64%)1521%
ERV (LTR)9 (45%)11 (55%)2030%2 (15%) 11 (85%)1318%
L1 (LINE)3 (50%)3 (50%)69%1 (9%)10 (91%)1115%
L2 (LINE) 4 (100%)46% 7 (100%)710%
L3-CR1 (LINE)1 (50%)1 (50%)23%1 (100%) 11%
Alu (SINE)3 (33%)6 (67%)913%1 (13%) 7 (87%)811%
MIR (SINE) 2 (100%)23% 3 (100%)34%
SVA (retroposon)1 (100%) 12%3 (100%) 34%
Total25 (37%)42 (63%)67 (100%)100%14 (19%)58 (81%)72 (100%)100%
Beta Block (354.000 bp)
TE Family (Class)R_SVA_25: TE Number and % RegulatedR_SVA_26: TE Number and % Regulated
UpDownTotal/TE% of 55UpDownTotal/TE% of 40
hAT-Charlie (DNA)1 (25%)3 (75%)47%2 (50%)2 (50%)410%
ERVL-MaLR (LTR) 1 (100%)12%
ERV (LTR)3 (18%)14 (82%)1731%3 (50%)3 (50%)615%
L1 (LINE)7 (39%)10 (61%1731%10 (53%)9 (47%)1948%
L2 (LINE)2 (67%)1 (33%)35%1 (50%)1 (50%)25%
L3-CR1 (LINE)
Alu (SINE)5 (42%)7 (68%)1222%7 (88%)1 (50%)820%
MIR (SINE) 1 (100%)12%
SVA (retroposon) 1 (100%) 12%
Total18 (33%)37 (67%)55 (100%)100%24 (60%)16 (40%)40 (100%)100%
Disclaimer/Publisher’s Note: The statements, opinions and data contained in all publications are solely those of the individual author(s) and contributor(s) and not of MDPI and/or the editor(s). MDPI and/or the editor(s) disclaim responsibility for any injury to people or property resulting from any ideas, methods, instructions or products referred to in the content.

