Abstract
The rapid surge of Artificial Internet-of-Things (AIoT) devices has outpaced the deployment of robust, privacy-preserving anomaly detection solutions suitable for resource-constrained edge environments. This paper presents a two-stage hybrid Federated Learning (FL) framework for IoT anomaly detection and classification, validated on the real-world N-BaIoT dataset. In the first stage, each device trains a generative Artificial Intelligence (AI) model on benign traffic only, and in the second stage a Histogram-based Gradient-Boosting (HGB) classifier labels flagged traffic. All models operate under a synchronous, collaborative FL architecture across nine commercial IoT devices, thus preserving data privacy and minimizing communication. Through both inter- and intra-benchmarking against state-of-the-art baselines, the Variational Autoencoder–HGB (VAE-HGB) pipeline emerges as the top performer, achieving an average end-to-end accuracy of 99.14% across all classes. These results demonstrate that reconstruction-driven generative AI models, when combined with federated averaging and efficient classification, deliver a highly scalable, accurate, and privacy-preserving solution for securing resource-constrained IoT environments.
1. Introduction
The convergence of AI and the Internet of Things (IoT), commonly referred to as Artificial Intelligence of Things (AIoT), has revolutionized manufacturing processes by enabling intelligent automation, real-time monitoring, and data-driven decision-making. As manufacturing industries increasingly adopt these technologies to achieve sustainability goals, the security of AIoT systems has emerged as a critical factor in ensuring the success of any industrial system [1,2].
Secure Industrial IoT (IIoT) systems play a pivotal role in optimizing resource utilization and minimizing waste in manufacturing environments. When IIoT systems maintain their integrity through robust security measures, they provide accurate and reliable data that forms the foundation for precise resource allocation decisions. Manufacturing facilities equipped with secure sensors and analytics platforms can monitor material consumption with high precision, enabling just-in-time inventory management that prevents overproduction and reduces warehousing requirements [3].
The protection of AIoT systems against malicious tampering is particularly crucial for resource conservation. Unauthorized access to production systems could lead to deliberate or accidental alterations of manufacturing parameters, potentially resulting in significant material waste. For instance, a compromised AIoT system controlling raw material dispensing could cause excessive material usage, directly contradicting sustainability objectives. Secure authentication mechanisms, encryption, and access controls prevent such scenarios by ensuring that only authorized personnel can modify production parameters [4]. Figure 1 shows the relationship between IoT and AIoT.
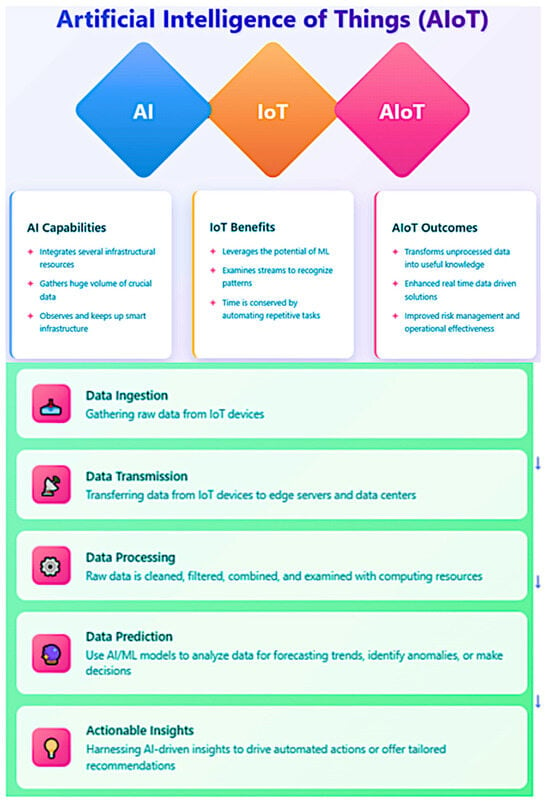
Figure 1.
AIoT vs. IoT vs. AI.
This study is motivated by two main factors. The swift expansion of IoT-based devices (IIoT/AIoT) across diverse industrial sectors has heightened the dangers of cyberattacks, which may result in substantial operational interruptions. Conventional security solutions frequently fail to adequately handle the dynamic and diverse characteristics of IoT device ecosystems. Secondly, current adaptations of AI present new chances to explore its potential in enhancing cybersecurity measures; however, this necessitates meticulous adaptation to the decentralized and data-sensitive environments of IoT devices. This research provides numerous substantial advances to the domain of cybersecurity in IoT devices through the following contributions:
- Inter-Benchmarking of Hybrid Learning Approaches: A variety of hybrid learning approaches that utilize generative and predictive AI architecture were proposed and internally compared on the N-BaIoT dataset.
- Intra-Benchmarking of Hybrid Learning Approaches: These proposed hybrid learning approaches were compared against external models that were applied on the same dataset in other articles.
- Incorporating a Federated Learning (FL) Framework into a Hybrid Learning Approaches: The Adoption of a synchronous and collaborative FL architecture enhances effective model training while preserving data privacy. This system facilitates incremental and collaborative learning from dispersed data sources, essential for dynamic and scalable IoT environments.
- Validating the Federated Hybrid Learning Approaches with Real-World Data: We validate our hybrid learning approaches utilizing the extensive N-BaIoT dataset derived from real IoT operations, guaranteeing that the models are resilient and efficient across diverse situations and attack vectors. Additionally, the hybrid learning approaches perform empirical evaluation with real traffic data, gathered from nine commercial IoT devices infected by authentic botnets from two families (N-BaIoT dataset).
These contributions seek to deliver a scalable, efficient, and privacy-preserving solution to cybersecurity issues in the IoT sector, utilizing both asynchronous and collaborative learning modalities inside federated learning.
2. The Value of Secured IoT Networks in Manufacturing
Predictive Maintenance (PdM) represents another area where AIoT security significantly contributes to resource conservation. Secure PdM systems analyze equipment performance data to accurately forecast maintenance needs, preventing both premature part replacements and catastrophic failures. When these systems are protected against data manipulation, they maintain prediction accuracy and extend equipment lifespan.
Research demonstrated that secure predictive maintenance systems significantly reduced spare part consumption compared to traditional maintenance approaches, directly contributing to resource conservation and waste reduction [5]. Lampropoulos et al. [6] further highlight that AIoT can optimize processes regarding the production, distribution, consumption, and reuse of renewable resources. Their comprehensive bibliometric analysis of 9182 academic documents confirms that secure AIoT implementations have emerged as important contributors to ensuring sustainability in manufacturing operations.
Energy consumption represents one of the most significant environmental impacts of manufacturing operations. Secure AIoT systems enhance energy efficiency through multiple mechanisms.
Matin et al. [3] demonstrate that AIoT implicitly reduces energy consumption and environmental pollutants through enhanced resource and process scheduling. Their research shows that intelligent systems can analyze operational data to identify energy optimization opportunities that might otherwise remain undetected. Sasikumar et al. [7] present an improved Delegated Proof of Stake (DPoS) algorithm-based IIoT network that combines blockchain and AI for secure real-time data transmission. Their evaluation reveals that this consensus algorithm significantly reduces energy consumption while simultaneously addressing security vulnerabilities. This dual benefit illustrates how security and sustainability can be mutually reinforcing in AIoT implementations.
The architectural design of AIoT systems also impacts energy efficiency. Villar et al. [4] explain that Fog computing creates an intermediate layer between Edge and Cloud where data can be processed locally, reducing both latency and energy consumption associated with data transmission. However, they emphasize that these architectural components must be secured against potential attacks to maintain their energy-saving benefits.
However, there is lack of studies in the literature that show the final net energy savings in IoT-operated manufacturing processes which deploy an AI-based defensive cybersecurity mechanism.
Sustainable manufacturing extends beyond the factory floor to encompass the entire supply chain. Nozari et al. [8] conducted a comprehensive analysis of AIoT challenges in smart supply chains, finding that cybersecurity and lack of proper infrastructure are the most significant barriers to implementation. Their research demonstrates that when these challenges are addressed, AIoT innovations can provide critical information for features such as tracking and instant alerts that improve decision-making throughout the supply chain.
The integration of secure AIoT technologies in supply chains improves information exchange and facilitates monitoring of physical goods. Their study of Fast-Moving Consumer Goods (FMCG) industries revealed that AIoT capabilities such as transparency, agility, and adaptability offer tremendous opportunities to address supply chain management challenges more effectively, but only when properly secured.
Blockchain technology plays a particularly important role in securing supply chain data. Sasikumar et al. [7] explain that blockchain promotes a decentralized architecture for Industrial IoT applications, encouraging secure data exchange among various nodes. This secure exchange is essential for maintaining the integrity of sustainability certifications and enabling manufacturers to verify compliance with environmental standards across their supplier networks.
Manufacturing industries face increasingly stringent environmental regulations that require accurate monitoring and reporting. Secure AIoT systems ensure the integrity of data collection processes for environmental impact reporting, preventing both intentional falsification and accidental corruption of emissions and resource consumption data.
Lampropoulos et al. [6] demonstrate that AIoT can assist in achieving sustainable development goals through optimization of processes and promotion of sustainable practices. Their research shows that AIoT has emerged as an important contributor to ensuring sustainability and achieving sustainable development goals, but emphasizes that security is essential for maintaining the integrity of these systems and the decisions based on them.
Villar et al. [4] highlight that reference architectures based on standards guide developers to create compliant AIoT applications. These architectures incorporate security considerations that help ensure regulatory compliance while also providing the flexibility needed to adapt to evolving requirements.
The standardization of security practices in AIoT implementations helps manufacturers maintain consistent compliance across different operational contexts. Blockchain integration provides transparent and verifiable tracking throughout systems [7]. This transparency benefits both regulatory authorities and consumers increasingly concerned with the environmental impact of products. The immutability of blockchain records, ensured through robust security measures, provides confidence in the validity of sustainability claims.
The concept of product lifecycle management has evolved significantly with the advent of AIoT. Matin et al. [3] observe that AIoT is involved in the complete cycle of sustainable production: product design, process planning, sustainable machining, process scheduling, energy consumption, and supply chain. This comprehensive involvement allows for optimization at each stage of the product lifecycle but requires consistent security measures throughout.
Sasikumar et al. [7] identify three fundamental innovative models that enable long-term digitization of a smart circular economy: IIoT, Edge-based computing, and AI. All of them are features or components of an AIoT. Their research demonstrates that when these technologies are securely integrated, they can significantly increase proper recycling rates for complex products, reducing landfill waste and enabling more effective recovery of valuable materials [9].
The digitization of industry and the attainment of Industry 4.0 (I4.0) objectives are facilitated by the adoption of emerging technologies, including AI and IoT. Implementing these emerging technologies in industrial manufacturing can enhance product quality, machine efficiency, employee safety, and PdM strategies, while simultaneously reducing overall energy consumption, adverse environmental impacts, and production costs [10,11].
The AIoT infrastructure incorporates cognitive capabilities into IoT devices to improve IoT operations, big data analytics, and human–machine interactions. This exemplifies an IoT system. AIoT-based solutions are crucial in sustainable manufacturing since they facilitate decision-making through extensive data provided by numerous sensors across diverse industrial processes, effectively addressing significant sustainability issues, especially within manufacturing sectors. To achieve the goals of sustainable manufacturing, it is essential to include modern technology [12].
To ensure industrial sustainability, AI and IoT applications such as fuzzy controllers, intelligent scheduling, knowledge-based expert systems and different Machine Learning (ML) and Deep Learning (DL) models have lately been adopted in several manufacturing sectors [13]. Over the past two decades, there has been an increased necessity to employ AI and ML technology for monitoring the risk profiles of supply chain management. Focused on a specific domain Research on AIoT-based sustainable manufacturing is underway, and its integration into manufacturing industries is in the preliminary phase.
The future of manufacturing is progressively accelerating to a data-driven domain. Manufacturers can enhance decision-making and optimize operations by collecting and analyzing data from diverse process segments using many sensors. Nonetheless, it is challenging to integrate them through conventional ML methodologies to achieve real-time forecasting, monitoring, defect or anomaly detection, and decision adjustment. AIoT can evaluate extensive data from many perspectives and extract feature properties with AI approaches to address this issue [14]. Consequently, AIoT encompasses the entire cycle of sustainable production, including product design, process planning, sustainable machining, process scheduling, energy consumption, supply chain management, and cyber security [15,16,17].
AIoT comprises two levels of technology. The first category is computing technology, encompassing Big Data, ML, computer vision, embedded computing, sensors and networks, and Edge computing. The other pertains to certain industrial sectors and addresses PdM tools, process mining, cybersecurity, and optimization. AIoT networks improve the quality of products, maximize machine functionality, minimize expenses, and increase operational efficiency. To obtain optimal efficiency, an AIoT network must perform two fundamental functions: building connections between devices and a centralized system, and simplifying the storage, management, analysis, and effective exploitation of the collected and supplied data. These networks involve various interconnected industrial devices, sensors, and systems that methodically acquire, disseminate, and analyze data to optimize industrial processes and assist informed decision-making. AIoT-based technologies have been integrated into different domains or sectors of the economy, including smart agriculture, smart healthcare, smart homes, smart cities, smart environments, supply chains and circular economies, industrial control units, renewable energy, tourism business, scheduling tasks, and cybersecurity [18].
IoT has focused on the connecting of devices across extensive networks to enable data interchange, management, and aggregation. This fundamental principle has progressed with the emergence of AIoT, which augments IoT by integrating intelligent functionalities into devices. This connection allows devices to independently assess data, make intelligent judgments, and perform actions in real time, thus revolutionizing the operational landscape across multiple industries, including industry, healthcare, smart cities, and cybersecurity [19,20].
IoTs are defined by an extensive network of networked devices that gather and disseminate data, profoundly influencing daily human activities and decision-making processes. The integration of AI with IoT not only improves the capabilities of these devices but also facilitates the processing of substantial amounts of data produced by IoT systems. This feature is essential for acquiring actionable insights and enhancing and securing service delivery in applications like manufacturing, smart healthcare and intelligent transportation systems [21,22]. As the number of sensors continues to increase, the potential of AI in securing these sensors locally at the device Edge layer is increasingly becoming vital.
Furthermore, AIoT promotes the creation of intelligent systems capable of learning from their surroundings and adapting accordingly [23]. This is especially apparent in collaborative decision-making frameworks that utilize AI to enhance resource allocation and operational efficiency in smart cities [24]. The incorporation of AI methodologies allows IoT devices to execute tasks and enhance their performance over time via learning and adaptation, hence augmenting the overall user experience and operational efficiency [25].
AIoT is a transformative technological convergence that enhances the functionalities of IoT devices through the integration of AI. This combination enables real-time data analysis and decision-making while fostering new applications across diverse sectors, ultimately resulting in more intelligent and efficient systems that can substantially enhance operational efficiency while being able to maintain its high levels of cybersecurity [26,27]. By means of local data processing, AIoT infrastructures possess the capability to make rapid decisions autonomously, without the need for ongoing human oversight [28,29,30].
The exponential increase in data created by IoT devices revealed that conventional cloud-based processing models were inadequate for managing the scale, speed, and complexity necessary for real-time decision-making. This resulted in the incorporation of AI functionalities directly into IoT systems. This substantiates the assertion that conventional cloud-based models are inadequate for real-time decision-making [31].
IoT infrastructures were developed to facilitate uninterrupted connectivity and optimize data sharing. As these frameworks evolved, the limitations of centralized cloud computing became increasingly apparent, prompting a transition to more decentralized solutions [32,33]. The integration of AI into IoT systems transforms data management through the implementation of Edge computing, which enables processing at the network’s peripherals.
This transformation diminishes latency, enhances privacy, and equips devices with autonomous capabilities [34,35]. The inherent interoperability of these systems facilitates cohesive integration across diverse sectors, from smart city infrastructures to precision agriculture, creating a dynamic and adaptive network that continuously learns and enhances its operational efficiency [36,37]. For example, IoT technologies facilitate real-time data collection and analysis, which are essential to optimize urban operations and services in smart city initiatives [38].
As device interconnectivity expands, the significance of cybersecurity inside the IoT ecosystem will become increasingly vital. The increase in connected devices expands the attack surface for cybercriminals, necessitating the implementation of stringent security measures to safeguard critical information and uphold consumer trust. Future developments will likely focus on establishing decentralized security frameworks that utilize edge computing and federated learning models.
FL enables the training of ML models across numerous decentralized devices while maintaining data locality, hence enhancing privacy and security by reducing the likelihood of data breaches. As these technologies advance, they will be important in creating a secure and robust IoT infrastructure [39,40]. Table 1 provides a brief description of these layers and their functions.

Table 1.
Brief description of IoT/AIoT layers and their functionalities.
It is worth noting that some components can perform more than one task or role. For example, the Edge components do much more than just data collection, it can perform data processing, analytics, and even run AI models directly at the edge. This is a key aspect of modern IoT architecture that enables reduced latency, bandwidth optimization, and improved privacy.
In IoT architectures, the Security layer is typically represented as a cross-cutting concern that connects with all other layers in the stack. This is because security must be implemented at every level of architecture. Models of Intrusion-Detection Systems (IDS) typically operate at the intersection of the Edge layer and Security layer, but they can also extend to other layers depending on the implementation. At the Edge layer, IDS can perform real-time monitoring and detection of anomalies in device behavior and network traffic.
Within the Security layer, IDS provides security policies, detection algorithms, and response mechanisms. And In the Fog/Cloud layers, more sophisticated IDS models might leverage additional computing resources for deeper analysis and correlation of security events. Thus, AI techniques can be integrated across these layers for data interpretation via IDS. IDS serve a crucial role in protecting IoT networks by recognizing and reducing any anomalies [41]. Some specialized IoT architectures might use a dedicated Processing Layer. Figure 2 shows how physical and digital technologies integrate in IoT devices.

Figure 2.
Technological integration in IoT and AIoT devices.
Benchmarking on IoT-based traffic data also allows for a realistic assessment of a model’s robustness and adaptability to real-world network conditions. This process helps ensure that the models are not just theoretically sound but also practical and effective in diverse and potentially noisy environments. Additionally, since AIoT-specific datasets are still relatively scarce, using IoT data enables ongoing research and development without unnecessary delays, allowing for faster iteration and improvement of security solutions.
Furthermore, insights gained from analyzing IoT traffic can often be transferred to AIoT contexts, especially when the underlying technologies are similar. This approach also helps researchers identify any limitations in their models and highlights areas where further adaptation or additional data might be necessary to address AIoT-specific threats. Overall, leveraging IoT traffic data for benchmarking is a pragmatic and efficient way to drive progress in AIoT cybersecurity, even in the absence of dedicated AIoT datasets.
3. AI and Generative AI
Generative AI comprises multiple interconnected components that dictate its functionality and adaptability across various applications. These fundamental components affect the generative AI’s ability to process information, make decisions, and interact with human users [42]. The field of AI is changing quickly, especially with the rise of generative AI, unlike Narrow AI, which is designed to complete a particular cognitive capability and is limited by its inability to learn independently.
Narrow AI can also be called Artificial Narrow Intelligence (ANI) or weak AI. ANI utilizes ML, Natural Language Processing (NLP), and DL via advanced variations in algorithms made up of Neural Networks (NNs) to complete specified tasks [43,44,45]. Some examples of narrow AI include self-driving cars, which rely on computer vision algorithms, and AI virtual assistants. Artificial General Intelligence (AGI), also called general AI or strong AI, refers to a form of AI that can learn independently, think, and perform a wide range of tasks at a human level. The ultimate goal of AGI is to create machines capable of versatile, human-like intelligence, functioning as highly adaptable assistants (AI Agents) in everyday life. Generative AI is a form of AGI [46,47,48]. Figure 3 illustrates generative AI with respect to AI, DL, and ML
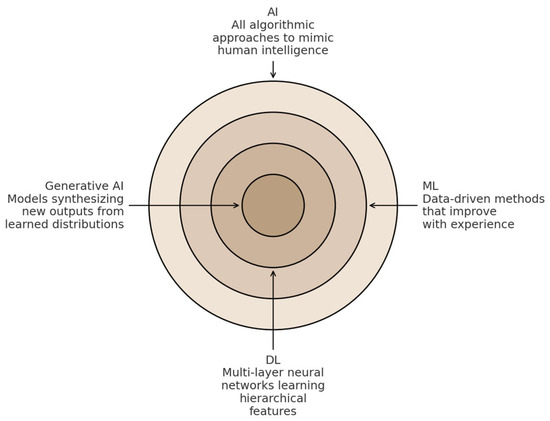
Figure 3.
Generative AI within AI, ML, and DL.
Generative AI is a form of AGI capable of producing original content rather than merely analyzing existing data. It employs intricate algorithms, like Generative Adversarial Networks (GANs), to produce diverse outputs, such as text, photos, design prototypes, and music. Generative AI models fundamentally consist of intricate interactions among various software, simulations, algorithms, and statistical models. This encompasses GANs and their expansions (such as multi-agent systems), Variational Autoencoders (VAEs), diffusion models, flow-based models, and transformer neural network architectures [49].
GANs comprise two NNs that collaboratively generate data that mimics real data, offering innovative design alternatives that may have been overlooked. The generator NN, functioning in an unsupervised manner, learns to model the data distribution, while the discriminator neural network assesses the authenticity of the generator’s output. As training advances, both networks enhance their performance, yielding outputs that increasingly resemble the target data. GANs can expedite the prototyping process, reduce costs, and minimize material waste, thereby supporting sustainability goals. Furthermore, employing GANs to produce synthetic datasets can enhance the training of machine learning models, particularly when actual data is scarce or difficult to obtain. Nonetheless, GANs may encounter mode collapse, wherein the generator fails to encapsulate the complete diversity of the data. To mitigate this issue, extensions such as multi-agent GANs, which utilize multiple generators in conjunction with a single discriminator, have been proposed [50].
VAEs employ variational inference to approximate intricate distributions, producing novel data that closely resembles the training samples. A VAE consists of two primary components: an encoder that compresses the input into a latent representation, and a decoder that reconstructs the input from this compressed format. VAEs are utilized in diverse applications, such as text generation in Large Language Models (LLMs), image synthesis, and anomaly detection. Diffusion models are predominantly employed for the generation of optimized images; their outputs typically display a more complex and semantically enriched distribution relative to the original data. Flow-based models operate by transforming data from a basic distribution, such as Gaussian, to a more intricate target distribution via an invertible transformation referred to as a flow. Their computational efficiency and generalizability render them especially advantageous in computer vision, NLP, anomaly detection, and generative design. Transformer models, a category of NNs architecture, are widely employed in signal processing, NLP, computer vision, audio and speech analysis, as well as in multimodal tasks. Transformers utilize an attention mechanism that adeptly captures contextual relationships within sequential data, allowing them to execute a wide array of functions with exceptional accuracy [51].
4. Cybersecurity Threats for IoT-Based Devices
In the current hyper-connected environment, where IoT-based devices are integral to daily life, cybersecurity is of paramount importance. Previously independent devices, like smart homes, wearables, and industrial automation systems, now interact with each other, forming a complex network of interconnectivity. This interconnected society and enterprises offer convenience and efficiency, yet it also introduces significant security dangers [52]. Figure 4 shows the most common types of attacks on IoT-based devices [53]. Table 2 briefly describes these attacks [54].
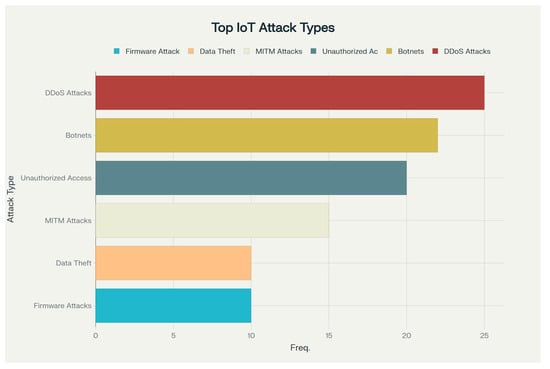
Figure 4.
Percentage of the most common types of attacks on IoT and AIoT devices.

Table 2.
Brief description of the most common types of attacks on IoT and AIoT devices.
The interdependent characteristics of IoT systems inside IIoT environments imply that a security breach in a single device or component might trigger cascade repercussions, resulting in significant outcomes such as financial losses, reputational harm, legal liabilities, and compromised consumer data [43]. To effectively manage these risks, firms must adhere to best practices for safeguarding their IoT infrastructure in industrial settings. This entails performing comprehensive risk assessments, establishing stringent authentication and access controls, encrypting data both in transit and at rest, employing secure communication protocols, consistently updating software and firmware, and sustaining ongoing surveillance for potential threats and anomalies locally and at end points via the Edge computing layer [55] that exists in AIoT devices or a Cloud layer depending on the type of the IoT device and its setup and protocols. Anomaly detection provides a unifying defense by flagging deviations from “normal” IoT behavior. When an IoT sensor network is instrumented to monitor a physical quantity like temperature, each of the six most attack classes discussed in Table 2 will induce characteristic “anomalies” in the time-series data or associated metadata. Table 3 shows how these deviations could manifest.

Table 3.
Induced characteristic “anomalies” in the time-series data of AIoT instrumented to monitor a physical quantity like temperature as an example.
IoT-based devices are progressively capable of managing a substantial share of their cybersecurity responsibilities directly at the Edge layer, thereby alleviating numerous hazards prior to any data transmission from the device. Table 4 list the most common utilized methods in managing IoT cybersecurity at the Edge layer.

Table 4.
Utilized methods in managing IoT-based devices cybersecurity.
Notwithstanding considerable progress in on-device anomaly detection, IoT security is still impeded by several enduring challenges: resource limitations on small or battery-operated devices restrict their capacity for continuous, computationally intensive inference; the diverse array of IoT hardware complicates the implementation of uniform security toolchains across various edge nodes; and managing timely, secure firmware updates at scale remains one of the most daunting operational obstacles. Thus, the most robust architectures implement a hybrid model wherein AIoT devices establish the initial line of defense locally, addressing immediate threats and optimizing bandwidth, while cloud-based services facilitate centralized policy orchestration, long-term threat correlation, and the extensive analytics necessary for forensic investigations [59]. Figure 5 shows visual summary of security challenges in IoT and AIoT devices [60].

Figure 5.
Security challenges in IoT and AIoT devices.
These security concerns may arise at several levels of the AIoT architecture, including the perception, network, and application layers, each with unique vulnerabilities and consequences.
The application layer of IoT is notably vulnerable to diverse cyberattacks owing to its intricate and linked characteristics. At this stage, assailants can apply advanced strategies, such as fraudulent data injection, to elude detection while manipulating sensor data. These assaults aim at the software and apps operating on IoT devices, potentially resulting in illegal control and data manipulation and hence compromising the entire functionality of industrial systems. Such attacks can hinder operations, impair data integrity, and inflict severe financial and reputational harm.
IoT systems are particularly susceptible to ransomware attacks because of their dependence on networked equipment and protocols. Cascading assaults transpire when the interplay of various devices and services, frequently enabled by platforms, causes vulnerabilities. The escalating utilization of IoT devices, particularly with the emergence of 6G technologies, heightens the potential of data breaches and infringements of privacy. The connected qualities of these devices leave them vulnerable to unauthorized access and data exfiltration. Eavesdropping and spoofing attacks entail the interception and modification of communications between devices [61].
Eavesdropping allows adversaries to acquire unauthorized access to sensitive knowledge, whereas spoofing comprises the impersonation of a device to manipulate data or processes. Creating AI security solutions might ease these vulnerabilities in IoT, thereby lowering the possibility of application-level attacks. Techniques like micro-perturbations uncover concealed intruders by executing little-controlled modifications to sensor readings, simplifying the discovery of illicit data without affecting system operations. Balancing the deployment of AI for security improvement with the mitigation of associated risks is crucial for the sustained advancement of AIoT systems [62,63,64].
As was mentioned in Section 3 of this paper, IoT architecture typically do not come with a dedicated layer explicitly called “Processing Layer”. Instead, processing functionality is distributed across multiple layers (Edge, Fog, and/or Cloud) in the architecture. Such processes are subject to multiple vulnerabilities that might affect the security and effectiveness of any AIoT-based systems. These attacks exploit vulnerabilities in the network, devices, and data processing systems, requiring thorough detection and mitigation protocols. Figure 6 illustrates cybersecurity threats in the Edge computing layer and how the Edge computing layer helps in mitigating these threats.
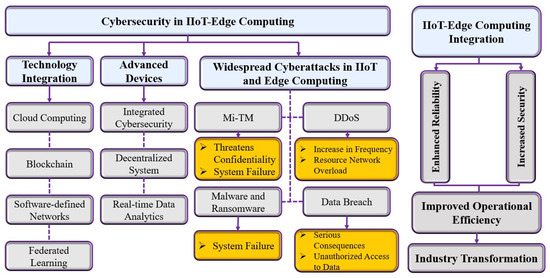
Figure 6.
Cybersecurity threats in the Edge computing layer.
Network-level attacks often involve intrusion efforts that can disrupt communication between devices. The network layer is particularly susceptible to intrusion attacks, including DDoS attacks, which can saturate network resources and IoT services by inundating the network with excessive data [65]. Strategies such as Temporary Dynamic Internet Protocol Addressing (TDIP) effectively mitigate such attacks by continuously changing Internet Protocol (IP) addresses, hence improving network security. Malefactors can penetrate IoT devices and create botnets, networks of hacked devices employed for large-scale attacks such as DDoS. These attacks can overwhelm AIoT systems, leading to significant downtime and operational failures [66,67].
The perception layer of IoT is crucial for the acquisition and processing of data from numerous sensors and devices. However, it is susceptible to several types of attacks that can compromise data integrity, confidentiality, and availability. Perception layer attacks target devices and equipment that interact with the physical world, such as sensors, actuators, controllers, and other components within the perception layer. Malefactors may use these limitations to introduce inaccurate data or disrupt data collection processes. Physical layer attacks involve the alteration of hardware components in IoT systems [68]. These assaults may result in data manipulation, unauthorized access, and other security violations, potentially causing significant consequences for industrial systems.
IoT systems that incorporate video are vulnerable to motion-based video assaults. These assaults utilize spatiotemporal attention networks to generate subtle disturbances that are difficult for human observers to detect [69]. In IoT-based smart grids, adversarial attacks can corrupt text data processed by NLP technology. These attacks can alter sentence-level data, misleading classification algorithms without significantly changing the semantic meaning [70]. Figure 7 shows a summary of cybersecurity threats on different layers of AIoT devices [71,72,73,74,75,76,77,78,79,80].
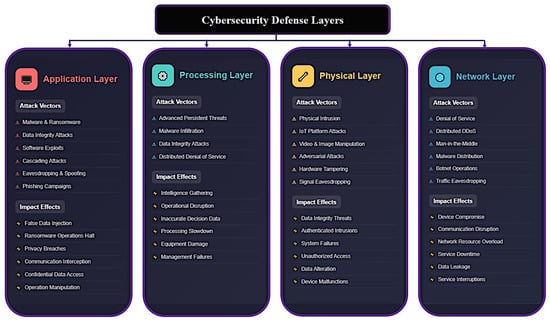
Figure 7.
Common attack on different layers of AIoT devices and their risks.
As we enter a future where almost every gadget used by humans is connected to the internet, safeguarding their security is paramount. Network defense systems seek to achieve three fundamental objectives: confidentiality, availability, and integrity. Methods for identifying and mitigating network intrusions can be generally classified according to their emphasis: threat identification, threat neutralization, or a synthesis of both approaches. The research delineates two principal ways to counteract attacks: IDS and Intrusion Prevention Systems (IPS).
IDS functions as a warning system, identifying prospective intrusions without implementing corrective steps, whereas IPS actively engages in countering recognized threats [81]. Nonetheless, IPS has difficulties with false positives, potentially leading to the obstruction of legitimate users. IDSs are frequently highlighted due to apprehensions about false alarm rates, particularly in the context of malware detection. Classification can be further delineated based on the target location of the intrusion detection system: Host-based IDS, Network-based IDS (NIDS), or Hybrid IDS.
Host-based IDS is designed for individual systems, providing robust detection of internal intruders and comprehensive evaluations of compromise severity; yet, it is expensive due to its one-to-one requirement [82]. NIDS is proficient in identifying external threats and provides a protective framework for numerous hosts, yet it encounters difficulties in analyzing high-volume traffic in certain instances [83].
Hybrid IDS merges the advantages of both host- and network-based solutions, hence enhancing security [84]. Active IDS implement actions in response to certain signals, while Passive IDS only generate alarms or reports. From an architecture perspective, Centralized IDS implement distinct monitoring units for each host; nonetheless, they exhibit limited scalability and are susceptible to single points of failure. In contrast, Distributed IDS utilizes a Peer-to-Peer (P2P) design, wherein each monitoring unit concurrently functions as an analysis unit, providing a more adaptable and resilient solution.
Threat detection primarily utilizes two principal methodologies: Signature-based Detection and Anomaly-based Detection [85]. Signature-based approaches face constraints, especially in the context of Botnets, as these botnets sometimes undergo mutations that modify their identifying signatures. This renders the technique less efficacious for identifying novel Botnet variations in practical situations. Anomaly-based detection approaches are preferred as they operate under the premise that the behavioral patterns of Botnet traffic will diverge from typical network traffic [86]. Alternative approaches, such as Community-Based Anomaly Detection, utilize Communication Graphs to detect Bots. This technique necessitates a complete graph for precise outcomes.
Certain research use specific protocols or frameworks for Botnet identification; however, these methodologies are not universally applicable due to the varying architecture employed by different Botnets [87,88]. The Bad Neighborhood approach is a prevalent tactic employed in Phishing Detection. It entails the identification of clusters of malicious IP addresses that are active throughout a defined period. Nevertheless, the practicality of this strategy is constrained by the pervasive occurrence of DDoS attacks and the complexities involved in establishing such clusters [89,90]. Figure 8 shows different IDS and their relationships with each other. Figure 9 show the categories of threat detection techniques [53,91,92,93,94,95].
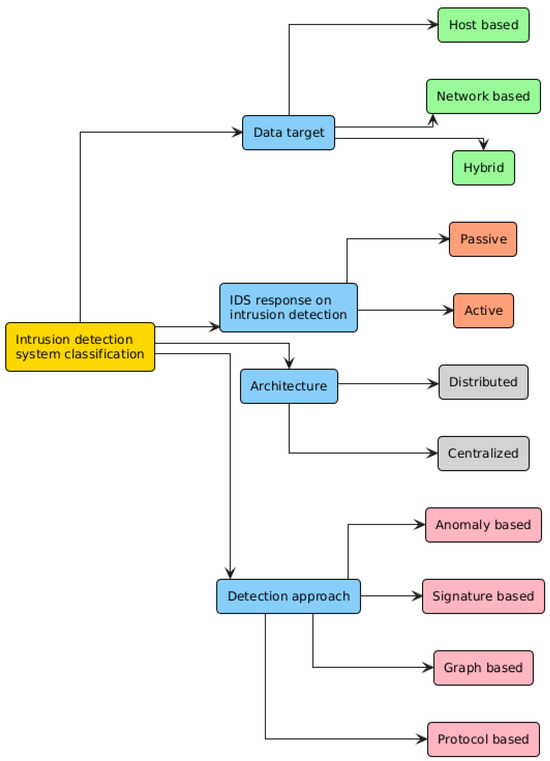
Figure 8.
Illustration of the different IDS.
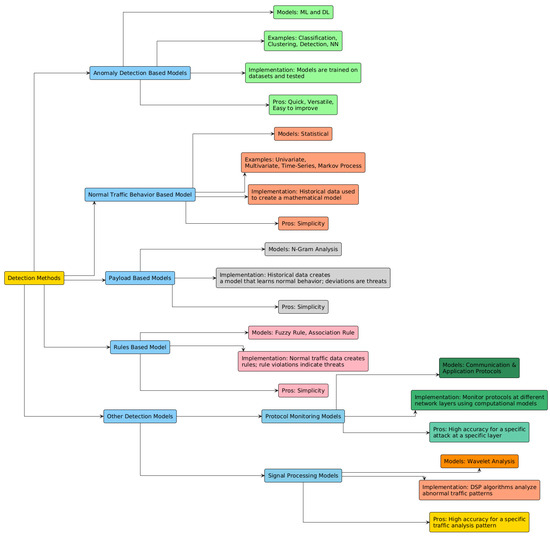
Figure 9.
Categories of threat detection techniques.
Developers must meticulously choose algorithms that are most appropriate for their particular domain while developing intelligent systems. Random Forests (RF) is frequently utilized because of its ensemble learning features, which can enhance the development of more adaptive systems. Random Forest also demonstrates proficiency in managing both categorical and continuous variables, in addition to addressing missing data. Nonetheless, its computational complexity presents difficulties. Support Vector Machines (SVM) and Naive Bayes (NB) serve as alternate options, each possessing distinct advantages and disadvantages.
DL models such as Deep Neural Networks (DNNs) and Recurrent Neural Networks (RNNs), in conjunction with ML models like RF and Decision Trees (DT), have attained accuracy rates above 100%. Recent studies emphasize hybrid or ensemble models that integrate sophisticated techniques like Convolutional Neural Networks (CNN) and Long Short-Term Memory (LSTM) to enhance accuracy. Alternative approaches, such as Gated Recurrent Units (GRU), may also be widely utilized due to their efficiency benefits.
5. The Role of AI in Defensive Cybersecurity of IoT-Based Devices
IoT-based devices generate data at different scales, from bytes to kilobytes per second, contingent upon the application. Data can frequently hold paramount significance, like healthcare records or defense information. DDoS assaults are significant cybersecurity concerns, with IoT devices being especially susceptible to exploitation as conduits for these attacks. This is due to the fact that most IoT devices, such as baby monitors or smart toys, possess restricted user interfaces, hindering people from recognizing that their item has been compromised. With the increasing integration of IoT into many industrial and domestic applications, the pursuit of effective security measures has become paramount. In this section, an overview of scholarly works employing weak AI and generative AI models to flag various types of cyberattacks is provided.
Defensive cybersecurity focuses on preventing attacks with firewalls and monitoring, while offensive cybersecurity proactively seeks vulnerabilities through simulated attacks. Defensive measures are the first line of protection, but offensive tactics reveal weaknesses and improve overall security resilience [96,97].
To protect institutions and individuals from cyberattacks, it is crucial to analyze and classify network data first, facilitating the detection of anomalous and malicious intrusions. Due to the critical importance of categorizing harmful data, several researchers have sought to improve classification techniques by utilizing artificial intelligence. Numerous studies have focused on detecting anomalous and aberrant network activity.
Abu Al-Haija et al. developed a DL-based intelligent detection solution for IoT cybersecurity via convolutional neural networks. They utilized the NSL-KDD dataset to validate their approach, attaining an accuracy rate surpassing 99.3% for binary classification and 98.2% for multiclass identification. Their forthcoming efforts intend to enhance their technology to intercept and examine data packets within the IoT network [98].
Khan et al. propose a blockchain-based security solution for IoT, utilizing the capabilities of Extreme Learning Machine (ELM). Their methodology confirmed the integrity, confidentiality, and availability of blockchain-enabled smart homes. Initial data indicated negligible ELM overheads relative to the resultant cybersecurity advantages. They attained an accuracy of 93.91% utilizing the NSL-KDD dataset, with forthcoming efforts focused on investigating various architectures and datasets [99].
Vanhoenshoven et al. investigated multiple methodologies for identifying malicious URLs. The Malicious URLs Dataset comprises 121 datasets collected over 121 days. The dataset comprises 2.3 million URLs and 3.2 million characteristics. The researchers categorized these URLs into three distinct groups according to particular attributes. Various models, including Multilayer Perceptron (MLP), DT, RF, and KNN, were evaluated using multiple performance criteria, such as accuracy, precision, and recall. The study indicated that all employed approaches demonstrated great accuracy, with the RF model exhibiting exceptional effectiveness at approximately 97% accuracy [100].
Sun and colleagues [101] formulated a model for classifying network traffic, utilizing deep learning techniques with a particular focus on web and data flows. The dataset utilized to train their suggested model was meticulously chosen by the researchers, obtained via intercepting network traffic across many platforms. The Probabilistic Neural Network (PNN) was employed in the analysis, achieving an accuracy of 88.18%, utilizing a 7:3 ratio for training and testing.
Yang et al. [102] initiated a project to develop a system capable of detecting malicious actions within an encrypted network, utilizing deep learning as their tool. The proposed model was based on a Residual Neural Network (ResNet), which has the inherent ability to independently identify unique features while effectively separating the contextual information around encrypted network traffic. Furthermore, their efforts were supported by the utilization of the CTU-13 dataset for model training. In the first data preparation step, the dataset saw multiple modifications. Moreover, they employed Deep-Q-Learning (DQN) to generate adversarial samples of encrypted communication. The result was exceptional, with the model attaining an impressive accuracy rate of 99.94%.
Ongun et al. [103] focused on the CTU-13 dataset, initiating the development of composite models aimed at detecting abnormal network behavior. They utilized Logistic Regression (LR), RF, and GB to develop these models. Their early methodology focused on a connection-level representation, from which features were directly retrieved from the raw connection records. Their research produced an exceptional AUC score of 99%.
5.1. Defensive Strategies Using Generative AI
The literature identifies four major primary approaches and five minor approaches of defensive strategies. Major approaches include adversarial training, dataset balance, data augmentation, and data obfuscation. And minor approaches include generative defense for phishing and social engineering, automated honeypot generation, data sanitization and noise injection, synthetic data generation for privacy and robustness, and generative models for anomaly detection [104]. In some cases, these approaches can be combined to produce a more comprehensive enterprise mechanism to defend against various cybersecurity attacks. Figure 10 shows the applications of generative AI in cybersecurity.
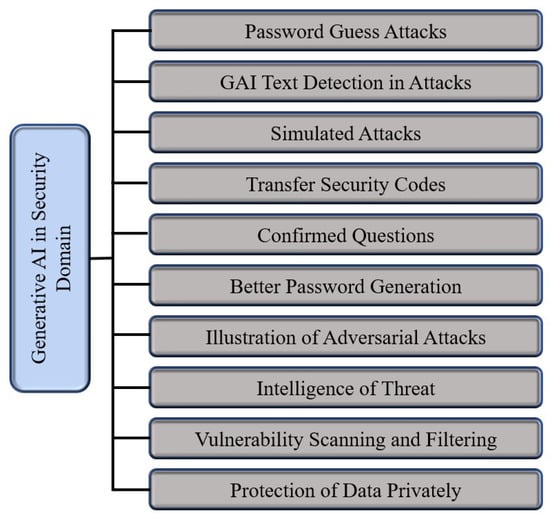
Figure 10.
Generative AI applications in cybersecurity.
Generative models such as GANs and VAEs can assimilate the typical patterns of data and thereafter be employed to identify anomalies or outliers. In cybersecurity, generative AI can assist in detecting anomalous network traffic, fraudulent transactions, or malware by highlighting data that deviates from the established standard of “normal” behavior [105,106].
Zavrak and Iskefiyeli [107] demonstrates that VAEs produce analogous Receiver Operating Characteristic (ROC) curves for attackers exhibiting similar tendencies. Hara and Shiomoto [108] utilized Semi-Supervised Adversarial Autoencoders (SSAAE), attaining equivalent outcomes with markedly reduced labeled data, albeit with an extended training duration.
Li et al. [109] introduce a distinctive GAN-based adversarial training architecture for NIDS. By highlighting the interplay between the generator and discriminator components of GANs, their methodology produces resilient and varied adversarial samples, hence enhancing the NIDS against emerging threats. GANs are widely utilized for the production of synthetic data and the enhanced comprehension of minority groups, as demonstrated by Ferdowsi et al. [110].
Certain research concentrates on certain uses of a specific variant of GANs. For example, [111] employs Conditional-based GANs (CGANs) to produce synthetic samples that replicate the distribution of authentic XSS attack situations. The augmented data is subsequently utilized to train a new model to validate the authenticity and dependability of the synthetic samples. Xie et al. introduced a DL-based multi-label detection approach. The methodology employs Wasserstein-based GANs with Gradient Penalty (WGAN-GP) for data augmentation and to mitigate class imbalance concerns [112].
Liu et al. [113] similarly tackle the deficiency of cyber threat data in the space domain by producing synthetic threat data to enhance intrusion detection and defense. Their methodology enhances current data creation techniques, such as GANs and VAEs, to produce data specifically designed for space systems. Le et al. [114] presented an IDS utilizing a CNN and a CGAN to address the deficiency of training data. Experimental findings indicate that their IDS attained elevated detection rates for nine categories of cyberattacks, surpassing rival methodologies and evidencing its efficacy in bolstering IoT security.
A study by [115] introduced a BiLSTM-VAE model with a dynamic loss function to overcome limitations of traditional methods like scalability and false alarms. By capturing temporal dependencies and addressing data imbalance, their model achieved high accuracy and F1 scores on SKAB and TEP datasets, outperforming existing models. This makes it a reliable and scalable solution for anomaly detection in industrial environments via generative models.
5.2. Defensive Strategies with Federated Learning
Recent studies have highlighted the growing importance of FL within the context of IoT. Despite this, much of the existing research in FL has relied on datasets that do not originate from real-world IoT devices, often overlooking the distinctive characteristics and challenges inherent to IoT data [116].
Hamad et al. [117] demonstrated that FL can effectively leverage distributed data to enhance intrusion detection performance while preserving data privacy. The results highlight the potential of FL to address the unique security challenges in heterogeneous IoT environments, offering improved detection accuracy without the need for centralized data collection [118].
Multiple strategies can be used to implement an FL framework. Self-Learning (SL) is an approach where neither data nor model parameters leave the device; instead, each edge device performs training individually and in isolation. This method serves as a baseline for evaluating learning ability in scenarios where no information is shared between devices, making it useful for understanding the limits of purely local learning. Centralized learning (CNL) involves collecting data from different parties and sending it to a centralized computing infrastructure. The central server is responsible for training the model using all the aggregated data. CNL is often used as a benchmark to assess the maximum learning potential when models are built with access to all available data in one place.
Collaborative learning (CL) encompasses custom variants of distributed learning, including federated learning, where multiple agents benefit from jointly training a model. Notably, Paul Vanhaesebrouck et al. [119] introduced a fully decentralized collaborative learning system in which locally learned parameters are shared and averaged across devices in a peer-to-peer (P2P) network, without the need for a centralized authority to orchestrate the process. This approach enables agents to collaborate and improve their models collectively while maintaining a decentralized structure. To the best of our knowledge, Table 5 shows a list of models that were utilized in FL framework on different IoT datasets [117].

Table 5.
Models used in FL-based IDS framework.
6. Dataset
Meidan et al. [120] compiled an extensive network-traffic dataset (N-BaIoT) by instrumenting nine commercially available IoT devices, including doorbells, thermostats, baby monitors, security cameras, and webcams, inside a controlled laboratory setting. For each device, an initial “benign” profile was established by mirroring all incoming and outgoing traffic immediately following installation and operation under standard settings. This benign capture generally lasted several hours per device and was divided into time periods of 100 ms to one minute, resulting in tens of thousands of benign traffic snapshots per device. Figure 11 shows a descriptive summary of the N-BaIoT dataset.
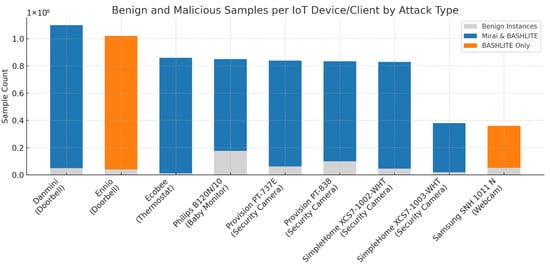
Figure 11.
Benign instances per IoT device with infection status.
Subsequently, each device was deliberately infected, first with the Mirai botnet and then with the BASHLITE botnet, to generate malicious-traffic profiles. During these infection phases, the same port-mirroring process recorded both scanning and attack flows characteristic of each botnet’s propagation and execution stages. By maintaining identical capture durations and windowing parameters, the authors produced parallel malicious datasets for each IoT endpoint. Table 6 shows the different attack vectors that were used to infect the IoT devices.

Table 6.
Attack vectors used to infect devices with BASHLITE and Mirai.
Mirai is a worm-like malware family first identified in late 2016 that systematically scans the Internet for Linux-based IoT devices by exploiting default or weak credentials, integrating them into a substantial DDoS botnet. Its modular, open-source architecture has led to the emergence of numerous variants responsible for some of the largest volumetric attacks recorded [121]. BASHLITE, also referred to as Lizkebab, Gafgyt, or Bashdoor, originated as a lightweight C-based malware that exploits Shellshock vulnerability to infect Unix-like devices. It utilizes straightforward command-and-control protocols to orchestrate various flooding attacks (UDP, TCP, COMBO) and network scans, facilitating high-throughput spam and DDoS operations across extensive networks of compromised IoT devices [122]. Figure 12 shows the target class distributions of these attack vectors.
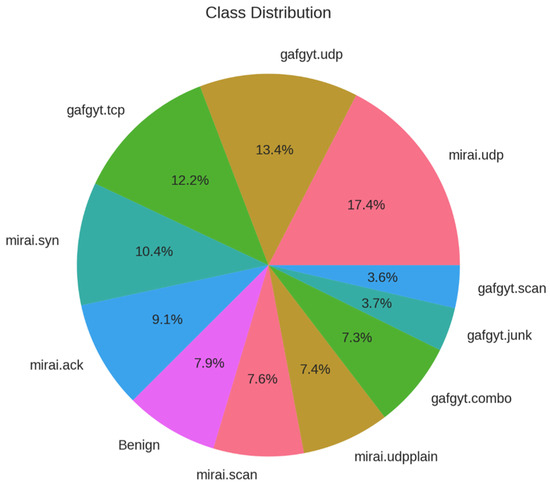
Figure 12.
Target class distribution (attack vectors and benign).
From every captured snapshot (benign or malicious), the dataset authors computed 115 statistical features, encompassing packet counts, byte volumes, inter-arrival jitters, flow durations, and cross-flow correlations. These features, extracted in a lightweight offline process, form the input vectors for per-device deep autoencoder models. In total, the dataset comprises several hundred thousand labeled snapshots across all nine devices and both botnet families, balancing benign and anomalous examples for robust training and evaluation. Table 7 shows the categories of the captured features based on network traffic analysis.

Table 7.
Features categorical breakdown based on network traffic analysis.
The statistical features employed in the N-BaIoT framework demonstrate considerable high variability, as evidenced by their wide value ranges and pronounced standard deviations, ensuring sensitivity to both subtle and extreme deviations from benign traffic patterns. These features follow diverse distributions, encompassing everything from heavy-tailed to near-Gaussian profiles, which allows the model to capture a broad spectrum of traffic behaviors. To balance the influence of recent versus historical activity, the authors introduce time-based decay through lambda parameters (L5, L3, L1, L0.1, L0.01), each weighting feature values according to different temporal windows and thus enabling the detection mechanism to adapt to both short-lived spikes and longer-term trends. Finally, multiple perspectives are integrated, ranging from host-level aggregates and flow-level statistics to port-level dynamics; so that anomalies can be identified across various granularities of network interaction.
The t-distributed Stochastic Neighbor Embedding (t-SNE) is a nonlinear dimensionality reduction method intended for visualizing high-dimensional data in two or three dimensions. It establishes a probability distribution over pairs of high-dimensional points, ensuring that comparable points exhibit high affinity (represented by a Gaussian kernel), while dissimilar points demonstrate low affinity. A comparable distribution is established over the low-dimensional map with a Student’s t-distribution (with one degree of freedom), which mitigates the “crowding problem” by enabling a more accurate representation of moderate distances between features. Figure 13 shows the exploratory data analysis visualization obtained by t-SNE for reference use only.
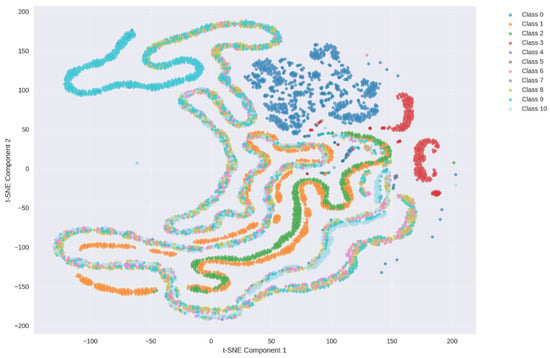
Figure 13.
t-SNE visualization for the N-BaIoT dataset.
7. Methodology
7.1. Preprocessing
In this pipeline each IoT device (client) holds data of the same feature space (the 115 statistical traffic features) but on different samples, and they jointly train a single global model by exchanging model updates (filter model weights) or aggregated statistics (HGB histograms). That is the hallmark of horizontal (or cross-device) FL where all clients share the same input-space schema, and the privacy-sensitive rows (samples) remain local. Vertical FL, by contrast, would involve different features on the same sample set, which is not the case here. Table 8 shows the preprocessing steps that were implemented for each algorithm. Figure 14 shows the data split and aggregation employed by the horizontal (cross-device) FL framework.

Table 8.
List of all preprocessing steps.
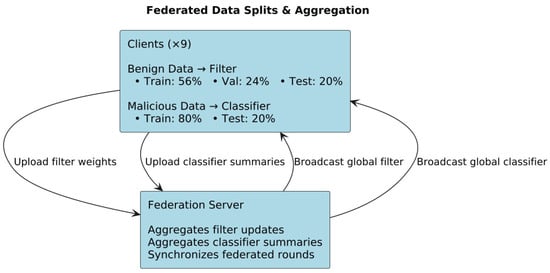
Figure 14.
Federated data split and aggregation.
7.2. FL Framework
Each IoT device in the network acts as an independent federated client that retains its own raw traffic data. Before any model training begins, each client partitions its benign (pre-infection) traffic windows into local training, validation, and test sets, while reserving its malicious (post-infection) windows solely for evaluation. To initiate the federated process, the central server initializes a global filter model with random weights and broadcasts these weights to all clients. Each client then refines its local filter by training only on its benign data for a fixed number of local epochs, minimizing reconstruction loss via stochastic optimization (e.g., Adam). Upon completion of these local updates, clients upload their revised filter weights to the server, which aggregates them using the FedAvg algorithm, weighting each client’s contribution by its benign-sample count. This cycle of broadcast, local filtering, and aggregation repeats for a predetermined number of rounds or until convergence on the global validation loss. Once the filter has converged, the server evaluates reconstruction-error distributions across benign and malicious windows on each client to choose an anomaly threshold that balances detection sensitivity against false alarms.
Although it uses a central server to orchestrate weight-averaging (FedAvg for the filter) and histogram-merging (for the HGB classifier), neither raw data nor unaggregated feature vectors ever leave the devices; only model updates or summary statistics are exchanged. This matches CL’s definition as a distributed-training regime in which multiple agents jointly build a model under a (centralized) orchestration authority, rather than moving all data to one place (CNL) or training strictly in isolation (SL). Figure 15 shows the FL framework simulated in this paper.
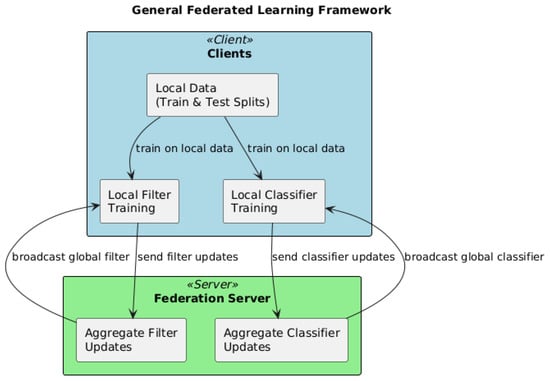
Figure 15.
General FL framework.
After anomaly thresholds are set, the pipeline proceeds to build a global classifier ensemble (HGB) via a federated histogram-based boosting protocol. Each client computes local histograms of feature gradients and Hessians on its malignant traffic windows and sends only these aggregated statistics to the server. The server then merges all client histograms to identify the optimal feature splits at each node of the boosting trees. It broadcasts the chosen splits and updated leaf weights back to the clients, which incorporate them into their local classifier models. This exchange of histogram summaries and split information iterates for a fixed number of boosting rounds, ultimately producing a global classifier that can distinguish benign from malicious traffic and further differentiate between Mirai and BASHLITE activity. Throughout the entire process, raw network flows and feature vectors remain on-device, ensuring data privacy; only model parameters or aggregated statistics traverse the network, and each client’s influence is naturally scaled to its local data volume. Figure 16 shows the architecture of the federated HGB.

Figure 16.
Federated HGB architecture.
7.3. Filter Algorithms
7.3.1. VAEs
The VAE deployed on each IoT client is a compact, fully connected neural “filter” designed to learn a low-dimensional model of normal traffic behavior from 115 statistical features. At its core, the VAE comprises an encoder network that progressively reduces the 115-dimensional input through two hidden layers—first to 64 units, then to 32 units—each equipped with Rectified Linear Unit (ReLU) activations. From this 32-unit representation, two parallel linear transformations generate the parameters of a latent Gaussian distribution (its mean and log-variance), enabling the model to capture uncertainty and variability in benign traffic. Figure 17 shows a summary of VAE federated architecture.
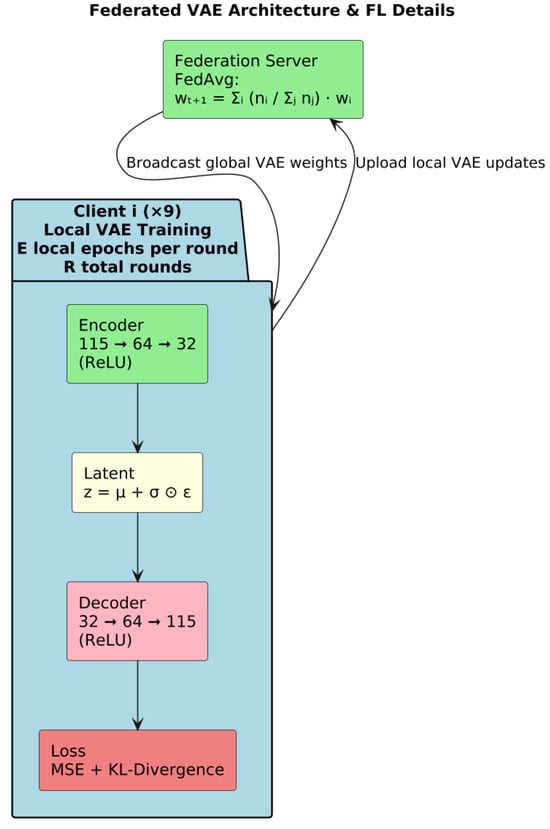
Figure 17.
VAE architecture.
Through the reparameterization, the encoder’s distributional parameters yield a stochastic latent code without interrupting gradient flow, allowing the VAE to learn both the central tendency and dispersion of the data. A mirrored decoder then reconstructs the original feature vector: two hidden layers of 32 and 64 units (again with ReLU activations) expand the latent code back toward the input dimension, and a final linear output layer produces the reconstructed 115-dimensional vector. By training to minimize a combination of reconstruction error—measuring fidelity to the original input—and a regularization term that encourages the latent distribution to remain close to a standard normal, the VAE learns a smooth, continuous model of benign traffic patterns.
This architecture is trained in a federated manner via FedAvg: each client updates its local VAE weights using only its benign samples, then communicates weight updates to the server for aggregation. The result is a global filter that embodies the collective knowledge of all devices without ever centralizing raw network data. Because the VAE’s capacity is modest (32-unit bottleneck) and its layers are narrow, it can be trained efficiently on resource-constrained IoT endpoints while still capturing the salient statistical structure of normal traffic.
7.3.2. CTGANs
CTGAN is instantiated on each of the nine IoT clients to model the distribution of benign traffic features. CTGAN extends the traditional GAN framework with a generator and discriminator tailored for mixed tabular data: the generator learns to produce synthetic feature vectors conditioned on column distributions, while the discriminator distinguishes generated samples from real benign observations. At initialization, nine independent CTGAN instances are created, one per client, and each with its own network weights and optimization state.
Training proceeds in synchronized federated rounds. In each round, every client trains its local CTGAN for a fixed number of epochs on its private benign windows, reporting both generator and discriminator losses. For example, in Round 1 Client 0 recorded a generator loss of 1.2322 and discriminator loss of 1.0507, while Client 1’s losses were 0.7303 and 1.2427, respectively; similar loss trajectories are logged for all devices before aggregation. These per-client updates capture each device’s unique traffic characteristics without ever sharing raw data. Figure 18 shows the federated CTGAN architecture.
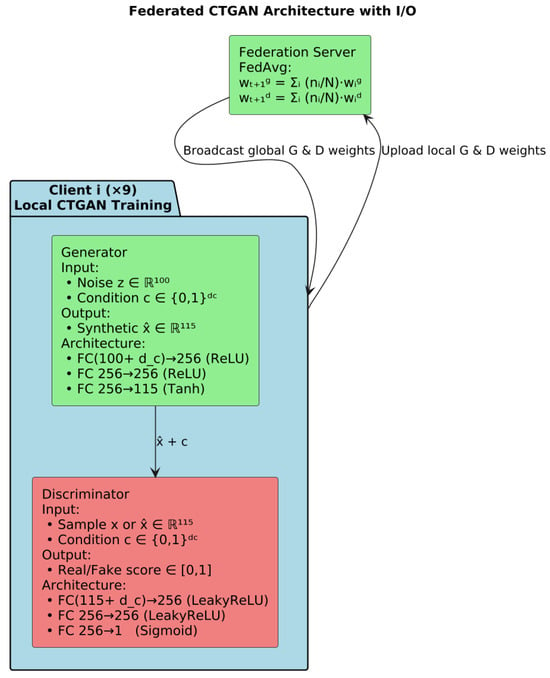
Figure 18.
Architecture of federated CTGAN.
Once all clients finish their local updates, the central server aggregates the CTGAN parameters via a FedAvg-style averaging across clients, weighted by their local benign-sample counts. The merged global model is then evaluated on a held-out validation set of benign windows, with validation loss reported after each aggregation. Training continues until the global validation loss ceases to improve for 10 consecutive rounds, at which point early stopping is triggered (e.g., at Round 51), finalizing the federated CTGAN for downstream anomaly-threshold determination and detection
7.3.3. Normalization Flow
The federated NF pipeline is organized around a classical cross-device, parameter-server FL paradigm. The central ServerFlow instantiates a global NormalizingFlow model and nine ClientFlow objects, one per IoT device, each owning a private copy of the same flow architecture and its benign-only training data.
In each federated round, the server first broadcasts its current global flow weights to every client. Each client then loads these weights into its local NormalizingFlow instance and performs exactly Config.FLOW_LOCAL_EPOCHS of training on its own benign windows, producing a local negative-log-likelihood loss and updated parameters. Upon completion, each client uploads only its state_dict() (the tensor-wise parameters) back to the server, no raw features or gradients ever leave the device.
The ServerFlow.aggregate_models() method implements a FedAvg aggregation: for each floating-point parameter key, it stacks the corresponding tensors from all clients and replaces the global parameter with their element-wise mean. Non-floating-point buffers (e.g., masks) are simply carried over from the first client. The server then reloads this averaged state_dict into its global flow and, every five rounds, evaluates it on an aggregated benign validation set to check for improvement. If the global validation loss does not improve for Config.FLOW_PATIENCE = 10 successive checks, early stopping halts further FL rounds.
Internally, the flow itself is a Real Non-Volume Preserving (RNVP)-based model composed of a sequence of affine coupling layers. Each CouplingLayer splits the input vector by an alternating binary mask, passes the masked half through two small neural nets to produce scale and translation vectors, then transforms the unmasked half as accumulating the log-determinant. Stacking Config.FLOW_NUM_LAYERS of these layers with alternating masks yields an invertible mapping to a standard-normal latent z.
The NF is trained in a synchronous, FedAvg-based federated loop across IoT clients, and its backbone coupling-layer structure is RNVP-based, ensuring exact likelihood computation and efficient sampling while preserving client data privacy. Figure 19 shows a summary of the architecture of the federated NF-based RNVP.
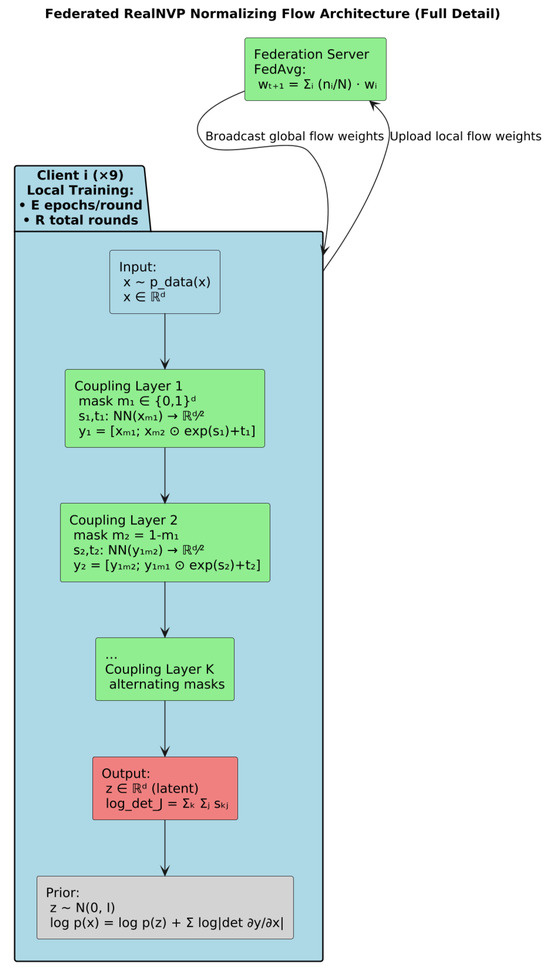
Figure 19.
Architecture of the federated NF-based RNVP.
7.3.4. TabDiff
The federated TabDiff implementation follows a classical synchronous, parameter-server paradigm (FedAvg) adapted to a Denoising Diffusion Probabilistic Model (DDPM) for tabular data. The pipeline is organized into two principal components, client-side local training and server-side aggregation, which are executed over multiple FL rounds.
Each IoT client instantiates its own TabDDPM model, parameterized by the global feature dimension, hidden layer size, number of diffusion timesteps, noise schedule, and dropout rate, all drawn from a shared configuration object. Clients convert their benign-only data into NumPy arrays, and employ an AdamW optimizer with weight decay and a learning-rate scheduler. During training the model minimizes mean-squared error between predicted and actual Gaussian noise at randomly sampled diffusion steps.
The central server initializes a global TabDDPM model with identical architecture and optimizations. At each FL round, it collects state dictionaries from all clients and aggregates them via FedAvg: for each floating-point tensor, it computes the element-wise mean across client models; for non-floating-point parameters (e.g., embedding indices), it retains the first client’s value. The updated global state is loaded back into the server’s model, which also tracks global loss trajectories and implements early stopping based on a validation patience threshold. Figure 20 shows the architecture of federated TabDiff. Table 9 shows the parameters for all these 4 models.
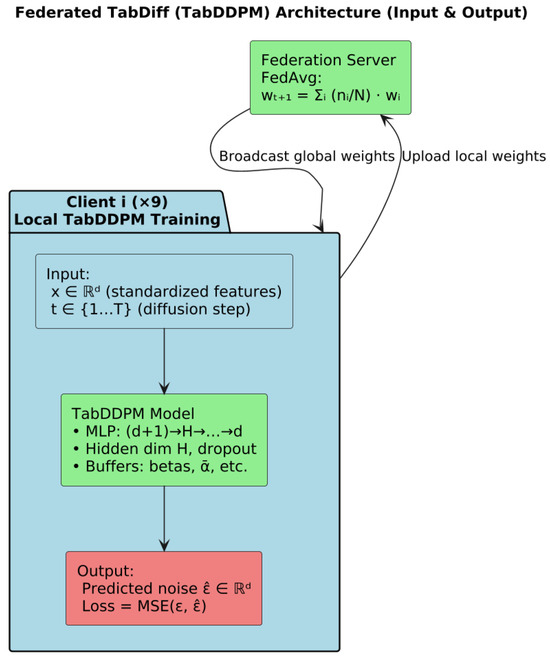
Figure 20.
Federated TabDiff architecture.

Table 9.
Parameters for all utilized models.
8. Results and Discussion
8.1. VAEs-HGB Federated Pipeline
All nine clients exhibit a very steep drop in loss during the first one or two epochs, reflecting rapid initial learning of the bulk of benign traffic patterns. Thereafter, curves flatten out—clients converge to their local minima. Notice that clients with larger datasets (e.g., Client 1) begin with higher initial loss but still reach a plateau comparable to smaller clients, indicating effective normalization by sample count in the later federated aggregation.
The validation curves closely mirror the training curves but start, and settle, at slightly higher values, reflecting a generalization error. As with training loss, most of the decrease happens in the first few epochs, after which validation loss remains almost constant. This consistency across clients demonstrates that none of the local VAEs is grossly overfitting during the local updates. Figure 21 shows the local and global training and validation loss for the VAEs.
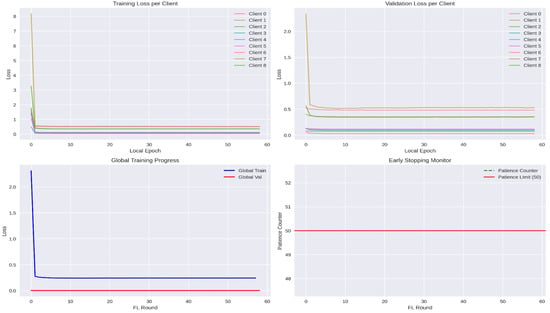
Figure 21.
Training and validation loss for VAEs.
The global training loss plunges sharply in the first round, when the model transitions from random initialization to a reasonable filter, and then gradually decreases, approaching a steady state as rounds proceed. The global validation loss remains extremely low (near zero), indicating that the aggregated model generalizes exceedingly well to held-out benign traffic across all clients. Figure 22 shows performance related plots to VAEs.
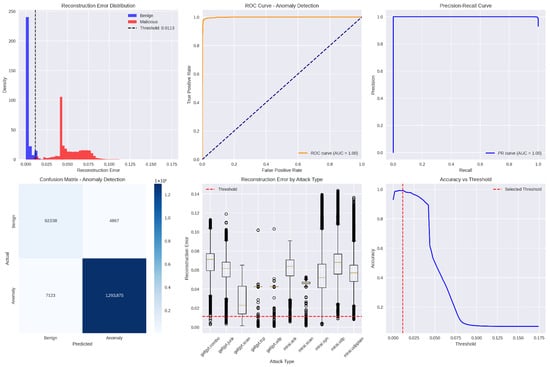
Figure 22.
Performance measurement during training and testing of VAEs.
This histogram (with overlaid kernel-density estimates) contrasts the reconstruction-error values produced by the global VAE for benign versus malicious traffic windows. Blue bars and curve represent benign samples, clustered tightly near zero error, while red depicts malicious samples, whose errors are substantially higher. The vertical dashed line marks the chosen anomaly threshold (≈ 0.0113); nearly all benign errors lie to its left, and most malicious errors lie to its right, demonstrating clear separation.
This Receiver Operating Characteristic (ROC) plot shows the true-positive rate (detection sensitivity) versus the false-positive rate as the anomaly threshold varies. The orange curve hugs the top-left corner, and its Area Under the Curve (AUC) is effectively 1.0, indicating that the VAE filter can perfectly distinguish benign from malicious windows over nearly all threshold settings.
This Precision-Recall (PR) graph illustrates the trade-off between detection precision (fraction of flagged windows that are truly malicious) and recall (fraction of all malicious windows correctly flagged) across thresholds. The blue curve remains at or near the top-right, with an AUC of 1.0, signifying that the model simultaneously achieves extremely high precision and recall for anomaly detection.
This histogram (with overlaid kernel-density estimates) contrasts the reconstruction-error values produced by the global VAE for benign versus malicious traffic windows. Blue bars and curve represent benign samples, clustered tightly near zero error, while red depicts malicious samples, whose errors are substantially higher. The vertical dashed line Accuracy vs. threshold curve plots the overall classification accuracy (fraction of all windows correctly labeled) as the anomaly threshold is swept from near zero to maximum observed error. Accuracy peaks just above 99% around the selected threshold (marked by the red dashed line) and then declines sharply as the threshold rises, since higher thresholds begin to miss malicious windows. This plot validates the threshold choice as the point of maximal accuracy. Figure 23 shows the confusion matrix for the federated VAE-HGB hybrid approach. Table 10 shows the performance measurements values for this approach.
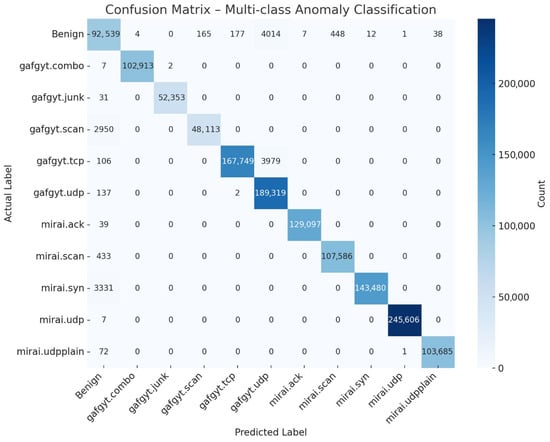
Figure 23.
End-to-end confusion matrix for the federated VAE-HGB hybrid approach.

Table 10.
End-to-end performance measurements values per class for VAEs-HGB.
The per-class results in Table 10 demonstrate that the VAEs-HGB pipeline achieves exceptionally high overall classification performance across both benign traffic and diverse botnet attack types. The benign class attains 99.14% accuracy, with a precision of 92.86% and recall of 95.00%, indicating that only a small fraction of benign windows are misclassified as attacks while most true benign instances are correctly preserved. Its specificity of 99.45% further confirms that false-alarm rates are extremely low, and an F1-score of 93.92% reflects a strong balance between precision and recall for normal traffic.
Among the individual attack categories, nearly all achieve accuracies at or above 99.70%, with several (e.g., gafgyt.combo, mirai.udp) reaching a perfect 100%. Precision and recall for these classes likewise hover around 99.5–100%, yielding F1-scores that exceed 97% in the lowest case (gafgyt.udp at 97.90%) and hit 100% for mirai.udp. The smallest performance dip occurs on the gafgyt.scan class, which attains 94.22% recall and 99.66% precision—nonetheless producing a robust F1-score of 96.86%. These results indicate that the hybrid VAE filter plus histogram-based gradient boosting classifier excels at distinguishing even subtle scanning behaviors from benign baselines without confusing them with other flooding or junk-traffic patterns.
Overall, the uniformly high specificity values (≥99.34% for all classes) underscore that the system makes very few false-positive errors across the full eleven-way detection task. Simultaneously, nearly perfect recall on critical flooding attacks (mirai.syn 97.73%, gafgyt.tcp 97.62%) ensures that the most disruptive anomalies are almost never missed. The tight clustering of precision, recall, and F1-scores—each above 93% for all classes and above 99% for the majority—attests to the efficacy of the federated VAEs-HGB architecture in learning both generative and discriminative representations suitable for end-to-end IoT anomaly detection and classification.
8.2. CTGANs-HGB Federated Pipeline
During the training process, the competing generator and discriminator networks evolve on each client during local CTGAN training. During the first few local epochs, every client’s generator network undergoes a dramatic improvement: its loss plunges from the random-initialization level down to around 0.7–1.0, as it quickly learns the coarse patterns of benign traffic. After this “warm-up” phase, the clients bifurcate into two behavioral groups. On Clients 3, 4, and 5, the generator loss stabilizes around 0.70–0.75, indicating that the adversarial contest with their discriminators has reached a steady equilibrium. In contrast, on Clients 0, 1, 2, 6, 7, and 8 the generator loss begins a slow but persistent ascent, reaching values above 1.4 in some cases; thus, suggesting that their discriminators are gradually overpowering the generators and forcing them to struggle to match the discriminator’s increasing discriminative power. This divergence correlates with variations in local data complexity and volume: larger or more heterogeneous benign sets appear to drive more pronounced generator–discriminator imbalance.
The discriminator loss curves mirror these dynamics from the opposite vantage point. Initially, each discriminator’s loss climbs from its random-guess baseline into the 1.30–1.40 band within just two or three epochs, reflecting rapid improvement at distinguishing real from generated samples. For a subset of clients (notably Clients 0 and 2), the discriminator loss subsequently falls steeply, dropping below 1.0 by epoch 25; thus, signaling that these discriminators have established a decisive advantage over their corresponding generators. Client 7 shows a more moderate downward drift in loss, ending near 1.10, whereas Clients 3, 4, 5, 6, and 8 maintain a flat loss curve around 1.35, indicating a sustained balance in their adversarial training. Together, these patterns illustrate substantial heterogeneity in local GAN convergence, underscoring the value of federated parameter aggregation to smooth out individual instabilities and yield a more robust global CTGAN model. Figure 24 shows the generator and discriminator loss. Figure 25 shows the ROC and Precision-Recall (PR) curves for CTGAN.
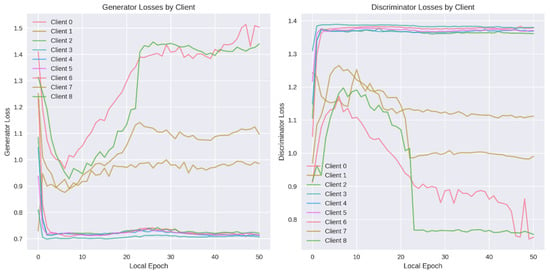
Figure 24.
Discriminator and generator loss in CTGAN.
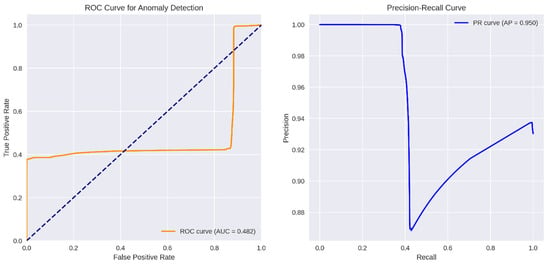
Figure 25.
ROC and PR curves for CTGAN.
The CTGANs-based anomaly detector’s ROC curve (orange) lies predominantly below the diagonal “chance” line, yielding an AUC of only 0.482. This indicates that, over the full range of decision thresholds, the model’s ability to trade off false positives against true positives is effectively no better than random guessing. Even at very low false-positive rates, the true-positive rate stalls around 0.35–0.40 and only climbs toward 1.0 at the extreme (near 100% false-positive) end. Such a profile demonstrates that CTGANs’ reconstruction or discriminator scores do not reliably separate benign from malicious samples in this setting.
In contrast, the right panel’s PR curve shows an average precision (AP) of 0.950, revealing a markedly different story when focusing on positive (anomalous) detections. At low recall (below roughly 0.4), precision hovers near 1.00—almost every flagged window is truly malicious. Once recall surpasses 40%, precision dips to about 0.87 before gradually rising again toward 0.94 as recall approaches 1.0. This shape implies that CTGANs can indeed identify a small subset of anomalies with very high confidence, but it struggles to detect the full set of malicious windows without incurring a substantial loss in precision. Figure 26 shows the anomaly score threshold and the binary confusion matrix for CTGANs.
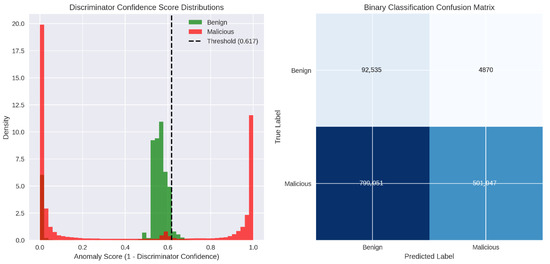
Figure 26.
Anomaly score threshold and confusion matrix for CTGAN.
Overall, the CTGANs discriminator does not consistently separate benign from malicious behavior. Although it flags a subset of attacks with high confidence (those in the high-score mode), it misclassifies many other malicious windows as benign, leading to both low recall and a false-alarm burden. Table 11 shows the performance measurements values for this approach.

Table 11.
End-to-end performance measurements values per class for CTGANs-HGB.
The CTGAN-based filter exhibits very poor discrimination of benign traffic: although its recall on benign windows is high (95.00%), its precision is only 10.38%, yielding an F1-score of just 18.71% and an overall benign accuracy of 42.51%. In other words, nearly two-thirds of benign samples are misclassified as anomalies, and the threshold chosen fails to confine false alarms. The specificity for the benign class (38.58%) further illustrates that the CTGAN discriminator rarely identifies genuine benign behavior as such.
Among the eleven attack categories, performance varies dramatically. A small handful—most notably gafgyt.combo (99.85% accuracy, 98.97% F1), gafgyt.junk (99.92% accuracy, 98.88% F1), and mirai.syn (98.83% accuracy, 94.10% F1)—are detected almost flawlessly. The mirai.ack and mirai.udp classes achieve moderate recall (40.21% and 48.95%, respectively) and corresponding F1-scores (56.12%, 65.54%), indicating that some attack behaviors still produce sufficiently anomalous reconstruction errors or discriminator outputs. However, detection collapses for flood-style attacks: gafgyt.scan attains only 3.69% recall (F1 = 7.09 %), while gafgyt.tcp and gafgyt.udp yield zero recall and zero F1, meaning these classes are essentially invisible to the CTGAN filter despite high precision by virtue of never being predicted.
Overall, although the CTGAN–HGB pipeline can identify certain discrete behaviors with high confidence, its inability to clearly separate benign from malicious traffic renders it unreliable as a general anomaly filter. The uniformly high specificity values for attack classes (>99%) reveal that when an attack is flagged, it is almost certainly correct, yet the extremely low recall on key flooding and scanning activities means the system would miss the majority of threats. Such an uneven performance profile suggests that CTGAN’s generative modeling of mixed-type traffic fails to produce robust anomaly scores across the full spectrum of IoT attack patterns.
8.3. NF-HGB Federated Pipeline
The RNVP–based anomaly detector achieves an area under the curve of 0.870, indicating substantially better-than-random discrimination between benign and malicious windows. The true positive rate climbs very steeply at extremely low false-positive rates (below ~0.05), demonstrating that the model captures a majority of anomalies without triggering many false alarms. Beyond that initial rise, the ROC flattens out around a TPR of ~0.72 across a broad span of FPR values (0.05–0.40), suggesting diminishing returns in sensitivity unless the system tolerates more false positives. Finally, at very high FPR (>0.40), the curve again surges toward the top-right corner as it sacrifices specificity to detect the few remaining anomalies. Figure 27 shows the ROC and PR curves for NF.
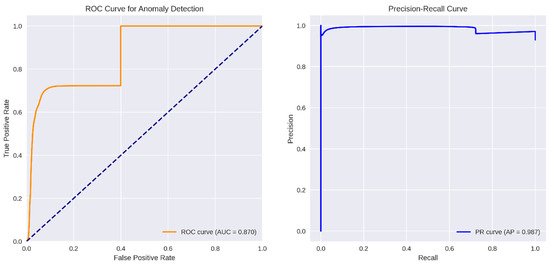
Figure 27.
ROC and PR curves for NF.
The model attains an average precision of 0.987, reflecting excellent positive-predictive value over nearly all recall thresholds. At low recall (under ~0.1), precision is essentially 1.0, meaning every flagged window is indeed malicious. As recall increases toward ~0.6, precision remains above 0.99, only dipping marginally before recovering, which indicates that the flow’s likelihood scores maintain very high confidence even when tasked with identifying the bulk of the anomalies. Near full recall, precision settles around 0.94, signifying a small increase in false alarms only when pushing sensitivity to its maximum. Figure 28 shows the anomaly threshold histogram and confusion matrix for the NF.
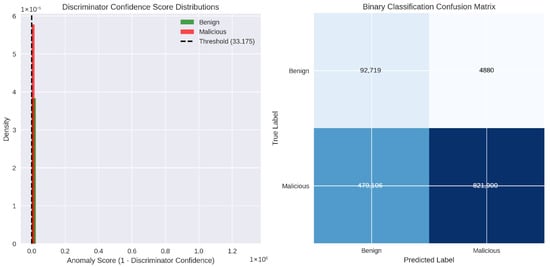
Figure 28.
Anomaly threshold histogram and confusion matrix for the NF.
The histogram is defined as the negative log-likelihood under the Real NVP model. The benign windows (green) form a narrow peak between roughly 25 and 35. Malicious windows (red), by contrast, exhibit a long, heavy-tailed distribution: many attack samples cluster just below or just above the benign peak, but a substantial fraction extend to extremely large scores (hundreds of thousands or even millions), indicating events the flow deems nearly impossible under the learned benign distribution. The dashed vertical line at approximately 33.175 marks the chosen decision threshold. This threshold sits just above the bulk of the benign distribution. Thereby minimizing false alarms, while falling well below the extreme outlier scores, allowing it to capture a large portion of moderately unlikely anomalies without being skewed by the few pathological samples with astronomically low modeled probability. Table 12 shows the performance measurements values for this approach.

Table 12.
End-to-end performance measurements values per class for NF-HGB.
The NF–HGB pipeline exhibits a highly asymmetric performance profile, beginning with its treatment of benign traffic. Although the recall on benign windows is excellent (95.00%), the model’s precision is only 16.21%, yielding an F1-score of just 27.70% and an overall benign accuracy of 65.40%. In practical terms, this means that while the flow rarely misses true benign samples, it also incorrectly flags a large majority of normal windows as anomalous, as reflected by a specificity of only 63.17%. Such a low precision-specificity trade-off would result in an unacceptably high false-alarm rate in most operational settings.
Among the eleven attack categories, performance varies considerably by behavior. The simpler, discrete packet patterns—gafgyt.combo and gafgyt.junk—are detected almost perfectly (accuracies around 99.9%, F1-scores ≥ 99.0%, and specificity essentially 100%). In contrast, certain flood-style attacks such as gafgyt.tcp and gafgyt.udp see virtually zero recall (0.00% and 0.01%, respectively) despite high specificity (>99.6%), indicating the flow’s likelihood scores remain indistinguishable from benign for these heavy-volume events. Mid-range performance is observed for gafgyt.scan (59.90% recall, 98.14% precision, F1 = 74.39%) and for Mirai-based floods such as mirai.ack (56.11% recall, 99.98% precision, F1 = 71.88%) and mirai.scan (26.12% recall, 99.98% precision, F1 = 41.42%).
In summary, the RealNVP filter coupled with the histogram-based gradient-boosting classifier produces a mixed bag: it excels at detecting low-volume or highly structured anomalies, yet fails to flag the very volumetric flood attacks it was primarily intended to catch. Its almost perfect specificity on most attack classes ensures that true positives are rarely false alarms, but the catastrophic drop in recall for certain behaviors undermines its utility as a general-purpose anomaly detector. This uneven detection capability suggests that while normalizing flows can capture nuanced features of benign IoT traffic, additional mechanisms or feature engineering may be necessary to reliably detect high-volume or distributed attack patterns.
8.4. TabDiff-HGB Federated Pipeline
During the training for TabDiff, an initial uptick was observed in the aggregated global federated loss—from about 1.00025 at Round 0 to a peak of roughly 1.0043 at Round 2—indicating that the very first FedAvg blend of client updates slightly degrades the model’s denoising performance. Thereafter, the curve descends sharply: by Round 3 the loss has fallen back to nearly 1.0003, and it reaches its minimum of approximately 0.9890 at Round 5. This downward trend reflects rapid early improvements as the global diffusion model assimilates diverse benign-data characteristics. After the low at Round 5, the loss plateaus through Round 6 before a modest rebound at Round 7 (up to about 1.0040), and then dips again by Round 8 (to ~0.9990). Overall, the pattern shows that most of the global-model gains occur in the first few rounds, followed by small oscillations as the server fine-tunes the TabDiff parameters under the early-stopping regime. Figure 29 shows the global loss curve for the TabDiff.
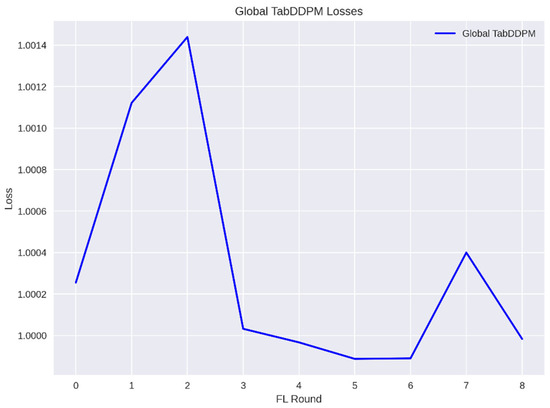
Figure 29.
Global loss curve for the TabDiff.
The TabDiff model’s ROC curve (orange) lies almost exactly on the diagonal “chance” line, yielding an AUC of 0.500. This indicates that, across all possible thresholds, the model’s anomaly score provides no ranking power—true-positive and false-positive rates increase in lock-step as the decision boundary slides, just as random guessing would. The PR curve tells a slightly different story: the average precision (AP) is 0.930, meaning that if one selects a single, fixed anomaly score threshold, the fraction of flagged windows that are truly malicious remains around 93%, even as recall varies. At very low recall values (near zero), precision briefly dips below 0.90—reflecting instability when only a handful of windows are flagged—but quickly rises and then holds tightly around 0.93 for the bulk of the recall range. Figure 30 shows the ROC and PR curves for TabDiff.
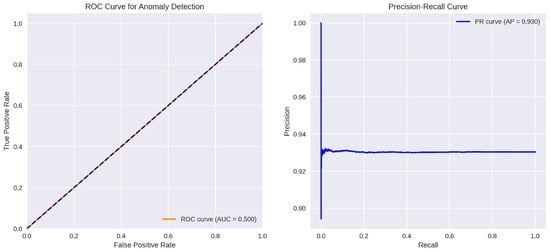
Figure 30.
ROC and PR curves for TabDiff.
Taken together, these plots show that although TabDiff’s score does not reliably order anomalies above benign samples (hence ROC ≈ 0.5), a well-chosen static threshold can still achieve high precision, correctly identifying most flagged anomalies at the cost of limited sensitivity. Figure 31 shows the anomaly score distribution for TabDiff and its confusion matrix.
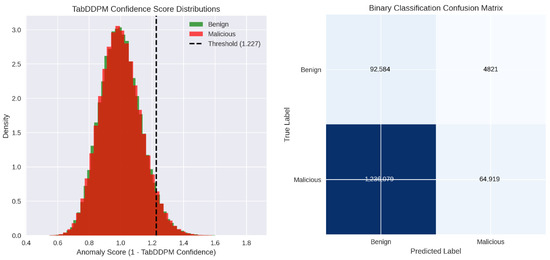
Figure 31.
Anomaly threshold histogram and confusion matrix for TabDiff.
The TabDDPM-derived anomaly scores (computed as 1—model confidence) are plotted as overlaid density histograms for benign (green) and malicious (red) traffic windows. Both distributions form roughly bell-shaped curves centered near a score of 1.0, indicating that most samples—whether benign or attack—receive intermediate confidence values from the diffusion model. The benign curve is slightly narrower, while the malicious curve exhibits a marginally greater spread toward higher scores. A vertical dashed line at approximately 1.227 marks the chosen decision threshold. Scores to the left of this line would be classified as benign, and those to the right as anomalous. Because the two densities overlap substantially in the region just below the threshold, a number of malicious samples will be misclassified as benign, and conversely a smaller fraction of benign samples just above the threshold will be falsely flagged—reflecting the challenge TabDDPM faces in cleanly separating normal from anomalous traffic based solely on its confidence outputs. Table 13 shows the performance measurements values for this approach.

Table 13.
End-to-end performance measurements values per class for TabDiff-HGB.
The TabDiff–HGB pipeline exhibits a pronounced asymmetry in its handling of benign traffic. While the recall on benign windows is exceptionally high (95.08%), indicating that nearly all normal samples fall below the anomaly threshold, the precision is extremely low (6.97%) and overall accuracy barely exceeds 11%. This combination yields a very low F1-score of 12.99% and a specificity of only 4.99%, meaning that the vast majority of benign traffic is misclassified as anomalous. In practice, this would translate into an overwhelming number of false alarms and render the model unusable for discriminating normal device behavior.
Across the eleven specific attack classes, the pipeline consistently achieves very high precision—ranging from 69.14% for gafgyt.udp up to nearly 100% for several categories—which reflects that when an anomaly is flagged, it is almost certainly a true attack. However, recall remains uniformly low (between 3.59% and 5.03% across all classes), resulting in F1-scores in the single digits (6.66% to 9.58%). This indicates that the model only identifies a tiny fraction of the actual malicious windows, failing to capture over 95% of attack instances. Specificity for these attack classes, conversely, is essentially perfect (≈ 100%), showing that non-attack samples are rarely mislabeled as these particular threats.
In the end, the TabDiff–HGB approach trades recall for precision so heavily that it scarcely detects the majority of both benign and malicious events. Its high per-class specificity and precision come at the prohibitive cost of abysmally low sensitivity, yielding negligible F1-scores and minimal actionable detections. As a result, although the system can be trusted when it does raise an alarm, it would miss more than nineteen of every twenty actual attacks—making it ineffective as a reliable end-to-end anomaly detection solution.
8.5. Extended Discussion
Figure 32 shows a radar chart comparing the four federated pipelines across all five-performance metrics for all the class. Each axis represents one metric (Accuracy, Precision, Recall, Specificity, F1-Score), and the colored polygons show how each pipeline scores on those metrics.
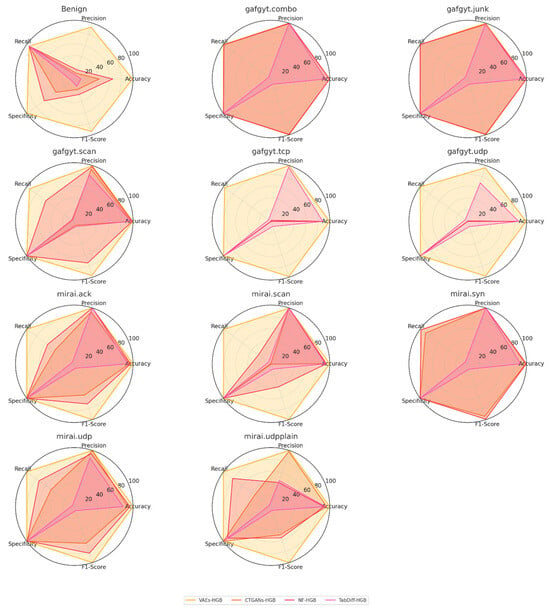
Figure 32.
Consolidated radar chart for all federated models.
The consolidated radar-chart grid vividly illustrates the striking contrast in end-to-end performance among the four federated pipelines. Across nearly all eleven traffic classes, the VAEs-HGB polygon (gold) consistently encloses the largest area—reaching or nearly reaching the outer limits on every metric—indicating uniformly high accuracy, precision, recall, specificity, and F1-score. In sharp contrast, the TabDiff-HGB shapes (magenta) form the smallest, most collapsed polygons, reflecting its very low precision and specificity alongside high recall; this yields minimal utility despite its perfect sensitivity. The CTGANs-HGB (orange) and NF-HGB (red) contours occupy intermediate positions but with very different orientations: CTGANs often achieves high recall and specificity on certain attacks, yet catastrophically low precision on benign traffic and volumetric floods, while NF delivers better balanced precision and specificity than CTGANs yet still fails to detect many flood-style attacks.
Focusing on benign traffic (top-left radar), VAEs-HGB attains nearly perfect scores on all axes, whereas CTGANs-HGB shows a lopsided shape—very high recall but almost zero precision and specificity—resulting in a wide false-alarm rate. NF-HGB improves over CTGANs by boosting benign precision and specificity into the 60–90% range, but still leaves a pronounced “hole” in its recall–precision balance. TabDiff-HGB’s benign polygon barely extends beyond its near-unity recall point, underscoring that it labels almost every window anomalous. This pattern repeats across flood and scan categories: VAEs-HGB maintains a near-regular pentagon, NF-HGB retains a moderately large but uneven shape (dropping on flood recall), CTGANs-HGB shrinks severely along precision for certain classes, and TabDiff-HGB collapses.
For individual attack types—such as gafgyt.combo, gafgyt.junk, and mirai.syn—all four pipelines converge on high precision and specificity, yet only VAEs-HGB and NF-HGB sustain strong recall and F1-scores, producing near-complete pentagons. CTGANs-HGB also fares well on these discrete behaviors, though its high recall is offset by poor benign discrimination elsewhere. On heavier flooding attacks (e.g., gafgyt.tcp, gafgyt.udp, mirai.udpplain), NF-HGB outperforms CTGANs by achieving nonzero recall, but VAEs-HGB remains the sole pipeline to detect these classes robustly across all metrics. TabDiff-HGB again shows minimal coverage, signifying its inability to balance any two metrics beyond raw sensitivity. Overall, the grid underscores VAEs-HGB’s clear superiority in delivering both generative filtering and discriminative classification under federated learning, while the other methods exhibit trade-offs that limit their end-to-end effectiveness.
Beyond their relative areas, the radar grid makes clear the differing degrees of shape symmetry each pipeline exhibits across classes. VAEs-HGB’s almost circular pentagons signify a near-uniform emphasis on minimizing both false positives and false negatives, regardless of attack type. In stark contrast, CTGANs-HGB yields highly skewed polygons—often stretching only along the recall axis while precision and specificity collapse—revealing that it flags most anomalies indiscriminately but lacks true discrimination. NF-HGB presents intermediate morphologies that vary by class: its polygons widen along specificity yet pinch along precision for heavy-volume floods, indicating a conservative bias against false alarms at the expense of sensitivity. TabDiff-HGB consistently produces “spoked” shapes with recall as the sole extended axis, underlining its one-dimensional focus on sensitivity and complete neglect of all other metrics.
Moreover, the grid uncovers how metric interdependencies differ by model family. In the VAE-based pipeline, precision and specificity rise and fall in tandem—demonstrating that when the generative filter sharply distinguishes anomalous windows, it does so without trading off false positives. By contrast, CTGANs-HGB and TabDiff-HGB decouple these dimensions: they may achieve high recall yet fail to safeguard specificity or maintain precision, leading to disjointed pentagons. NF-HGB, meanwhile, shows partial coupling of precision and specificity but disconnects both from recall on certain classes, suggesting that its flow-based likelihoods excel at rejecting benign outliers but struggle to consistently rank malicious events above the threshold. Collectively, these patterns emphasize that end-to-end robustness in federated anomaly detection requires pipelines that jointly optimize across all axes rather than maximizing a single performance measure. Table 14 shows the end-to-end average value for all performance measurements metrics across all classes for all federated pipelines.

Table 14.
End-to-end average value for performance measurements metrics.
The aggregate results in Table 14 underscore the clear superiority of the VAE-HGB pipeline, which delivers nearly flawless end-to-end performance (99.79% accuracy, 98.90% precision, 98.54% recall, 99.89% specificity, and 98.71% F1-score), reflecting its balanced ability to detect anomalies while suppressing false alarms. By comparison, CTGAN-HGB and NF-HGB achieve respectable overall accuracies (89.45% and 92.09%, respectively) but exhibit trade-offs—CTGANs sacrifice recall (46.33%) for higher precision (71.88%), whereas NF attains a more even recall (62.69%) at the cost of lower precision (68.36%). The Tab-Diff approach performs least effectively (83.79% accuracy, 80.60% precision, but only 12.82% recall and 9.10% F1-score), indicating that its diffusion-based filter rarely yields a useful anomaly ranking under benign-only training. These averages demonstrate that, in federated IoT settings, reconstruction- or likelihood-driven generative filters are essential to achieving both high sensitivity and specificity in downstream classification. Table 15 provides more performance comparison between the different filters within the HGB-based federated pipelines.

Table 15.
Benign filter performance across the four HGB-based federated pipelines.
The VAE-based filter clearly outperforms the other generative models in terms of both ranking and thresholded discrimination of anomalies. After 58 federated rounds, it achieves an almost perfect ROC AUC of 0.9983 and PR AUC of 0.9998, indicating that benign and malicious windows occupy largely disjoint score distributions. In contrast, the CTGAN and TabDiff filters linger at ROC AUCs near 0.48–0.50—no better than random—despite respectable PR curves (PR AUCs of 0.9497 and 0.9303, respectively). The NF filter occupies an intermediate position (ROC AUC = 0.8701, PR AUC = 0.9867), suggesting that likelihood-based scores have utility but cannot match the VAE’s generative separation under federated averaging.
When turning to operational thresholds, the VAE again registers the fewest errors: it misflags only 4866 of 97,405 benign samples and misses just 7113 of 1.3 million malicious windows. This low false-alarm and miss rate translates into 99.69% classification accuracy on the subset of detected attacks. By comparison, CTGAN and TabDiff filters sacrifice massive portions of the malicious stream—missing 799,051 and 1,236,136 attacks, respectively—despite a similarly low benign-flag count. The NF filter stands between these extremes with 479,106 missed attacks and 4880 false alarms, yielding only 84.81% accuracy on the detected anomalies. These figures underscore that high PR AUC alone does not guarantee effective anomaly capture when the score distributions overlap heavily.
Ultimately, these filter-level disparities propagate directly to end-to-end performance when coupled with the histogram-based gradient-boosting classifier. The VAE-HGB pipeline preserves its filtering fidelity to achieve 99.14% overall system accuracy, whereas the CTGAN-HGB and TabDiff-HGB combinations collapse to 42.51% and 11.26%, respectively, making them unsuitable for reliable IoT anomaly detection. The NF-HGB pipeline recovers to a moderate 65.40% accuracy, benefiting from better separation than the GAN- and diffusion-based filters but still hampered by substantial miss-rates on flood-style attacks. These results collectively demonstrate that only the variational-autoencoder filter provides the robust, high-fidelity foundation necessary for accurate, end-to-end federated anomaly detection and classification. Table 16 shows the HGB classification for incorrectly flagged benign samples.

Table 16.
HGB classification for incorrectly flagged benign samples.
The misclassification patterns in Table 15 reveal that, regardless of the upstream filter, the HGB classifier most often assigns benign windows to the high-volume flood classes. Across all four pipelines, gafgyt.udp absorbs the lion’s share of false positives—82.5% for VAEs, 74.8% for CTGANs, 83.7% for TabDiff, and 84.5% for NVP—indicating that even modest benign fluctuations can mimic the histogram-based gradients of a UDP flood. Far smaller fractions of benign samples are misrouted to other flood types: gafgyt.tcp accounts for 3.6% (VAEs) up to 22.3% (CTGANs), and gafgyt.scan draws 2.5–10.5% depending on the filter, reflecting that scanning features are occasionally conflated with normal noise spikes.
Comparing pipelines exposes how the choice of filter shapes the downstream confusion. The CTGAN filter, for example, funnels a disproportionate 22.3% of its benign false alarms into gafgyt.tcp, whereas VAEs and NVP keep this below 5.5%. TabDiff likewise produces a 10.5% misclassification rate to gafgyt.scan, more than double the VAE and NVP rates. These discrepancies stem from the different score-threshold behaviors: filters that permit more benign candidates with TCP-like or scan-like profiles will naturally inflate those HGB error bins. In contrast, all four filters nearly eliminate misclassification into low-volume or rare attack classes—gafgyt.combo, gafgyt.junk, mirai.ack, mirai.syn, mirai.udp, and mirai.udpplain—where HGB’s decision boundaries remain sharp.
Finally, the near-zero confusion on the discrete scanning and junk-traffic classes (all <1%) underscores HGB’s strength in distinguishing compact attack signatures when presented. The overwhelming flood of false positives into the volumetric categories thus reflects not a failure of the boosting logic itself, but the upstream filters’ selection of benign windows that share heavy-gradient, packet-count characteristics with DoS-style attacks. In operational terms, improving the filter’s specificity against benign fluctuations should dramatically reduce HGB’s flood-class misfires, whereas the classifier need not be overhauled for the low-volume and protocol-driven attack types it already handles with near-perfect fidelity. Table 17 shows an end-to-end result of the 11 × 11 confusion matrix aggregated into a 2 × 2 confusion matrix with only Benign vs. Attack as the target classes.

Table 17.
Binary end-to-end confusion matrix for all the HGB-based federated pipelines.
Generative models often requires more computational power to execute their processes. Consequently, all the generative models “filters” were exposed only to benign traffic during training since benign traffic accounts for less than 8% of the total data points in the dataset.
For this reason, their ability to spot anomalies hinges entirely on how sharply they can characterize—and penalize deviations from—the learned benign manifold. The VAE excels here because its encoder–decoder structure is explicitly optimized to minimize reconstruction error on benign data, so any departure from that manifold (i.e., a malicious window) produces a large reconstruction loss. This yields both high true-positive detection (1,293,885 of 1.3 million attacks caught) and low false alarms (4866 benign windows flagged) after thresholding. The Real NVP flow, which computes an exact change-of-variables likelihood, also performs comparatively well (821,900 correct detections, 4880 false positives), since its invertible coupling layers provide a principled density estimate and thus a reliable anomaly score.
By contrast, the CTGAN and TabDiff generators struggle to produce useful anomaly metrics when trained only on benign samples. The CTGAN’s adversarial training objective focuses on producing realistic-looking synthetic data rather than learning a smooth, tractable density for likelihood ranking, so its discriminator confidence or reconstruction proxies do not cleanly separate anomalies—leading to 799,051 missed attacks despite a low false-alarm count. TabDiff’s diffusion-based denoising loss, likewise, is designed for high-quality sample synthesis rather than anomaly scoring, resulting in 1,236,136 misses. Their generative mechanisms simply lack the inductive bias toward compact, low-variance benign representations that VAEs and NVPs inherently enforce.
In summary, when constrained to benign-only training, models that directly optimize reconstruction or exact likelihood deliver far superior anomaly detection. Architectures built around density estimation, such as VAEs via Evidence Lower Bound (ELBO) and NF-based RNVP via change-of-variables; naturally assign low scores to out-of-distribution examples, whereas purely generative or adversarial frameworks (CTGAN, TabDiff) do not, and thus provide weak or noisy separation. This suggests that, for federated anomaly detection under limited computational budgets, one should favor generative filters with explicit, tractable density or reconstruction objectives over more general-purpose synthesis models. Finally, Table 18 provides a comparison between the VAEs-HGB privacy preserving federated pipeline and other recent IDS approaches that were deployed utilizing the N-BaIoT dataset.

Table 18.
Federated IDS comparison with other studies.
Limitations
The experimental validation relies exclusively on the N-BaIoT dataset, which, despite containing real IoT traffic from nine commercial devices, originates from a controlled testbed environment and encompasses only two botnet families (Gafgyt and Mirai). This homogeneous experimental setting cannot adequately represent the heterogeneity and unpredictability characteristic of real-world industrial IoT networks, where device types, communication patterns, and attack vectors exhibit significant variation. The generalizability to diverse, dynamic IIoT environments and unseen botnet families remains unestablished. Validation across multiple datasets spanning different IoT ecosystems, attack families, and operational contexts represents a critical requirement for establishing external validity. Future investigations should incorporate datasets from actual industrial deployments and evaluate robustness against emerging botnet variants such as zero-day attacks.
The communication overhead associated with multiple FedAvg rounds and corresponding energy costs on resource-constrained IoT devices remain unmeasured. These metrics constitute essential components for practical deployment evaluation. Future work should incorporate comprehensive communication/energy profiling across diverse IoT hardware configurations.
The substantial packet-level processing overhead was overlooked. The N-BaIoT dataset provides pre-computed statistical features (115 aggregates), effectively bypassing the computational burden of real-time packet parsing, feature extraction, and windowing required in actual edge deployment scenarios. This preprocessing step potentially represents substantial computational and memory overhead on resource-constrained devices, which could potentially negate any edge advantages. Realistic evaluation should encompass end-to-end latency and resource consumption measurements, including packet capture, feature computation, and model inference, on representative IoT hardware platforms.
The substantial performance gap between VAE-based approaches and CTGAN/TabDiff models can be theoretically addressed through systematic analysis of their fundamental optimization objectives and anomaly detection mechanisms. VAEs explicitly optimize reconstruction error through encoder–decoder architectures, creating a direct mathematical relationship between input fidelity and anomaly scoring, where out-of-distribution samples (malicious traffic) inherently produce higher reconstruction losses than in-distribution benign samples. In contrast, CTGAN’s adversarial training optimizes for realistic sample generation rather than reconstruction fidelity, while TabDiff’s diffusion-based denoising objective focuses on sample quality rather than preserving anomaly-relevant information during the forward and reverse diffusion processes. To establish rigorous theoretical justification, future work should conduct information-theoretic analysis measuring mutual information between input and latent representations, perform systematic ablation studies isolating the impact of reconstruction versus generative loss functions, and develop mathematical frameworks proving that minimizing reconstruction error on benign-only data maximizes the separation between normal and anomalous samples in the learned feature space, thereby providing formal theoretical grounding for the observed performance differences.
9. Conclusions
This work has presented a novel two-stage FL pipeline for IoT anomaly detection, combining a generative filter trained exclusively on benign traffic with an HGB classifier for attack labeling. Four distinct filter models—VAEs, CTGANs, NF, and TabDiff—were evaluated under a cross-device, parameter-server setting. Rigorous experiments on nine heterogeneous IoT clients demonstrated that only filters with explicit density- or reconstruction-based objectives (VAEs and RNVP-based NF) could reliably separate benign from malicious windows. In contrast, adversarial (CTGAN) and diffusion (TabDiff) approaches, despite high PR-AUCs, failed to produce useful anomaly scores when trained solely on benign data.
A deeper analysis of end-to-end performance revealed that the quality of the filter’s anomaly scoring is paramount: the VAE filter achieved near-perfect ROC and PR-AUCs and missed fewer than 0.6% of attacks, directly translating to a 99.14% end-to-end accuracy. RNVP-based NF, while less precise, still delivered moderate separation and an end-to-end average accuracy of 65.4%. Conversely, CTGANs and TabDiff pipelines suffered catastrophic miss rates (up to 95% of attacks overlooked), rendering their downstream classifiers ineffective. These results underscore that, in resource-constrained federated settings, generative models must enforce an explicit low-variance benign manifold—via reconstruction or tractable likelihood—to serve as dependable anomaly detectors.
Looking forward, these insights suggest fertile directions for future research. First, lightweight, reconstruction-driven models like compact VAEs should be further optimized for communication and computation on edge devices. Second, integrating hybrid objectives—combining adversarial, likelihood, and diffusion losses—may yield richer scoring functions that balance sensitivity and specificity. Finally, real-world deployment will require adaptive thresholding, paving the way for truly autonomous, privacy-preserving anomaly detection in large-scale IoT networks.
Author Contributions
Conceptualization, M.S.; methodology, M.S.; software, M.S.; validation, M.S.; investigation, M.S. and A.H.; resources, F.F.C.; data curation, M.S.; writing—original draft preparation, M.S. and A.H.; writing—review and editing, M.S. and A.H.; visualization, M.S. and A.H.; supervision, M.S. All authors have read and agreed to the published version of the manuscript.
Funding
The reported research work is based upon work supported by the US Department of Defense under the Office of Local Defense Community Cooperation (OLDCC) Award Number MCS2106-23–01. The views expressed herein do not necessarily represent the views of the US Department of Defense or the United States Government. Additionally, this paper received partial financial support from the US Department of Energy/NNSA (Award Number: DE-NA0004003), as well as from the Lutcher Brown Distinguished Chair Professorship fund of the University of Texas at San Antonio.
Data Availability Statement
The data that support the findings of this study are available from the first author, M.S., upon reasonable request.
Conflicts of Interest
The authors declare no conflict of interest.
References
- Dazzi, P. The Internet of AI Agents (IAIA): A New Frontier in Networked and Distributed Intelligence. Int. J. Netw. Distrib. Comput. 2025, 13, 16. [Google Scholar] [CrossRef]
- Shahin, M.; Chen, F.F.; Bouzary, H.; Krishnaiyer, K. Integration of Lean practices and Industry 4.0 technologies: Smart manufacturing for next-generation enterprises. Int. J. Adv. Manuf. Technol. 2020, 107, 2927–2936. [Google Scholar] [CrossRef]
- Matin, A.; Islam, M.R.; Wang, X.; Huo, H.; Xu, G. AIoT for sustainable manufacturing: Overview, challenges, and opportunities. Internet Things 2023, 24, 100901. [Google Scholar] [CrossRef]
- Villar, E.; Martín Toral, I.; Calvo, I.; Barambones, O.; Fernández-Bustamante, P. Architectures for Industrial AIoT Applications. Sensors 2024, 24, 4929. [Google Scholar] [CrossRef]
- Mikołajewska, E.; Mikołajewski, D.; Mikołajczyk, T.; Paczkowski, T. Generative AI in AI-Based Digital Twins for Fault Diagnosis for Predictive Maintenance in Industry 4.0/5.0. Appl. Sci. 2025, 15, 3166. [Google Scholar] [CrossRef]
- Lampropoulos, G.; Garzón, J.; Misra, S.; Siakas, K. The Role of Artificial Intelligence of Things in Achieving Sustainable Development Goals: State of the Art. Sensors 2024, 24, 1091. [Google Scholar] [CrossRef]
- Sasikumar, A.; Ravi, L.; Kotecha, K.; Saini, J.R.; Varadarajan, V.; Subramaniyaswamy, V. Sustainable Smart Industry: A Secure and Energy Efficient Consensus Mechanism for Artificial Intelligence Enabled Industrial Internet of Things. Comput. Intell. Neurosci. 2022, 2022, 1419360. [Google Scholar] [CrossRef]
- Nozari, H.; Szmelter-Jarosz, A.; Ghahremani-Nahr, J. Analysis of the Challenges of Artificial Intelligence of Things (AIoT) for the Smart Supply Chain (Case Study: FMCG Industries). Sensors 2022, 22, 2931. [Google Scholar] [CrossRef]
- Aung, Y.L.; Christian, I.; Dong, Y.; Ye, X.; Chattopadhyay, S.; Zhou, J. Generative AI for Internet of Things Security: Challenges and Opportunities. arXiv 2025, arXiv:2502.08886. [Google Scholar] [CrossRef]
- Malek, J.; Desai, T.N. A systematic literature review to map literature focus of sustainable manufacturing. J. Clean. Prod. 2020, 256, 120345. [Google Scholar] [CrossRef]
- Cavalcante, I.M.; Frazzon, E.M.; Forcellini, F.A.; Ivanov, D. A supervised machine learning approach to data-driven simulation of resilient supplier selection in digital manufacturing. Int. J. Inf. Manag. 2019, 49, 86–97. [Google Scholar] [CrossRef]
- Pise, A.; Yoon, B.; Singh, S. Enabling Ambient Intelligence of Things (AIoT) healthcare system architectures. Comput. Commun. 2023, 198, 186–194. [Google Scholar] [CrossRef]
- Dong, B.; Shi, Q.; Yang, Y.; Wen, F.; Zhang, Z.; Lee, C. Technology evolution from self-powered sensors to AIoT enabled smart homes. Nano Energy 2021, 79, 105414. [Google Scholar] [CrossRef]
- Meeuw, A.; Schopfer, S.; Wörner, A.; Tiefenbeck, V.; Ableitner, L.; Fleisch, E.; Wortmann, F. Implementing a blockchain-based local energy market: Insights on communication and scalability. Comput. Commun. 2020, 160, 158–171. [Google Scholar] [CrossRef]
- Jayal, A.D.; Badurdeen, F.; Dillon, O.W.; Jawahir, I.S. Sustainable manufacturing: Modeling and optimization challenges at the product, process and system levels. CIRP J. Manuf. Sci. Technol. 2010, 2, 144–152. [Google Scholar] [CrossRef]
- Bhanot, N.; Rao, P.V.; Deshmukh, S.G. An integrated approach for analysing the enablers and barriers of sustainable manufacturing. J. Clean. Prod. 2017, 142, 4412–4439. [Google Scholar] [CrossRef]
- Mao, S.; Wang, B.; Tang, Y.; Qian, F. Opportunities and Challenges of Artificial Intelligence for Green Manufacturing in the Process Industry. Engineering 2019, 5, 995–1002. [Google Scholar] [CrossRef]
- Zhukabayeva, T.; Zholshiyeva, L.; Karabayev, N.; Khan, S.; Alnazzawi, N. Cybersecurity Solutions for Industrial Internet of Things–Edge Computing Integration: Challenges, Threats, and Future Directions. Sensors 2025, 25, 213. [Google Scholar] [CrossRef]
- Haqiq, N.; Zaim, M.; Bouganssa, I.; Salbi, A.; Sbihi, M. AIoT with I4.0: The effect of Internet of Things and Artificial Intelligence technologies on the industry 4.0. ITM Web Conf. 2022, 46, 03002. [Google Scholar] [CrossRef]
- Wu, Q.; He, K.; Chen, X. Personalized Federated Learning for Intelligent IoT Applications: A Cloud-Edge Based Framework. IEEE Open J. Comput. Soc. 2020, 1, 35–44. [Google Scholar] [CrossRef]
- Rahman, M.A.; Rashid, M.M.; Hossain, M.S.; Hassanain, E.; Alhamid, M.F.; Guizani, M. Blockchain and IoT-Based Cognitive Edge Framework for Sharing Economy Services in a Smart City. IEEE Access 2019, 7, 18611–18621. [Google Scholar] [CrossRef]
- de Freitas, M.P.; Piai, V.A.; Farias, R.H.; Fernandes, A.M.R.; de Moraes Rossetto, A.G.; Leithardt, V.R.Q. Artificial Intelligence of Things Applied to Assistive Technology: A Systematic Literature Review. Sensors 2022, 22, 8531. [Google Scholar] [CrossRef]
- Siam, S.I.; Ahn, H.; Liu, L.; Alam, S.; Shen, H.; Cao, Z.; Shroff, N.; Krishnamachari, B.; Srivastava, M.; Zhang, M. Artificial Intelligence of Things: A Survey. ACM Trans. Sens. Netw. 2025, 21, 1–75. [Google Scholar] [CrossRef]
- Atlam, H.F.; Walters, R.J.; Wills, G.B. Intelligence of Things: Opportunities & Challenges. In Proceedings of the 2018 3rd Cloudification of the Internet of Things (CIoT), Paris, France, 2–4 July 2018; pp. 1–6. [Google Scholar] [CrossRef]
- Ye, L.; Wang, Z.; Jia, T.; Ma, Y.; Shen, L.; Zhang, Y.; Li, H.; Chen, P.; Wu, M.; Liu, Y.; et al. Research progress on low-power artificial intelligence of things (AIoT) chip design. Sci. China Inf. Sci. 2023, 66, 200407. [Google Scholar] [CrossRef]
- Caruso, A.; Chessa, S. Energy Sustainable IoT Scheduling in a Fog/IoT Interplay. In Proceedings of the 2024 IEEE Symposium on Computers and Communications (ISCC), Paris, France, 26–29 June 2024; pp. 1–6. [Google Scholar] [CrossRef]
- Baldini, E.; Chessa, S.; Brogi, A. Estimating the Environmental Impact of Green IoT Deployments. Sensors 2023, 23, 1537. [Google Scholar] [CrossRef]
- Kuguoglu, B.K.; van der Voort, H.; Janssen, M. The Giant Leap for Smart Cities: Scaling Up Smart City Artificial Intelligence of Things (AIoT) Initiatives. Sustainability 2021, 13, 12295. [Google Scholar] [CrossRef]
- Hao, Q.; Nazir, S.; Li, M.; Ullah Khan, H.; Wang, L.; Ahmad, S. AI-Enabled Sensing and Decision-Making for IoT Systems. Complexity 2021, 2021, 6616279. [Google Scholar] [CrossRef]
- Molo, M.; Carlini, E.; Ciampi, L.; Gennaro, C.; Vadicamo, L. Teacher-Student Models for AI Vision at the Edge: A Car Parking Case Study. In Proceedings of the 19th International Conference on Computer Vision Theory and Applications, Rome, Italy, 27–29 February 2024; pp. 508–515. Available online: https://www.scitepress.org/Link.aspx?doi=10.5220/0012376900003660 (accessed on 30 May 2025).
- Premsankar, G.; Di Francesco, M.; Taleb, T. Edge Computing for the Internet of Things: A Case Study. IEEE Internet Things J. 2018, 5, 1275–1284. [Google Scholar] [CrossRef]
- Zhang, J.; Tao, D. Empowering Things With Intelligence: A Survey of the Progress, Challenges, and Opportunities in Artificial Intelligence of Things. IEEE Internet Things J. 2021, 8, 7789–7817. [Google Scholar] [CrossRef]
- Seng, K.P.; Ang, L.M.; Ngharamike, E. Artificial intelligence Internet of Things: A new paradigm of distributed sensor networks. Int. J. Distrib. Sens. Netw. 2022, 18, 15501477211062835. [Google Scholar] [CrossRef]
- Haroun, A.; Le, X.; Gao, S.; Dong, B.; He, T.; Zhang, Z.; Wen, F.; Xu, S.; Lee, C. Progress in micro/nano sensors and nanoenergy for future AIoT-based smart home applications. Nano Express 2021, 2, 022005. [Google Scholar] [CrossRef]
- Sun, K.; Wang, X.; Zhao, Q. A Comprehensive Review of AIoT-based Edge Devices and Lightweight Deployment. Authorea Prepr. 2022. [Google Scholar] [CrossRef]
- Jaramillo-Alcazar, A.; Govea, J.; Villegas-Ch, W. Advances in the Optimization of Vehicular Traffic in Smart Cities: Integration of Blockchain and Computer Vision for Sustainable Mobility. Sustainability 2023, 15, 15736. [Google Scholar] [CrossRef]
- Aliahmadi, A.; Nozari, H.; Ghahremani-Nahr, J. AIoT-based Sustainable Smart Supply Chain Framework. Int. J. Innov. Manag. Econ. Soc. Sci. 2022, 2, 28–38. [Google Scholar] [CrossRef]
- Nahr, J.G.; Nozari, H.; Sadeghi, M.E. Green supply chain based on artificial intelligence of things (AIoT). Int. J. Innov. Manag. Econ. Soc. Sci. 2021, 1, 56–63. [Google Scholar] [CrossRef]
- Zheng, Z.; Xie, S.; Dai, H.N.; Chen, X.; Wang, H. Blockchain challenges and opportunities: A survey. Int. J. Web Grid Serv. 2018, 14, 352. [Google Scholar] [CrossRef]
- Thapliyal, S.; Wazid, M.; Singh, D.P.; Chauhan, R.; Mishra, A.K.; Das, A.K. Secure Artificial Intelligence of Things (AIoT)-enabled authenticated key agreement technique for smart living environment. Comput. Electr. Eng. 2024, 118, 109353. [Google Scholar] [CrossRef]
- Altulaihan, E.; Almaiah, M.A.; Aljughaiman, A. Anomaly Detection IDS for Detecting DoS Attacks in IoT Networks Based on Machine Learning Algorithms. Sensors 2024, 24, 713. [Google Scholar] [CrossRef]
- Xu, Y.; Liu, X.; Cao, X.; Huang, C.; Liu, E.; Qian, S.; Liu, X.; Wu, Y.; Dong, F.; Qiu, C.-W.; et al. Artificial intelligence: A powerful paradigm for scientific research. Innovation 2021, 2, 100179. [Google Scholar] [CrossRef]
- Shahin, M.; Chen, F.; Bouzary, H.; Hosseinzadeh, A.; Rashidifar, R. Classification and Detection of Malicious Attacks in Industrial IoT Devices via Machine Learning. In Flexible Automation and Intelligent Manufacturing: The Human-Data-Technology Nexus; Lecture Notes in Mechanical Engineering; Kim, K.-Y., Monplaisir, L., Rickli, J., Eds.; Springer International Publishing: Cham, Switzerland, 2023; pp. 99–106. [Google Scholar] [CrossRef]
- Shahin, M.; Chen, F.; Bouzary, H.; Hosseinzadeh, A.; Rashidifar, R. Implementation of a Novel Fully Convolutional Network Approach to Detect and Classify Cyber-Attacks on IoT Devices in Smart Manufacturing Systems. In Flexible Automation and Intelligent Manufacturing: The Human-Data-Technology Nexus; Lecture Notes in Mechanical Engineering; Kim, K.-Y., Monplaisir, L., Rickli, J., Eds.; Springer International Publishing: Cham, Switzerland, 2023; pp. 107–114. [Google Scholar] [CrossRef]
- Shahin, M.; Chen, F.F.; Hosseinzadeh, A.; Lopez, E.C.; Bouzary, H.; Koodiani, H.K. An AI-Powered Network Intrusion Detection System in Industrial IoT Devices via Deep Learning. In Flexible Automation and Intelligent Manufacturing: Establishing Bridges for More Sustainable Manufacturing Systems; Lecture Notes in Mechanical Engineering; Silva, F.J.G., Ferreira, L.P., Sá, J.C., Pereira, M.T., Pinto, C.M.A., Eds.; Springer Nature: Cham, Switzerland, 2024; pp. 1149–1156. [Google Scholar]
- Kalota, F. A Primer on Generative Artificial Intelligence. Educ. Sci. 2024, 14, 172. [Google Scholar] [CrossRef]
- Shahin, M.; Hosseinzadeh, A.; Chen, F.F. AI-Enabled Sustainable Manufacturing: Intelligent Package Integrity Monitoring for Waste Reduction in Supply Chains. Electronics 2025, 14, 2824. [Google Scholar] [CrossRef]
- Shahin, M.; Chen, F.F.; Maghanaki, M.; Mehrzadi, H.; Hosseinzadeh, A. Toward sustainable production: A synthetic dataset framework to accelerate quality control via generative and predictive AI. Int. J. Adv. Manuf. Technol. 2025, 138, 5979–6018. [Google Scholar] [CrossRef]
- Radford, A.; Kim, J.W.; Hallacy, C.; Ramesh, A.; Goh, G.; Agarwal, S.; Sastry, G.; Askell, A.; Mishkin, P.; Clark, J.; et al. Learning Transferable Visual Models From Natural Language Supervision. In Proceedings of the Proceedings of the 38th International Conference on Machine Learning, PMLR, Virtual, 18–24 July 2021; pp. 8748–8763. Available online: https://proceedings.mlr.press/v139/radford21a.html (accessed on 17 April 2025).
- Pal, K.; Chaudhuri, R.; Deb, S.; Saha, A. Artistic Essence of Generative Adversarial Networks: Analyzing Training Data’s Impact on Performance. Procedia Comput. Sci. 2024, 235, 2577–2586. [Google Scholar] [CrossRef]
- Dhariwal, P.; Nichol, A. Diffusion models beat GANs on image synthesis. In Proceedings of the 35th International Conference on Neural Information Processing Systems, Virtual, 6–14 December 2021; Curran Associates Inc.: Red Hook, NY, USA, 2021; pp. 8780–8794. [Google Scholar]
- Shahin, M.; Maghanaki, M.; Hosseinzadeh, A.; Chen, F.F. Advancing Network Security in Industrial IoT: A Deep Dive into AI-Enabled Intrusion Detection Systems. Adv. Eng. Inform. 2024, 62, 102685. [Google Scholar] [CrossRef]
- Shahin, M.; Chen, F.F.; Bouzary, H.; Hosseinzadeh, A.; Rashidifar, R. A novel fully convolutional neural network approach for detection and classification of attacks on industrial IoT devices in smart manufacturing systems. Int. J. Adv. Manuf. Technol. 2022, 123, 2017–2029. [Google Scholar] [CrossRef]
- Shahin, M.; Chen, F.F.; Hosseinzadeh, A.; Bouzary, H.; Rashidifar, R. A deep hybrid learning model for detection of cyber attacks in industrial IoT devices. Int. J. Adv. Manuf. Technol. 2022, 123, 1973–1983. [Google Scholar] [CrossRef]
- Shahin, M.; Chen, F.F.; Bouzary, H.; Zarreh, A. Frameworks Proposed to Address the Threat of Cyber-Physical Attacks to Lean 4.0 Systems. Procedia Manuf. 2020, 51, 1184–1191. [Google Scholar] [CrossRef]
- Rey, V.; Sánchez, P.M.S.; Celdrán, A.H.; Bovet, G.; Jaggi, M. Federated Learning for Malware Detection in IoT Devices. Comput. Netw. 2022, 204, 108693. [Google Scholar] [CrossRef]
- Rahmati, M. Federated Learning-Driven Cybersecurity Framework for IoT Networks with Privacy-Preserving and Real-Time Threat Detection Capabilities. arXiv 2025, arXiv:2502.10599. [Google Scholar] [CrossRef]
- Wong, H. Securing the Future of AI at the Edge: An Overview of AI Compute Security. R Street Institute. Available online: https://www.rstreet.org/research/securing-the-future-of-ai-at-the-edge-an-overview-of-ai-compute-security/ (accessed on 30 May 2025).
- Karyemsetty, N.; Narasimha, P.B.; Tejaswi, M.P.; Sivaji, V.N.; Kamal, C.L.V.; Samatha, B. Cybersecurity Fortification in Edge Computing through the Synergy of Deep Learning. In Proceedings of the 2023 7th International Conference on I-SMAC (IoT in Social, Mobile, Analytics and Cloud) (I-SMAC), Kirtipur, Nepal, 11–13 October 2023; pp. 1154–1160. [Google Scholar] [CrossRef]
- Drake, M. Cybersecurity: Safeguarding the Future of IoT and AIoT: Strategies and Solutions for Securing the Connected World; Amazon Kindle Direct Publishing: Seattle, WA, USA, 2024; Available online: https://www.amazon.com/dp/B0DCZQDHXD (accessed on 13 May 2025).
- Mao, J.; Wei, Z.; Li, B.; Zhang, R.; Song, L. Toward Ever-Evolution Network Threats: A Hierarchical Federated Class-Incremental Learning Approach for Network Intrusion Detection in IIoT. IEEE Internet Things J. 2024, 11, 29864–29877. [Google Scholar] [CrossRef]
- Xenofontos, C.; Zografopoulos, I.; Konstantinou, C.; Jolfaei, A.; Khan, M.K.; Choo, K.-K.R. Consumer, Commercial, and Industrial IoT (In)Security: Attack Taxonomy and Case Studies. IEEE Internet Things J. 2022, 9, 199–221. [Google Scholar] [CrossRef]
- Sourav, S.; Chen, B. Exposing Hidden Attackers in Industrial Control Systems Using Micro-Distortions. IEEE Trans. Smart Grid 2024, 15, 2089–2101. [Google Scholar] [CrossRef]
- Goebel, K.; Rane, S. AI in Industrial IoT Cybersecurity [Industrial and Governmental Activities]. IEEE Comput. Intell. Mag. 2024, 19, 14–15. [Google Scholar] [CrossRef]
- Saheed, Y.K.; Abdulganiyu, O.H.; Tchakoucht, T.A. Modified genetic algorithm and fine-tuned long short-term memory network for intrusion detection in the internet of things networks with edge capabilities. Appl. Soft Comput. 2024, 155, 111434. [Google Scholar] [CrossRef]
- Liu, B.; Tang, D.; Chen, J.; Liang, W.; Liu, Y.; Yang, Q. ERT-EDR: Online defense framework for TCP-targeted LDoS attacks in SDN. Expert Syst. Appl. 2024, 254, 124356. [Google Scholar] [CrossRef]
- El Fawal, A.H.; Mansour, A.; Ammad Uddin, M.; Nasser, A. Securing IoT Networks from DDoS Attacks Using a Temporary Dynamic IP Strategy. Sensors 2024, 24, 4287. [Google Scholar] [CrossRef] [PubMed]
- Korsimaa, J.; Weber, M.; Salminen, P.; Mustonen, J.; Iablonskyi, D.; Hæggström, E.; Klami, A.; Salmi, A. Wireless and battery-operatable IoT platform for cost-effective detection of fouling in industrial equipment. Sci. Rep. 2024, 14, 14084. [Google Scholar] [CrossRef] [PubMed]
- Wu, Y.; Jing, T.; Gao, Q.; Mao, J.; Huo, Y.; Yang, Z. Multi-attribute weighted convolutional attention neural network for multiuser physical layer authentication in IIoT. Ad Hoc Netw. 2024, 163, 103593. [Google Scholar] [CrossRef]
- Dong, J.; Guan, Z.; Wu, L.; Du, X.; Guizani, M. A sentence-level text adversarial attack algorithm against IIoT based smart grid. Comput. Netw. 2021, 190, 107956. [Google Scholar] [CrossRef]
- Xie, R.; Gu, D.; Tang, Q.; Huang, T.; Yu, F.R. Workflow Scheduling in Serverless Edge Computing for the Industrial Internet of Things: A Learning Approach. IEEE Trans. Ind. Inform. 2023, 19, 8242–8252. [Google Scholar] [CrossRef]
- El-Sofany, H.; El-Seoud, S.A.; Karam, O.H.; Bouallegue, B. Using machine learning algorithms to enhance IoT system security. Sci. Rep. 2024, 14, 12077. [Google Scholar] [CrossRef]
- Ajmi, H.; Zayer, F.; Hadj Fredj, A.; Belgacem, H.; Mohammad, B.; Werghi, N.; Dias, J. Efficient and lightweight in-memory computing architecture for hardware security. J. Parallel Distrib. Comput. 2024, 190, 104898. [Google Scholar] [CrossRef]
- Al-Hadhrami, Y.; Hussain, F.K. DDoS attacks in IoT networks: A comprehensive systematic literature review. World Wide Web 2021, 24, 971–1001. [Google Scholar] [CrossRef]
- Farraj, A.; Hammad, E. A Physical-Layer Security Cooperative Framework for Mitigating Interference and Eavesdropping Attacks in Internet of Things Environments. Sensors 2024, 24, 5171. [Google Scholar] [CrossRef] [PubMed]
- Wisdom, D.D.; Vincent, O.R.; Igulu, K.; Hyacinth, E.A.; Christian, A.U.; Oduntan, O.E.; Hauni, A.G. Industrial IoT Security Infrastructures and Threats. In Communication Technologies and Security Challenges in IoT: Present and Future; Prasad, A., Singh, T.P., Dwivedi Sharma, S., Eds.; Springer Nature: Singapore, 2024; pp. 369–402. [Google Scholar] [CrossRef]
- Alnajim, A.M.; Habib, S.; Islam, M.; Thwin, S.M.; Alotaibi, F. A Comprehensive Survey of Cybersecurity Threats, Attacks, and Effective Countermeasures in Industrial Internet of Things. Technologies 2023, 11, 161. [Google Scholar] [CrossRef]
- Eyeleko, A.H.; Feng, T. A Critical Overview of Industrial Internet of Things Security and Privacy Issues Using a Layer-Based Hacking Scenario. IEEE Internet Things J. 2023, 10, 21917–21941. [Google Scholar] [CrossRef]
- Thomas, C.; Roberts, H.; Mökander, J.; Tsamados, A.; Taddeo, M.; Floridi, L. The case for a broader approach to AI assurance: Addressing “hidden” harms in the development of artificial intelligence. AI Soc. 2025, 40, 1469–1484. [Google Scholar] [CrossRef]
- Liu, H.; Li, S.; Li, W.; Sun, W. Efficient decentralized optimization for edge-enabled smart manufacturing: A federated learning-based framework. Future Gener. Comput. Syst. 2024, 157, 422–435. [Google Scholar] [CrossRef]
- Vargas Martínez, C.; Vogel-Heuser, B. Towards Industrial Intrusion Prevention Systems: A Concept and Implementation for Reactive Protection. Appl. Sci. 2018, 8, 2460. [Google Scholar] [CrossRef]
- Bridges, R.A.; Glass-Vanderlan, T.R.; Iannacone, M.D.; Vincent, M.S.; Chen, Q. (Guenevere) A Survey of Intrusion Detection Systems Leveraging Host Data. ACM Comput. Surv. 2019, 52, 1–35. [Google Scholar] [CrossRef]
- Panigrahi, R.; Borah, S.; Bhoi, A.K.; Mallick, P.K. Intrusion Detection Systems (IDS)—An Overview with a Generalized Framework. In Cognitive Informatics and Soft Computing; Advances in Intelligent Systems and Computing; Mallick, P.K., Balas, V.E., Bhoi, A.K., Chae, G.-S., Eds.; Springer: Singapore, 2020; pp. 107–117. [Google Scholar] [CrossRef]
- Cahyo, A.N.; Kartika Sari, A.; Riasetiawan, M. Comparison of Hybrid Intrusion Detection System. In Proceedings of the 2020 12th International Conference on Information Technology and Electrical Engineering (ICITEE), Yogyakarta, Indonesia, 6–8 October 2020; pp. 92–97. [Google Scholar] [CrossRef]
- Ghasemi, J.; Esmaily, J.; Moradinezhad, R. Intrusion detection system using an optimized kernel extreme learning machine and efficient features. Sadhana 2019, 45, 2. [Google Scholar] [CrossRef]
- Ibrahim, W.N.H.; Anuar, S.; Selamat, A.; Krejcar, O.; González Crespo, R.; Herrera-Viedma, E.; Fujita, H. Multilayer Framework for Botnet Detection Using Machine Learning Algorithms. IEEE Access 2021, 9, 48753–48768. [Google Scholar] [CrossRef]
- Wang, W.; Fang, B.; Zhang, Z.; Li, C. A Novel Approach to Detect IRC-Based Botnets. In Proceedings of the 2009 International Conference on Networks Security, Wireless Communications and Trusted Computing, Wuhan, China, 25–26 April 2009; pp. 408–411. [Google Scholar] [CrossRef]
- Zhao, D.; Traore, I.; Sayed, B.; Lu, W.; Saad, S.; Ghorbani, A.; Garant, D. Botnet detection based on traffic behavior analysis and flow intervals. Comput. Secur. 2013, 39, 2–16. [Google Scholar] [CrossRef]
- Moura, G.C.M.; Sadre, R.; Pras, A. Bad neighborhoods on the internet. IEEE Commun. Mag. 2014, 52, 132–139. [Google Scholar] [CrossRef][Green Version]
- Yoon, M. Using whitelisting to mitigate DDoS attacks on critical Internet sites. IEEE Commun. Mag. 2010, 48, 110–115. [Google Scholar] [CrossRef]
- Kalkan, K.; Altay, L.; Gür, G.; Alagöz, F. JESS: Joint Entropy-Based DDoS Defense Scheme in SDN. IEEE J. Sel. Areas Commun. 2018, 36, 2358–2372. [Google Scholar] [CrossRef]
- Kim, A.; Park, M.; Lee, D.H. AI-IDS: Application of Deep Learning to Real-Time Web Intrusion Detection. IEEE Access 2020, 8, 70245–70261. [Google Scholar] [CrossRef]
- Kumar, V.; Sinha, D.; Das, A.K.; Pandey, S.C.; Goswami, R.T. An integrated rule based intrusion detection system: Analysis on UNSW-NB15 data set and the real time online dataset. Clust. Comput. 2020, 23, 1397–1418. [Google Scholar] [CrossRef]
- Choudhary, S.; Kesswani, N. A Survey: Intrusion Detection Techniques for Internet of Things. Int. J. Inf. Secur. Priv. IJISP 2019, 13, 86–105. [Google Scholar] [CrossRef]
- Choraś, M.; Saganowski, Ł.; Renk, R.; Hołubowicz, W. Statistical and signal-based network traffic recognition for anomaly detection. Expert Syst. 2012, 29, 232–245. [Google Scholar] [CrossRef]
- Albalwy, F.; Almohaimeed, M. Advancing Artificial Intelligence of Things Security: Integrating Feature Selection and Deep Learning for Real-Time Intrusion Detection. Systems 2025, 13, 231. [Google Scholar] [CrossRef]
- Coppolino, L.; D’Antonio, S.; Mazzeo, G.; Uccello, F. The good, the bad, and the algorithm: The impact of generative AI on cybersecurity. Neurocomputing 2025, 623, 129406. [Google Scholar] [CrossRef]
- Abu Al-Haija, Q.; Zein-Sabatto, S. An efficient deep-learning-based detection and classification system for cyber-attacks in IoT communication networks. Electronics 2020, 9, 2152. [Google Scholar] [CrossRef]
- Khan, M.A.; Abbas, S.; Rehman, A.; Saeed, Y.; Zeb, A.; Uddin, M.I.; Nasser, N.; Ali, A. A Machine Learning Approach for Blockchain-Based Smart Home Networks Security. IEEE Netw. 2021, 35, 223–229. [Google Scholar] [CrossRef]
- Vanhoenshoven, F.; Nápoles, G.; Falcon, R.; Vanhoof, K.; Köppen, M. Detecting malicious URLs using machine learning techniques. In Proceedings of the 2016 IEEE Symposium Series on Computational Intelligence (SSCI), Athens, Greece, 6–9 December 2016; pp. 1–8. [Google Scholar] [CrossRef]
- Sun, R.; Yang, B.; Peng, L.; Chen, Z.; Zhang, L.; Jing, S. Traffic classification using probabilistic neural networks. In Proceedings of the 2010 Sixth International Conference on Natural Computation, Yantai, China, 10–12 August 2010; pp. 1914–1919. [Google Scholar] [CrossRef]
- Yang, J.; Liang, G.; Li, B.; Wen, G.; Gao, T. A deep-learning- and reinforcement-learning-based system for encrypted network malicious traffic detection. Electron. Lett. 2021, 57, 363–365. [Google Scholar] [CrossRef]
- Ongun, T.; Sakharaov, T.; Boboila, S.; Oprea, A.; Eliassi-Rad, T. On Designing Machine Learning Models for Malicious Network Traffic Classification. arXiv 2019, arXiv:1907.04846. [Google Scholar] [CrossRef]
- Arifin, M.M.; Ahmed, M.S.; Ghosh, T.K.; Zhuang, J.; Yeh, J. A Survey on the Application of Generative Adversarial Networks in Cybersecurity: Prospective, Direction and Open Research Scopes. arXiv 2024, arXiv:2407.08839. Available online: https://arxiv.org/abs/2407.08839 (accessed on 14 January 2025). [CrossRef]
- Sebestyen, H.; Popescu, D.E.; Zmaranda, R.D. A Literature Review on Security in the Internet of Things: Identifying and Analysing Critical Categories. Computers 2025, 14, 61. [Google Scholar] [CrossRef]
- Buvaneswari, P.R.; Madhura, G.K.; Alasady, H.; Alagarraja, K.; Soni, M. Anomaly-Based Intrusion Detection Systems by using Machine Learning based Stacking Ensemble Model. In Proceedings of the 2025 3rd International Conference on Integrated Circuits and Communication Systems (ICICACS), Raichur, India, 21–22 February 2025; pp. 1–5. [Google Scholar] [CrossRef]
- Zavrak, S.; İskefiyeli, M. Anomaly-Based Intrusion Detection From Network Flow Features Using Variational Autoencoder. IEEE Access 2020, 8, 108346–108358. [Google Scholar] [CrossRef]
- Hara, K.; Shiomoto, K. Intrusion Detection System using Semi-Supervised Learning with Adversarial Auto-encoder. In Proceedings of the NOMS 2020 IEEE/IFIP Network Operations and Management Symposium, Budapest, Hungary, 20–24 April 2020; pp. 1–8. [Google Scholar] [CrossRef]
- Li, Z.; Wang, P.; Wang, Z. FlowGANAnomaly: Flow-Based Anomaly Network Intrusion Detection with Adversarial Learning. Chin. J. Electron. 2024, 33, 58–71. [Google Scholar] [CrossRef]
- Ferdowsi, A.; Saad, W. Generative Adversarial Networks for Distributed Intrusion Detection in the Internet of Things. In Proceedings of the 2019 IEEE Global Communications Conference (GLOBECOM), Waikoloa, HI, USA, 9–13 December 2019; pp. 1–6. [Google Scholar] [CrossRef]
- Mokbal, F.M.M.; Wang, D.; Wang, X.; Fu, L. Data augmentation-based conditional Wasserstein generative adversarial network-gradient penalty for XSS attack detection system. PeerJ Comput. Sci. 2020, 6, e328. [Google Scholar] [CrossRef]
- Xie, J.; Li, S.; Zhang, Y.; Sun, P.; Xu, H. Analysis and Detection against Network Attacks in the Overlapping Phenomenon of Behavior Attribute. Comput. Secur. 2022, 121, 102867. [Google Scholar] [CrossRef]
- Sahakian, M.G.; Musuvathy, S.; Thorpe, J.; Verzi, S.; Vugrin, E.; Dykstra, M. Threat Data Generation for Space Systems. In Proceedings of the 2021 IEEE Space Computing Conference (SCC), Virtual, 5–10 August 2021; pp. 100–109. [Google Scholar] [CrossRef]
- Le, K.-H.; Nguyen, M.-H.; Tran, T.-D.; Tran, N.-D. IMIDS: An Intelligent Intrusion Detection System against Cyber Threats in IoT. Electronics 2022, 11, 524. [Google Scholar] [CrossRef]
- Vijai, P.; Sivakumar, P.B. Anomaly detection solutions: The dynamic loss approach in VAE for manufacturing and IoT environment. Results Eng. 2025, 25, 104277. [Google Scholar] [CrossRef]
- Alam, S.; Zhang, T.; Feng, T.; Shen, H.; Cao, Z.; Zhao, D.; Ko, J.; Somasundaram, K.; Narayanan, S.S.; Avestimehr, S.; et al. FedAIoT: A Federated Learning Benchmark for Artificial Intelligence of Things. arXiv 2024, arXiv:2310.00109. [Google Scholar] [CrossRef]
- Hamad, N.A.; Bakar, K.A.A.; Qamar, F.; Jubair, A.M.; Mohamed, R.R.; Mohamed, M.A. Systematic Analysis of Federated Learning Approaches for Intrusion Detection in the Internet of Things Environment. IEEE Access 2025, 13, 95410–95444. [Google Scholar] [CrossRef]
- Belenguer, A.; Pascual, J.A.; Navaridas, J. A Review of Federated Learning Applications in Intrusion Detection Systems. Comput. Netw. 2025, 258, 111023. [Google Scholar] [CrossRef]
- Vanhaesebrouck, P.; Bellet, A.; Tommasi, M. Decentralized Collaborative Learning of Personalized Models over Networks. arXiv 2017, arXiv:1610.05202. [Google Scholar] [CrossRef]
- Meidan, Y.; Bohadana, M.; Mathov, Y.; Mirsky, Y.; Shabtai, A.; Breitenbacher, D.; Elovici, Y. N-BaIoT—Network-Based Detection of IoT Botnet Attacks Using Deep Autoencoders. IEEE Pervasive Comput. 2018, 17, 12–22. [Google Scholar] [CrossRef]
- Zhang, X.; Upton, O.; Beebe, N.L.; Choo, K.-K.R. IoT Botnet Forensics: A Comprehensive Digital Forensic Case Study on Mirai Botnet Servers. Forensic Sci. Int. Digit. Investig. 2020, 32, 300926. [Google Scholar] [CrossRef]
- Gelgi, M.; Guan, Y.; Arunachala, S.; Samba Siva Rao, M.; Dragoni, N. Systematic Literature Review of IoT Botnet DDOS Attacks and Evaluation of Detection Techniques. Sensors 2024, 24, 3571. [Google Scholar] [CrossRef]
- Ali, A.; Husain, M.; Hans, P. Federated Learning-Enhanced Blockchain Framework for Privacy-Preserving Intrusion Detection in Industrial IoT. arXiv 2025, arXiv:2505.15376. [Google Scholar] [CrossRef]
- Namakshenas, D.; Yazdinejad, A.; Dehghantanha, A.; Srivastava, G. Federated Quantum-Based Privacy-Preserving Threat Detection Model for Consumer Internet of Things. IEEE Trans. Consum. Electron. 2024, 70, 5829–5838. [Google Scholar] [CrossRef]
Disclaimer/Publisher’s Note: The statements, opinions and data contained in all publications are solely those of the individual author(s) and contributor(s) and not of MDPI and/or the editor(s). MDPI and/or the editor(s) disclaim responsibility for any injury to people or property resulting from any ideas, methods, instructions or products referred to in the content. |
© 2025 by the authors. Licensee MDPI, Basel, Switzerland. This article is an open access article distributed under the terms and conditions of the Creative Commons Attribution (CC BY) license (https://creativecommons.org/licenses/by/4.0/).