1. Introduction
The smart grid is a game-changing improvement to the traditional power grid, adding connectivity, intelligence, and modern control to the conventional power infrastructure, which transmits electricity from the power plant to users. Given that smart grids generate income for energy suppliers and allow access to highly privileged and confidential customer information, they have become an appealing target for a range of cyber-attacks, highlighting the critical need for smart-grid security [
1]. According to the French think-tank Institut Français des Relations Internationales (IFRI), cyber-criminals have increasingly targeted the energy sector over the last decade, with cyber-attacks increasing by 380 percent between 2014 and 2015 [
2]. Geopolitics, terrorism, and financial gain are all possible motivations. In 2020, the European Network of Transmission System Operators for Electricity (ENTSO-E), a consortium of 42 European transmission system operators, found evidence of a successful cyber intrusion into its office network. Due to the limited information provided, it was unclear whether the attack affected the customers, stakeholders, or IT systems [
3]. Other significant cyber-attacks occurred in 2019 against Russia’s power infrastructure [
4] and in 2017 against Saudi Aramco’s petrochemical plants [
5]. Ukraine’s grid was targeted in 2015, knocking down power to thousands of people [
6]. Among the attacks carried out, it is possible to mention the exploitation of existing remote access tools within the environment and telephone denial-of-service attacks. In 2014, cyber attackers infiltrated Korea Hydro and Nuclear Power, South Korea’s nuclear and hydroelectric corporation, posting designs and manuals for two nuclear reactors online and exposing the personal information of thousands of employees [
7]. The intruders attacked in three ways: (1) they utilized several malwares, (2) they exploited a vulnerability in the Korean language’s writing system, and (3) they used phishing emails.
A variety of security methods have been proposed for the smart grid, including encryption, authentication, virus protection, network security, and Intrusion Detection Systems (IDSs). Intrusion detection is a network security mechanism that emphasizes identifying and preventing recognized threats. The fundamental function of an IDS is to monitor the network and alert system administrators upon detecting a potential threat. Intrusion Detection Systems (IDSs) can be primarily categorized into Signature-Based Intrusion Detection Systems (SIDSs) and Anomaly-Based Intrusion Detection Systems (AIDSs). Signature Intrusion Detection Systems (SIDSs) utilize pattern-matching techniques to identify known attacks; this technology is also known as Knowledge-based Detection. A standard model of system behavior in AIDSs is constructed via machine learning, deep learning, statistical techniques, or knowledge-based approaches. A notable discrepancy between observed and anticipated behavior is regarded as an anomaly, perhaps interpreted as an attack [
8]. Currently, signature-based cybersecurity solutions are being progressively replaced by intelligent cybersecurity agents. Network anomalies differ from standard network virus infections. Anomalies in networks are identified by detecting nonconforming patterns within the network data. The classification of network traffic utilizing machine learning and deep learning algorithms has proven to be highly effective [
9]. Given the challenges associated with classifying extensive network traffic, unsupervised learning methodologies are more feasible.
The electrical substation’s design has changed multiple times in recent years. The developments are aimed at enhancing communications through the use of more efficient Ethernet and TCP/IP technology. Different protocols and abstract data models that enable the interoperability of devices from many vendors emerged. The Manufacturing Message Specification (MMS) protocol is frequently used to increase process automation in IEC 61850-based power stations. However, because this protocol was not developed with security in mind, it is susceptible to a variety of cyber-attacks [
10]. This paper proposes an unsupervised deep learning approach combined with text mining for detecting attack sequences in Manufacturing Message Specification (MMS) traffic samples. In contrast to the major works that have been proposed in the state of the art, this paper proposes a solution for raw and unstructured MMS data. We used text mining techniques to pre-process the XML data generated from the MMS PCAP files. To detect attack sequences, an LSTM Autoencoder model has been proposed and trained on benign MMS traffic. It then reconstructs the input sequences and classifies the sequences that were poorly reconstructed as intrusions.
1.1. Motivation
The motivation of this work is to address the vulnerability of the MMS protocol to cyber-attacks in smart grid systems by developing an unsupervised deep learning approach for anomaly detection that does not rely on labeled data, thus overcoming the limitations of conventional methods. The work also aims to handle high-dimensional time series data effectively while maintaining a high True Positive Rate.
1.2. Objectives
The objective of this paper is to develop an anomaly detection method using a bidirectional LSTM autoencoder. It also aims to implement a text-mining strategy with a TF-IDF vectorizer and truncated SVD for data preparation and feature extraction. Furthermore, the proposed approach focuses on creating an unsupervised model that learns from normal samples without relying on labeled data. The model is designed to detect attack sequences in Manufacturing Message Specification (MMS) traffic samples. Additionally, this work addresses challenges in pre-processing raw data sources and developing a deep learning model for unsupervised intrusion detection.
1.3. Research Question
The research question this paper aims to answer can be formulated as follows: How can an unsupervised deep learning approach combined with text mining be used to effectively detect intrusion in Manufacturing Message Specification (MMS) traffic within smart grid communication networks?
The rest of this paper is as follows.
Section 2 discusses the related work.
Section 3 addresses the challenge of anomaly detection for multidimensional time series data.
Section 4 presents the data collection process.
Section 5 and
Section 6 detail the pre-processing and model training steps, respectively. The accomplished experiments and the results are presented in
Section 7.
Section 8 provides a reflection on the proposed approach, and explores future directions. Finally, the conclusion is presented in
Section 9.
2. Related Work
This article addresses two primary challenges: (1) pre-processing raw data sources such as Wireshark PCAP capture files, and (2) developing an effective deep learning (DL) model for unsupervised intrusion detection. The closest work to the one proposed in this paper is presented by Lotfollahi et al. in [
11]. Their task was to classify network traffic using the ISCXVPN2016 dataset (
https://www.unb.ca/cic/datasets/vpn.html, accessed on 12 March 2025) [
12] to become aware of the applications the clients utilized to allocate suitable resources. The authors deleted Ethernet headers and padded traffic with UDP header with zeros to a length of 20 bytes during the pre-processing phase. They suppressed the IP address in the IP header to minimize overfitting, as the dataset was collected using a small number of hosts and servers. The authors then transformed the raw packets into byte vectors of size 1500 and normalized them by dividing them by 255. The obtained byte vectors are then fed into a supervised deep learning model based on a 1D convolutional neural network (CNN) architecture (
https://github.com/munhouiani/Deep-Packet, accessed on 12 March 2025). Feature selection is a critical step in such applications since the practicability of the selected features can directly affect the model’s performance. The authors proposed a strategy based on automatic feature selection from the PCAP files in the study mentioned above. The approach taken in this paper is different. Rather than treating each input packet as a byte vector, we propose employing vector models and text pre-processing to mine the generated XML from the PCAP files. The goal is to build a more data-agnostic approach to feature extraction/selection that can be easily extended and applied to various security applications.
Recent research on anomaly-based intrusion detection using raw PCAP files has focused on leveraging machine learning techniques to improve detection accuracy and efficiency. Studies have explored various algorithms, including Random Forest, Gaussian Naive Bayes, and multilayer perceptron [
13]. Autoencoders have been utilized for dimensionality reduction and feature extraction [
14,
15]. The CSE-CIC-IDS2018 dataset has been widely used for training and evaluating intrusion detection models [
16]. Researchers have also investigated real-time intrusion detection using network monitoring tools like Wireshark [
17]. Adversarial training strategies have been proposed to enhance anomaly detection capabilities [
18]. The field continues to evolve, addressing challenges such as class imbalance and the need for improved data cleaning and reproducibility [
16,
19]. Zhang et al. [
20] also examined traffic classification, utilizing raw network traffic data retrieved from PCAP files. The input was represented as a fixed-size byte vector of m, but the authors employed an embedding layer to enhance the information in each byte, allowing each byte to be transformed into a one-hot vector with a dimension of 255. The authors trained a supervised one-dimensional convolutional neural network (1D-CNN) model for deep learning. Additional researchers have investigated the ISCXVPN2016, extracting features from the data through various methods, including the conversion of PCAP files to JSON and the application of static and statistical features (
https://github.com/qa276390/Encrypted_Traffic_Classification, accessed on 12 March 2025) [
21]. To the best of our knowledge, our work uniquely addresses the intrusion detection problem by directly modeling the raw XML data extracted from PCAP files as textual data, bypassing the traditional feature selection step. This novel approach allows us to treat network data in their original form, leveraging their textual representation to develop an anomaly detection framework that avoids the pre-processing and feature engineering stages typically employed in other methods.
The literature contains several works that address the development of Intrusion Detection Systems for MMS attacks in smart-grid and industrial control systems [
22,
23]. After surveying the related literature, different challenges and difficulties could be figured such as the complex structure of MMS packets, the inability of supervised approaches to detect unknown attacks, and the length of time required to parse data packets. This paper is not concerned with supervised intrusion detection for several reasons. First, it is not always possible to have labeled data when collecting network traffic, and if it is possible, the labeling process is very time-consuming. Also, one of the weaknesses of supervised learning in such problems is that a model learns to classify what it has seen in the past, making it less effective against more recent and advanced threats. The following sections present a traffic mining-based intrusion detection approach in which traffic data are collected, and unsupervised deep learning is used to identify abnormal behaviors in industrial networks.
3. Anomaly Detection for Time Series
Numerous researches have demonstrated that anomaly detection based on time series data analysis is a viable method. Traditional anomaly detection techniques, such as KNN [
24], the local anomaly factor (LOF) algorithm [
25], and the connectivity-based outlier factor (COF) algorithm [
26], use sample similarity to differentiate between normal and abnormal data. However, these algorithms suffer from a high computational cost, a high missed detection rate, and the inability to adapt to high-dimensional data. For instance, the KNN technique encounters two challenges in high-dimensional spaces: it becomes computationally more expensive to compute distance and discover the nearest neighbors in high-dimensional space.
Recent research in unsupervised anomaly detection for multivariate time series data has focused on utilizing variational autoencoders [
27,
28] and generative adversarial networks [
29,
30], to capture complex temporal dependencies and inter-correlations between time series. Some models incorporate self-supervised learning [
31] or self-training [
29] to improve performance on noisy or contaminated data. Other approaches employ low-rank and sparse decomposition [
32] or state-space models [
33] for robust anomaly detection. Researchers have also explored lightweight models for edge computing applications [
28] and interpretable methods for safety-critical systems [
32]. These techniques have been applied to various domains, including semiconductor manufacturing [
34], water treatment systems [
32], and IoT systems [
31], demonstrating improved performance over existing methods. Through the unsupervised learning model, it is possible to cope with data that are not labeled in the actual world, hence improving the anomaly detection system’s real-time performance. However, typical unsupervised learning methods do not perform well with high-dimensional time series data because the majority of data generated during the actual industrial production process are high-dimensional and highly dynamic.
Conventional stacked autoencoders can process high-dimensional data, but their performance on time series data is poor, while the LSTM network can efficiently extract the data’s time series characteristics. In this paper, we integrate the features of the autoencoder with the LSTM network, resulting in the adoption of the LSTM-based technique for unsupervised detection of abnormal events in smart-grid networks. Autoencoders can handle multidimensional nonlinear data and learn the usual behavior of unlabeled datasets due to their architecture. Combining LSTM networks and autoencoders and segmenting dataset samples with sliding windows enables LSTM units to capture temporal relationships in multivariate time series with the proposed approach. Simultaneously, the model integrates the BiLSTM (bidirectional LSTM) network with the LSTM network, which can better exploit the long-term dependencies in the data and, in comparison to a basic LSTM network, can also extract the influence of the data before and after the anomalous moment. After experimental validation, the approach described in this study has a good effect on processing high-volume, high-dimensional, unlabeled, and time-related unbalanced data, and it is more adaptable to the actual industrial environment. Our work stands out by addressing the anomaly detection problem directly on raw multivariate time series data as textual data.
4. Data Generation
4.1. Manufacturing Message Specification
The topic of interest of this paper is intrusion detection in Manufacturing Message Specification (MMS) traffic in a power grid environment. The 61850/MMS standard applies to controlling power grids [
35], defining the communication between Intelligent Electronic Devices (IEDs). Its objective is to replace the manufacturers’ proprietary protocols and thus allow equipment interoperability. It describes a data model, a set of services to access data, and mappings to protocols for using these services. This standard is designed for the control of electrical networks. However, it does not propose a new communication protocol. It is based on existing protocols such as MMS (ISO 9506) [
36], GOOSE (Generic Object Oriented Substation Event), and a mechanism for transmitting sampled values (Sampled Values).
4.2. Data Simulation
The training dataset consists of nearly 15 days of normal network traffic and exceeds 10 GB in size. The testing set has a size of approximately 1.3 GB. Using the MMS Custom Event Generator, specific MMS services and objects were targeted, creating synthetic MMS messages. Malicious sequences were introduced by manipulating critical fields like invokeID, introducing inconsistencies such as incorrect packet lengths, and simulating invalid services. These malicious messages were injected into the legitimate traffic as XML files with attack annotations, enabling validation of unsupervised learning models for anomaly detection.
Malicious messages were injected by leveraging the customization and parsing capabilities of the MMS Protocol Parser for Zeek IDS. Attack signatures, such as repeated protection relay closures or abnormal phase angle readings, were introduced into the traffic, marked by comments in the converted XML file. The following attack scenarios were used to inject malicious messages into the dataset:
Manipulation of invokeID: The identification number of MMS service requests was altered, potentially causing confusion or misinterpretation of commands.
Incorrect packet lengths: Packets with lengths that did not match their actual content were sent, leading to potential parsing errors or buffer overflow vulnerabilities.
Invalid services: Requests for non-existent or unauthorized services were introduced, probing for system vulnerabilities.
Repeated protection relay closures: Attack sequences were injected to simulate an attacker repeatedly closing or opening critical power system components, leading to possible system instability or damage.
Abnormal phase angle readings: False data were injected into power system monitoring, potentially causing incorrect system state estimation or improper control actions.
To detect these anomalies, the protocol parser implemented in Zeek IDS identifies specific MMS protocol data units (PDUs) such as confirmed-RequestPDU, rejectPDU, and others. These were used to monitor various states and behaviors of protection relays in the system. There are different types of protocol data units (PDUs) in the collected MMS packets, including confirmed-RequestPDU, confirmed-ResponsePDU, confirmed-ErrorPDU, rejectPDU, cancel-RequestPDU, cancel-ResponsePDU, cancel-ErrorPDU, initiate-ResponsePDU, and initiate-ErrorPDU.
5. Data Pre-Processing
MMS raw network traffic data records are stored in PCAP format files that involve a mixture of PDU types. To apply the raw data to the anomaly detection model, it is necessary to pre-process the original traffic data into a suitable data format.
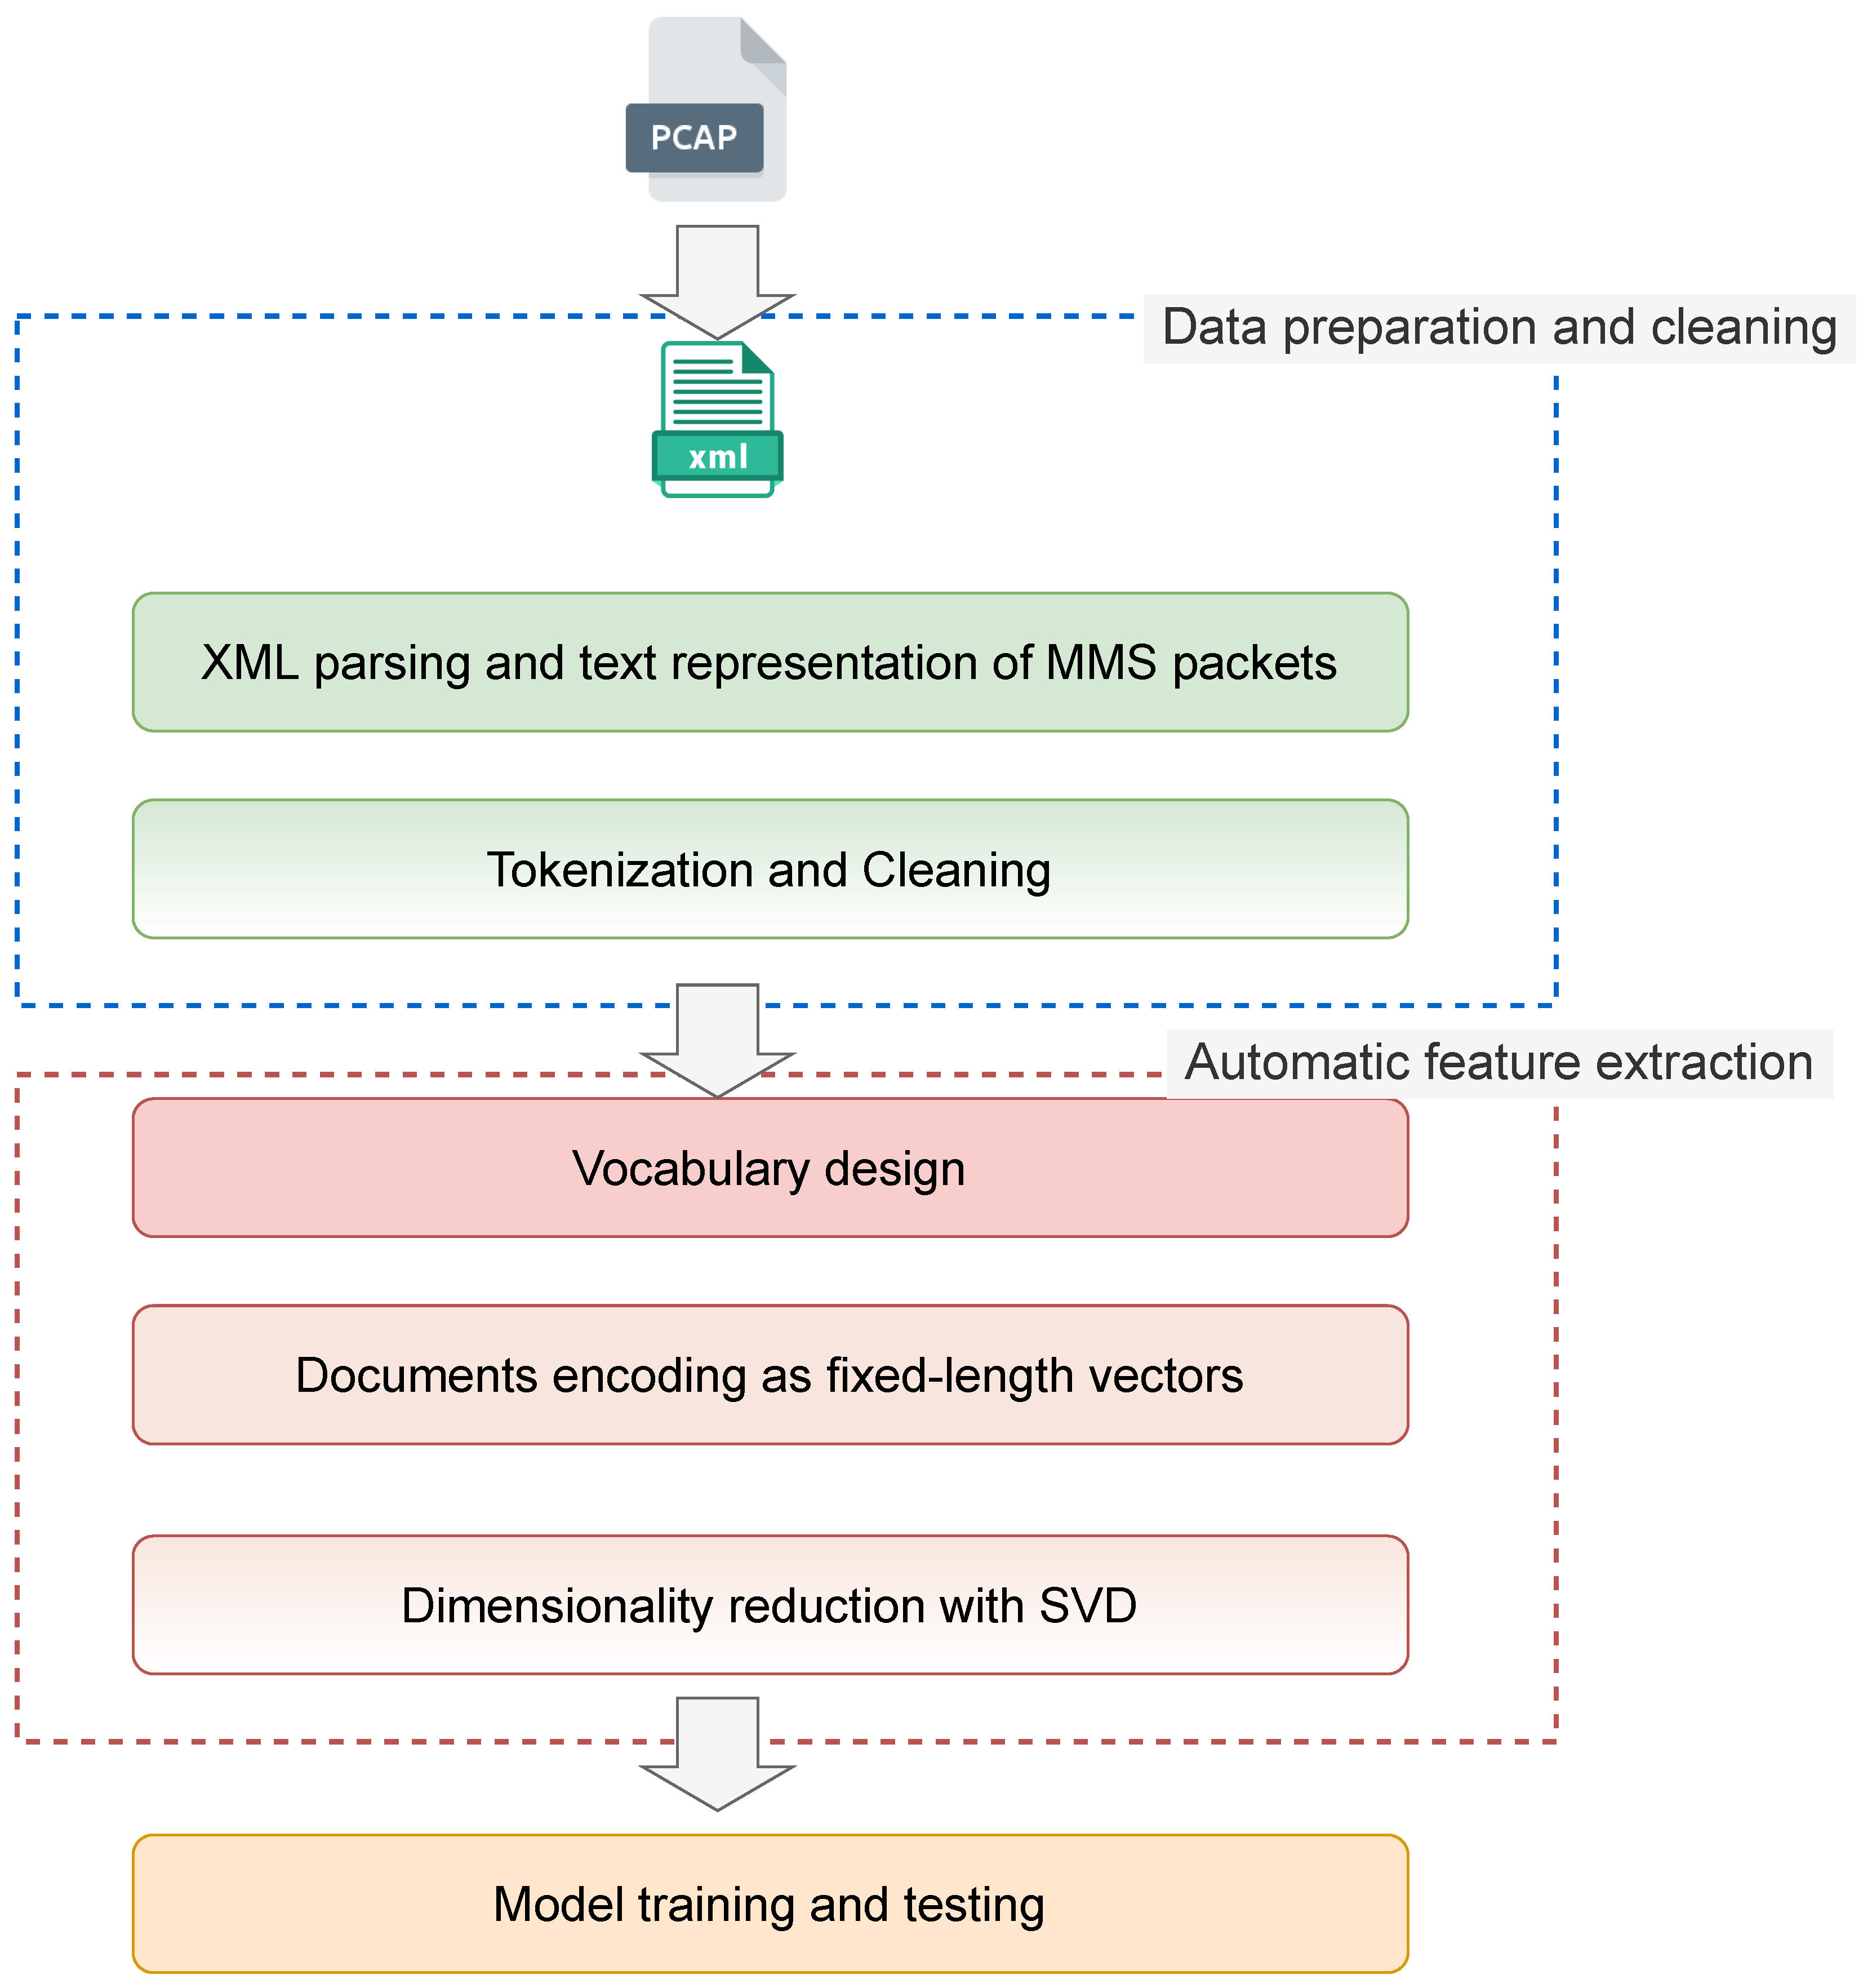
Figure 1 illustrates the pre-processing of raw data. The significant steps taken in the pre-processing phase are discussed in the following.
5.1. Data Preparation and Cleaning
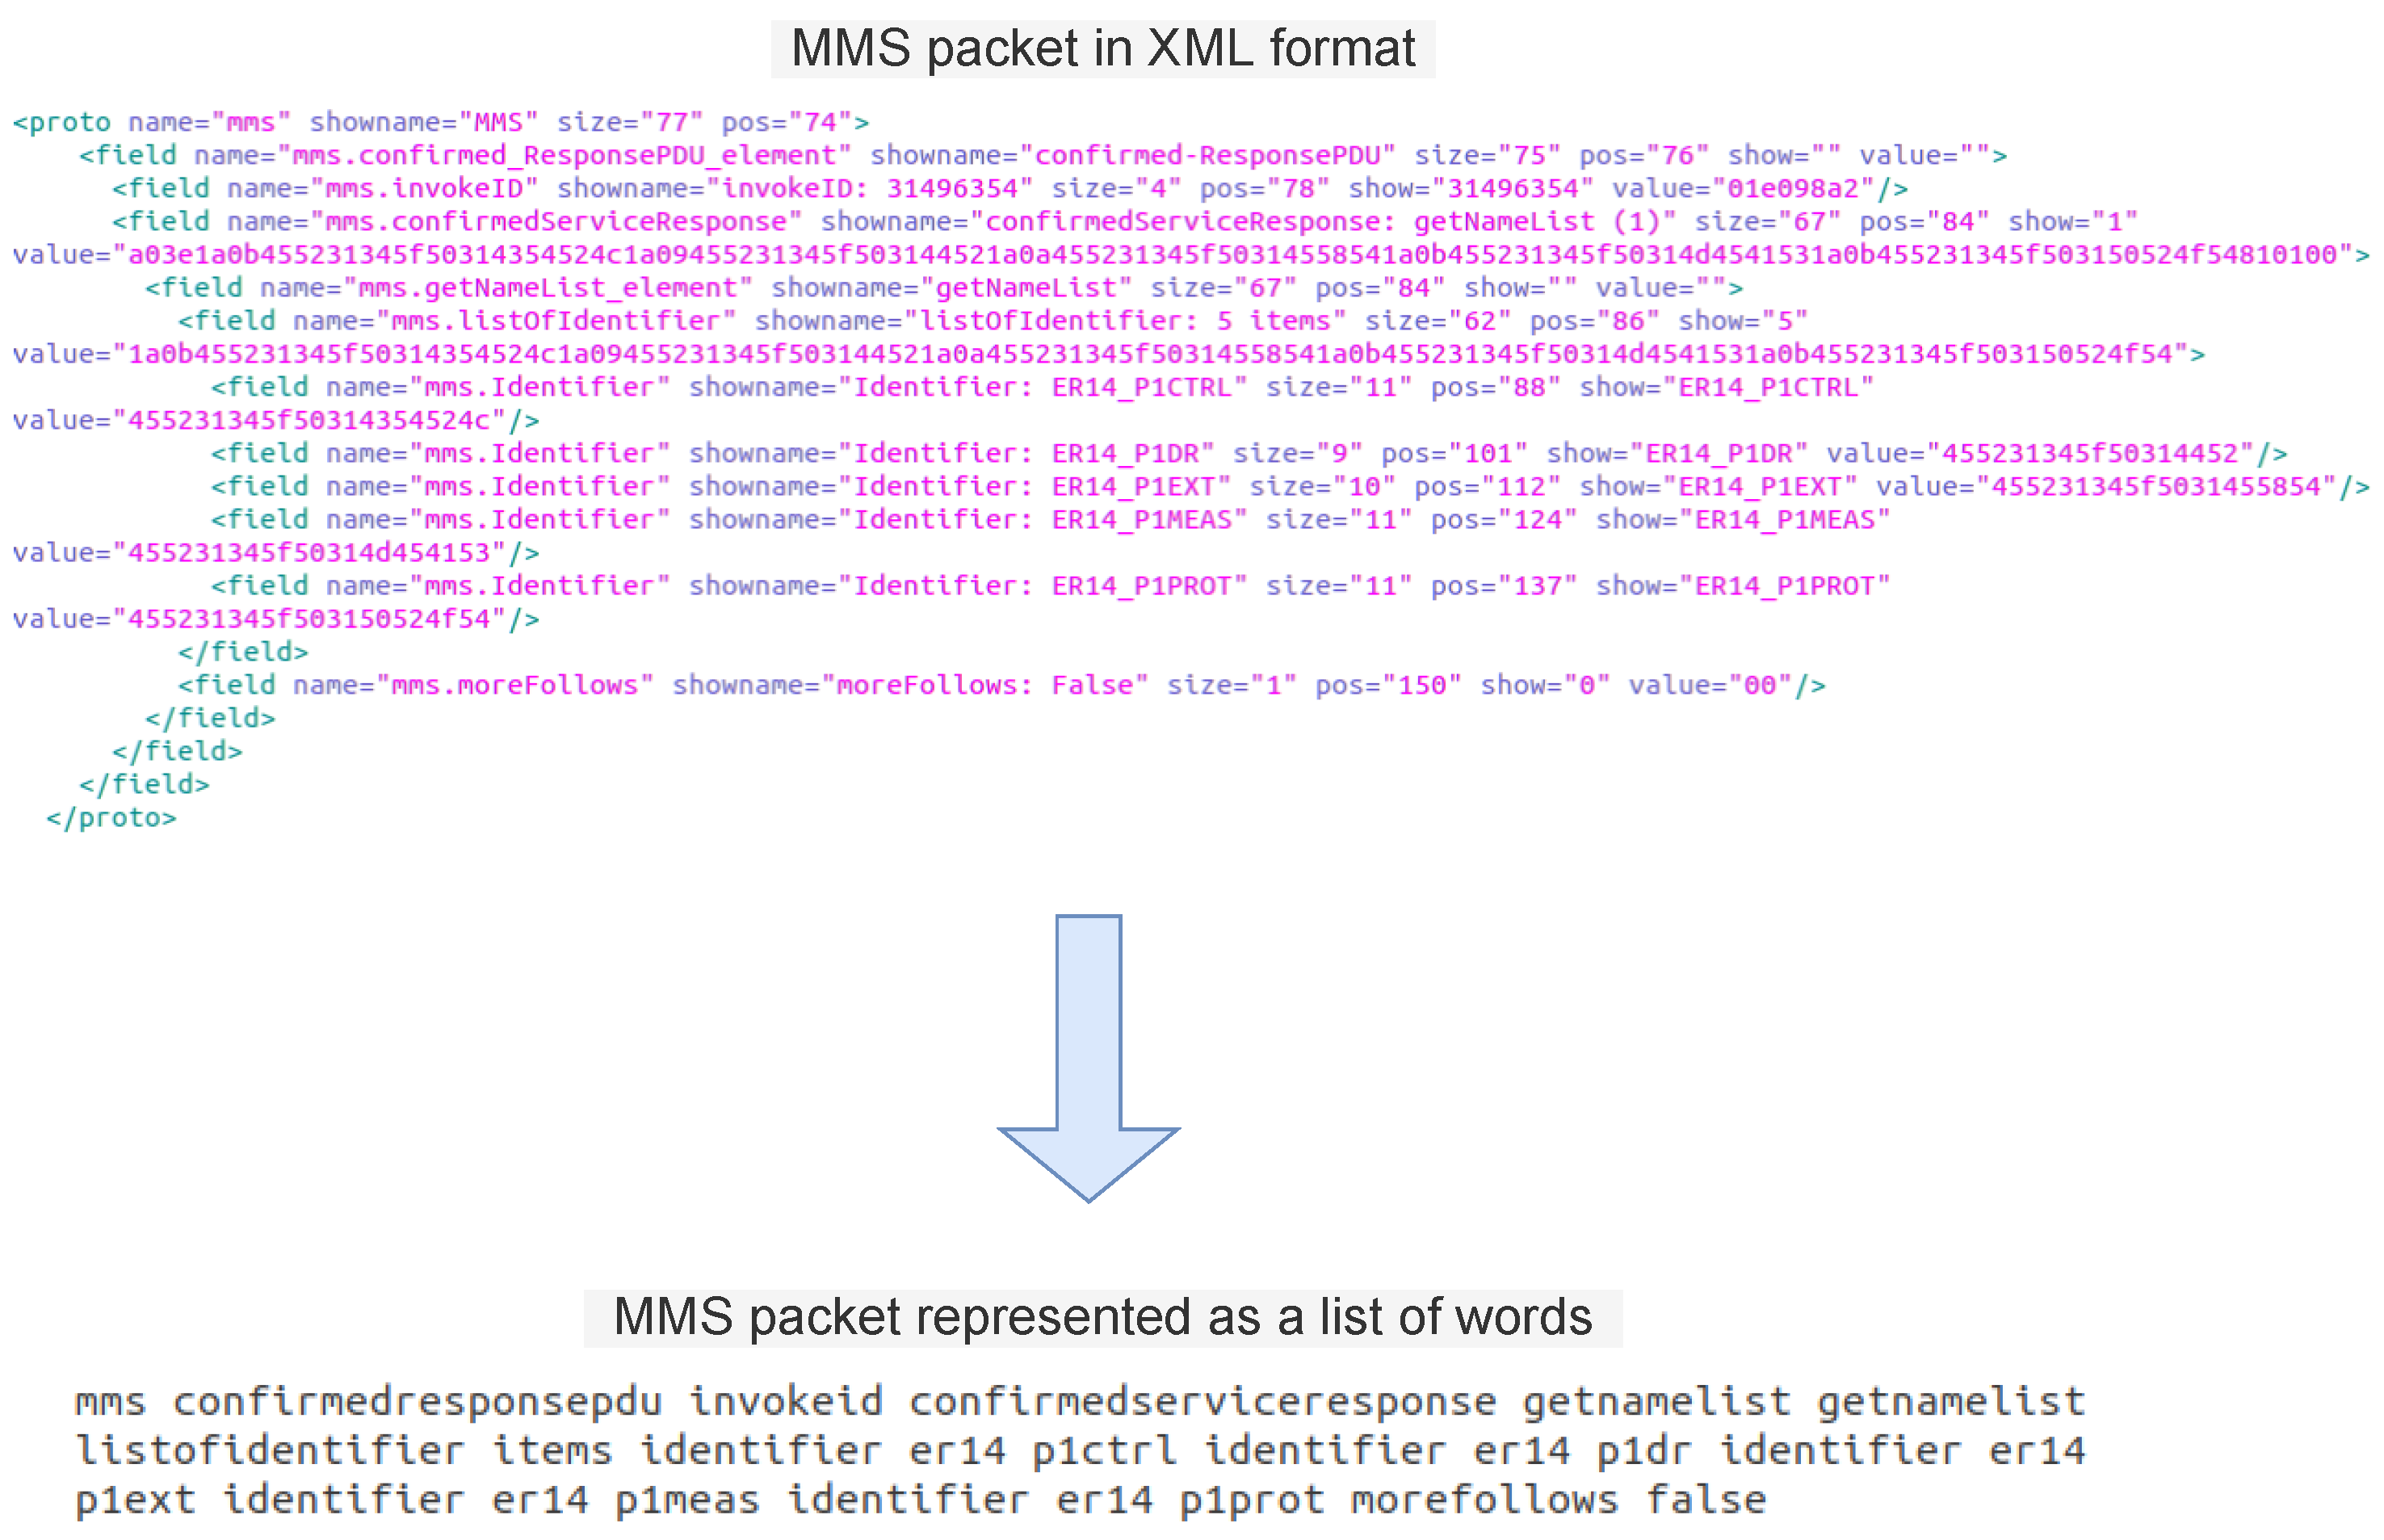
The complexity of an MMS packet’s data format and what contributes to its difficulty in parsing and processing is the presence of optional fields that may or may not exist in the packet, the requirement to support a vast number of MMS services, and the recursive data structures. The challenge is that each type of PDU contains different fields than other PDUs, which makes it difficult to represent the data in a structured way. The goal is to turn each packet into a list containing many words. We were inspired by how textual data are pre-processed in natural language processing, where a sentence is considered a sequence of tokens or words. In this context, each XML tag representing an MMS packet would be represented by a sequence of words. This is performed by recursively taking all the information present in the “showname” attribute in an XML tag’s fields (representing an MMS packet). The critical step is the one that comes after, namely, to clean the textual data. The cleaning step is crucial in this process since this step will define the vocabulary of words and affect the training process.
After recursively extracting all values for the “showname” attribute, the goal was to create the smallest vocabulary feasible without omitting critical information. The following strategy has been adopted:
Convert all words to lowercase.
Remove punctuation like , ; : - ..
Split all words containing /, _, or $ into different words.
Remove all numbers separated from words (binaries or digits) as these numbers can blow up our vocabulary.
If filenames are present, remove the filename and keep the extension.
Remove datetimes.
Figure 2 illustrates an example of a packet before and after cleaning. After cleaning up all the packets, a vocabulary could be built. Each XML tag representing a packet could be transformed into a line containing many words. Note that the cleaning of the packets and the vocabulary construction can change according to the problem and the available data.
5.2. Bag of Words Implementation
After cleaning the textual data and saving them, this cleaned data should be represented in an understandable way for a deep learning model. The “Bag of Words” (BoW) approach was proposed for this task. The “bag-of-words” model is a way to represent textual data when modeling text with deep learning. The reason why the BoW implementation was chosen over word embeddings is that the context is extremely domain-specific. This signifies that the corresponding vector cannot be found using pre-trained word embedding models (GloVe, fastText, etc.). Additionally, given the technical nature of the words included within each packet, it was considered that the arrangement of the words had no bearing on the information contained within. In this context, disregarding the order of the words does not result in a loss of meaning. As shown in
Figure 1, the second step after designing the vocabulary is to represent the documents using a document-term matrix. The Term Frequency–Inverse Document Frequency (TF-IDF) has been employed to transform the documents into a count-based mathematical matrix [
37]. For feature extraction, TF-IDF weighting has been frequently employed [
38]. The purpose is to identify words or keywords that frequently appear in a document but do not frequently appear in the complete collection of documents. Each column in the transformed matrix corresponds to a vector representing a word in the vocabulary, and each row corresponds to a vector representing a document (packet). This approach does not take into consideration the position of words in each document (packet).
One disadvantage of using the TF-IDF weighting method is that the vocabulary might grow quite vast. The dimensionality curse is unavoidable given the volume of collected data. This, in turn, will necessitate the use of enormous vectors for document encoding, putting large requirements on memory and slowing down the training process. To address the BoW model’s dimensional issue, the truncated Singular Value Decomposition (SVD) was used [
39]. The reason for selecting the truncated SVD over the standard SVD and Principal Component Analysis (PCA) for dimensionality reduction is that the truncated SVD is more computationally efficient. Due to the sparse nature of the transformed feature vectors derived from the MMS packets, truncated SVD is better for handling such sparse data than PCA or standard SVD. PCA requires computing the covariance matrix, which necessitates acting on the entire matrix, increasing the processing overhead. Similarly, given a
matrix, standard SVD will always yield a matrix with N columns, whereas truncated SVD can give matrices with any number of columns.
Figure 3 illustrates the procedure for generating dimensionality-reduced feature vectors from an example of three MMS documents.
6. MMS Anomaly Detection Model
In contemporary Cyber–Physical Systems (CPSs), most data obtained have the characteristics of high capacity, high complexity, and time series. The majority of data have the issue of lack of labeling or incomplete labeling, which means that the traditional unsupervised method cannot effectively address this issue. This paper aims to address the challenge of detecting abnormal data in unlabeled complex time series data.
6.1. LSTM Autoencoder
A Recurrent Neural Network (RNN) is a deep neural network optimized for time series data processing. It cascades the previous step’s output and the current input. It utilizes the
tanh function to regulate the weights of the two outputs, enabling it to learn features from time series data effectively. However, when confronted with excessively lengthy time series data, ordinary RNNs cannot capture long-term relationships because of the vanishing gradients problem. An LSTM network could be used to learn long-term dependencies [
40]. LSTM enhances the hidden layer unit based on RNN and, by adding storage units, overcomes RNN’s vanishing gradients problem. These storage units, which comprise forget gates, input gates, and output gates, enable filtering of previous states, deciding which states have the most significant impact on the present state rather than merely selecting recent states.
An autoencoder is an unsupervised neural network model composed of two stages: encoding and decoding. By mapping the raw data to a low-dimensional space, the encoder can learn the significant features and patterns in the input data. From the low-dimensional space, the decoder can reconstruct the original input data.
In this paper, we combine an LSTM network and autoencoder to create an encoder and a decoder and both of them use two layers of LSTM. An encoder will extract features from time series data, and a decoder will reconstruct samples from the extracted features. We have multivariate time series data in our problem, where multiple variables are monitored over time. Sequences of MMS packets represented as feature vectors will be used to train an LSTM autoencoder for rare-event classification. For sequence reconstruction, an LSTM autoencoder can be employed. During the training phase, it will learn to reconstruct regular MMS traffic, and if the reconstruction error is large during testing, the input may be classified as a potential attack.
6.2. Bidirectional LSTM
An anomaly that occurs at a particular point in time series data will have a potential correlation with the anomaly that occurred prior to this point and will also have a major effect on the data after this point. As a result, data from both the past and future at abnormal times can be used to detect anomalies. LSTM networks, on the other hand, extract features from input data up to a given point in time. This paper employs a bidirectional LSTM network in the encoder to capture temporal dependencies in both forward and backward directions of the input sequence. This is crucial for intrusion detection, as anomalies that occur at a particular point in time series data may have correlations with events that occurred both before and after this point. Unlike traditional machine learning methods or unidirectional LSTMs, bidirectional LSTMs can consider both past and future data during anomalous occasions.
Bidirectional LSTM networks are composed of two distinct LSTM networks with two independent hidden layers. The two layers are identical inside except for their direction. The first layer of LSTM calculates the forward information at the current time point, and the second layer reads the same sequence in reverse to calculate the reverse information at the current time point. The two hidden layers calculate the state and output of the current time point separately and feed the results to the same output layer. These two hidden layers jointly determine the output of the bidirectional LSTM network at the present point. Because the two networks do not interact during training, they can be employed as a general feed-forward network. Back-propagation is likewise similar to that of LSTM, and the only difference is that it returns to the two hidden layers with different values after propagating to the output layer.
6.3. Model Design
The network structure of the LSTM autoencoder is shown in
Figure 4. The input data to the model are a three-dimensional array. First, we have the number of
samples, namely the number of windows containing MMS packets. The feature vectors are divided by sliding windows. The second dimension is the
lookback. LSTM models are meant to look at the past, which means that at time
t, the LSTM will process data up to (
t-lookback) to make a prediction. Different window sizes have been tested. The following section of this paper considers a window of four packets, meaning that the LSTM will process four packets to detect an anomaly. The third dimension is the
number of features in each feature vector (packet). In this problem, the number of features after applying dimensionality reduction with SVD was 1017.
The encoder begins with a bidirectional LSTM layer, followed by a dropout and another LSTM layer. Establishing direct connections between consecutive LSTM layers’ timestep cells is required. As a result, the first bidirectional LSTM layer causes each cell to produce a signal once per timestep (return sequences = True). For the second LSTM layer, only the last timestep cell emits signals (return sequences = False). The output is, therefore, a vector.
To use the encoded features as an input for the decoder, starting with an LSTM layer, a duplication of the features (RepeatVector) needs to take place to create a array. The decoder is composed of an LSTM layer followed by a dropout and a bidirectional LSTM layer. Gaussian noise has been added after the bidirectional LSTM layer to improve robustness and reduce overfitting. A Time Distributed layer has been added at the end of the decoder to get the output that has the same shape as the input.
The autoencoder will generate errors while decoding the encoded features and reconstructing the samples. Back-propagation is used to train an autoencoder to minimize the reconstruction error. During the training phase, the autoencoder is fed with normal data. By minimizing the mean squared error between the reconstructed and original samples, the autoencoder learns the implicit features and patterns in the normal data. As a result, the reconstruction error of normal samples is rather small during the testing phase. In comparison, the error in reconstructing abnormal samples is relatively large (because the model does not learn the implicit features and patterns of abnormal samples). As a result, this paper uses the reconstruction error as the sample’s anomaly score.
6.4. Model Selection and Hyperparameter Optimization
To determine the optimal hyperparameters for the autoencoder, we leveraged Optuna, an efficient hyperparameter optimization framework that utilizes a tree-structured Parzen estimator (TPE) to search for the best configuration. The following hyperparameters were optimized:
Number of LSTM units in the encoder and decoder layers.
Dropout rate for regularization.
Learning rate for the Adam optimizer.
Batch size for training.
The search process was conducted over a predefined range of values, with Optuna automatically selecting and evaluating configurations to minimize the validation loss. By iterating through multiple trials, the framework efficiently converged to an optimal set of hyperparameters that resulted in improved reconstruction accuracy while preventing overfitting.
The final model architecture, selected based on the best-performing trial, consists of an encoder with a bidirectional LSTM layer followed by another LSTM layer, a bottleneck representation achieved via a
RepeatVector, and a symmetric decoder structure with LSTM layers, dropout, and a final
TimeDistributed layer. The number of neurons for each layer, as illustrated in
Figure 4, has been chosen based on trial and error. Specifically, the search space for the number of LSTM units was initially defined within a reasonable range and iteratively refined through multiple runs of Optuna-based hyperparameter tuning. Throughout the optimization process, the search range was adjusted several times based on observed validation performance, effectively combining systematic search with empirical adjustments to achieve an optimal architecture. In our implementation, we adopted the SELU activation function [
41] for the hidden layers and the
tanh for the final layer, given that the features are scaled in the range
and 1. Note that the hyperparameters could be adapted and tuned for different problems.
7. Experimental Results
7.1. Dataset
The testing set is unbalanced; it has 92,014 normal windows and 119 anomalous moments. Notably, each window is in size, with M denoting the window width (number of packets) and N being the number of features. Our experiments included a variety of different input size combinations. In the following, we will continue using a window of four packets and 1017 features, as this combination produced the best outcome. The window’s width should ensure that the window covers the duration of anomalous events. In this context, four packets were enough to ensure that the entire abnormal event could be contained within the window width of the abnormal sample.
7.2. Evaluation Indicators
Since the recognition rate and misjudgment rate of abnormal events are the focus of anomaly detection, this paper uses the following indicators to judge the pros and cons of the model.
Recognition rate of attack sequences:
The percentage of real attack sequences in a set of sequences predicted as an attack:
Misjudgment rate of attack sequences:
True positive () refers to the accurate identification of an attack sequence. False positive () refers to the classification of a normal sequence as an attack sequence. True negative () indicates that a normal sequence has been correctly classified, whereas false negative () indicates that an attack sequence has been incorrectly classified as a normal sequence. The receiver operating characteristic (ROC) curve and the area under the curve (AUC) value are frequently used to evaluate the quality of a binary classifier in the binary classification issue. The ROC curve takes the False Positive Rate as the horizontal axis and the True Positive Rate as the vertical axis and forms a continuous curve with the movement of the threshold. The AUC value represents the area under the ROC curve between 0 and 1. The AUC value can be used to intuitively evaluate the model’s quality, with a bigger value indicating a better model.
7.3. Classification Threshold Selection
As previously stated, the following argument drives the use of an LSTM autoencoder for unsupervised rare-event detection: The model will be trained on a sufficient amount of normal data that represent the normal traffic in a given environment. Because we presume that the model learned the pattern of normal traffic windows and was trained on similar traffic, the model will be able to reconstruct an unseen normal traffic window with a minimal reconstruction error. Given that anomalous windows are unusual events that the model does not see during training, the decoder’s reconstruction error will be large, signaling that the window is not regular and could be a possible attack. The purpose is to define this threshold, over which we can identify a sequence as an attack if the model reconstructs a window with an error greater than this threshold.
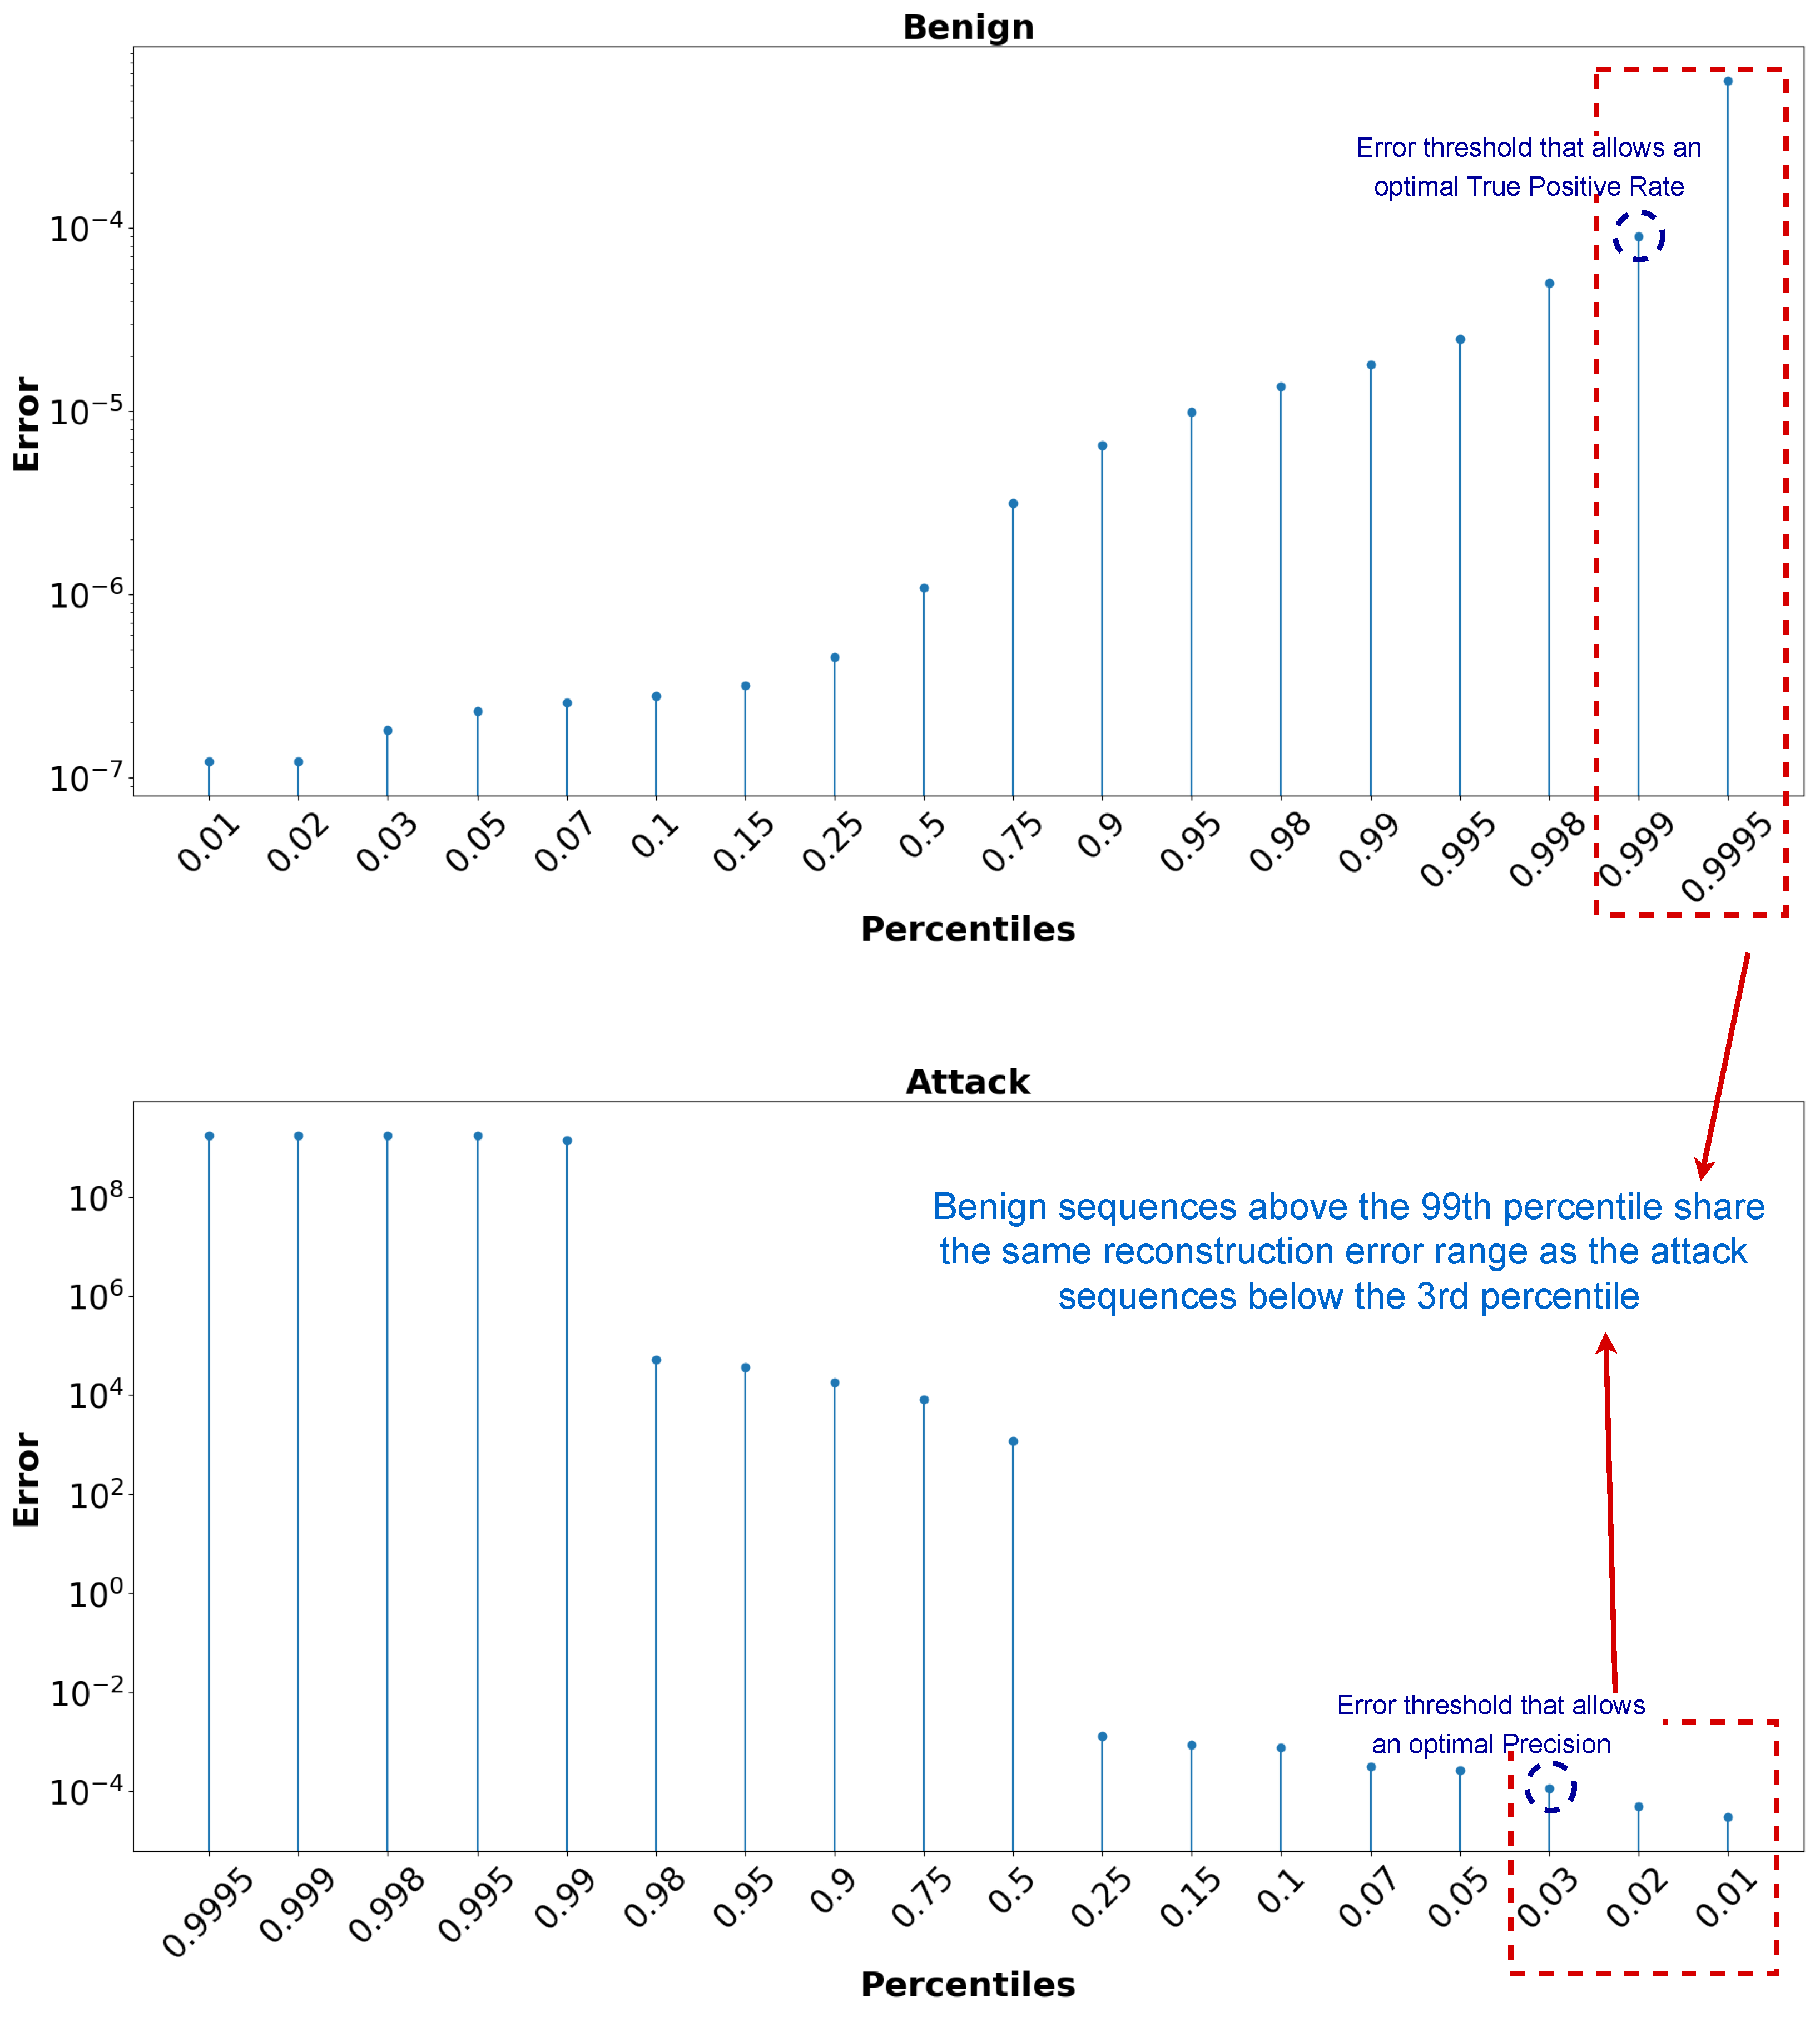
Figure 5 illustrates how the reconstruction error for normal (benign) and attack sequences varies for different percentiles. It can be seen that approximately 99% of the normal windows are reconstructed with an error smaller than
and 97% of the attack windows are reconstructed with an error larger than
. Ideally, there will be no crossing between the error ranges of the normal and attack data, allowing for the easy definition of a threshold separating the two ranges. In this problem, it can be noticed from
Figure 5 that there is a small common reconstruction error range between the normal and attack data. Consider
the shared reconstruction error range and
the threshold to be selected and belonging to this range:
. Setting
as
(the smallest value of the shared error range) will give the optimal True Positive Rate (Recall) because the reconstruction error of all the attack sequences will be greater than
, and thus classified as an attack. On the other hand, setting
as
will give the optimal precision because the reconstruction error of normal sequences will not exceed
, thus avoiding false positive outcomes. The objective is to select a classification threshold that provides a reasonable trade-off between precision and recall while favoring recall (True Positive Rate) for this type of problem.
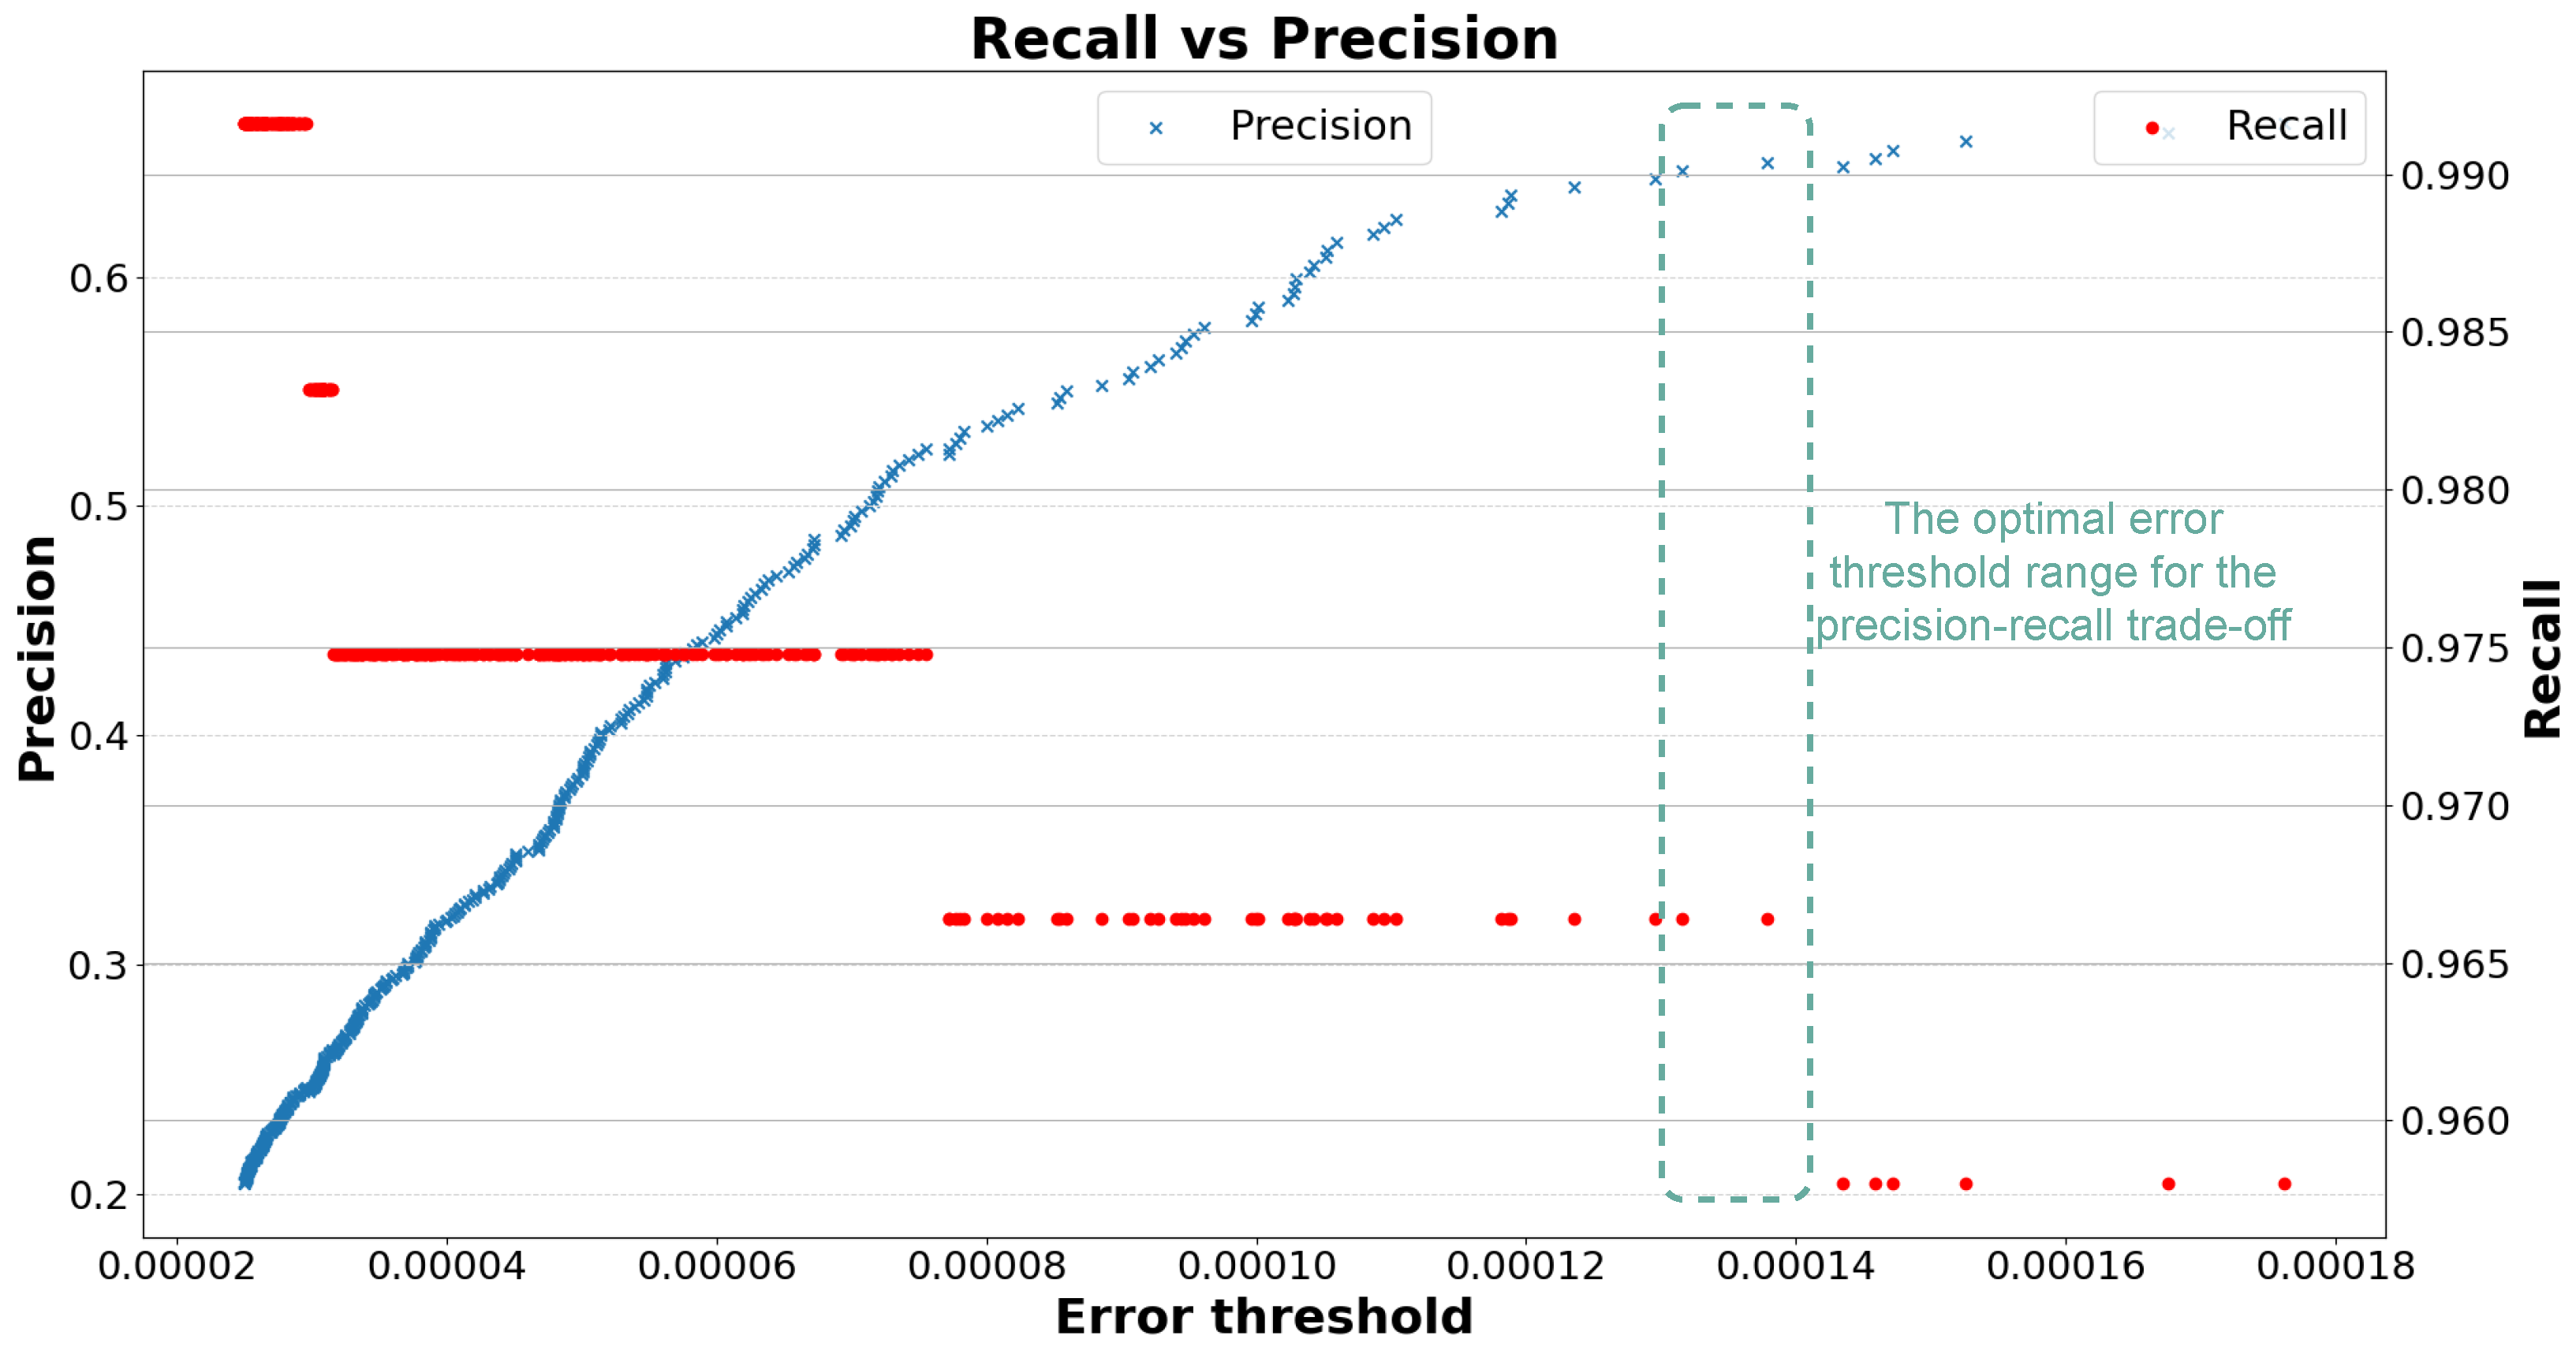
Figure 6 shows the precision and recall for different threshold values. It can be seen that a threshold between
and
gives a recall above 96% and a precision of approximately 65%. Bear in mind that a precision of 65% is not considered to be very good. However, given the very unbalanced data in this work and the goal of having the highest False Positive Rate possible, a precision of 65% is the best we could achieve without reducing recall below 96%. In the following, we consider a threshold of
.
7.4. Evaluation Results
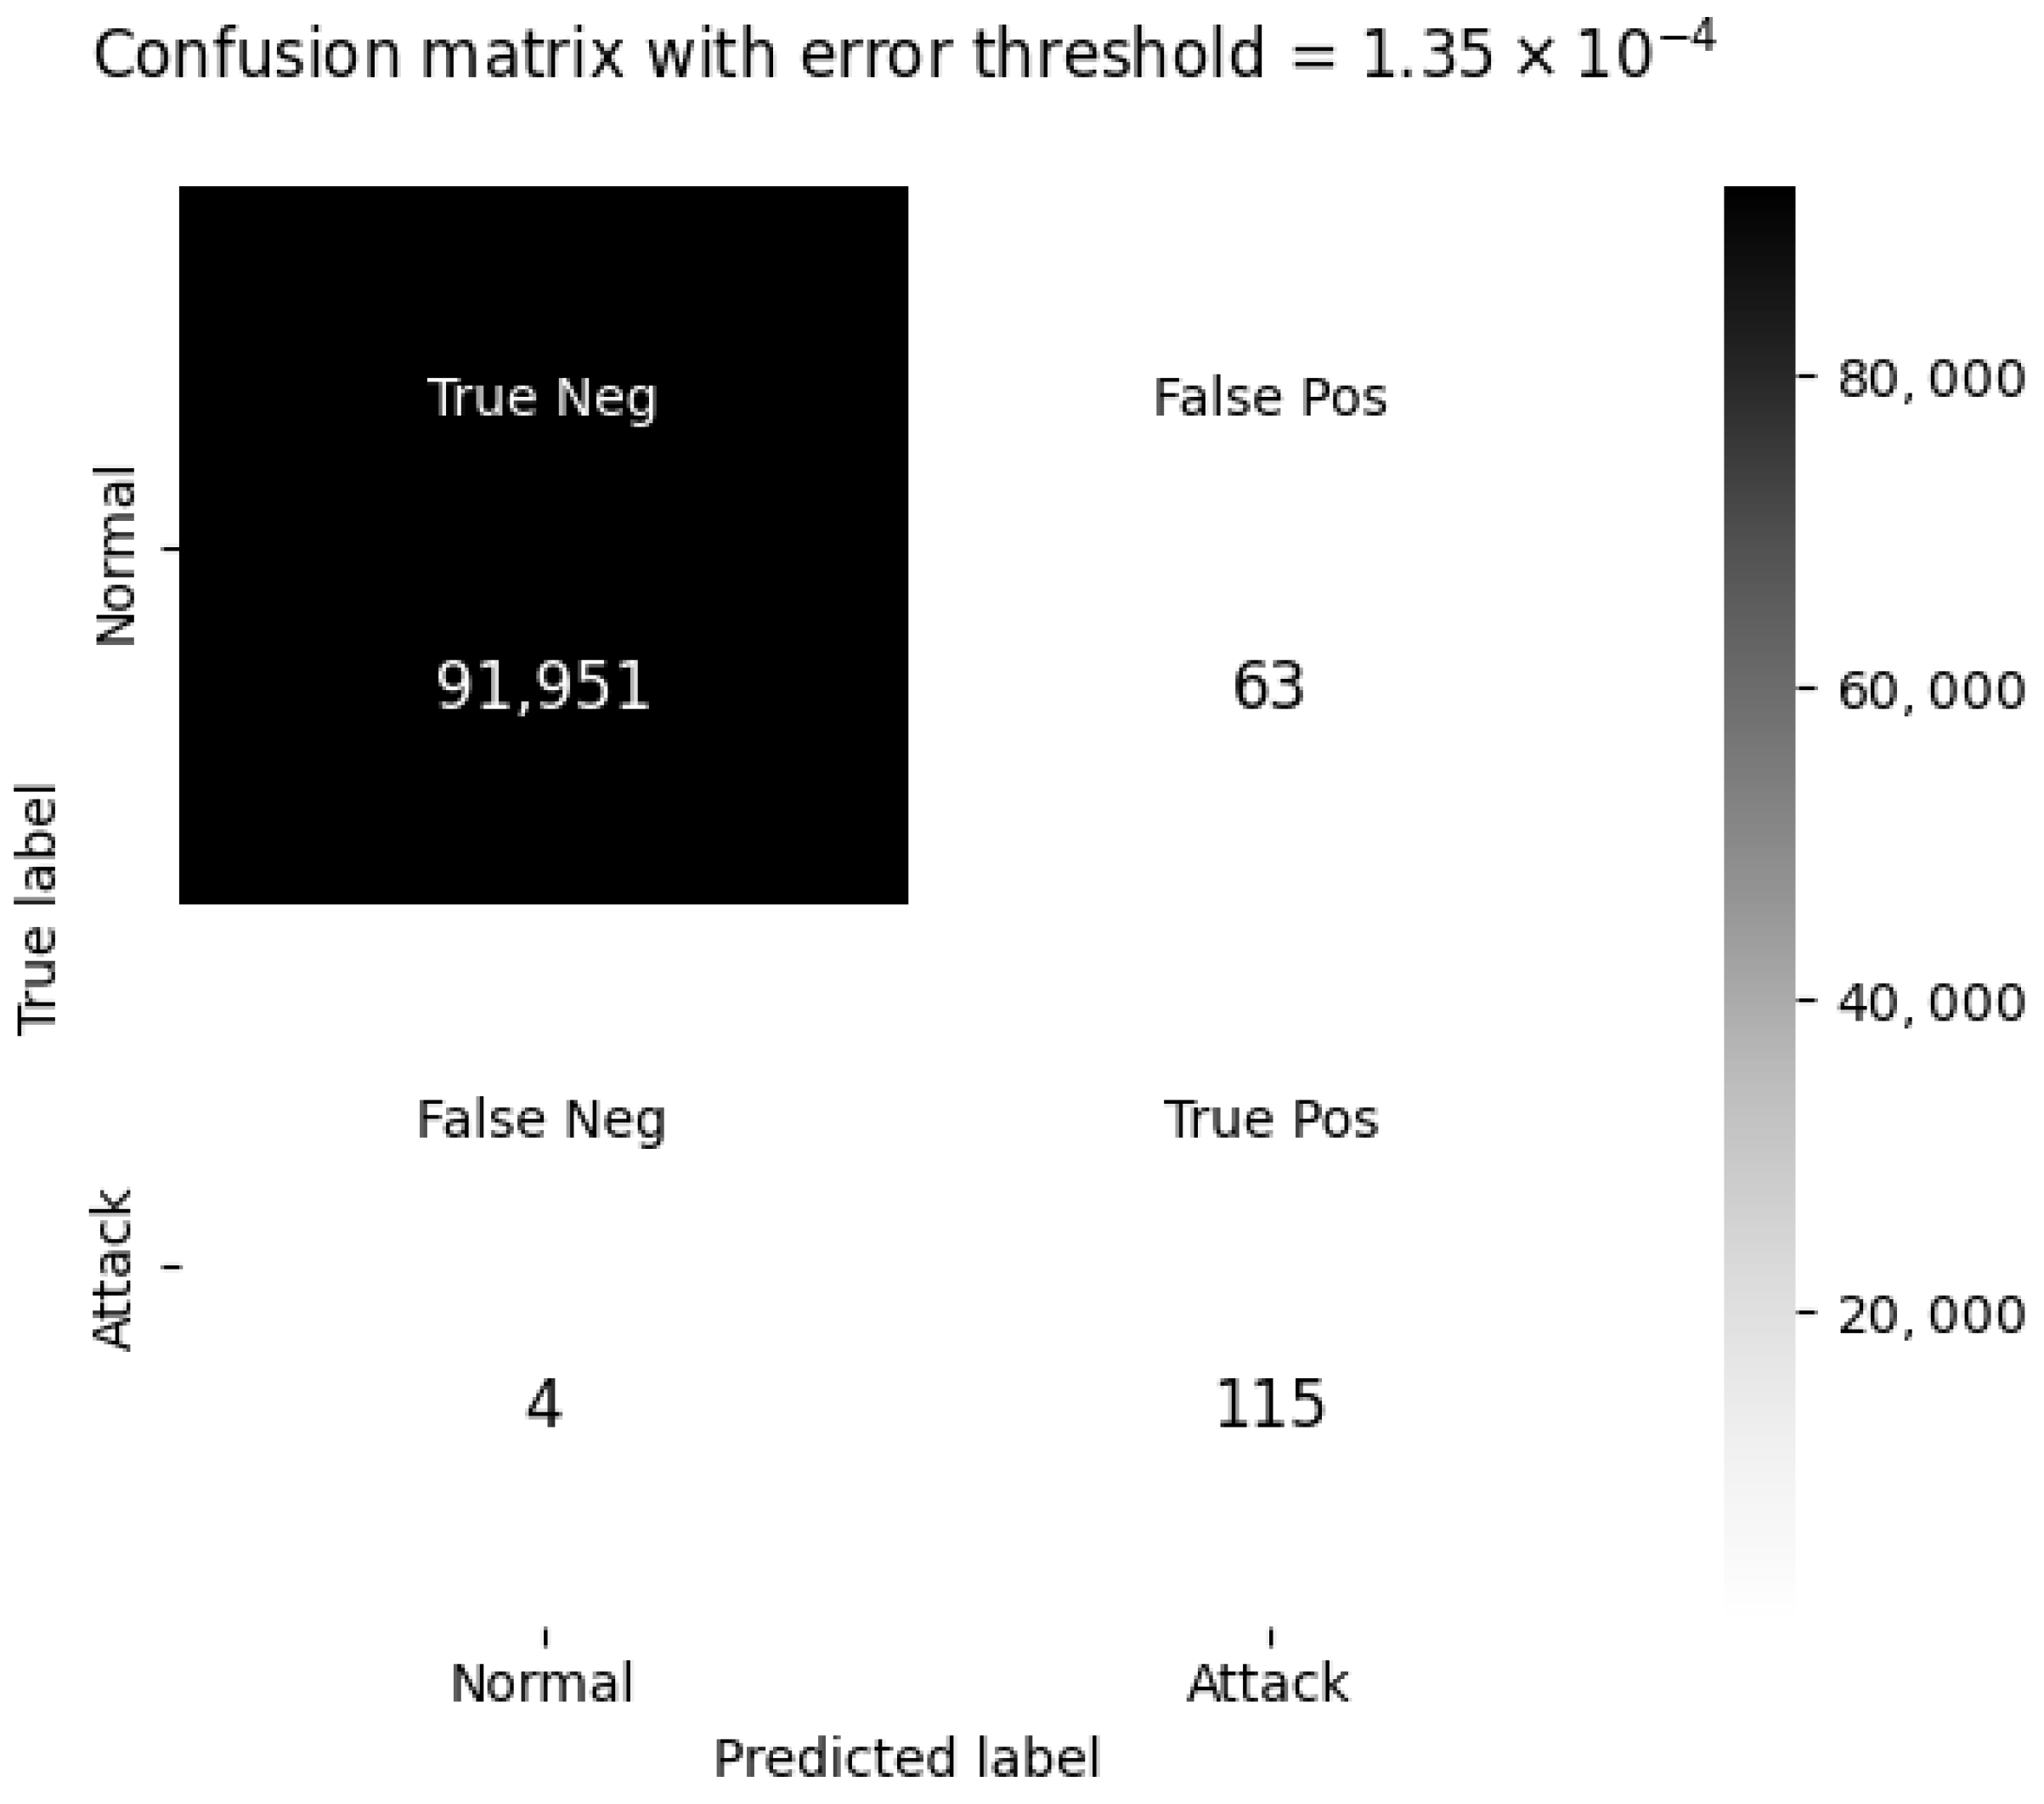
The receiver operating characteristic (ROC) curve and the confusion matrix are used to evaluate the performance of the trained model with the selected threshold. The obtained area under the curve (AUC) value in
Figure 7 indicates that the model is highly capable of distinguishing between normal and attack sequences at the selected threshold. Among the 119 attack sequences, the model erroneously classified 4 sequences as normal. Contrary to the precision metric, the False Positive Rate obtained is very low. Among the 92,014 normal windows, only 63 (less than 1%) were erroneously classified as an attack, as shown in the confusion matrix (
Figure 8). Below are the classification metrics derived from the confusion matrix:
In this highly imbalanced setting, where normal sequences vastly outnumber attack sequences, precision is not the most reliable metric to evaluate the model. Precision is highly affected by the number of false positives (FPs), which are inevitable when the majority class (normal sequences) is significantly larger. Even a small fraction of false positives can make precision appear low, despite the model being effective in distinguishing between classes.
Instead, the True Positive Rate (TPR, or recall) and True Negative Rate (TNR) provide a fairer assessment, as they measure how well the model captures actual attacks and avoids misclassifying normal sequences. The Balanced Accuracy metric accounts for both classes equally, making it a more suitable measure in cases of extreme class imbalance.
Additionally, the F2-score, which prioritizes recall over precision, is more relevant for intrusion detection. In security-critical applications, it is preferable to flag more potential threats (even at the cost of some false positives) than to miss actual attacks. The model’s high recall (96.63%) and strong TNR (99.89%) indicate that it effectively captures anomalies while keeping false alarms to a minimum.
7.5. Comparison with the Doc2Vec Approach
To further evaluate the effectiveness of our proposed approach (TF-IDF + SVD + BiLSTM AE), we compare it with an alternative Doc2Vec + BiLSTM AE setup. While both approaches use BiLSTM AE for sequence learning, they differ in how the data are prepared and represented. Our approach leverages TF-IDF combined with truncated SVD for dimensionality reduction, whereas the alternative relies on Doc2Vec embeddings.
The results clearly show that the TF-IDF + SVD + BiLSTM approach outperforms Doc2Vec + BiLSTM across all key metrics (
Table 1):
Higher Recall (TPR): The proposed approach correctly detects 96.63% of attacks, compared to 83.19% with Doc2Vec.
Lower False Positive Rate (FPR): The proposed method has an FPR of only 0.07%, while Doc2Vec has a much higher FPR of 4.97%, leading to many false alarms.
Higher Balanced Accuracy: Our approach achieves 98.26% Balanced Accuracy, demonstrating robust classification for both normal and attack sequences.
The data being processed consist of MMS (Manufacturing Message Specification) network packets captured using Wireshark. These packets contain structured, highly technical keywords that describe various network protocol commands and responses. Unlike natural language data, where the meaning of a word is influenced by its context, in this case, what matters is simply the presence of specific keywords rather than their semantic relationships.
Doc2Vec and other word embedding methods are designed to capture semantic meaning and contextual similarity, making them well suited for natural language processing tasks. However, in industrial network traffic analysis, the following challenges make embeddings less effective:
Lack of Semantic Relationships: The keywords in MMS packets do not carry contextual meaning. Words like “invokeid” or “confirmedresponsepdu” do not form meaningful phrases—they act as standalone identifiers. Embeddings assume that words have meaningful relationships, which does not apply in this case.
Keyword Presence Matters More Than Context: In MMS packets, the order of keywords is far less important than their presence. A packet containing “errorpdu” is critical to flag, regardless of its position in the sequence. TF-IDF naturally emphasizes such occurrences, whereas embeddings attempt to infer meaning from order and context, leading to potential loss of important indicators.
Better Feature Interpretability: With TF-IDF and SVD, we can directly interpret the most influential terms contributing to classification, making debugging and refining the model easier. Doc2Vec produces dense vectors that obscure which words are influencing the decision.
Sparse Representation is Beneficial in This Case: Since the MMS vocabulary is technical and limited, TF-IDF efficiently transforms the data into a high-dimensional sparse representation where rare but critical terms (such as attack indicators) retain their importance. In contrast, embeddings distribute word meanings over a continuous space, which can dilute the impact of rare but crucial terms.
Overall, these characteristics make TF-IDF a more suitable choice for analyzing MMS network packets, where detecting anomalies relies on the presence of specific words rather than understanding linguistic structure.
7.6. Comparative Analysis
To further evaluate our proposed approach (BiLSTM Autoencoder), we conducted additional experiments using a different test set. This dataset, smaller in size (386 normal packets and 162 attack packets), allows us to compare our approach with classical machine learning models.
Traditional machine learning models face inherent limitations when applied to high-dimensional, large-scale datasets, especially in the context of novelty detection. Many classical approaches, such as One-Class SVM and Isolation Forest, suffer from computational inefficiency when handling a large number of features and data points, leading to longer training times, increased memory usage, and reduced scalability. To address these constraints, we conducted this comparison using a smaller subset of the original dataset. This allows for a fair assessment of the effectiveness of these models in anomaly detection without being hindered by computational bottlenecks.
Since traditional machine learning models do not inherently process sequential data, they do not capture temporal dependencies. To address this, we reformatted the input data into a two-dimensional feature space, where each instance was flattened to represent both the timesteps and feature dimensions in a single vector. This transformation enabled classical machine learning models to operate on the data without explicit sequence modeling.
7.6.1. Performance Comparison Across Models
To compare the BiLSTM Autoencoder with traditional machine learning approaches, we evaluated key performance metrics, including precision, recall, and F1-score (to facilitate reproducibility, we provide a GitHub repository containing examples of data preparation, inference, and training using a small testing set. The code and dataset are available at
https://github.com/josephazar/Text-Mining-IDS, accessed on 12 March 2025).
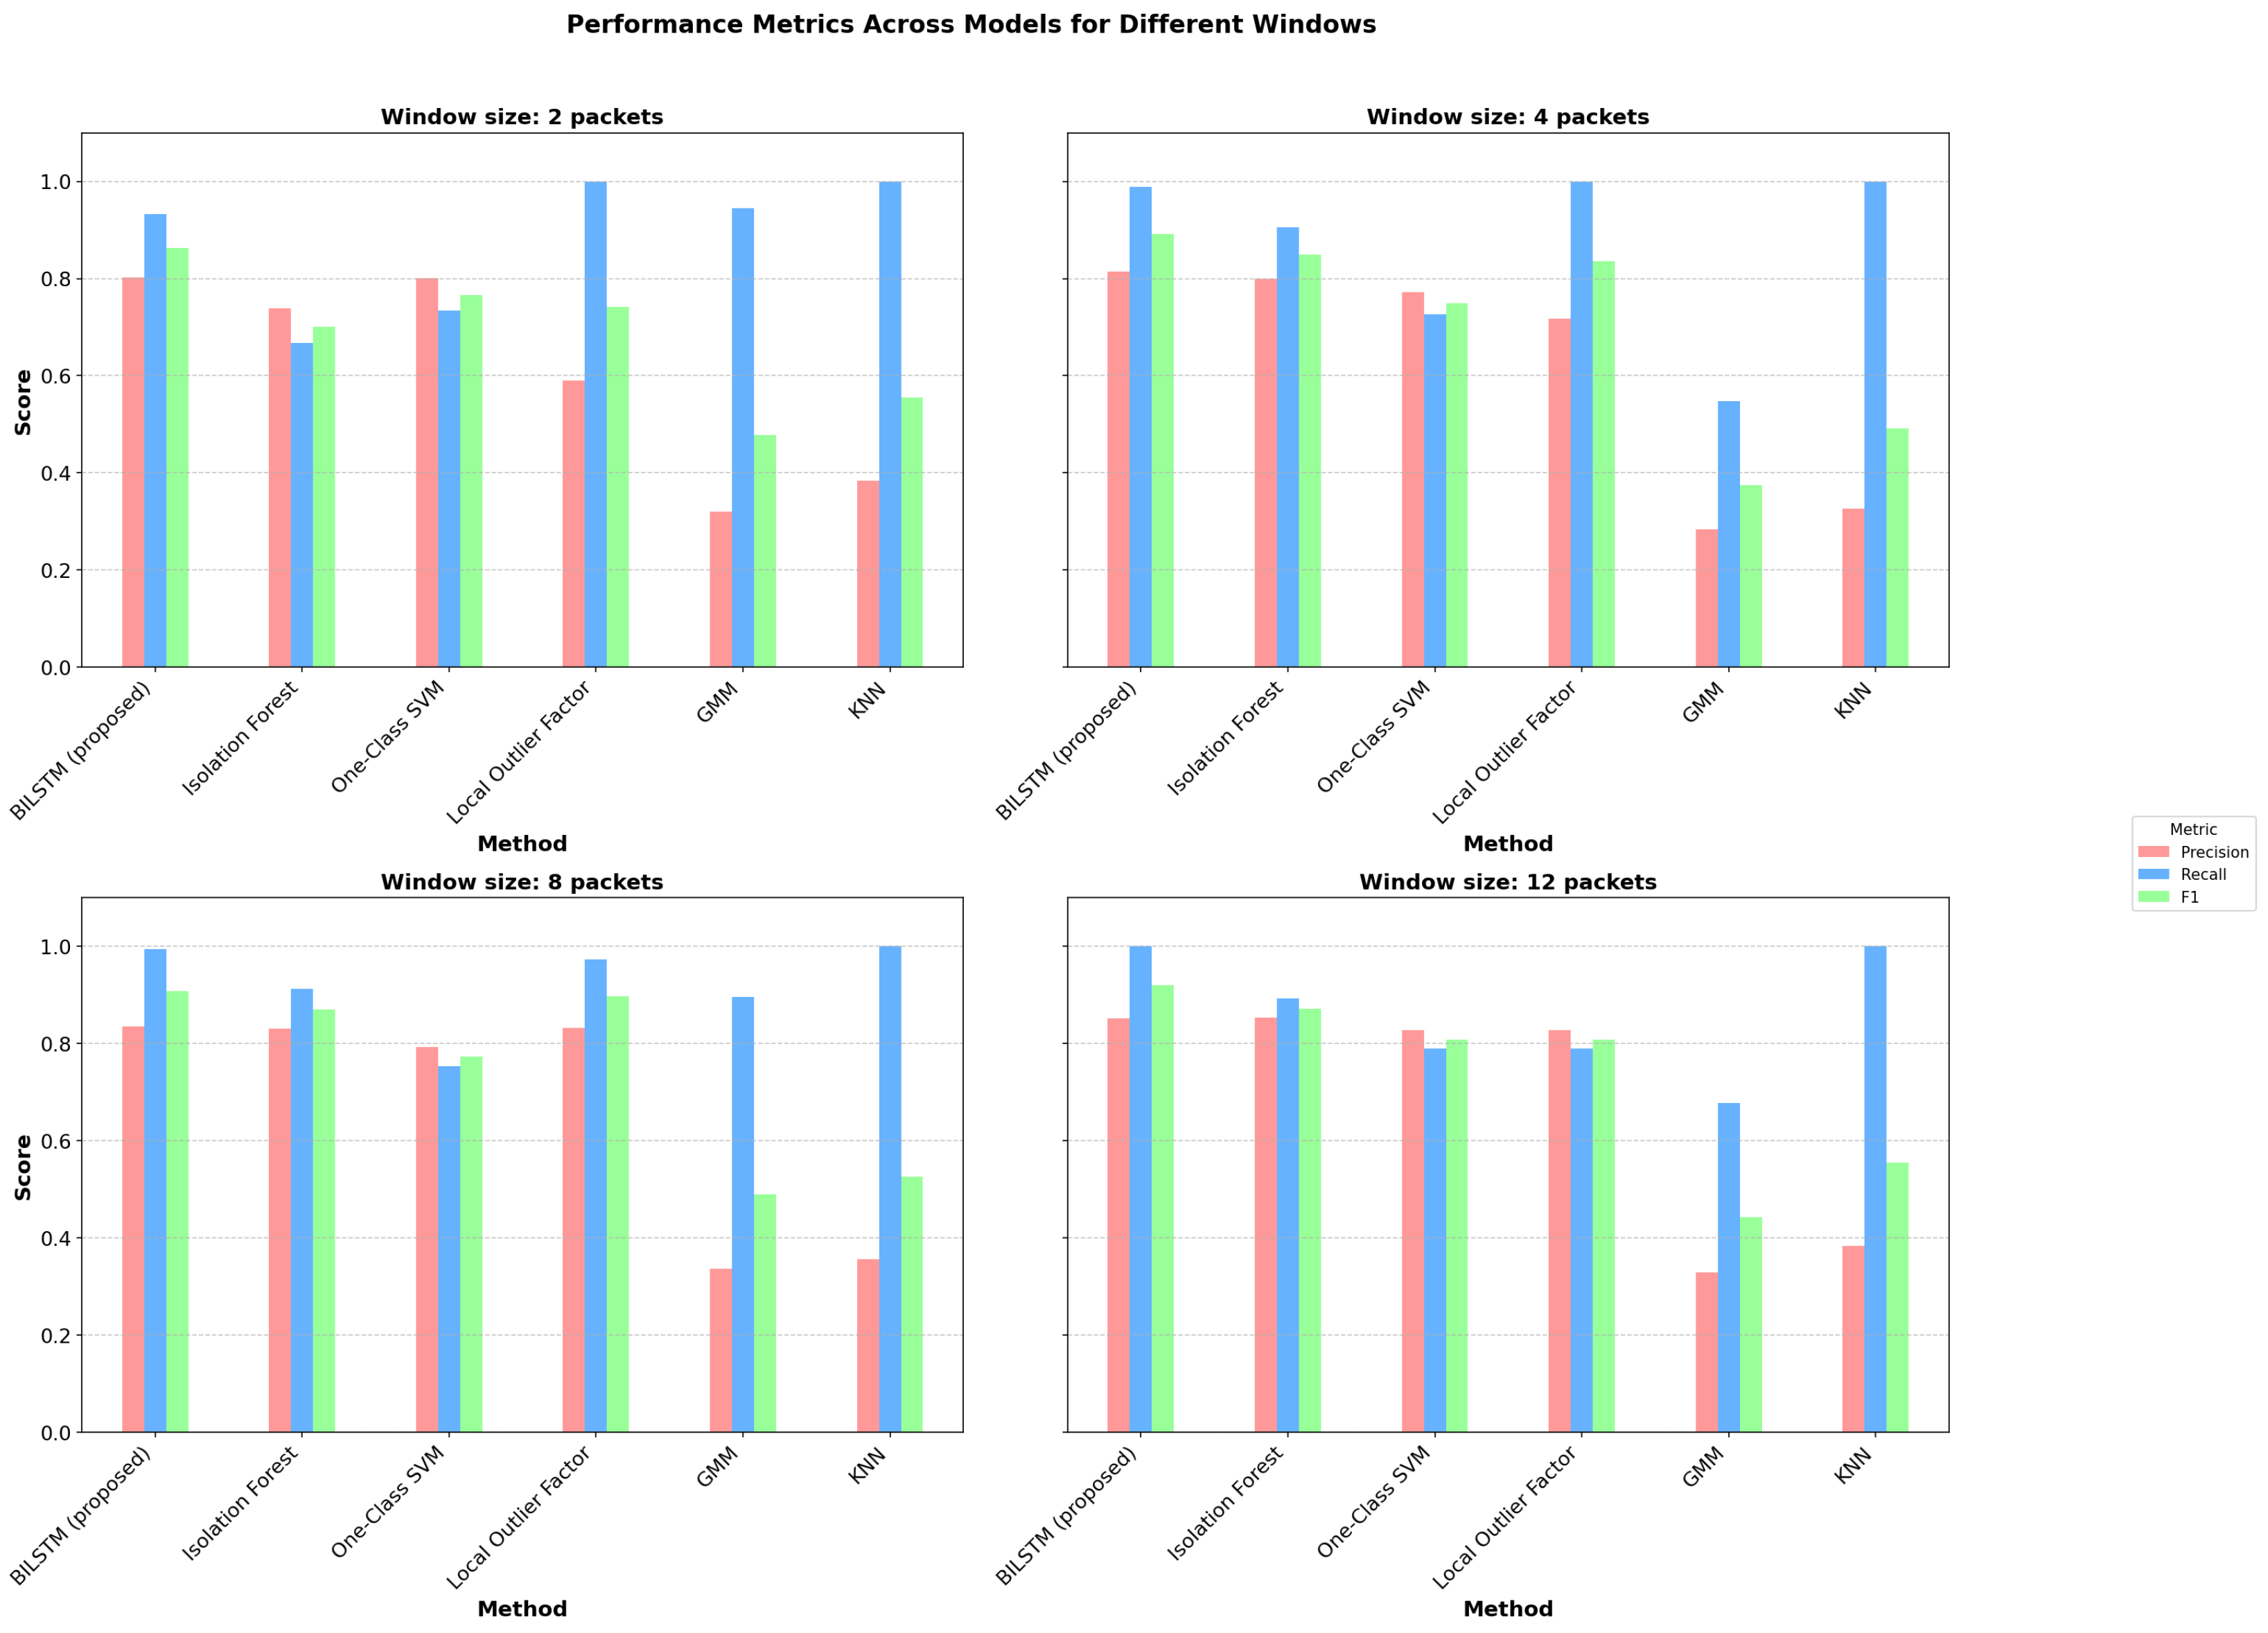
Figure 9 visualizes the performance of different models across various window sizes, while
Table 2 presents the detailed numerical results.
The results presented in
Table 2 and
Figure 9 highlight several key observations:
The BiLSTM Autoencoder achieves the highest recall (0.979) among unsupervised approaches, meaning it correctly detects almost all attack packets.
Precision is slightly lower for BiLSTM than for some classical ML models, indicating a small number of false positives. However, in security applications, high recall is prioritized over precision to minimize undetected threats.
The Local Outlier Factor (LOF) also achieves a high recall (0.941), but with lower overall Balanced Accuracy.
The Gaussian Mixture Model (GMM) and KNN perform poorly, suggesting that density-based approaches struggle with the high dimensionality of network traffic data.
For reference, we included a supervised baseline model using BERT, trained on labeled data. As expected, the BERT-based model achieved the highest performance, with an F1-score of 0.95. However, in real-world scenarios, labeled attack data are scarce, making fully supervised methods impractical for intrusion detection.
7.6.2. Effect of Window Size on Performance
Our experiments explored different window sizes (number of packets) to analyze how they impact performance. As illustrated in
Figure 9, increasing the window size slightly improves detection performance across models. This effect occurs because larger windows capture a more complete representation of abnormal events, reducing uncertainty.
BiLSTM consistently outperforms classical ML models across all window sizes.
Increasing the window size slightly boosts recall and F1-score, indicating that a broader temporal context helps detect anomalies.
A window size of 4 packets provides an optimal trade-off, ensuring that anomalies are captured while keeping computational costs reasonable.
8. Discussion
The approach presented in this paper utilizes a combination of text mining techniques and deep learning for unsupervised anomaly detection in smart-grid communication networks. The core of the AI model is a bidirectional LSTM autoencoder. This architecture was chosen for its ability to handle high-dimensional time series data and capture temporal relationships in multivariate time series. The LSTM-based approach offers several advantages, including the ability to learn long-term dependencies in the data. By combining LSTM networks with autoencoders, the model can effectively process high-volume, high-dimensional, unlabeled, and time-related unbalanced data.
Unlike most studies in the state of the art, which model network traffic as structured, tabular data (often in CSV format), this approach treats MMS packets as unstructured text data. This fundamental difference in data representation requires a unique methodology and makes direct comparisons with existing methods challenging. Unlike the majority of work in the literature on anomaly-based intrusion detection, we formulated the problem as a natural language processing (NLP) task. By treating each MMS packet as a “document” and applying text mining techniques such as TF-IDF vectorization and truncated SVD, our approach can effectively handle the variable nature of MMS packet content. This is particularly advantageous because MMS packets can contain different information depending on their status, making traditional structured data approaches less effective.
However, it is important to acknowledge that the field of AI is rapidly evolving, with more advanced techniques emerging since the development of this approach. We recognize this and outline our plans for future work, which include leveraging recent advancements in transformers and generative AI for intrusion detection. For instance, transformers have demonstrated exceptional performance in various sequence-based tasks. Adapting transformer architectures for anomaly detection in network traffic could enhance the model’s ability to capture complex patterns and dependencies. Additionally, generative AI presents an opportunity to generate synthetic normal and anomalous traffic patterns, addressing the challenge of imbalanced datasets and improving the model’s ability to detect rare attack sequences.
Among the areas that can be tackled in future work, we highlight the following:
Exploring synthetic data generation techniques to increase the number of anomalous samples while preserving their key characteristics.
Implementing cost-sensitive learning approaches that assign higher weights to the minority class during training and evaluation, ensuring better detection of rare attacks.
Investigating alternative dimensionality reduction techniques, such as t-SNE and UMAP, to explore whether they can better capture the structure of MMS packet data. While t-SNE is known to be computationally expensive for large datasets, its application may be feasible given the limited vocabulary in MMS traffic. Similarly, UMAP could offer improved feature separation with lower computational costs.
Evaluating SVD-BERT as a potential enhancement to the existing text-mining pipeline, as it combines the strengths of dimensionality reduction with transformer-based embeddings, potentially improving feature representation for anomaly detection.
These enhancements aim to improve the robustness and generalizability of intrusion detection models, making them more effective in real-world applications.
9. Conclusions
This paper proposed an unsupervised anomaly detection approach based on text mining and deep learning to address the need for autonomous intrusion detection in smart-grid communication networks. Numerous attack scenarios against industrial control systems are possible. The Manufacturing Message Specification (MMS) traffic was the focus of this paper. This paper initially presents a technique for preparing and extracting features from raw MMS packets using a TF-IDF vectorizer and a truncated SVD. Rather than manually picking features from each MMS packet, this paper treats each packet as a document and represents it using the Bag of Words (BoW) text pre-processing approach. Unlike embeddings, which aim to capture semantic relationships, this approach was more effective for MMS traffic since anomaly detection relies on the presence of specific protocol-related keywords rather than contextual meaning. Then, it proposes a bidirectional LSTM autoencoder for unsupervised “sequence-aware” detection. This research implies that unsupervised deep learning approaches could be used in place of supervised methods for intrusion detection when labeling is either impractical or time-consuming. After training on normal traffic, the proposed model produced acceptable false positive and false negative rates when applied to unseen traffic with injected attack sequences. The weakness of this approach, and unsupervised methods in general, is the medium to high rate of false alarms (false positives) when the training data are incomplete. This demonstrates that techniques based on artificial intelligence may be beneficial and supportive in industrial control systems but are not yet the primary intrusion detection actor.
Author Contributions
Conceptualization, J.A.; Methodology, J.A. and M.A.S.; Software, J.A.; Validation, R.C. and H.N.; Formal analysis, M.A.S.; Investigation, R.C.; Writing—original draft, J.A. and M.A.S.; Writing—review & editing, H.N.; Visualization, M.A.S.; Supervision, R.C. All authors have read and agreed to the published version of the manuscript.
Funding
This research received no external funding.
Data Availability Statement
The data presented in this study are available on request from the corresponding author due to privacy restriction. A sample of the code used is available at
https://github.com/josephazar/Text-Mining-IDS (accessed on 12 March 2025).
Acknowledgments
This work has been supported by the EIPHI Graduate School (contract “ANR-17-EURE-0002”). During the preparation of this manuscript, the authors used ChatGPT for the purposes of reformulating and correcting grammatical errors. The authors have reviewed and edited the output and take full responsibility for the content of this publication.
Conflicts of Interest
The authors declare no conflicts of interest.
References
- Otuoze, A.O.; Mustafa, M.W.; Larik, R.M. Smart grids security challenges: Classification by sources of threats. J. Electr. Syst. Inf. Technol. 2018, 5, 468–483. [Google Scholar] [CrossRef]
- Desarnaud, G. Cyber Attacks and Energy Infrastructures: Anticipating Risks. French Institute of International Relations (IFRI). 2017. Available online: https://www.ifri.org/sites/default/files/migrated_files/documents/atoms/files/desarnaud_cyber_attacks_energy_infrastructures_2017_2.pdf (accessed on 12 March 2025).
- European Power Grid Organization Hit by Cyberattack. Available online: https://www.welivesecurity.com/2020/03/12/european-power-grid-organization-entsoe-cyberattack/ (accessed on 16 March 2022).
- U.S. Escalates Online Attacks on Russia’s Power Grid. Available online: https://www.nytimes.com/2019/06/15/us/politics/trump-cyber-russia-grid.html (accessed on 16 March 2022).
- Cyberattack Targets Safety System at Saudi Aramco. Available online: https://foreignpolicy.com/2017/12/21/cyber-attack-targets-safety-system-at-saudi-aramco/ (accessed on 16 March 2022).
- Lee, R.M.; Assante, M.J.; Conway, T. Analysis of the Cyber Attack on the Ukrainian Power Grid; Electricity Information Sharing and Analysis Center (E-ISAC): Washington, DC, USA, 2016; pp. 1–29. [Google Scholar]
- Lee, K.-b.; Lim, J.-i. The Reality and Response of Cyber Threats to Critical Infrastructure: A Case Study of the Cyber-terror Attack on the Korea Hydro & Nuclear Power Co., Ltd. KSII Trans. Internet Inf. Syst. (TIIS) 2016, 10, 857–880. [Google Scholar]
- Ali, A.H.; Charfeddine, M.; Ammar, B.; Hamed, B.B.; Albalwy, F.; Alqarafi, A.; Hussain, A. Unveiling machine learning strategies and considerations in intrusion detection systems: A comprehensive survey. Front. Comput. Sci. 2024, 6, 1387354. [Google Scholar] [CrossRef]
- Hajj, S.; Azar, J.; Bou Abdo, J.; Demerjian, J.; Guyeux, C.; Makhoul, A.; Ginhac, D. Cross-layer federated learning for lightweight iot intrusion detection systems. Sensors 2023, 23, 7038. [Google Scholar] [CrossRef] [PubMed]
- Zhu, R.; Liu, C.C.; Hong, J.; Wang, J. Intrusion detection against MMS-based measurement attacks at digital substations. IEEE Access 2020, 9, 1240–1249. [Google Scholar] [CrossRef]
- Lotfollahi, M.; Jafari Siavoshani, M.; Shirali Hossein Zade, R.; Saberian, M. Deep packet: A novel approach for encrypted traffic classification using deep learning. Soft Comput. 2020, 24, 1999–2012. [Google Scholar] [CrossRef]
- Draper-Gil, G.; Lashkari, A.H.; Mamun, M.S.I.; Ghorbani, A.A. Characterization of encrypted and vpn traffic using time-related. In Proceedings of the 2nd International Conference on Information Systems Security and Privacy (ICISSP), Rome, Italy, 19–21 February 2016; pp. 407–414. [Google Scholar]
- Elhanashi, A.; Gasmi, K.; Begni, A.; Dini, P.; Zheng, Q.; Saponara, S. Machine Learning Techniques for Anomaly-Based Detection System on CSE-CIC-IDS2018 Dataset. In Lecture Notes in Electrical Engineering; Springer Nature: Cham, Switzerland, 2023; pp. 131–140. [Google Scholar] [CrossRef]
- Yang, Z.; Liu, X.; Li, T.; Wu, D.; Wang, J.; Zhao, Y.; Han, H. A systematic literature review of methods and datasets for anomaly-based network intrusion detection. Comput. Secur. 2022, 116, 102675. [Google Scholar] [CrossRef]
- Zavrak, S.; Iskefiyeli, M. Anomaly-Based Intrusion Detection From Network Flow Features Using Variational Autoencoder. IEEE Access 2020, 8, 108346–108358. [Google Scholar] [CrossRef]
- Leevy, J.L.; Khoshgoftaar, T.M. A survey and analysis of intrusion detection models based on CSE-CIC-IDS2018 Big Data. J. Big Data 2020, 7, 104. [Google Scholar] [CrossRef]
- Chakraborty, S. Real-Time Intrusion Detection based on Network Monitoring and Machine Learning. Int. J. Comput. Appl. 2023, 185, 1–8. [Google Scholar] [CrossRef]
- Lunardi, W.T.; Lopez, M.A.; Giacalone, J.P. ARCADE: Adversarially Regularized Convolutional Autoencoder for Network Anomaly Detection. IEEE Trans. Netw. Serv. Manag. 2023, 20, 1305–1318. [Google Scholar] [CrossRef]
- Thwaini, M.H. Anomaly Detection in Network Traffic using Machine Learning for Early Threat Detection. Data Metadata 2022, 1, 34. [Google Scholar] [CrossRef]
- Zhang, Z.; Liu, L.; Lu, X.; Yan, Z.; Li, H. Encrypted Network Traffic Classification: A data driven approach. In Proceedings of the 2020 IEEE Intl Conf on Parallel & Distributed Processing with Applications, Big Data & Cloud Computing, Sustainable Computing & Communications, Social Computing & Networking (ISPA/BDCloud/SocialCom/SustainCom), Exeter, UK, 17–19 December 2020; IEEE: Piscataway, NJ, USA, 2020; pp. 706–712. [Google Scholar]
- Bayat, N.; Jackson, W.; Liu, D. Deep Learning for Network Traffic Classification. arXiv 2021, arXiv:2106.12693. [Google Scholar]
- Pinto, A.; Herrera, L.C.; Donoso, Y.; Gutierrez, J.A. Survey on intrusion detection systems based on machine learning techniques for the protection of critical infrastructure. Sensors 2023, 23, 2415. [Google Scholar] [CrossRef]
- Sahani, N.; Zhu, R.; Cho, J.H.; Liu, C.C. Machine learning-based intrusion detection for smart grid computing: A survey. ACM Trans. Cyber-Phys. Syst. 2023, 7, 11. [Google Scholar] [CrossRef]
- Abu Alfeilat, H.A.; Hassanat, A.B.; Lasassmeh, O.; Tarawneh, A.S.; Alhasanat, M.B.; Eyal Salman, H.S.; Prasath, V.S. Effects of distance measure choice on k-nearest neighbor classifier performance: A review. Big Data 2019, 7, 221–248. [Google Scholar] [CrossRef]
- Breunig, M.M.; Kriegel, H.P.; Ng, R.T.; Sander, J. LOF: Identifying density-based local outliers. In Proceedings of the 2000 ACM SIGMOD International Conference on Management of Data, Dallas, TX, USA, 15–18 May 2000; pp. 93–104. [Google Scholar]
- Tang, J.; Chen, Z.; Fu, A.W.C.; Cheung, D.W. Enhancing effectiveness of outlier detections for low density patterns. In Proceedings of the Pacific-Asia Conference on Knowledge Discovery and Data Mining, Taipei, Taiwan, 6–8 May 2002; Springer: Berlin/Heidelberg, Germany, 2002; pp. 535–548. [Google Scholar]
- Yokkampon, U.; Mowshowitz, A.; Chumkamon, S.; Hayashi, E. Robust Unsupervised Anomaly Detection with Variational Autoencoder in Multivariate Time Series Data. IEEE Access 2022, 10, 57835–57849. [Google Scholar] [CrossRef]
- Fan, J.; Liu, Z.; Wu, H.; Wu, J.; Si, Z.; Hao, P.; Luan, T.H. LUAD: A lightweight unsupervised anomaly detection scheme for multivariate time series data. Neurocomputing 2023, 557, 126644. [Google Scholar] [CrossRef]
- Zhang, Z.; Li, W.; Ding, W.; Zhang, L.; Lu, Q.; Hu, P.; Gui, T.; Lu, S. STAD-GAN: Unsupervised Anomaly Detection on Multivariate Time Series with Self-training Generative Adversarial Networks. ACM Trans. Knowl. Discov. Data 2023, 17, 1–18. [Google Scholar] [CrossRef]
- Kong, L.; Yu, J.; Tang, D.; Song, Y.; Han, D. Multivariate Time Series Anomaly Detection with Generative Adversarial Networks Based on Active Distortion Transformer. IEEE Sens. J. 2023, 23, 9658–9668. [Google Scholar] [CrossRef]
- Jiao, Y.; Yang, K.; Song, D.; Tao, D. TimeAutoAD: Autonomous Anomaly Detection with Self-Supervised Contrastive Loss for Multivariate Time Series. IEEE Trans. Netw. Sci. Eng. 2022, 9, 1604–1619. [Google Scholar] [CrossRef]
- Belay, M.A.; Rasheed, A.; Rossi, P.S. Multivariate Time Series Anomaly Detection via Low-Rank and Sparse Decomposition. IEEE Sens. J. 2024, 24, 34942–34952. [Google Scholar] [CrossRef]
- Li, L.; Yan, J.; Wen, Q.; Jin, Y.; Yang, X. Learning Robust Deep State Space for Unsupervised Anomaly Detection in Contaminated Time-Series. IEEE Trans. Knowl. Data Eng. 2022, 35, 6058–6072. [Google Scholar] [CrossRef]
- Hwang, R.; Park, S.; Bin, Y.; Hwang, H.J. Anomaly Detection in Time Series Data and its Application to Semiconductor Manufacturing. IEEE Access 2023, 11, 130483–130490. [Google Scholar] [CrossRef]
- Tan, H.C.; Mohanraj, V.; Chen, B.; Mashima, D.; Nan, S.K.S.; Yang, A. An IEC 61850 MMS Traffic Parser for Customizable and Efficient Intrusion Detection. In Proceedings of the 2021 IEEE International Conference on Communications, Control, and Computing Technologies for Smart Grids (SmartGridComm), Aachen, Germany, 25–28 October 2021; IEEE: Piscataway, NJ, USA, 2021; pp. 194–200. [Google Scholar]
- International Organization for Standardization. ISO 9506: Industrial Automation Systems—Manufacturing Message Specification (MMS)—Part 1: Service Definition and Part 2: Protocol Specification. Originally Published in 1990, Revised in 2003. Available online: https://www.iso.org/standard/37079.html (accessed on 12 March 2025).
- Qaiser, S.; Ali, R. Text mining: Use of TF-IDF to examine the relevance of words to documents. Int. J. Comput. Appl. 2018, 181, 25–29. [Google Scholar]
- Dzisevič, R.; Šešok, D. Text classification using different feature extraction approaches. In Proceedings of the 2019 Open Conference of Electrical, Electronic and Information Sciences (eStream), Vilnius, Lithuania, 25 April 2019; IEEE: Piscataway, NJ, USA, 2019; pp. 1–4. [Google Scholar]
- Du, S.S.; Wang, Y.; Singh, A. On the power of truncated SVD for general high-rank matrix estimation problems. In Proceedings of the Advances in Neural Information Processing Systems 30 (NIPS 2017), Long Beach, CA, USA, 4–9 December 2017; Volume 30, pp. 2017–2026. Available online: https://papers.nips.cc/paper_files/paper/2017/hash/89f0fd5c927d466d6ec9a21b9ac34ffa-Abstract.html (accessed on 12 March 2025).
- Hochreiter, S.; Schmidhuber, J. Long short-term memory. Neural Comput. 1997, 9, 1735–1780. [Google Scholar] [CrossRef]
- Klambauer, G.; Unterthiner, T.; Mayr, A.; Hochreiter, S. Self-normalizing neural networks. In Proceedings of the Advances in Neural Information Processing Systems 30 (NIPS 2017), Long Beach, CA, USA, 4–9 December 2017; Volume 30. [Google Scholar]
| Disclaimer/Publisher’s Note: The statements, opinions and data contained in all publications are solely those of the individual author(s) and contributor(s) and not of MDPI and/or the editor(s). MDPI and/or the editor(s) disclaim responsibility for any injury to people or property resulting from any ideas, methods, instructions or products referred to in the content. |
© 2025 by the authors. Licensee MDPI, Basel, Switzerland. This article is an open access article distributed under the terms and conditions of the Creative Commons Attribution (CC BY) license (https://creativecommons.org/licenses/by/4.0/).


