Computational Testing Procedure for the Overall Lifetime Performance Index of Multi-Component Exponentially Distributed Products
Abstract
1. Introduction
2. Materials and Methods
2.1. The Overall Lifetime Performance Index and Overall Conforming Rate
2.2. Maximum Likelihood Estimation
3. Results
3.1. The Proposed Testing Procedure for the Overall Performance Index
| Algorithm 1: The testing steps for the overall lifetime performance index |
|
3.2. Two Numerical Examples
- Step 1:
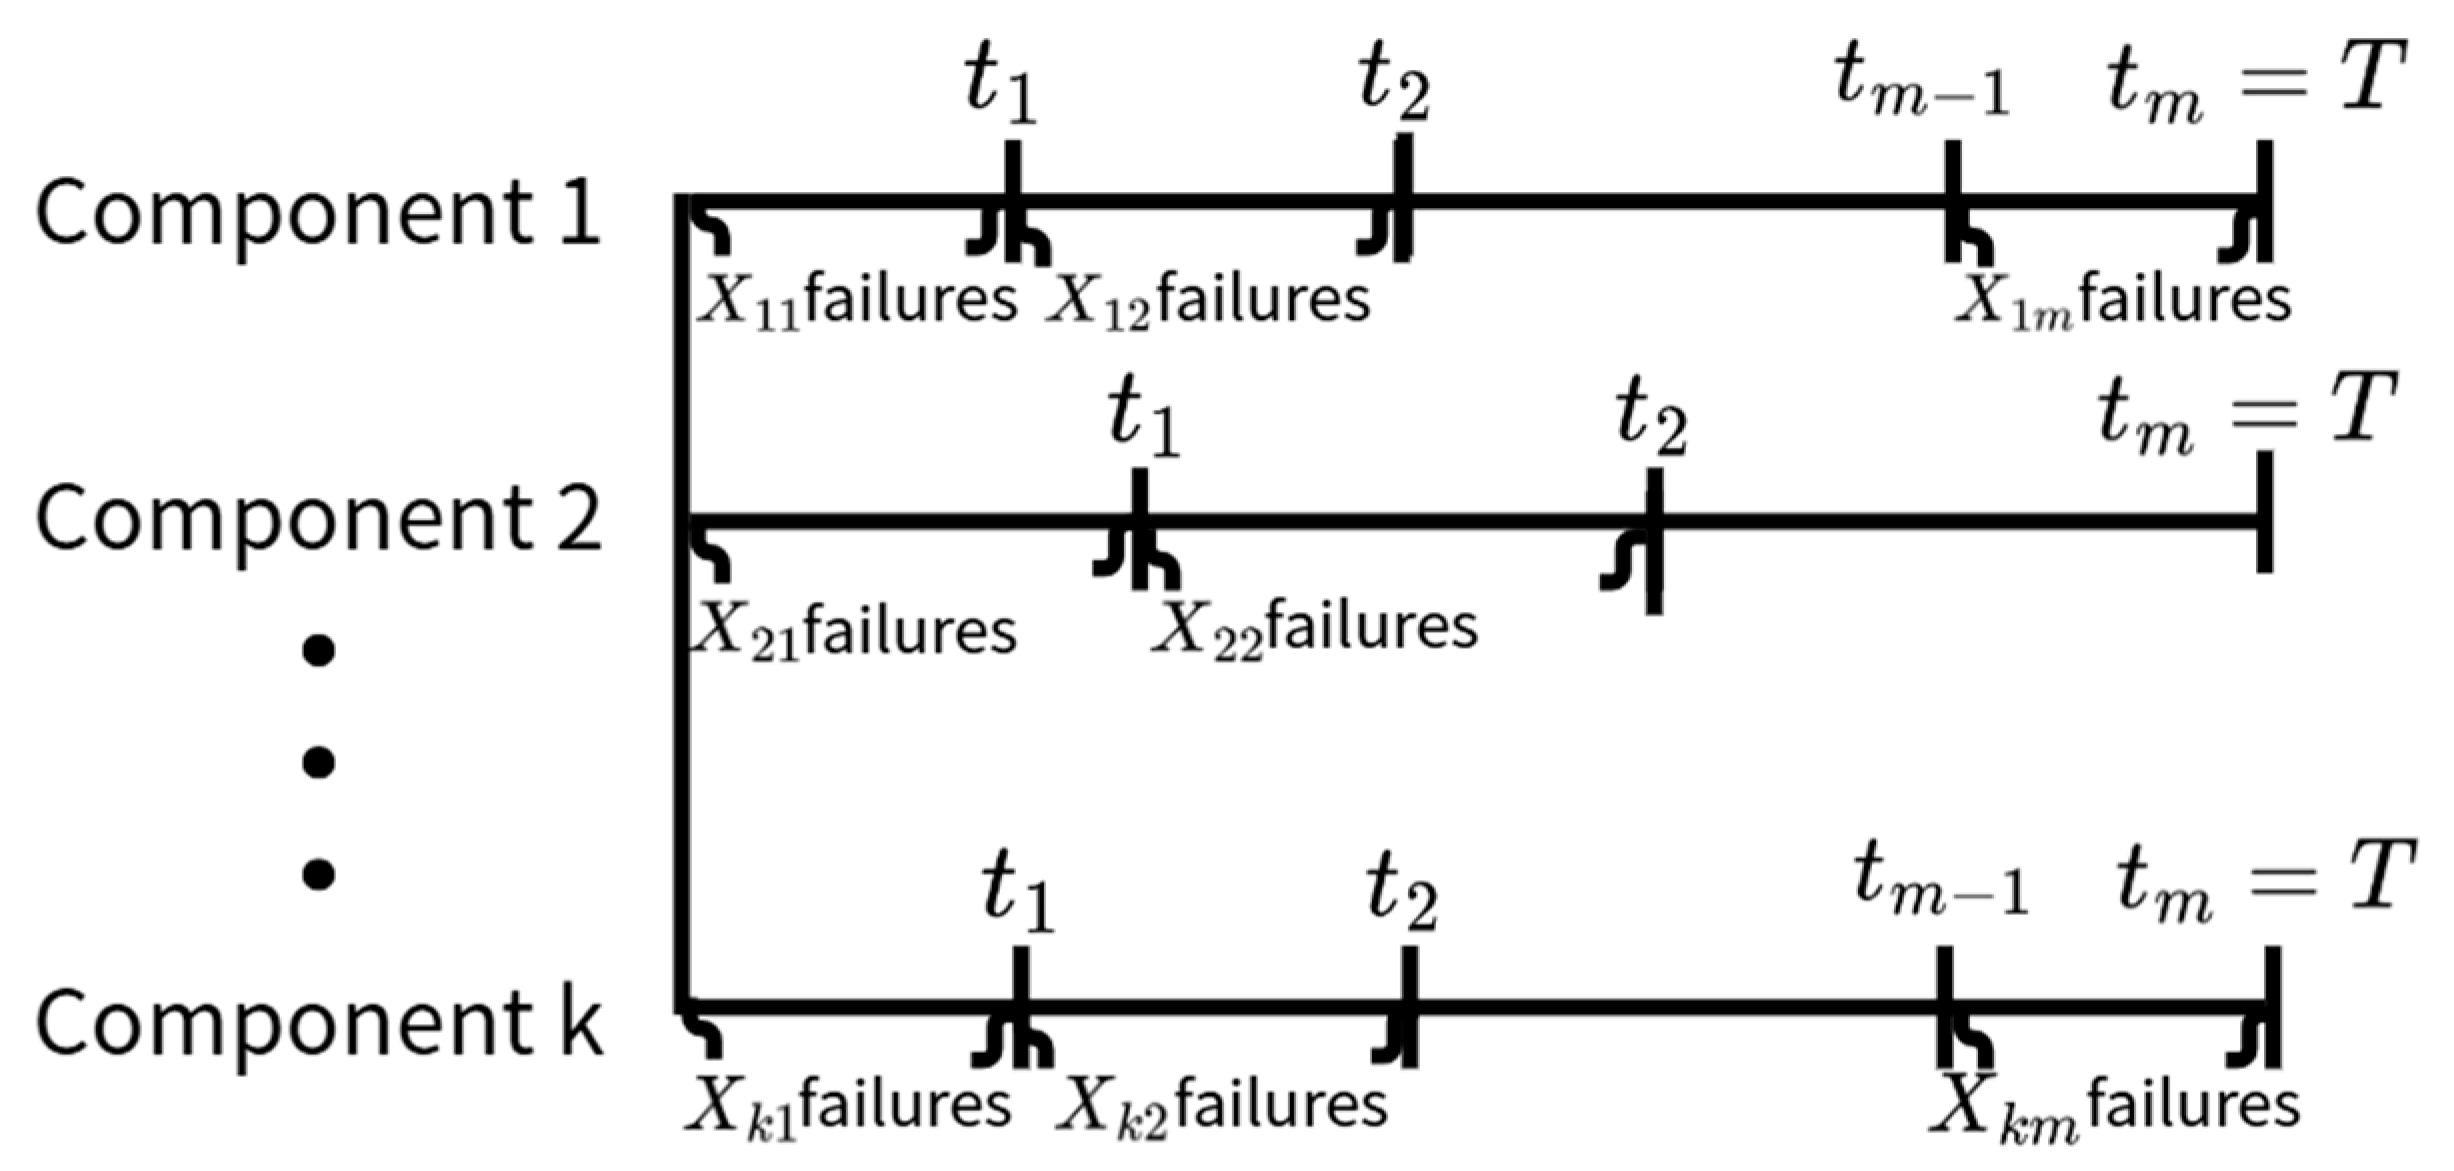
- With the lower specification limit L1 = L2 = 0.01 given, we obtain the progressive type I interval censored samples (X11, X12, X13, X14, X15, X16, X17, X18)= (12, 4, 2, 3, 1, 1, 1, 3) and (X21, X22, X23, X24, X25, X26, X27, X28) = (2, 6, 5, 3, 1, 2, 0, 0) for two components at the pre-set inspection times (t1, t2,…, t8) = (0.25, 0.5, 0.75, 1.0, 1.25, 1.5, 1.75, 2.0) with censoring schemes of (R11, R12, R13, R14, R15, R16, R17, R18) = (2, 2, 2, 2, 1, 1, 1, 12) and (R11, R12, R13, R14, R15, R16, R17, R18)= (3, 2, 2, 2, 2, 1, 1, 18).
- Step 2:
- For a prespecified conforming rate , we can determine the required target level for and then we can determine the required target level = 0.875 for . Then, we can construct the testing null hypothesis for some i vs.
- Step 3:
- We can find the maximum likelihood estimators 1.8537 and 3.1102 for two components. Compute the values of test statistic = 0.9946 and = 0.9968.
- Step 4:
- For the given level of significance of = 0.05, we yield = 0.2236 and . Then, we can compute the critical values for both components.
- Step 5:
- Since = 0.8573 and = 0.8573, we can infer that two individual lifetime performance indices have reached the prespecified target values, ensuring that the overall lifetime performance index also meets the required standard.
- Step 1:
- With the lower specification limit L1 = L2 = 0.2 given, we can obtain the progressive type I interval censored samples (X11, X12, X13, X14, X15) = (5, 3, 0, 1, 3) and (X21, X22, X23, X24, X25) = (5,2,1,0,4) for two components at the pre-set inspection times ( = (0.6, 1.2, 1.8, 2.4, 3.0) with censoring schemes of (R11, R12, R13, R14, R15) = (1, 1, 1, 1, 4) and (R11, R12, R13, R14, R15) = (5, 2, 1, 0, 4).
- Step 2:
- For a prespecified conforming rate we can determine the required target level for and then we can determine the required target level = 0.9 for . Then, we can construct the testing null hypothesis for some i vs. .
- Step 3:
- Find the maximum likelihood estimators 2.6889 and 2.7893 for two components. Compute the values of test statistic = 0.9256 and =0.9283.
- Step 4:
- For the given level of significance of = 0.1, we yield =0.3162 and . Then, we can compute the critical values for both components.
- Step 5:
- Since = 0.8934 and = 0.8934, we can infer that two individual lifetime performance indices have reached the prespecified target values so that the overall lifetime performance index also meets the required level.
4. Discussion
5. Conclusions
Author Contributions
Funding
Data Availability Statement
Conflicts of Interest
Appendix A
| m | n | p | c1 | |||||
|---|---|---|---|---|---|---|---|---|
| 0.75 | 0.775 | 0.8 | 0.825 | 0.85 | 0.875 | |||
| 6 | 30 | 0.05 | 0.01 | 0.245780 | 0.741612 | 0.954608 | 0.993248 | 0.998657 |
| 0.075 | 0.01 | 0.254485 | 0.758842 | 0.961799 | 0.995037 | 0.999151 | ||
| 0.1 | 0.01 | 0.262560 | 0.773897 | 0.967455 | 0.996268 | 0.999444 | ||
| 50 | 0.05 | 0.01 | 0.381475 | 0.905200 | 0.994622 | 0.999744 | 0.999979 | |
| 0.075 | 0.01 | 0.395156 | 0.916324 | 0.996008 | 0.999848 | 0.999990 | ||
| 0.1 | 0.01 | 0.407715 | 0.925510 | 0.996972 | 0.999906 | 0.999995 | ||
| 70 | 0.05 | 0.01 | 0.503027 | 0.966670 | 0.999380 | 0.999990 | 1.000000 | |
| 0.075 | 0.01 | 0.519858 | 0.972211 | 0.999595 | 0.999995 | 1.000000 | ||
| 0.1 | 0.01 | 0.535117 | 0.976535 | 0.999727 | 0.999998 | 1.000000 | ||
| 7 | 30 | 0.05 | 0.01 | 0.286201 | 0.805455 | 0.975384 | 0.997363 | 0.999595 |
| 0.075 | 0.01 | 0.298036 | 0.823563 | 0.980639 | 0.998278 | 0.999785 | ||
| 0.1 | 0.01 | 0.308787 | 0.838690 | 0.984448 | 0.998831 | 0.999879 | ||
| 50 | 0.05 | 0.01 | 0.442293 | 0.942528 | 0.998093 | 0.999947 | 0.999997 | |
| 0.075 | 0.01 | 0.460000 | 0.951759 | 0.998739 | 0.999974 | 0.999999 | ||
| 0.1 | 0.01 | 0.475837 | 0.958899 | 0.999135 | 0.999987 | 1.000000 | ||
| 70 | 0.05 | 0.01 | 0.575298 | 0.983765 | 0.999857 | 0.999999 | 1.000000 | |
| 0.075 | 0.01 | 0.595835 | 0.987404 | 0.999921 | 1.000000 | 1.000000 | ||
| 0.1 | 0.01 | 0.613881 | 0.990010 | 0.999954 | 1.000000 | 1.000000 | ||
| 8 | 30 | 0.05 | 0.01 | 0.327066 | 0.855881 | 0.987033 | 0.999017 | 0.999885 |
| 0.075 | 0.01 | 0.342167 | 0.873467 | 0.990542 | 0.999437 | 0.999950 | ||
| 0.1 | 0.01 | 0.355589 | 0.887468 | 0.992871 | 0.999658 | 0.999976 | ||
| 50 | 0.05 | 0.01 | 0.500969 | 0.966034 | 0.999356 | 0.999990 | 1.000000 | |
| 0.075 | 0.01 | 0.522341 | 0.973050 | 0.999626 | 0.999996 | 1.000000 | ||
| 0.1 | 0.01 | 0.540937 | 0.978109 | 0.999770 | 0.999998 | 1.000000 | ||
| 70 | 0.05 | 0.01 | 0.641169 | 0.992359 | 0.999969 | 1.000000 | 1.000000 | |
| 0.075 | 0.01 | 0.664423 | 0.994530 | 0.999986 | 1.000000 | 1.000000 | ||
| 0.1 | 0.01 | 0.684181 | 0.995947 | 0.999993 | 1.000000 | 1.000000 |
| m | n | p | c1 | |||||
|---|---|---|---|---|---|---|---|---|
| 0.75 | 0.775 | 0.8 | 0.825 | 0.85 | 0.875 | |||
| 6 | 30 | 0.05 | 0.05 | 0.442664 | 0.857150 | 0.977769 | 0.996628 | 0.999252 |
| 0.075 | 0.05 | 0.453753 | 0.869227 | 0.981773 | 0.997595 | 0.999542 | ||
| 0.1 | 0.05 | 0.463861 | 0.879516 | 0.984831 | 0.998239 | 0.999708 | ||
| 50 | 0.05 | 0.05 | 0.592016 | 0.956942 | 0.997869 | 0.999895 | 0.999990 | |
| 0.075 | 0.05 | 0.605954 | 0.962939 | 0.998471 | 0.999940 | 0.999996 | ||
| 0.1 | 0.05 | 0.618484 | 0.967748 | 0.998875 | 0.999964 | 0.999998 | ||
| 70 | 0.05 | 0.05 | 0.703306 | 0.987068 | 0.999793 | 0.999997 | 1.000000 | |
| 0.075 | 0.05 | 0.717775 | 0.989534 | 0.999870 | 0.999998 | 1.000000 | ||
| 0.1 | 0.05 | 0.730591 | 0.991397 | 0.999916 | 0.999999 | 1.000000 | ||
| 7 | 30 | 0.05 | 0.05 | 0.490493 | 0.898946 | 0.988722 | 0.998762 | 0.999786 |
| 0.075 | 0.05 | 0.504496 | 0.910561 | 0.991417 | 0.999222 | 0.999890 | ||
| 0.1 | 0.05 | 0.516950 | 0.919976 | 0.993302 | 0.999489 | 0.999940 | ||
| 50 | 0.05 | 0.05 | 0.649930 | 0.975885 | 0.999307 | 0.999980 | 0.999999 | |
| 0.075 | 0.05 | 0.666446 | 0.980388 | 0.999561 | 0.999991 | 1.000000 | ||
| 0.1 | 0.05 | 0.680851 | 0.983750 | 0.999710 | 0.999995 | 1.000000 | ||
| 70 | 0.05 | 0.05 | 0.761537 | 0.994260 | 0.999957 | 1.000000 | 1.000000 | |
| 0.075 | 0.05 | 0.777544 | 0.995710 | 0.999977 | 1.000000 | 1.000000 | ||
| 0.1 | 0.05 | 0.791219 | 0.996709 | 0.999987 | 1.000000 | 1.000000 | ||
| 8 | 30 | 0.05 | 0.05 | 0.535840 | 0.929481 | 0.994431 | 0.999566 | 0.999942 |
| 0.075 | 0.05 | 0.552520 | 0.939878 | 0.996096 | 0.999762 | 0.999976 | ||
| 0.1 | 0.05 | 0.566985 | 0.947873 | 0.997156 | 0.999861 | 0.999989 | ||
| 50 | 0.05 | 0.05 | 0.701576 | 0.986789 | 0.999785 | 0.999996 | 1.000000 | |
| 0.075 | 0.05 | 0.719946 | 0.989908 | 0.999881 | 0.999999 | 1.000000 | ||
| 0.1 | 0.05 | 0.735471 | 0.992067 | 0.999930 | 0.999999 | 1.000000 | ||
| 70 | 0.05 | 0.05 | 0.810120 | 0.997529 | 0.999992 | 1.000000 | 1.000000 | |
| 0.075 | 0.05 | 0.826678 | 0.998309 | 0.999996 | 1.000000 | 1.000000 | ||
| 0.1 | 0.05 | 0.840299 | 0.998796 | 0.999998 | 1.000000 | 1.000000 |
| m | n | p | c1 | |||||
|---|---|---|---|---|---|---|---|---|
| 0.75 | 0.775 | 0.8 | 0.825 | 0.85 | 0.875 | |||
| 6 | 30 | 0.05 | 0.1 | 0.557285 | 0.901505 | 0.985365 | 0.997727 | 0.999461 |
| 0.075 | 0.1 | 0.568444 | 0.910813 | 0.988175 | 0.998406 | 0.999675 | ||
| 0.1 | 0.1 | 0.578520 | 0.918637 | 0.990288 | 0.998850 | 0.999796 | ||
| 50 | 0.05 | 0.1 | 0.696956 | 0.973283 | 0.998749 | 0.999937 | 0.999994 | |
| 0.075 | 0.1 | 0.709477 | 0.977324 | 0.999119 | 0.999965 | 0.999997 | ||
| 0.1 | 0.1 | 0.720608 | 0.980515 | 0.999363 | 0.999979 | 0.999999 | ||
| 70 | 0.05 | 0.1 | 0.791711 | 0.992627 | 0.999890 | 0.999998 | 1.000000 | |
| 0.075 | 0.1 | 0.803641 | 0.994132 | 0.999932 | 0.999999 | 1.000000 | ||
| 0.1 | 0.1 | 0.814079 | 0.995248 | 0.999957 | 1.000000 | 1.000000 | ||
| 7 | 30 | 0.05 | 0.1 | 0.603633 | 0.932619 | 0.992838 | 0.999193 | 0.999850 |
| 0.075 | 0.1 | 0.617204 | 0.941176 | 0.994648 | 0.999503 | 0.999925 | ||
| 0.1 | 0.1 | 0.629139 | 0.948000 | 0.995890 | 0.999680 | 0.999960 | ||
| 50 | 0.05 | 0.1 | 0.747222 | 0.985660 | 0.999612 | 0.999988 | 0.999999 | |
| 0.075 | 0.1 | 0.761411 | 0.988541 | 0.999760 | 0.999995 | 1.000000 | ||
| 0.1 | 0.1 | 0.773624 | 0.990651 | 0.999845 | 0.999997 | 1.000000 | ||
| 70 | 0.05 | 0.1 | 0.838173 | 0.996887 | 0.999978 | 1.000000 | 1.000000 | |
| 0.075 | 0.1 | 0.850736 | 0.997722 | 0.999989 | 1.000000 | 1.000000 | ||
| 0.1 | 0.1 | 0.861312 | 0.998284 | 0.999994 | 1.000000 | 1.000000 | ||
| 8 | 30 | 0.05 | 0.1 | 0.646163 | 0.954463 | 0.996585 | 0.999726 | 0.999961 |
| 0.075 | 0.1 | 0.661772 | 0.961809 | 0.997658 | 0.999854 | 0.999984 | ||
| 0.1 | 0.1 | 0.675132 | 0.967354 | 0.998326 | 0.999917 | 0.999993 | ||
| 50 | 0.05 | 0.1 | 0.790301 | 0.992458 | 0.999885 | 0.999998 | 1.000000 | |
| 0.075 | 0.1 | 0.805445 | 0.994359 | 0.999938 | 0.999999 | 1.000000 | ||
| 0.1 | 0.1 | 0.818050 | 0.995646 | 0.999965 | 1.000000 | 1.000000 | ||
| 70 | 0.05 | 0.1 | 0.875254 | 0.998724 | 0.999996 | 1.000000 | 1.000000 | |
| 0.075 | 0.1 | 0.887672 | 0.999148 | 0.999998 | 1.000000 | 1.000000 | ||
| 0.1 | 0.1 | 0.897716 | 0.999406 | 0.999999 | 1.000000 | 1.000000 |
| m | n | p | c1 | |||||
|---|---|---|---|---|---|---|---|---|
| 0.75 | 0.775 | 0.8 | 0.825 | 0.85 | 0.875 | |||
| 6 | 30 | 0.05 | 0.01 | 0.176311 | 0.576375 | 0.854788 | 0.954827 | 0.983120 |
| 0.075 | 0.01 | 0.185801 | 0.602866 | 0.875682 | 0.965346 | 0.988424 | ||
| 0.1 | 0.01 | 0.194605 | 0.626139 | 0.892376 | 0.972873 | 0.991821 | ||
| 50 | 0.05 | 0.01 | 0.276703 | 0.777328 | 0.962699 | 0.994238 | 0.998757 | |
| 0.075 | 0.01 | 0.292406 | 0.801849 | 0.971396 | 0.996297 | 0.999333 | ||
| 0.1 | 0.01 | 0.306844 | 0.822255 | 0.977625 | 0.997538 | 0.999625 | ||
| 70 | 0.05 | 0.01 | 0.372965 | 0.886450 | 0.990492 | 0.999253 | 0.999906 | |
| 0.075 | 0.01 | 0.393666 | 0.904130 | 0.993458 | 0.999598 | 0.999960 | ||
| 0.1 | 0.01 | 0.412482 | 0.918075 | 0.995369 | 0.999773 | 0.999982 | ||
| 7 | 30 | 0.05 | 0.01 | 0.205378 | 0.646151 | 0.901366 | 0.974929 | 0.991984 |
| 0.075 | 0.01 | 0.218487 | 0.677155 | 0.920559 | 0.982611 | 0.995228 | ||
| 0.1 | 0.01 | 0.230400 | 0.703225 | 0.934764 | 0.987515 | 0.997013 | ||
| 50 | 0.05 | 0.01 | 0.323632 | 0.838260 | 0.980562 | 0.997821 | 0.999633 | |
| 0.075 | 0.01 | 0.344697 | 0.862711 | 0.986532 | 0.998815 | 0.999845 | ||
| 0.1 | 0.01 | 0.363579 | 0.881806 | 0.990347 | 0.999317 | 0.999928 | ||
| 70 | 0.05 | 0.01 | 0.433618 | 0.928271 | 0.996180 | 0.999807 | 0.999983 | |
| 0.075 | 0.01 | 0.460348 | 0.943346 | 0.997719 | 0.999918 | 0.999995 | ||
| 0.1 | 0.01 | 0.483901 | 0.954302 | 0.998571 | 0.999962 | 0.999998 | ||
| 8 | 30 | 0.05 | 0.01 | 0.235748 | 0.708551 | 0.934673 | 0.986597 | 0.996383 |
| 0.075 | 0.01 | 0.252768 | 0.742122 | 0.950817 | 0.991677 | 0.998156 | ||
| 0.1 | 0.01 | 0.267907 | 0.769050 | 0.961828 | 0.994550 | 0.998985 | ||
| 50 | 0.05 | 0.01 | 0.371338 | 0.885079 | 0.990257 | 0.999225 | 0.999901 | |
| 0.075 | 0.01 | 0.397746 | 0.907448 | 0.993963 | 0.999649 | 0.999967 | ||
| 0.1 | 0.01 | 0.420778 | 0.923770 | 0.996059 | 0.999827 | 0.999988 | ||
| 70 | 0.05 | 0.01 | 0.493061 | 0.955971 | 0.998545 | 0.999954 | 0.999997 | |
| 0.075 | 0.01 | 0.525159 | 0.967696 | 0.999257 | 0.999985 | 0.999999 | ||
| 0.1 | 0.01 | 0.552510 | 0.975505 | 0.999592 | 0.999994 | 1.000000 |
| m | n | p | c1 | |||||
|---|---|---|---|---|---|---|---|---|
| 0.75 | 0.775 | 0.8 | 0.825 | 0.85 | 0.875 | |||
| 6 | 30 | 0.05 | 0.05 | 0.346868 | 0.726135 | 0.913632 | 0.972590 | 0.988892 |
| 0.075 | 0.05 | 0.360344 | 0.748365 | 0.927890 | 0.979526 | 0.992575 | ||
| 0.1 | 0.05 | 0.372570 | 0.767325 | 0.938941 | 0.984344 | 0.994871 | ||
| 50 | 0.05 | 0.05 | 0.472748 | 0.875584 | 0.980894 | 0.996944 | 0.999267 | |
| 0.075 | 0.05 | 0.491084 | 0.892078 | 0.985796 | 0.998101 | 0.999620 | ||
| 0.1 | 0.05 | 0.507510 | 0.905363 | 0.989190 | 0.998775 | 0.999792 | ||
| 70 | 0.05 | 0.05 | 0.575575 | 0.943399 | 0.995666 | 0.999645 | 0.999949 | |
| 0.075 | 0.05 | 0.596437 | 0.953593 | 0.997124 | 0.999816 | 0.999979 | ||
| 0.1 | 0.05 | 0.614858 | 0.961360 | 0.998029 | 0.999900 | 0.999991 | ||
| 7 | 30 | 0.05 | 0.05 | 0.385732 | 0.781541 | 0.944056 | 0.985413 | 0.994900 |
| 0.075 | 0.05 | 0.403174 | 0.805661 | 0.956322 | 0.990213 | 0.997060 | ||
| 0.1 | 0.05 | 0.418609 | 0.825246 | 0.965080 | 0.993172 | 0.998210 | ||
| 50 | 0.05 | 0.05 | 0.524649 | 0.914665 | 0.990603 | 0.998904 | 0.999793 | |
| 0.075 | 0.05 | 0.547427 | 0.929823 | 0.993737 | 0.999429 | 0.999916 | ||
| 0.1 | 0.05 | 0.567215 | 0.941216 | 0.995659 | 0.999683 | 0.999963 | ||
| 70 | 0.05 | 0.05 | 0.633623 | 0.966495 | 0.998372 | 0.999914 | 0.999991 | |
| 0.075 | 0.05 | 0.658372 | 0.974479 | 0.999072 | 0.999965 | 0.999997 | ||
| 0.1 | 0.05 | 0.679440 | 0.980050 | 0.999441 | 0.999985 | 0.999999 | ||
| 8 | 30 | 0.05 | 0.05 | 0.424135 | 0.827946 | 0.964615 | 0.992520 | 0.997776 |
| 0.075 | 0.05 | 0.445436 | 0.852298 | 0.974323 | 0.995536 | 0.998909 | ||
| 0.1 | 0.05 | 0.463807 | 0.871073 | 0.980680 | 0.997173 | 0.999419 | ||
| 50 | 0.05 | 0.05 | 0.573951 | 0.942611 | 0.995550 | 0.999630 | 0.999946 | |
| 0.075 | 0.05 | 0.600521 | 0.955480 | 0.997368 | 0.999841 | 0.999983 | ||
| 0.1 | 0.05 | 0.622875 | 0.964473 | 0.998348 | 0.999925 | 0.999994 | ||
| 70 | 0.05 | 0.05 | 0.686375 | 0.980677 | 0.999420 | 0.999981 | 0.999999 | |
| 0.075 | 0.05 | 0.713840 | 0.986420 | 0.999720 | 0.999994 | 1.000000 | ||
| 0.1 | 0.05 | 0.736342 | 0.990070 | 0.999853 | 0.999998 | 1.000000 |
| m | n | p | c1 | |||||
|---|---|---|---|---|---|---|---|---|
| 0.75 | 0.775 | 0.8 | 0.825 | 0.85 | 0.875 | |||
| 6 | 30 | 0.05 | 0.1 | 0.456389 | 0.793378 | 0.936645 | 0.979441 | 0.991230 |
| 0.075 | 0.1 | 0.470800 | 0.812291 | 0.947835 | 0.984869 | 0.994221 | ||
| 0.1 | 0.1 | 0.483723 | 0.828173 | 0.956367 | 0.988579 | 0.996057 | ||
| 50 | 0.05 | 0.1 | 0.582893 | 0.913166 | 0.987062 | 0.997869 | 0.999455 | |
| 0.075 | 0.1 | 0.600668 | 0.925730 | 0.990546 | 0.998701 | 0.999722 | ||
| 0.1 | 0.1 | 0.616375 | 0.935678 | 0.992914 | 0.999175 | 0.999851 | ||
| 70 | 0.05 | 0.1 | 0.678237 | 0.962816 | 0.997245 | 0.999766 | 0.999964 | |
| 0.075 | 0.1 | 0.697031 | 0.969999 | 0.998209 | 0.999882 | 0.999986 | ||
| 0.1 | 0.1 | 0.713382 | 0.975374 | 0.998794 | 0.999937 | 0.999994 | ||
| 7 | 30 | 0.05 | 0.1 | 0.496685 | 0.839208 | 0.959988 | 0.989304 | 0.996047 |
| 0.075 | 0.1 | 0.514738 | 0.858967 | 0.969294 | 0.992955 | 0.997761 | ||
| 0.1 | 0.1 | 0.530490 | 0.874719 | 0.975812 | 0.995162 | 0.998658 | ||
| 50 | 0.05 | 0.1 | 0.631831 | 0.942222 | 0.993833 | 0.999257 | 0.999850 | |
| 0.075 | 0.1 | 0.653083 | 0.953304 | 0.995977 | 0.999622 | 0.999940 | ||
| 0.1 | 0.1 | 0.671247 | 0.961468 | 0.997263 | 0.999794 | 0.999974 | ||
| 70 | 0.05 | 0.1 | 0.729186 | 0.978736 | 0.999003 | 0.999945 | 0.999994 | |
| 0.075 | 0.1 | 0.750568 | 0.984123 | 0.999446 | 0.999978 | 0.999998 | ||
| 0.1 | 0.1 | 0.768452 | 0.987802 | 0.999673 | 0.999991 | 0.999999 | ||
| 8 | 30 | 0.05 | 0.1 | 0.535407 | 0.876358 | 0.975308 | 0.994637 | 0.998308 |
| 0.075 | 0.1 | 0.556783 | 0.895620 | 0.982445 | 0.996870 | 0.999188 | ||
| 0.1 | 0.1 | 0.574923 | 0.910167 | 0.987016 | 0.998054 | 0.999575 | ||
| 50 | 0.05 | 0.1 | 0.676782 | 0.962261 | 0.997168 | 0.999757 | 0.999962 | |
| 0.075 | 0.1 | 0.700699 | 0.971319 | 0.998368 | 0.999898 | 0.999989 | ||
| 0.1 | 0.1 | 0.720451 | 0.977507 | 0.998998 | 0.999953 | 0.999996 | ||
| 70 | 0.05 | 0.1 | 0.773796 | 0.988140 | 0.999658 | 0.999988 | 0.999999 | |
| 0.075 | 0.1 | 0.796620 | 0.991860 | 0.999840 | 0.999996 | 1.000000 | ||
| 0.1 | 0.1 | 0.814948 | 0.994167 | 0.999918 | 0.999999 | 1.000000 |
| m | n | p | c1 | |||||
|---|---|---|---|---|---|---|---|---|
| 0.75 | 0.775 | 0.8 | 0.825 | 0.85 | 0.875 | |||
| 6 | 30 | 0.05 | 0.01 | 0.136133 | 0.454428 | 0.739675 | 0.884514 | 0.941875 |
| 0.075 | 0.01 | 0.145385 | 0.484937 | 0.772966 | 0.908217 | 0.957791 | ||
| 0.1 | 0.01 | 0.153974 | 0.511988 | 0.800090 | 0.925769 | 0.968555 | ||
| 50 | 0.05 | 0.01 | 0.214356 | 0.656968 | 0.903239 | 0.974291 | 0.991319 | |
| 0.075 | 0.01 | 0.230069 | 0.691154 | 0.923544 | 0.982469 | 0.994869 | ||
| 0.1 | 0.01 | 0.244562 | 0.719977 | 0.938505 | 0.987677 | 0.996835 | ||
| 70 | 0.05 | 0.01 | 0.292079 | 0.790216 | 0.964460 | 0.994199 | 0.998662 | |
| 0.075 | 0.01 | 0.313564 | 0.819999 | 0.974476 | 0.996591 | 0.999354 | ||
| 0.1 | 0.01 | 0.333182 | 0.843878 | 0.981191 | 0.997910 | 0.999669 | ||
| 7 | 30 | 0.05 | 0.01 | 0.158378 | 0.520048 | 0.802876 | 0.924539 | 0.966091 |
| 0.075 | 0.01 | 0.171259 | 0.557888 | 0.837247 | 0.945084 | 0.978164 | ||
| 0.1 | 0.01 | 0.182985 | 0.590082 | 0.863320 | 0.958810 | 0.985316 | ||
| 50 | 0.05 | 0.01 | 0.251612 | 0.727780 | 0.939760 | 0.987283 | 0.996402 | |
| 0.075 | 0.01 | 0.273096 | 0.765274 | 0.956515 | 0.992486 | 0.998251 | ||
| 0.1 | 0.01 | 0.292434 | 0.795038 | 0.967631 | 0.995326 | 0.999087 | ||
| 70 | 0.05 | 0.01 | 0.342413 | 0.849926 | 0.981681 | 0.997810 | 0.999604 | |
| 0.075 | 0.01 | 0.371003 | 0.878858 | 0.988386 | 0.998945 | 0.999854 | ||
| 0.1 | 0.01 | 0.396346 | 0.900325 | 0.992308 | 0.999454 | 0.999941 | ||
| 8 | 30 | 0.05 | 0.01 | 0.182122 | 0.583008 | 0.854187 | 0.952327 | 0.981070 |
| 0.075 | 0.01 | 0.199001 | 0.626475 | 0.886685 | 0.968490 | 0.989306 | ||
| 0.1 | 0.01 | 0.214052 | 0.661833 | 0.909527 | 0.978174 | 0.993544 | ||
| 50 | 0.05 | 0.01 | 0.290705 | 0.788288 | 0.963784 | 0.994029 | 0.998611 | |
| 0.075 | 0.01 | 0.318198 | 0.826040 | 0.976318 | 0.996983 | 0.999455 | ||
| 0.1 | 0.01 | 0.342302 | 0.854133 | 0.983759 | 0.998352 | 0.999762 | ||
| 70 | 0.05 | 0.01 | 0.393881 | 0.895436 | 0.990983 | 0.999231 | 0.999894 | |
| 0.075 | 0.01 | 0.429322 | 0.921089 | 0.995013 | 0.999702 | 0.999971 | ||
| 0.1 | 0.01 | 0.459742 | 0.938618 | 0.997050 | 0.999871 | 0.999991 |
| m | n | p | c1 | |||||
|---|---|---|---|---|---|---|---|---|
| 0.75 | 0.775 | 0.8 | 0.825 | 0.85 | 0.875 | |||
| 6 | 30 | 0.05 | 0.05 | 0.286332 | 0.615083 | 0.828284 | 0.922640 | 0.958445 |
| 0.075 | 0.05 | 0.300516 | 0.643808 | 0.853858 | 0.940023 | 0.970503 | ||
| 0.1 | 0.05 | 0.313358 | 0.66846 | 0.874032 | 0.952523 | 0.978454 | ||
| 50 | 0.05 | 0.05 | 0.393624 | 0.785674 | 0.943626 | 0.984549 | 0.994312 | |
| 0.075 | 0.05 | 0.413742 | 0.811896 | 0.956742 | 0.989776 | 0.996731 | ||
| 0.1 | 0.05 | 0.431758 | 0.833232 | 0.966082 | 0.992998 | 0.998032 | ||
| 70 | 0.05 | 0.05 | 0.485608 | 0.880833 | 0.981142 | 0.996794 | 0.999182 | |
| 0.075 | 0.05 | 0.509629 | 0.900671 | 0.986898 | 0.998181 | 0.999618 | ||
| 0.1 | 0.05 | 0.530860 | 0.916002 | 0.990621 | 0.998918 | 0.999810 | ||
| 7 | 30 | 0.05 | 0.05 | 0.318716 | 0.673988 | 0.875014 | 0.951152 | 0.976403 |
| 0.075 | 0.05 | 0.337315 | 0.707196 | 0.899867 | 0.965519 | 0.985227 | ||
| 0.1 | 0.05 | 0.353743 | 0.734381 | 0.918027 | 0.974794 | 0.990299 | ||
| 50 | 0.05 | 0.05 | 0.439163 | 0.837816 | 0.966496 | 0.992664 | 0.997720 | |
| 0.075 | 0.05 | 0.464788 | 0.864497 | 0.976670 | 0.995825 | 0.998930 | ||
| 0.1 | 0.05 | 0.487054 | 0.884821 | 0.983157 | 0.997484 | 0.999458 | ||
| 70 | 0.05 | 0.05 | 0.539472 | 0.919177 | 0.990774 | 0.998846 | 0.999767 | |
| 0.075 | 0.05 | 0.569037 | 0.937032 | 0.994387 | 0.999468 | 0.999918 | ||
| 0.1 | 0.05 | 0.594252 | 0.949730 | 0.996411 | 0.999735 | 0.999968 | ||
| 8 | 30 | 0.05 | 0.05 | 0.351564 | 0.727186 | 0.911042 | 0.970166 | 0.987181 |
| 0.075 | 0.05 | 0.374580 | 0.762909 | 0.933264 | 0.980975 | 0.992996 | ||
| 0.1 | 0.05 | 0.394401 | 0.790736 | 0.948247 | 0.987206 | 0.995887 | ||
| 50 | 0.05 | 0.05 | 0.484074 | 0.879542 | 0.980751 | 0.996694 | 0.999149 | |
| 0.075 | 0.05 | 0.514736 | 0.904619 | 0.987935 | 0.998403 | 0.999680 | ||
| 0.1 | 0.05 | 0.540556 | 0.922444 | 0.992012 | 0.999159 | 0.999865 | ||
| 70 | 0.05 | 0.05 | 0.590874 | 0.946499 | 0.995688 | 0.999614 | 0.999940 | |
| 0.075 | 0.05 | 0.624933 | 0.961265 | 0.997729 | 0.999858 | 0.999984 | ||
| 0.1 | 0.05 | 0.652911 | 0.970889 | 0.998711 | 0.999941 | 0.999995 |
| m | n | p | c1 | |||||
|---|---|---|---|---|---|---|---|---|
| 0.75 | 0.775 | 0.8 | 0.825 | 0.85 | 0.875 | |||
| 6 | 30 | 0.05 | 0.1 | 0.389512 | 0.694706 | 0.866661 | 0.938763 | 0.965686 |
| 0.075 | 0.1 | 0.405324 | 0.720687 | 0.888038 | 0.953168 | 0.975949 | ||
| 0.1 | 0.1 | 0.419450 | 0.742608 | 0.904618 | 0.963365 | 0.982623 | ||
| 50 | 0.05 | 0.1 | 0.502645 | 0.840758 | 0.959018 | 0.988464 | 0.995521 | |
| 0.075 | 0.1 | 0.523141 | 0.862183 | 0.969056 | 0.992493 | 0.997466 | ||
| 0.1 | 0.1 | 0.541219 | 0.879300 | 0.976075 | 0.994933 | 0.998495 | ||
| 70 | 0.05 | 0.1 | 0.592752 | 0.915798 | 0.986961 | 0.997713 | 0.999380 | |
| 0.075 | 0.1 | 0.615637 | 0.930911 | 0.991106 | 0.998727 | 0.999715 | ||
| 0.1 | 0.1 | 0.635534 | 0.942370 | 0.993734 | 0.999256 | 0.999861 | ||
| 7 | 30 | 0.05 | 0.1 | 0.424660 | 0.746698 | 0.904959 | 0.962034 | 0.980797 |
| 0.075 | 0.1 | 0.444779 | 0.775702 | 0.925107 | 0.973649 | 0.988165 | ||
| 0.1 | 0.1 | 0.462272 | 0.798979 | 0.939541 | 0.981009 | 0.992330 | ||
| 50 | 0.05 | 0.1 | 0.547952 | 0.882485 | 0.976240 | 0.994643 | 0.998237 | |
| 0.075 | 0.1 | 0.573159 | 0.90349 | 0.983781 | 0.997014 | 0.999189 | ||
| 0.1 | 0.1 | 0.594670 | 0.919155 | 0.988486 | 0.998233 | 0.999596 | ||
| 70 | 0.05 | 0.1 | 0.642945 | 0.944471 | 0.993799 | 0.999198 | 0.999827 | |
| 0.075 | 0.1 | 0.670055 | 0.957564 | 0.996313 | 0.999639 | 0.999940 | ||
| 0.1 | 0.1 | 0.692728 | 0.966671 | 0.997688 | 0.999824 | 0.999977 | ||
| 8 | 30 | 0.05 | 0.1 | 0.459418 | 0.792270 | 0.933726 | 0.977231 | 0.989722 |
| 0.075 | 0.1 | 0.483612 | 0.822470 | 0.951236 | 0.985766 | 0.994488 | ||
| 0.1 | 0.1 | 0.504074 | 0.845477 | 0.962783 | 0.990584 | 0.996812 | ||
| 50 | 0.05 | 0.1 | 0.591291 | 0.914812 | 0.986679 | 0.997640 | 0.999354 | |
| 0.075 | 0.1 | 0.620469 | 0.933890 | 0.991845 | 0.998888 | 0.999763 | ||
| 0.1 | 0.1 | 0.644538 | 0.947132 | 0.994705 | 0.999427 | 0.999902 | ||
| 70 | 0.05 | 0.1 | 0.689254 | 0.964225 | 0.997182 | 0.999739 | 0.999956 | |
| 0.075 | 0.1 | 0.719383 | 0.974677 | 0.998556 | 0.999907 | 0.999989 | ||
| 0.1 | 0.1 | 0.743591 | 0.981323 | 0.999199 | 0.999962 | 0.999997 |
References
- Montgomery, D.C. Introduction to Statistical Quality Control; John Wiley and Sons Inc.: New York, NY, USA, 1985. [Google Scholar]
- Epstein, B.; Sobel, M. Life-testing. J. Am. Stat. Assoc. 1953, 48, 486–502. [Google Scholar] [CrossRef]
- Meyer, P.L. Introductory Probability and Statistical Applications; Addison-Wesley: Reading, MA, USA, 1965. [Google Scholar]
- Anderson, D.R.; Sweeney, D.J.; Williams, T.A. Statistics for Business and Economics; West Publishing Company: Saint Paul, MN, USA, 1990. [Google Scholar]
- Keller, G.B.; Bartel, W.H. Statistics for Management and Economics; Duxbury Press: Belmont, CA, USA, 1994. [Google Scholar]
- Zelen, M. Application of exponential models to problems in cancer research. J. R. Stat. Soc. Ser. A Gen. 1966, 129, 368–398. [Google Scholar] [CrossRef]
- Yakovenko, V.M.; Barkley, R.J. Statistical mechanics of money, wealth, and income (Colloquium). arXiv 2009, arXiv:0905.1518. [Google Scholar] [CrossRef]
- Lawless, J.F.; Singhal, K. Analysis of data from life test experiments under an exponential model. Naval Res Logist. Q. 1980, 27, 323–334. [Google Scholar] [CrossRef]
- Liang, X.; Zheng, X.; Lv, W.; Zhu, T.; Xu, K. The scaling of human mobility by taxis is exponential. arXiv 2011, arXiv:1109.5460. [Google Scholar] [CrossRef]
- Douglas, E.S.V.; Dayana, E.W.S.; Luiz, G.D.A.A.; Ricardo, A.; Nilo, A.D.S.S. Application of the exponential distribution to improve environmental quality in a company in the south of Rio de Janeiro State. Rev. Gestão Secr. 2023, 14, 15695–15704. [Google Scholar]
- Hu, J.; So, H.Y.; Zhuang, Y. Estimation of the mean exponential survival time under a sequential censoring scheme. J. Appl. Stat. 2024, 52, 669–686. [Google Scholar] [CrossRef] [PubMed]
- Adeyeye, T.N.; Gibeault, S.; Lathrop, D.P.; Daniels, M.W.; Stiles, M.D.; McClelland, J.J.; Borders, W.A.; Ryan, J.T.; Talatchian, P.; Ebels, U.; et al. Sampling from exponential distributions in the time domain with superparamagnetic tunnel junctions. Phys. Rev. Appl. 2025, 23, 044047. [Google Scholar] [CrossRef]
- Balakrishnan, K. Exponential Distribution: Theory, Methods and Applications; A Comprehensive Book Covering Both Theory and Many Application Areas; Routledge: Abingdon, UK, 1995. [Google Scholar]
- Tong, L.I.; Chen, K.S.; Chen, H.T. Statistical testing for assessing the performance of lifetime index of electronic components with exponential distribution. Int. J. Qual. Reliab. Manag. 2002, 19, 812–824. [Google Scholar] [CrossRef]
- Balakrishnan, N.; Aggarwala, R. Progressive Censoring: Theory, Methods and Applications; Birkhäuser: Boston, MA, USA, 2000. [Google Scholar]
- Hong, C.W.; Lee, W.C.; Wu, J.W. Computational Procedure of Performance Assessment of Lifetime Index of Products for the Weibull Distribution with the Progressive First-Failure-Censored Sampling Plan. J. Appl. Math. 2012, 2012, 717184. [Google Scholar] [CrossRef]
- Wu, J.W.; Lee, W.C.; Lin, L.S.; Hong, M.L. Bayesian test of lifetime performance index for exponential products based on the progressively type II right censored sample. J. Quant. Manag. 2011, 8, 57–77. [Google Scholar]
- Lee, H.M.; Wu, J.W.; Lei, C.L. Assessing the Lifetime Performance Index of Exponential Products With Step-Stress Accelerated Life-Testing Data. IEEE Trans. Reliab. 2013, 62, 296–304. [Google Scholar] [CrossRef]
- Wu, S.F. Interval Estimation for the Two-Parameter Exponential Distribution Based on Upper Record Value Data Using Bayesian Approaches. Mathematics 2024, 12, 3868. [Google Scholar] [CrossRef]
- Wu, S.F.; Lin, Y.P. Computational testing algorithmic procedure of assessment for lifetime performance index of products with one-parameter exponential distribution under progressive type I interval censoring. Math. Comput. Simul. 2016, 120, 79–90. [Google Scholar] [CrossRef]
- Wu, S.F.; Jheng, J.J.; Chang, W.T. Sampling design for the lifetime performance index of exponential lifetime distribution under progressive type I interval censoring. Commun. Stat.-Theory Methods 2023, 50, 2766–2782. [Google Scholar] [CrossRef]
- Aletti, G.; Flournoy, N.; May, C. Maximum likelihood estimation under the Emax model: Existence, geometry and efficiency. Stat. Pap. 2025, 66, 106. [Google Scholar] [CrossRef] [PubMed]
- Kneib, T.; Schlüter, J.C.; Wacker, B. Revisiting Maximum Log-Likelihood Parameter Estimation for Two-Parameter Weibull Distributions: Theory and Applications. Results Math. 2024, 79, 224. [Google Scholar] [CrossRef]
- Lawless, J.E. Statistical Models and Methods for Lifetime Data, 2nd ed.; John Wiley and Sons Inc.: New York, NY, USA, 2003. [Google Scholar]
- Gail, M.H.; Gastwirth, J.L. A scale-free goodness of fit test for the exponential distribution based on the Gini Statistic. J. R. Stat. Soc. B 1978, 40, 350–357. [Google Scholar] [CrossRef]
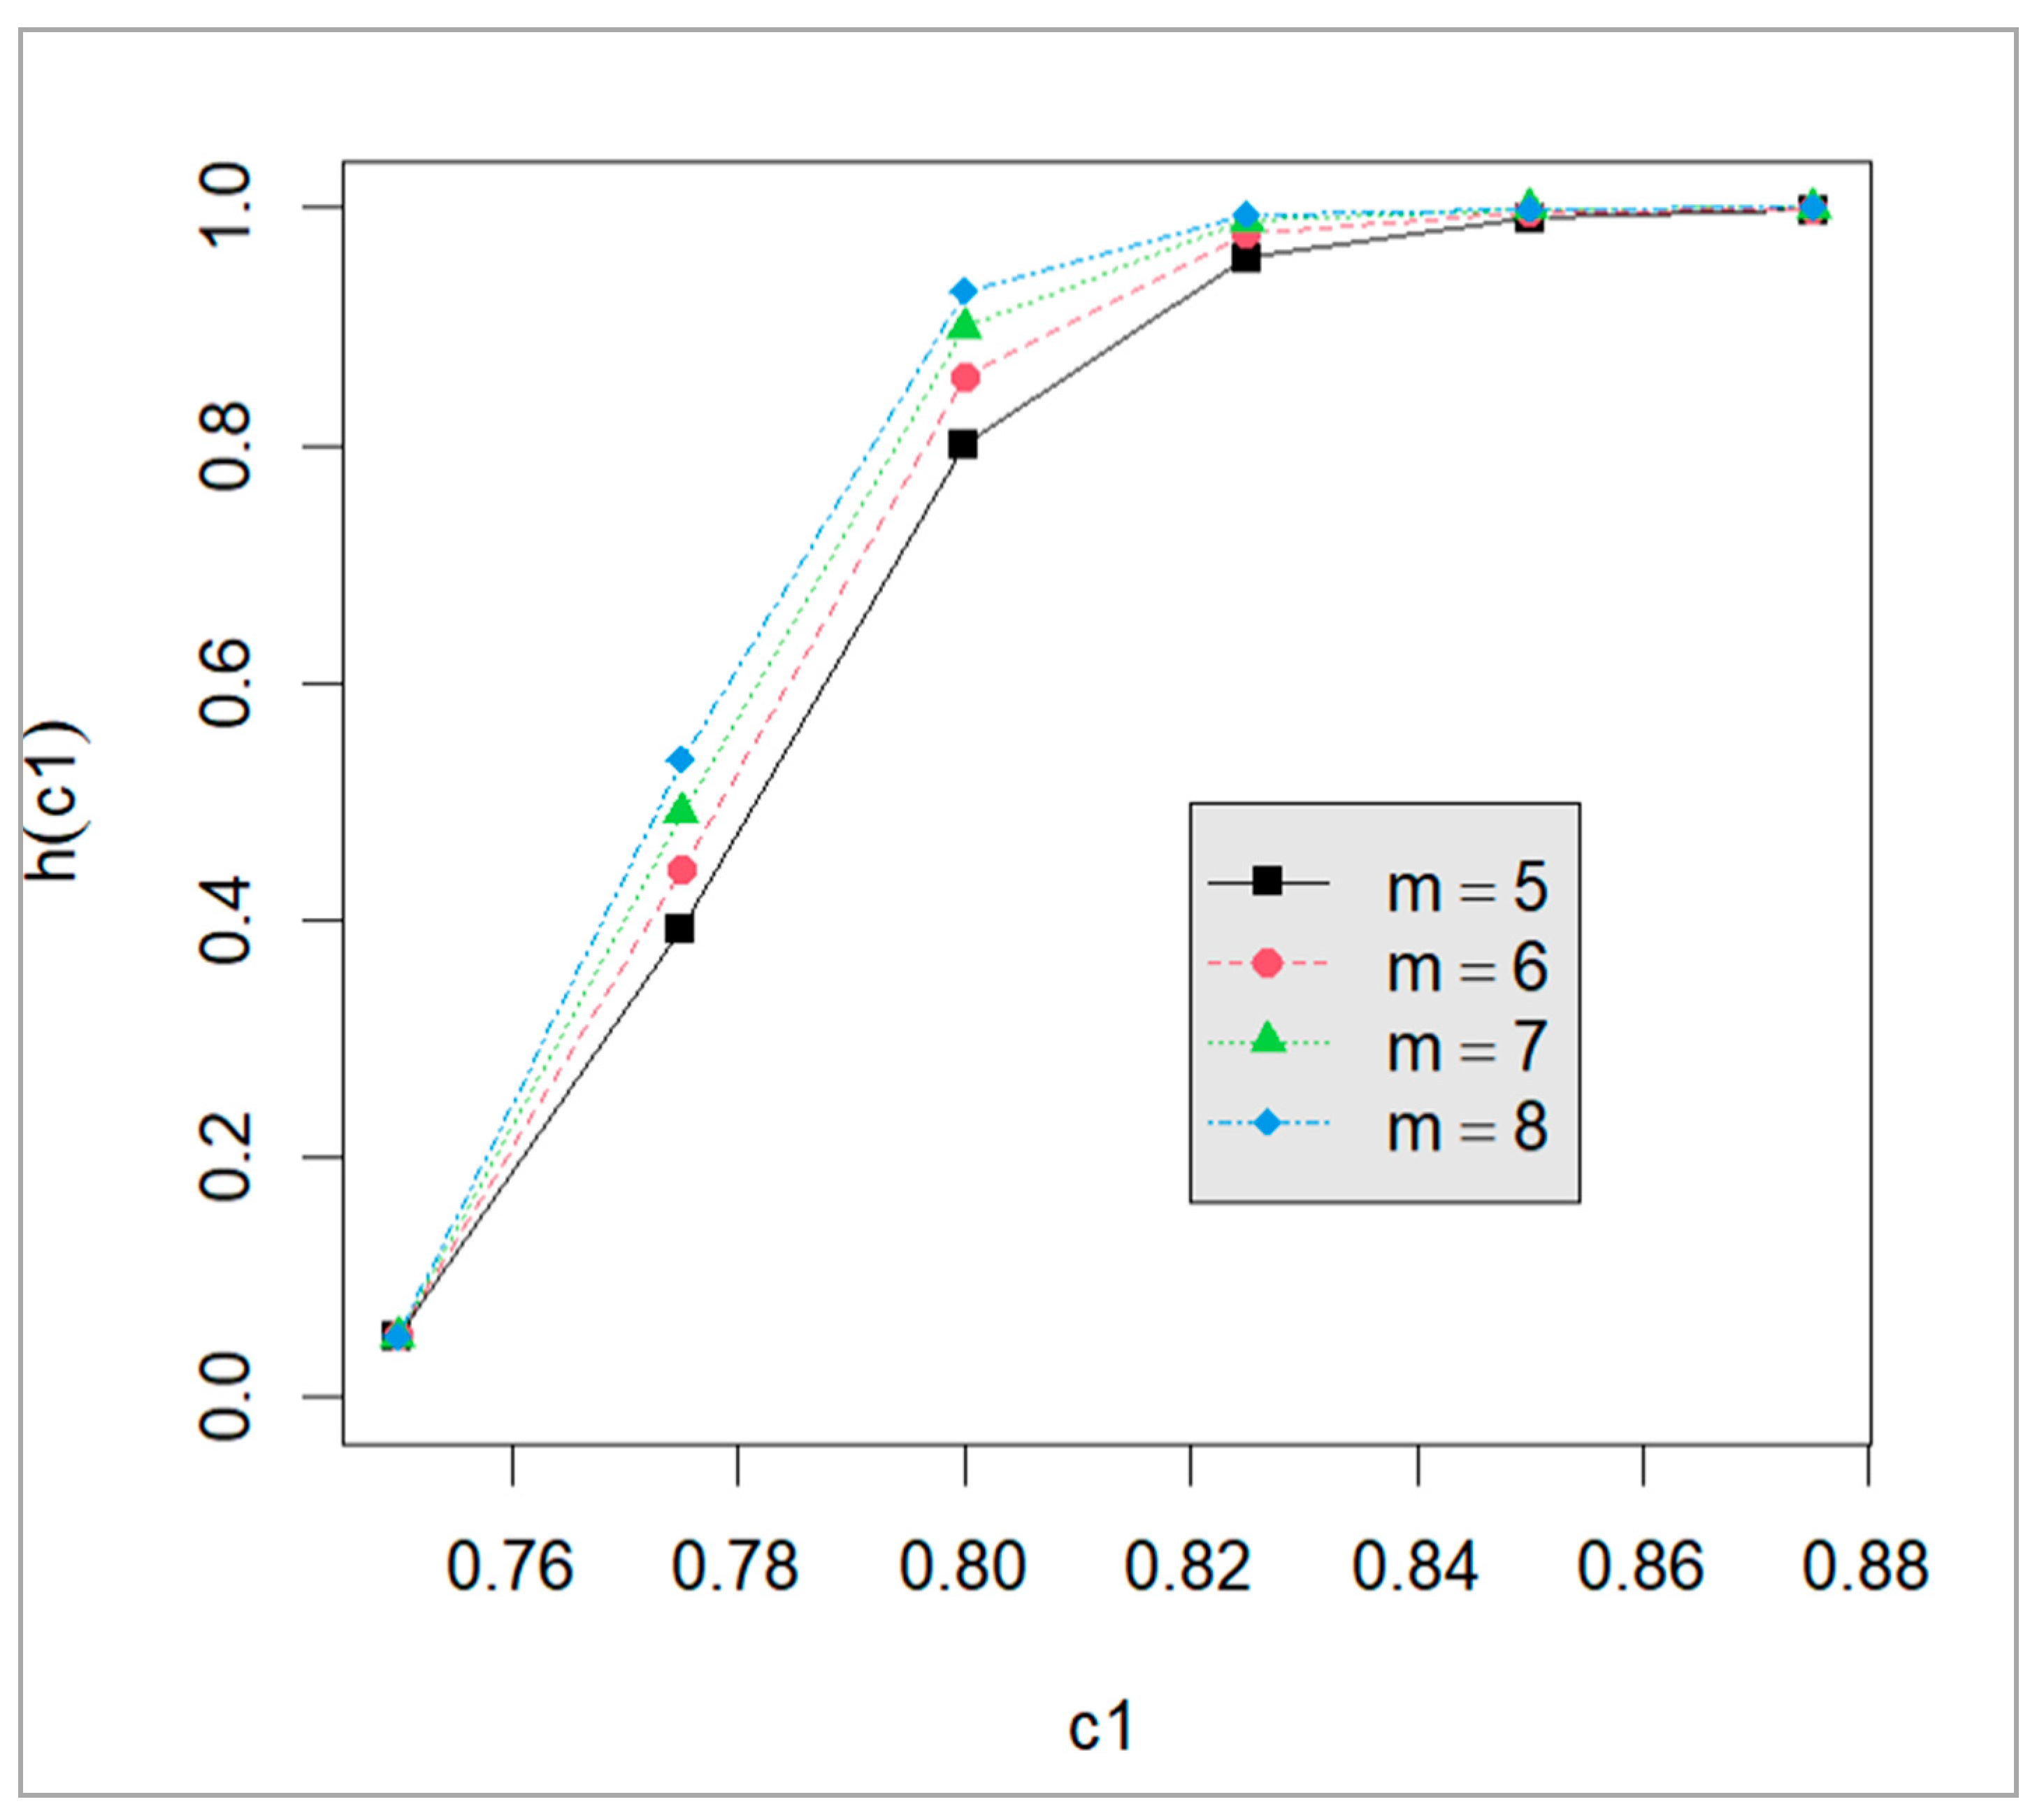
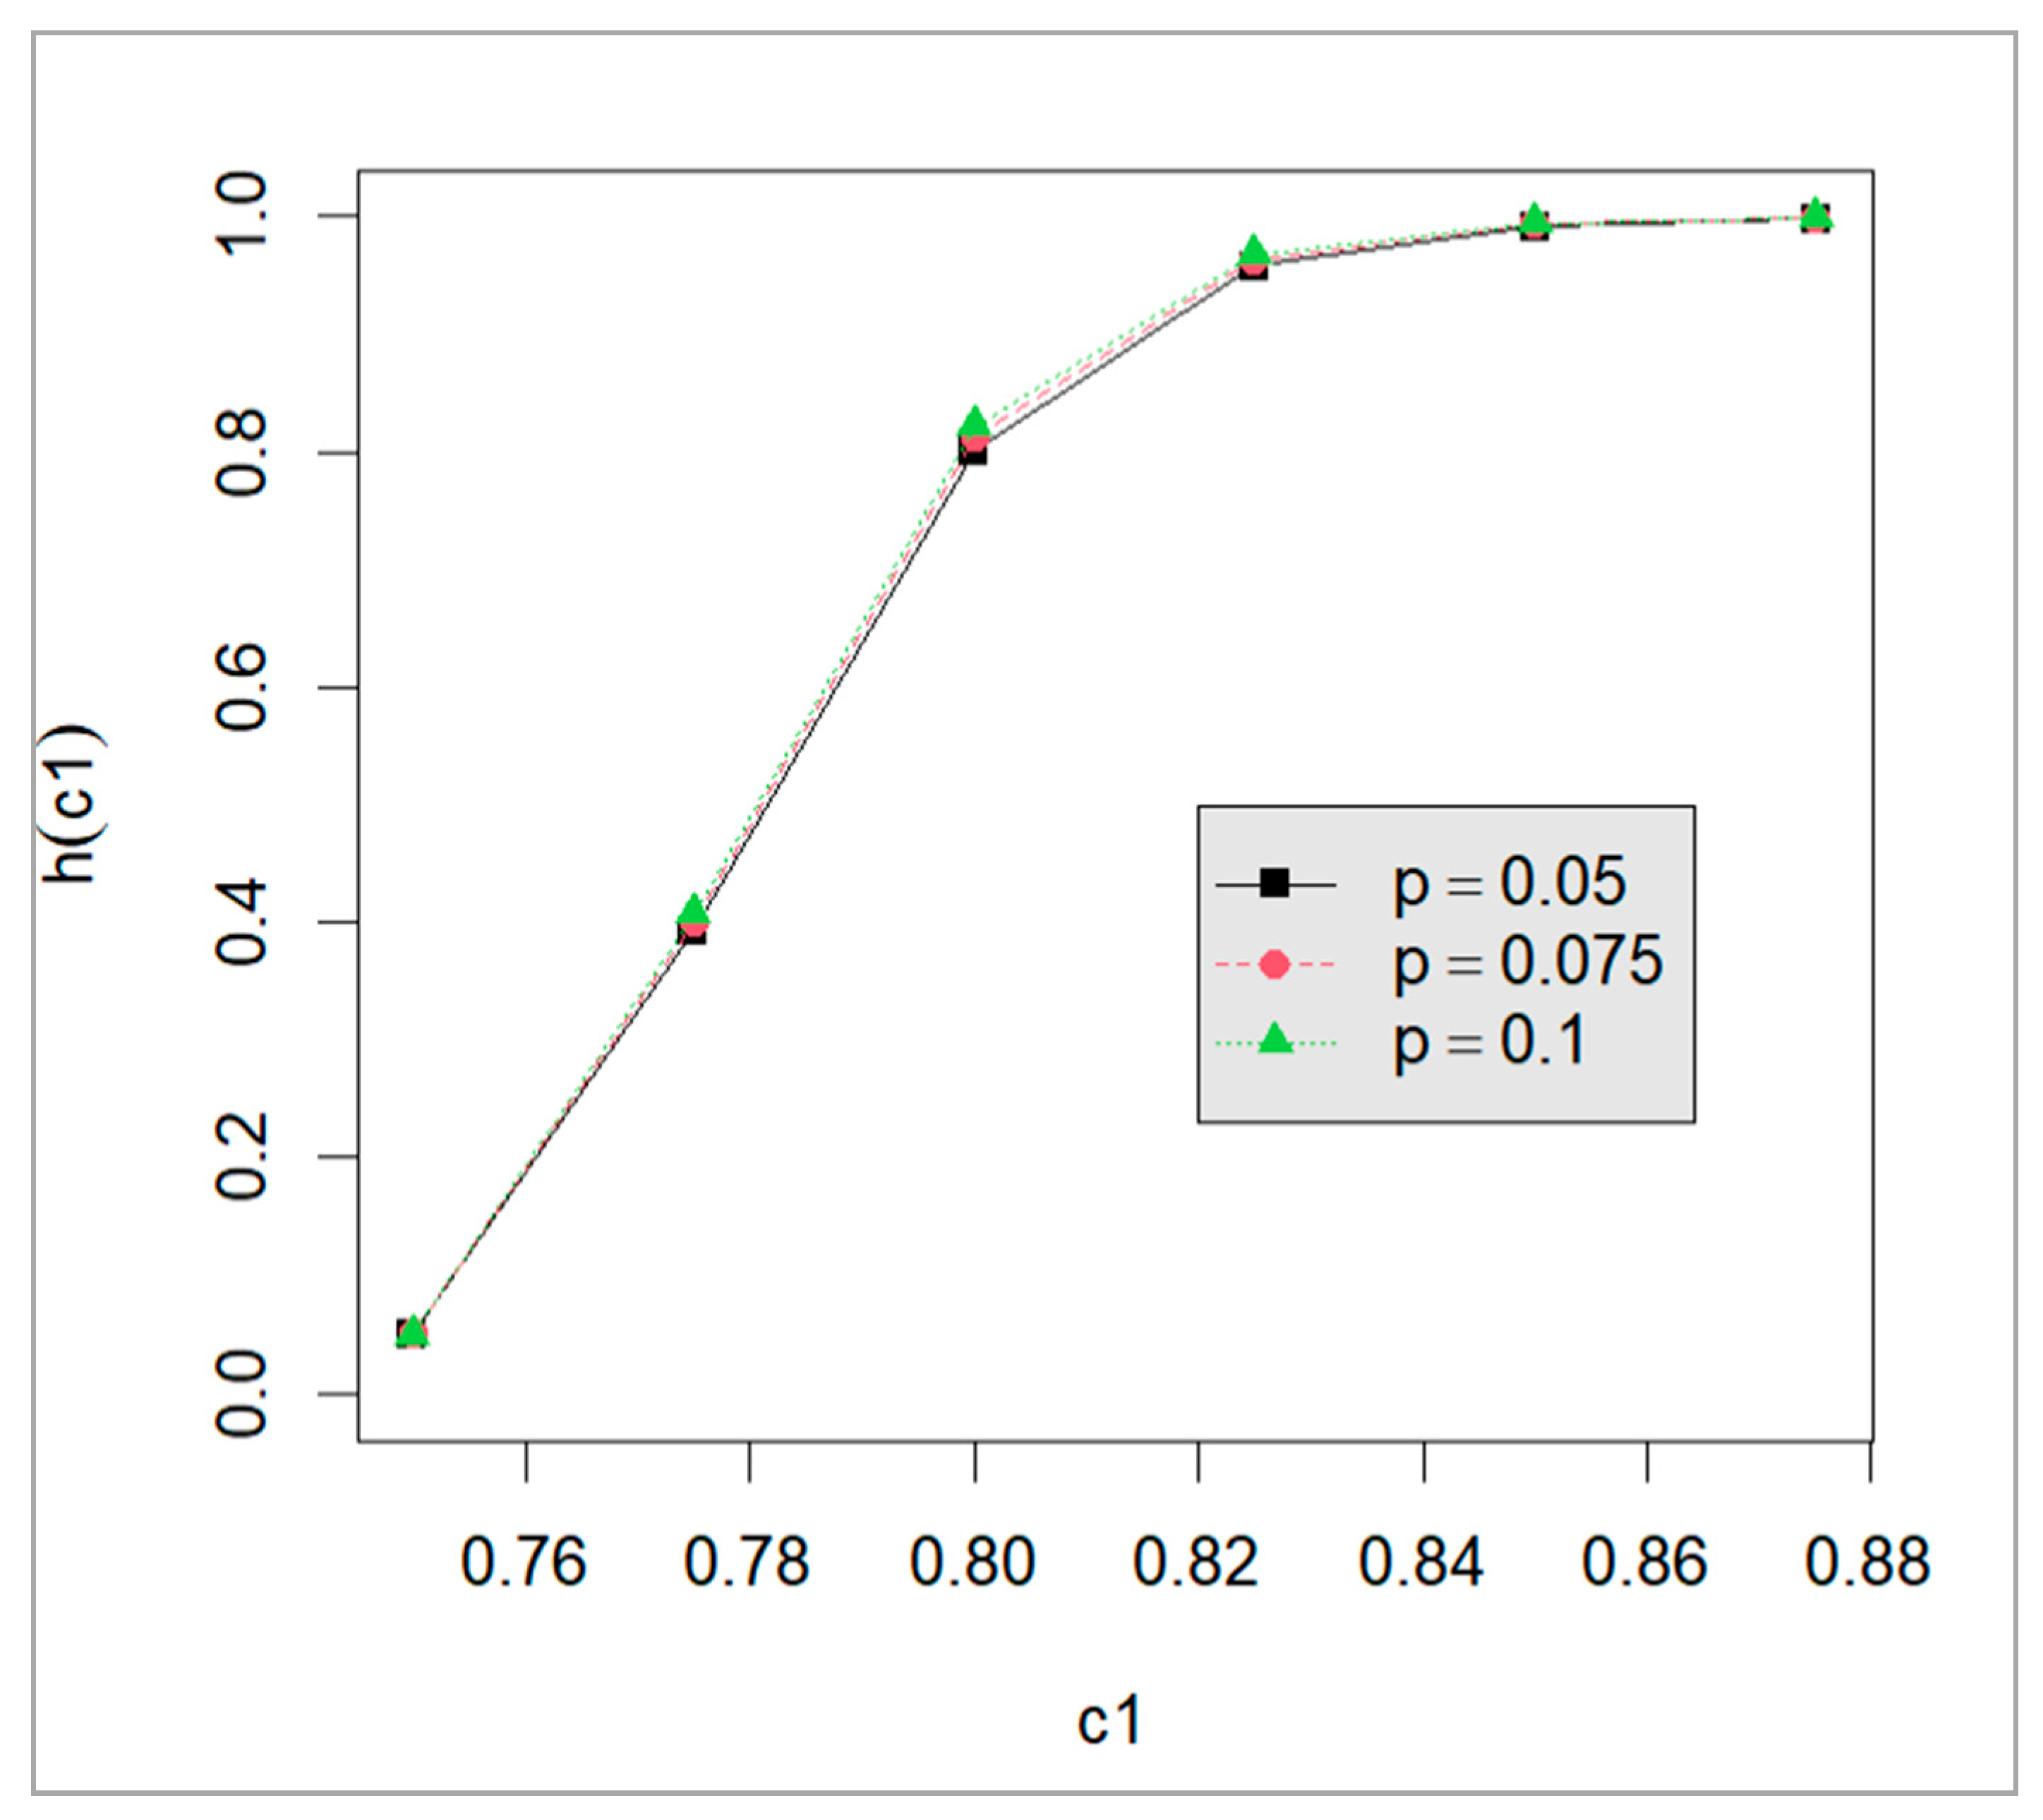
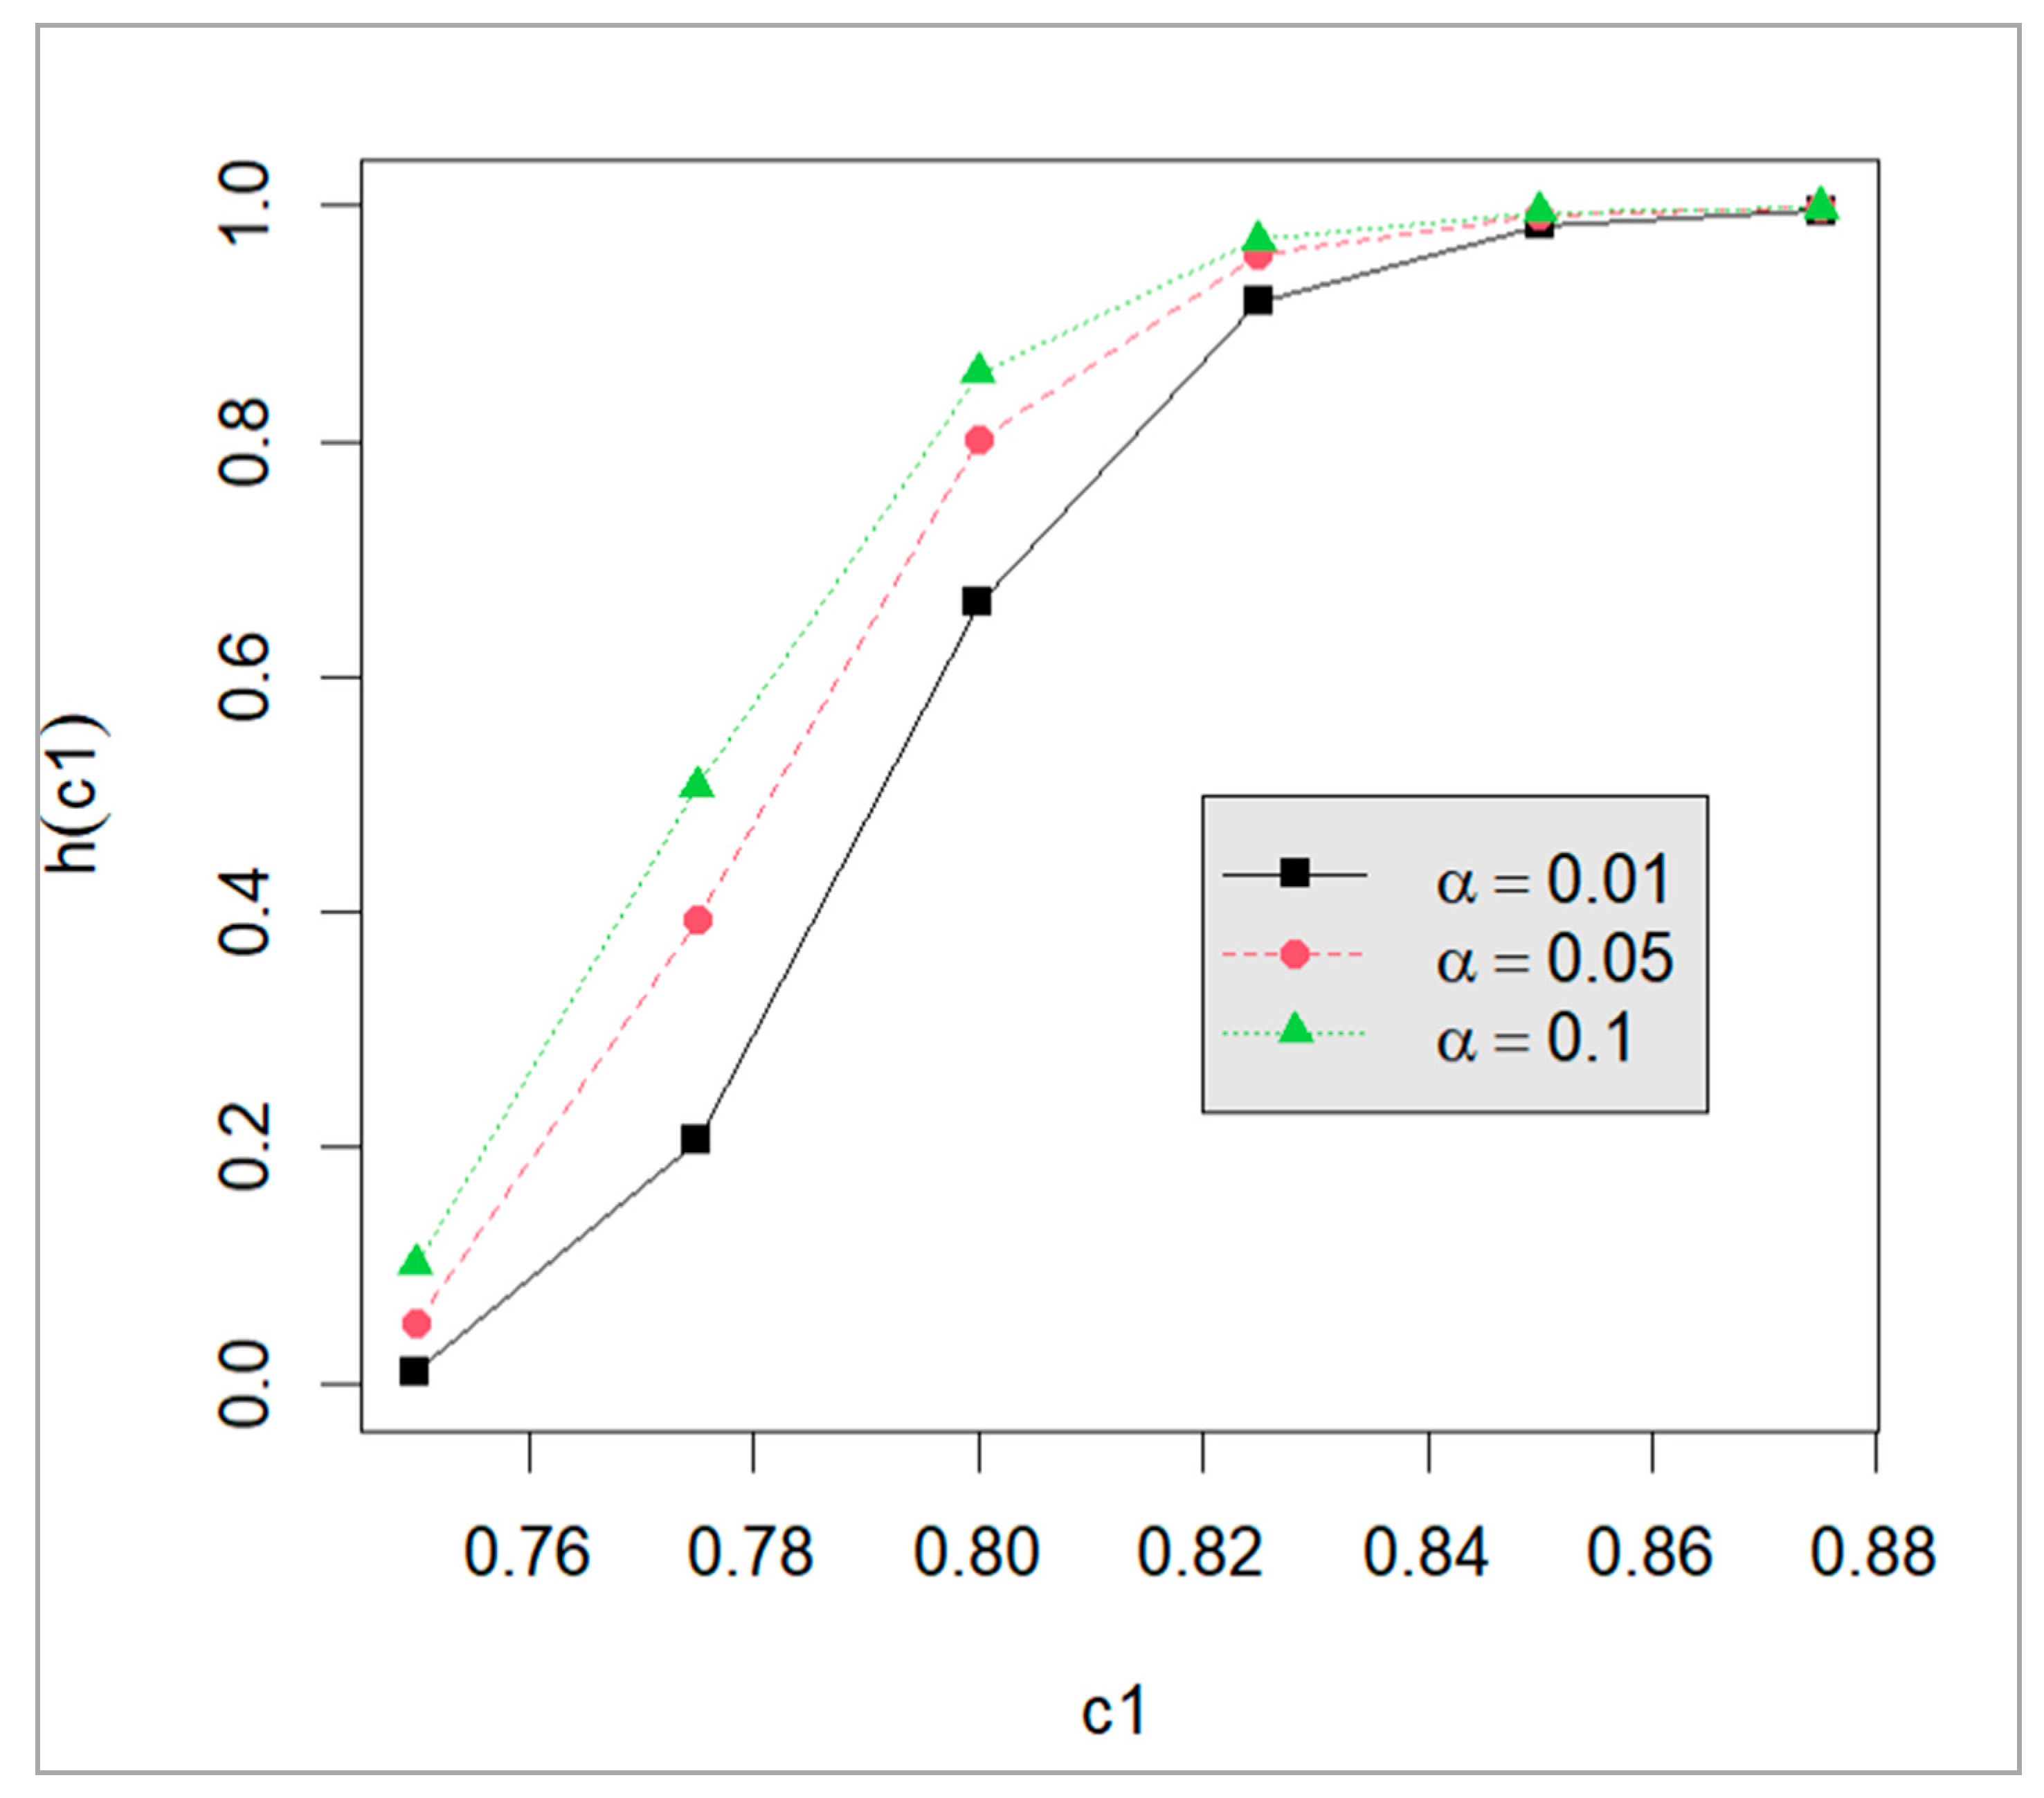

| Failure Times for Component 1 (Y1j) | Failure Times for Component 2 (Y2j ) | ||||||||
|---|---|---|---|---|---|---|---|---|---|
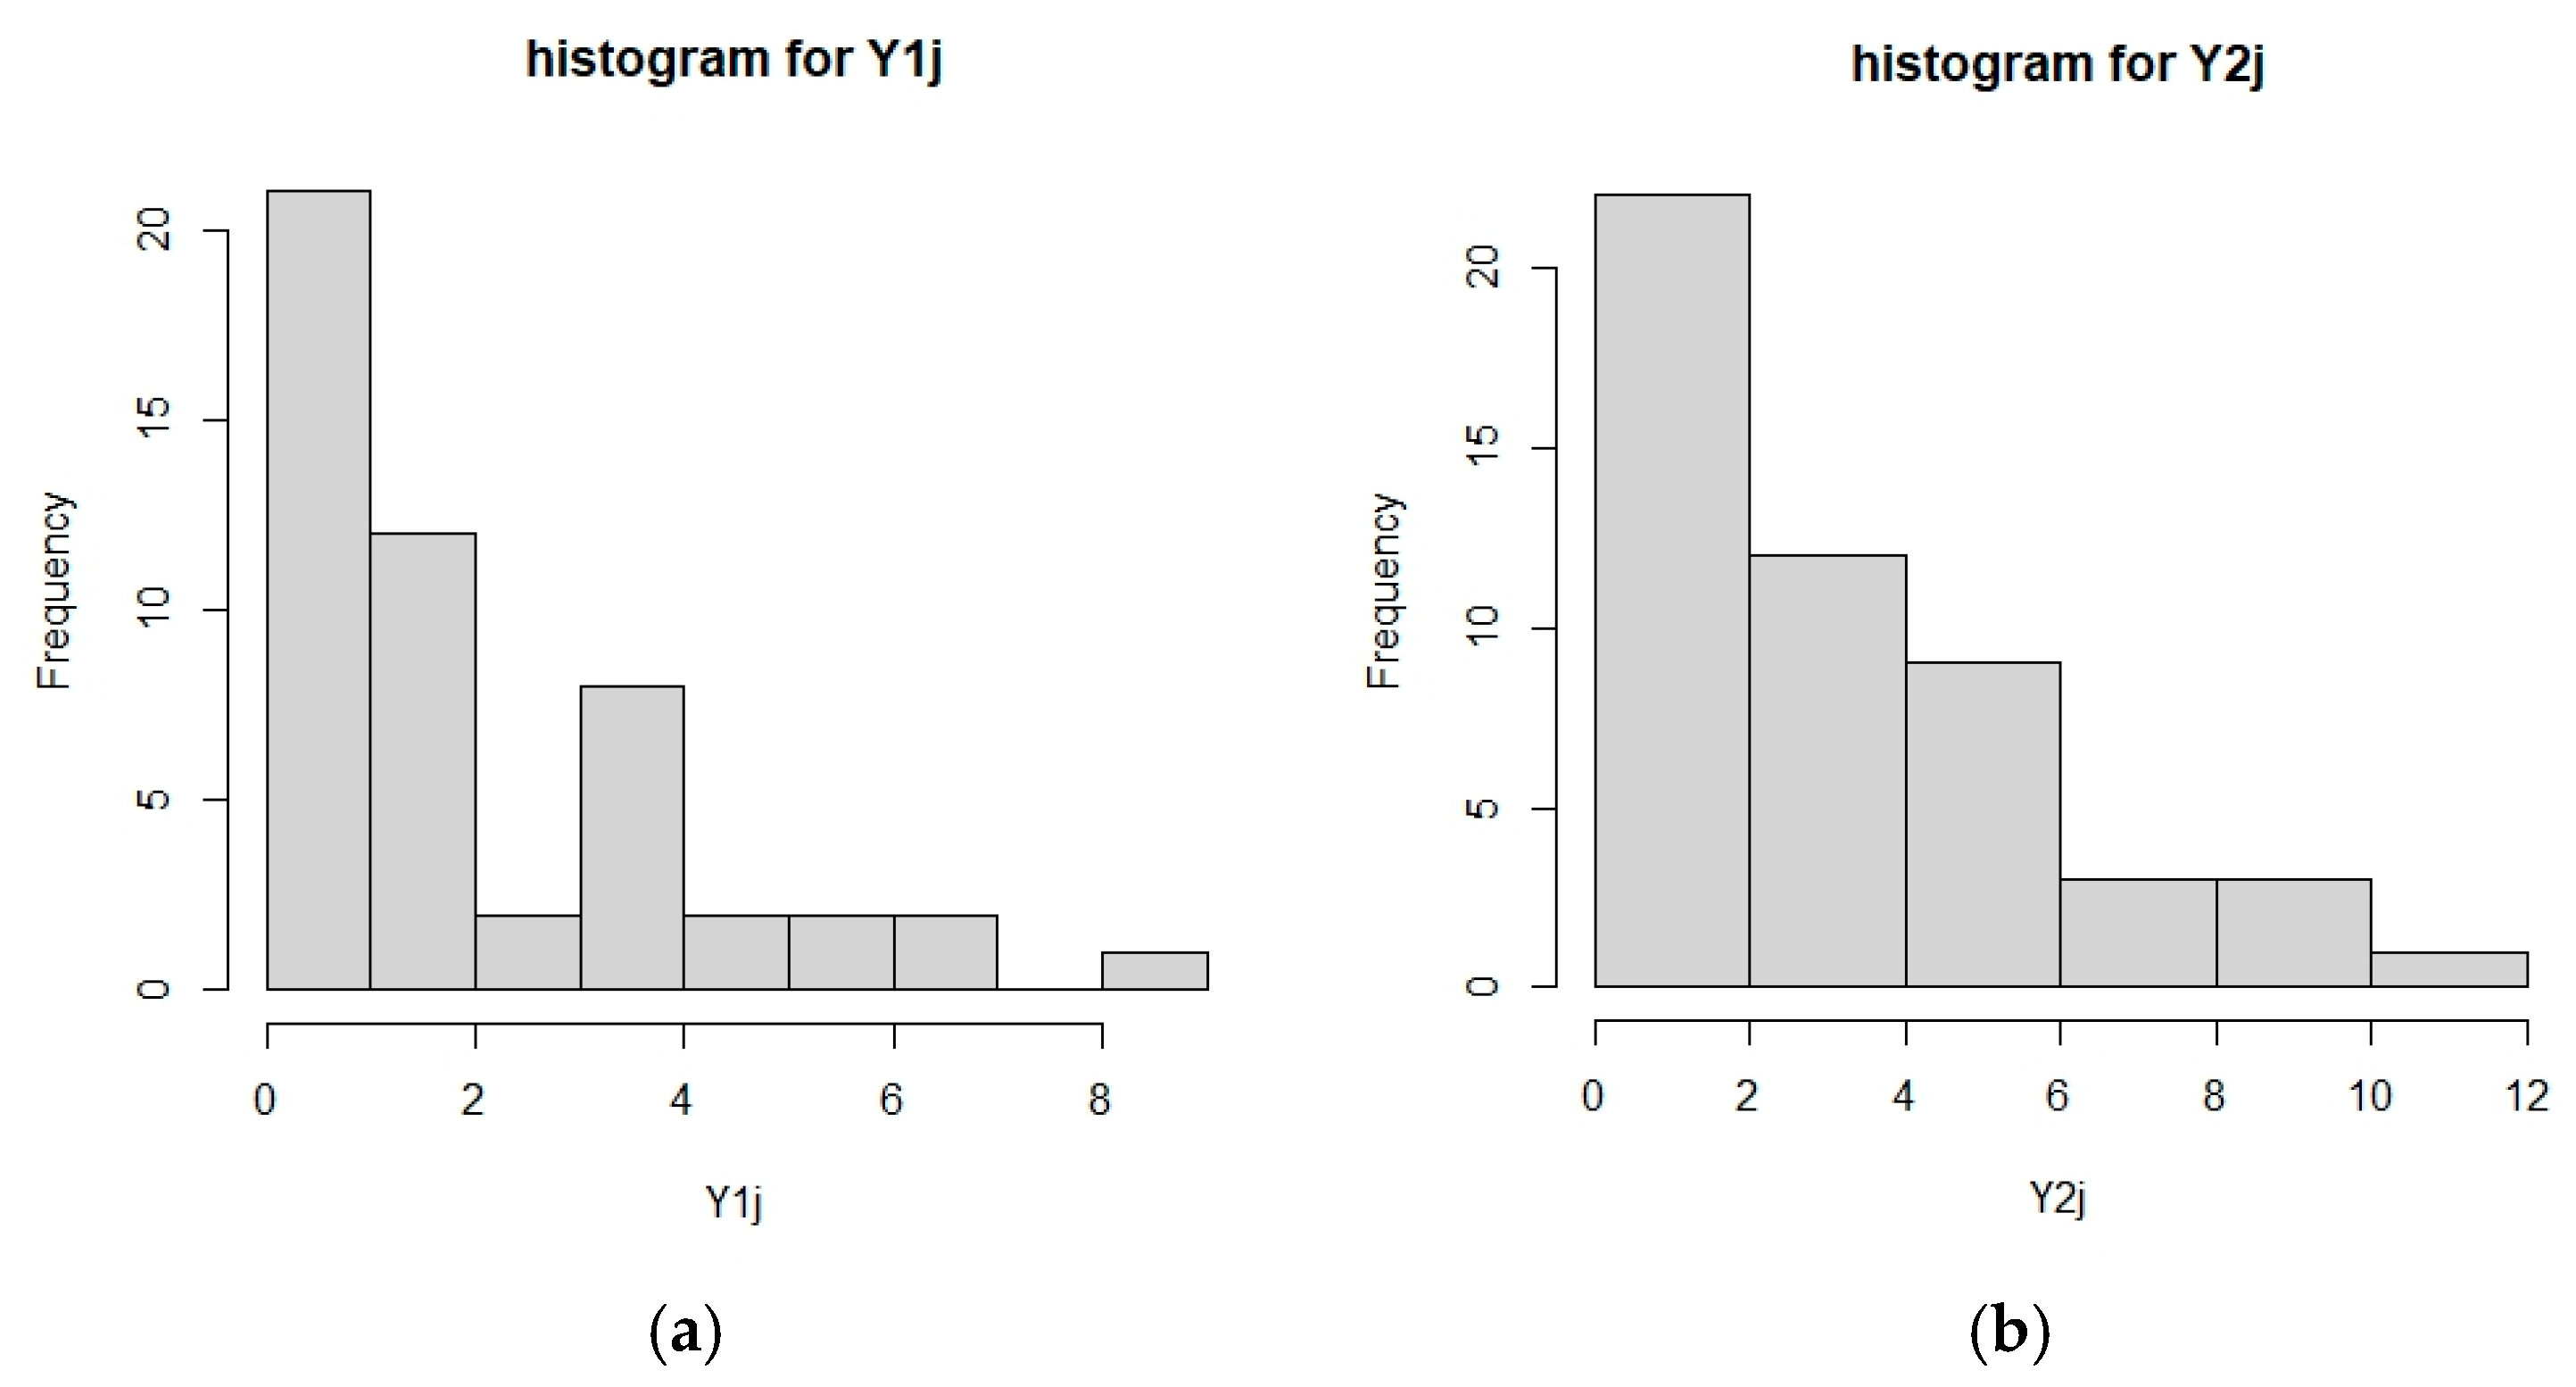
| 0.0080 | 0.0132 | 0.0157 | 0.0182 | 0.0292 | 0.0195 | 0.0695 | 0.2533 | 0.3460 | 0.3905 |
| 0.0342 | 0.0580 | 0.0635 | 0.0768 | 0.1771 | 0.3958 | 0.4754 | 0.4880 | 0.5056 | 0.5231 |
| 0.1799 | 0.1977 | 0.2583 | 0.4052 | 0.4873 | 0.5805 | 0.5865 | 0.6114 | 0.6464 | 0.7810 |
| 0.4935 | 0.6740 | 0.7084 | 0.7671 | 0.7744 | 0.7905 | 0.8238 | 0.9727 | 1.0454 | 1.2530 |
| 0.8691 | 1.0387 | 1.4568 | 1.4886 | 1.5209 | 1.4496 | 1.5437 | 2.1598 | 2.2307 | 2.2562 |
| 1.6284 | 1.6482 | 1.6761 | 1.7539 | 1.8511 | 2.3209 | 2.4425 | 2.6818 | 2.7416 | 2.7939 |
| 1.8638 | 1.8809 | 1.9514 | 2.0245 | 2.4604 | 2.8218 | 2.9721 | 2.9828 | 2.9876 | 4.1560 |
| 3.1922 | 3.2206 | 3.3173 | 3.4855 | 3.5014 | 4.2173 | 4.2780 | 4.3176 | 4.3686 | 4.3768 |
| 3.6701 | 3.7602 | 3.9926 | 4.1792 | 4.4006 | 4.8804 | 4.9996 | 5.8671 | 6.0596 | 7.1819 |
| 5.0035 | 5.0376 | 6.1049 | 6.8506 | 8.6491 | 7.7860 | 8.0752 | 8.2921 | 8.7216 | 11.0411 |
| Failure Times for Component 1 (Y1j ) | Failure Times for Component 2 (Y2j ) | ||||||||
|---|---|---|---|---|---|---|---|---|---|
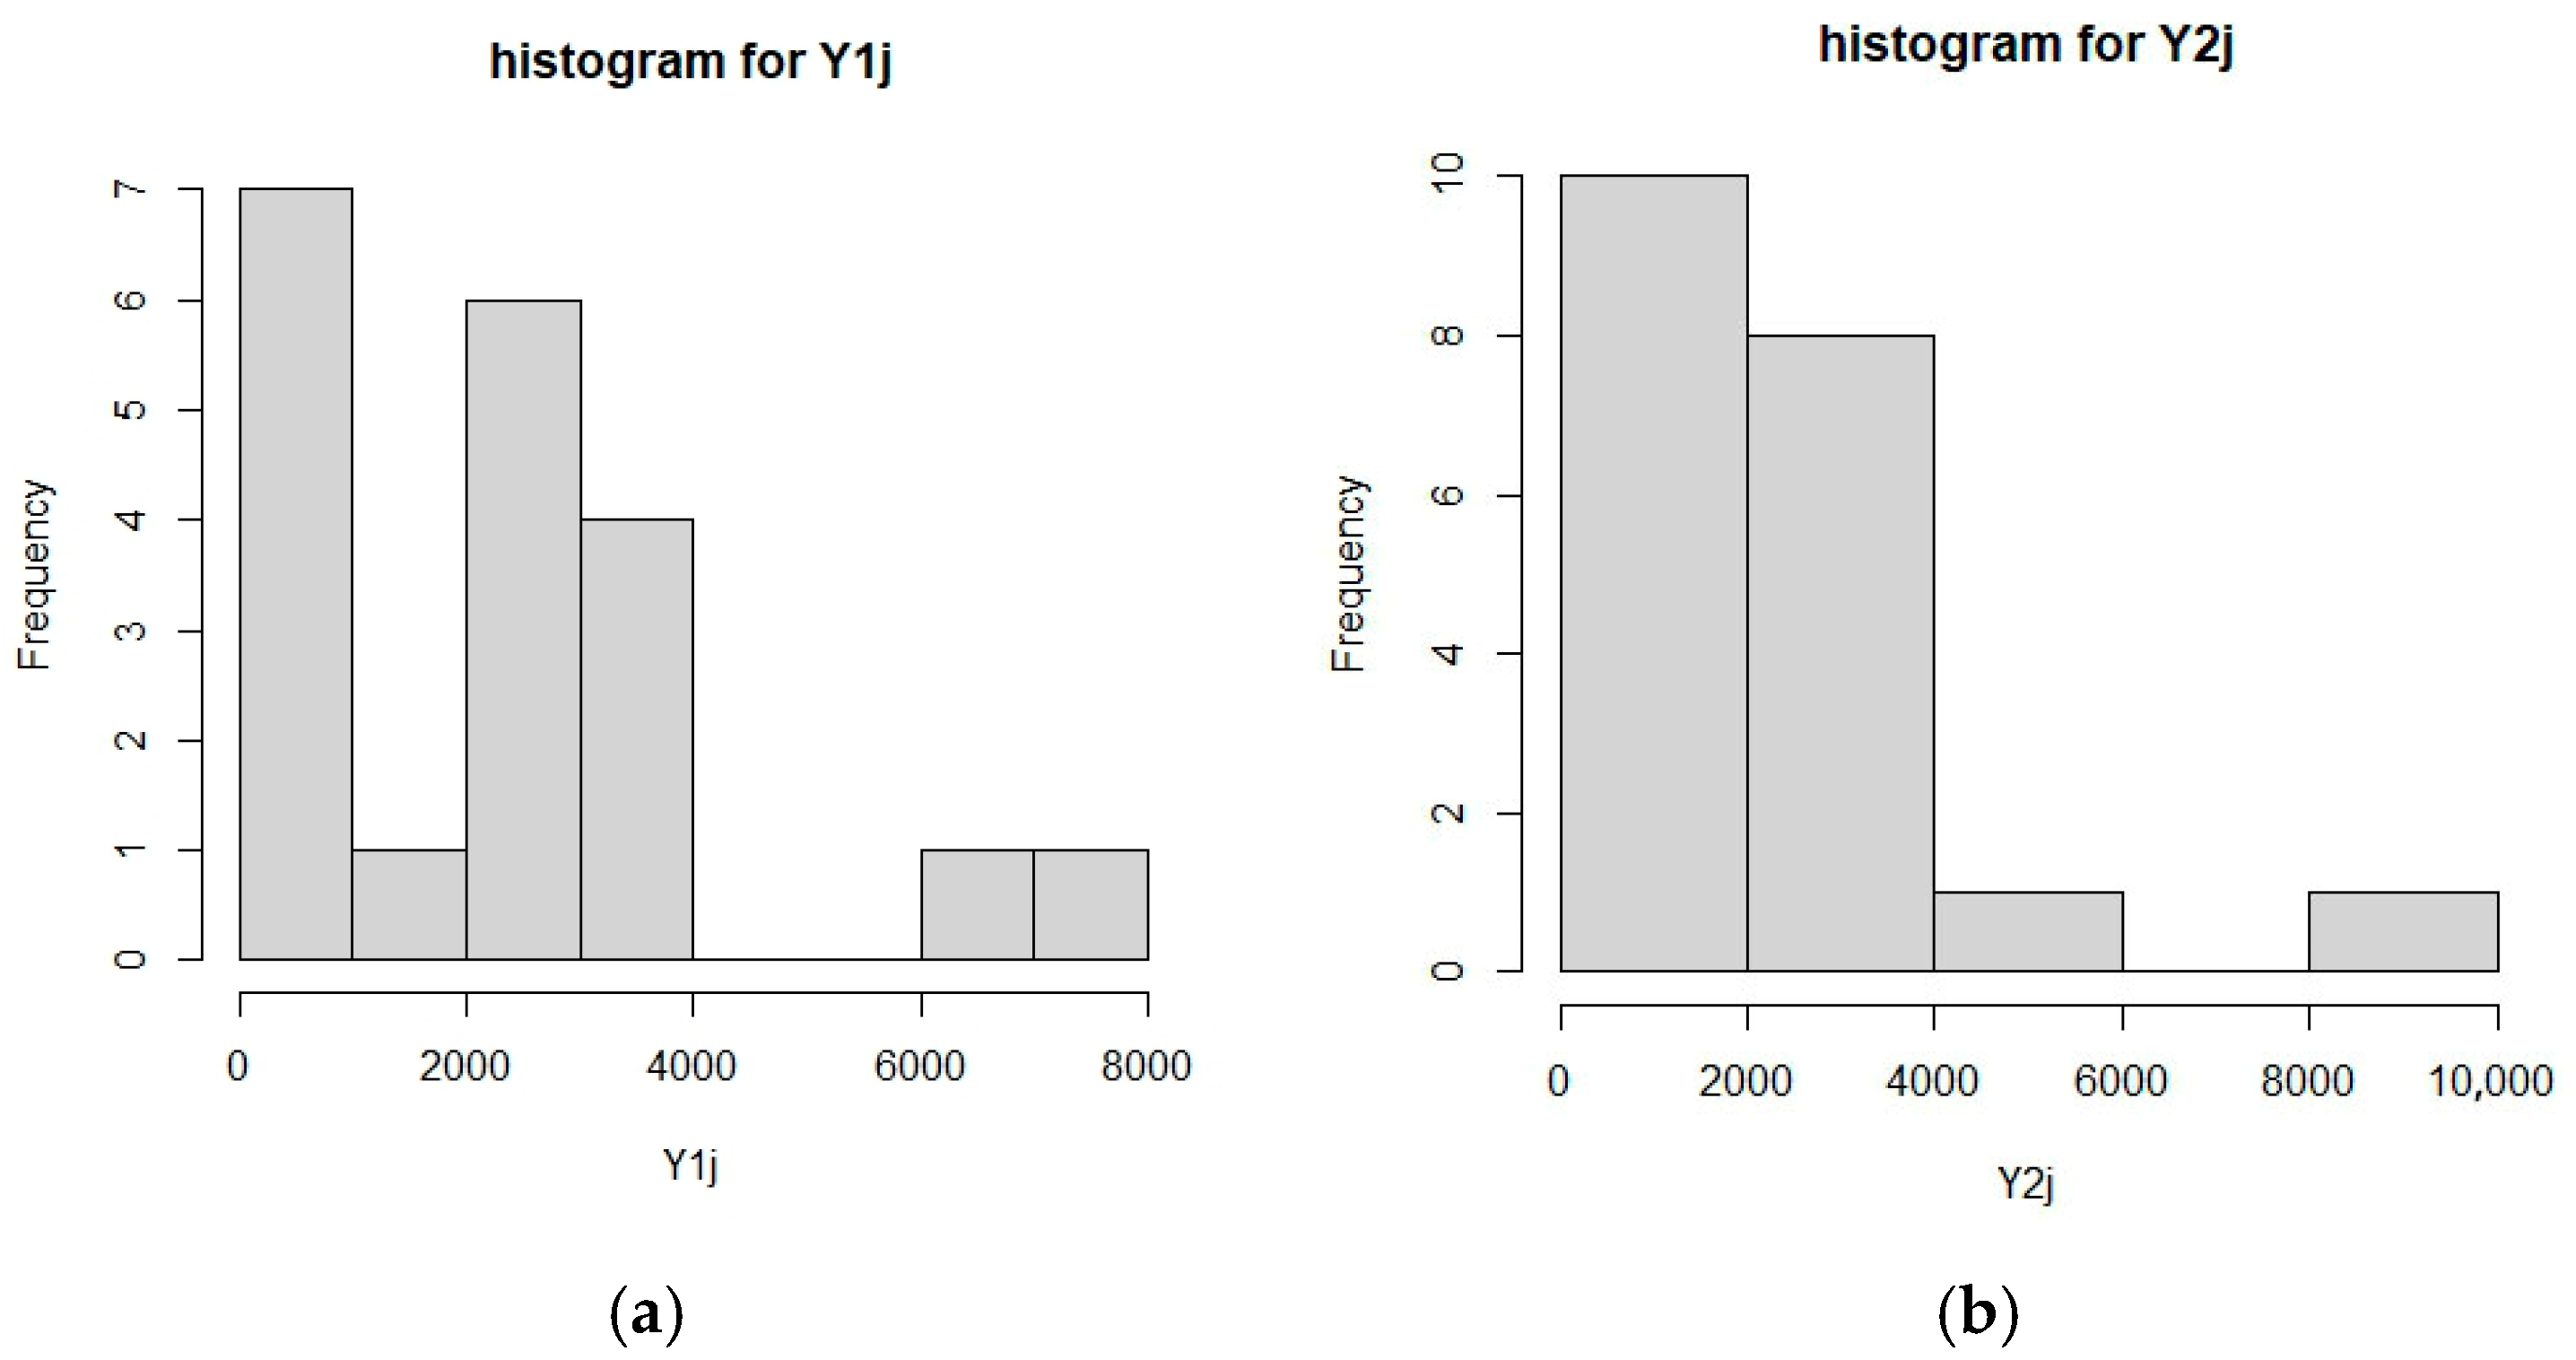
| 35 | 49 | 170 | 329 | 381 | 34 | 59 | 69 | 142 | 574 |
| 708 | 958 | 1062 | 2223 | 2327 | 1064 | 1174 | 1578 | 1702 | 1893 |
| 2400 | 2565 | 2702 | 2761 | 3034 | 2292 | 2785 | 2811 | 2886 | 2993 |
| 3112 | 3214 | 3504 | 6976 | 7846 | 3122 | 3790 | 3857 | 5267 | 9701 |
Disclaimer/Publisher’s Note: The statements, opinions and data contained in all publications are solely those of the individual author(s) and contributor(s) and not of MDPI and/or the editor(s). MDPI and/or the editor(s) disclaim responsibility for any injury to people or property resulting from any ideas, methods, instructions or products referred to in the content. |
© 2025 by the authors. Licensee MDPI, Basel, Switzerland. This article is an open access article distributed under the terms and conditions of the Creative Commons Attribution (CC BY) license (https://creativecommons.org/licenses/by/4.0/).
Share and Cite
Wu, S.-F.; Hsu, C.-C. Computational Testing Procedure for the Overall Lifetime Performance Index of Multi-Component Exponentially Distributed Products. Stats 2025, 8, 104. https://doi.org/10.3390/stats8040104
Wu S-F, Hsu C-C. Computational Testing Procedure for the Overall Lifetime Performance Index of Multi-Component Exponentially Distributed Products. Stats. 2025; 8(4):104. https://doi.org/10.3390/stats8040104
Chicago/Turabian StyleWu, Shu-Fei, and Chia-Chi Hsu. 2025. "Computational Testing Procedure for the Overall Lifetime Performance Index of Multi-Component Exponentially Distributed Products" Stats 8, no. 4: 104. https://doi.org/10.3390/stats8040104
APA StyleWu, S.-F., & Hsu, C.-C. (2025). Computational Testing Procedure for the Overall Lifetime Performance Index of Multi-Component Exponentially Distributed Products. Stats, 8(4), 104. https://doi.org/10.3390/stats8040104


