

A Cox Proportional Hazards Model with Latent Covariates Reflecting Students’ Preparation, Motives, and Expectations for the Analysis of Time to Degree


Abstract
1. Introduction
1.1. Psychological Perspective—“Students’ Involvement Theory”
1.2. Sociological Perspective—“Integration Model”
1.3. Organizational/Economic Perspectives—“Attrition Model”
1.4. Integrated Perspective—“Combination of Theories”
2. Materials and Methods
2.1. Participants
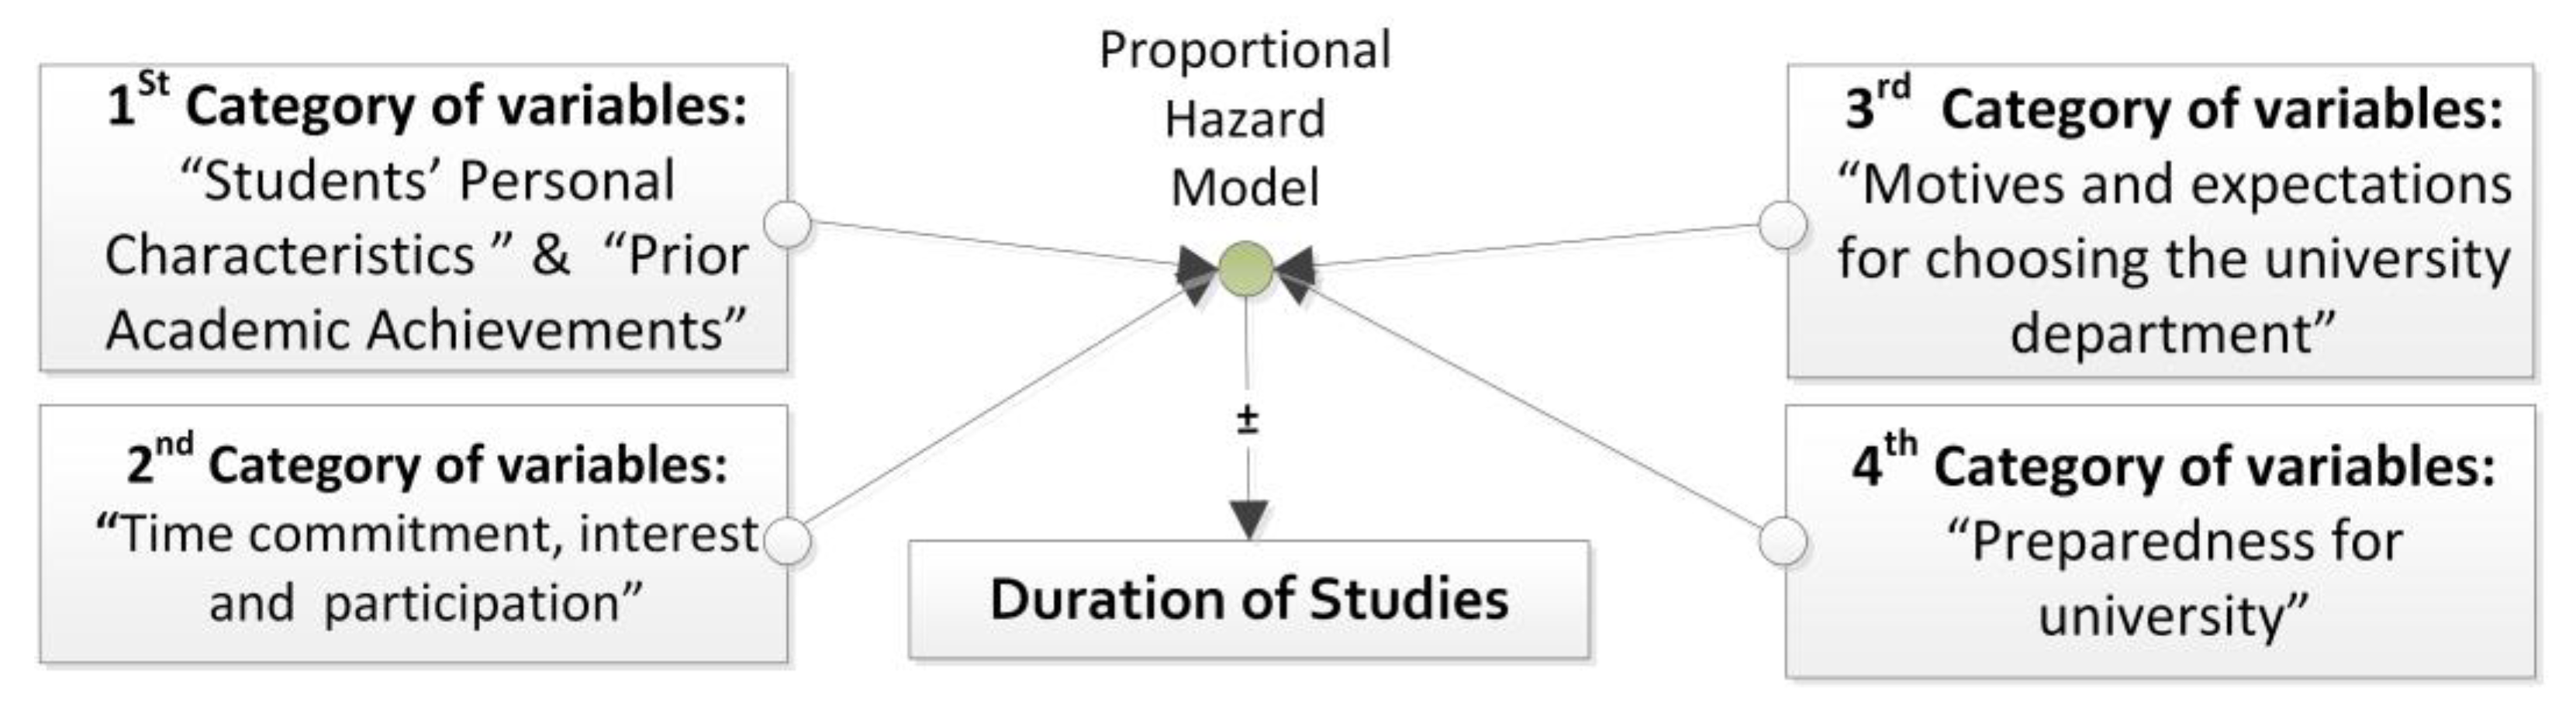
2.2. The Conceptual Model, the Variables, and the Data
- X1.
- Gender: (1, male; 0, female);
- X2.
- Place of Origin: (1, Athens; 0, other);
- X3.
- Students’ Age at the time of university enrolment: (Age of each individual at the time of enrolment at the university);
- X4.
- Secondary school grades: (the score ranges from a 10-minimum grade required for admission to university to 20);
- X5.
- University access score: (it is the mean grade achieved at the university entrance examinations);
- X6.
- Way of admission to the university: (1, General examination; 0, other).
- X7.
- Study habits: (1, Studying throughout the semester; 0, not at all or during examination period);
- X8.
- Attendance: (1, continuously; 0, sometimes or less);
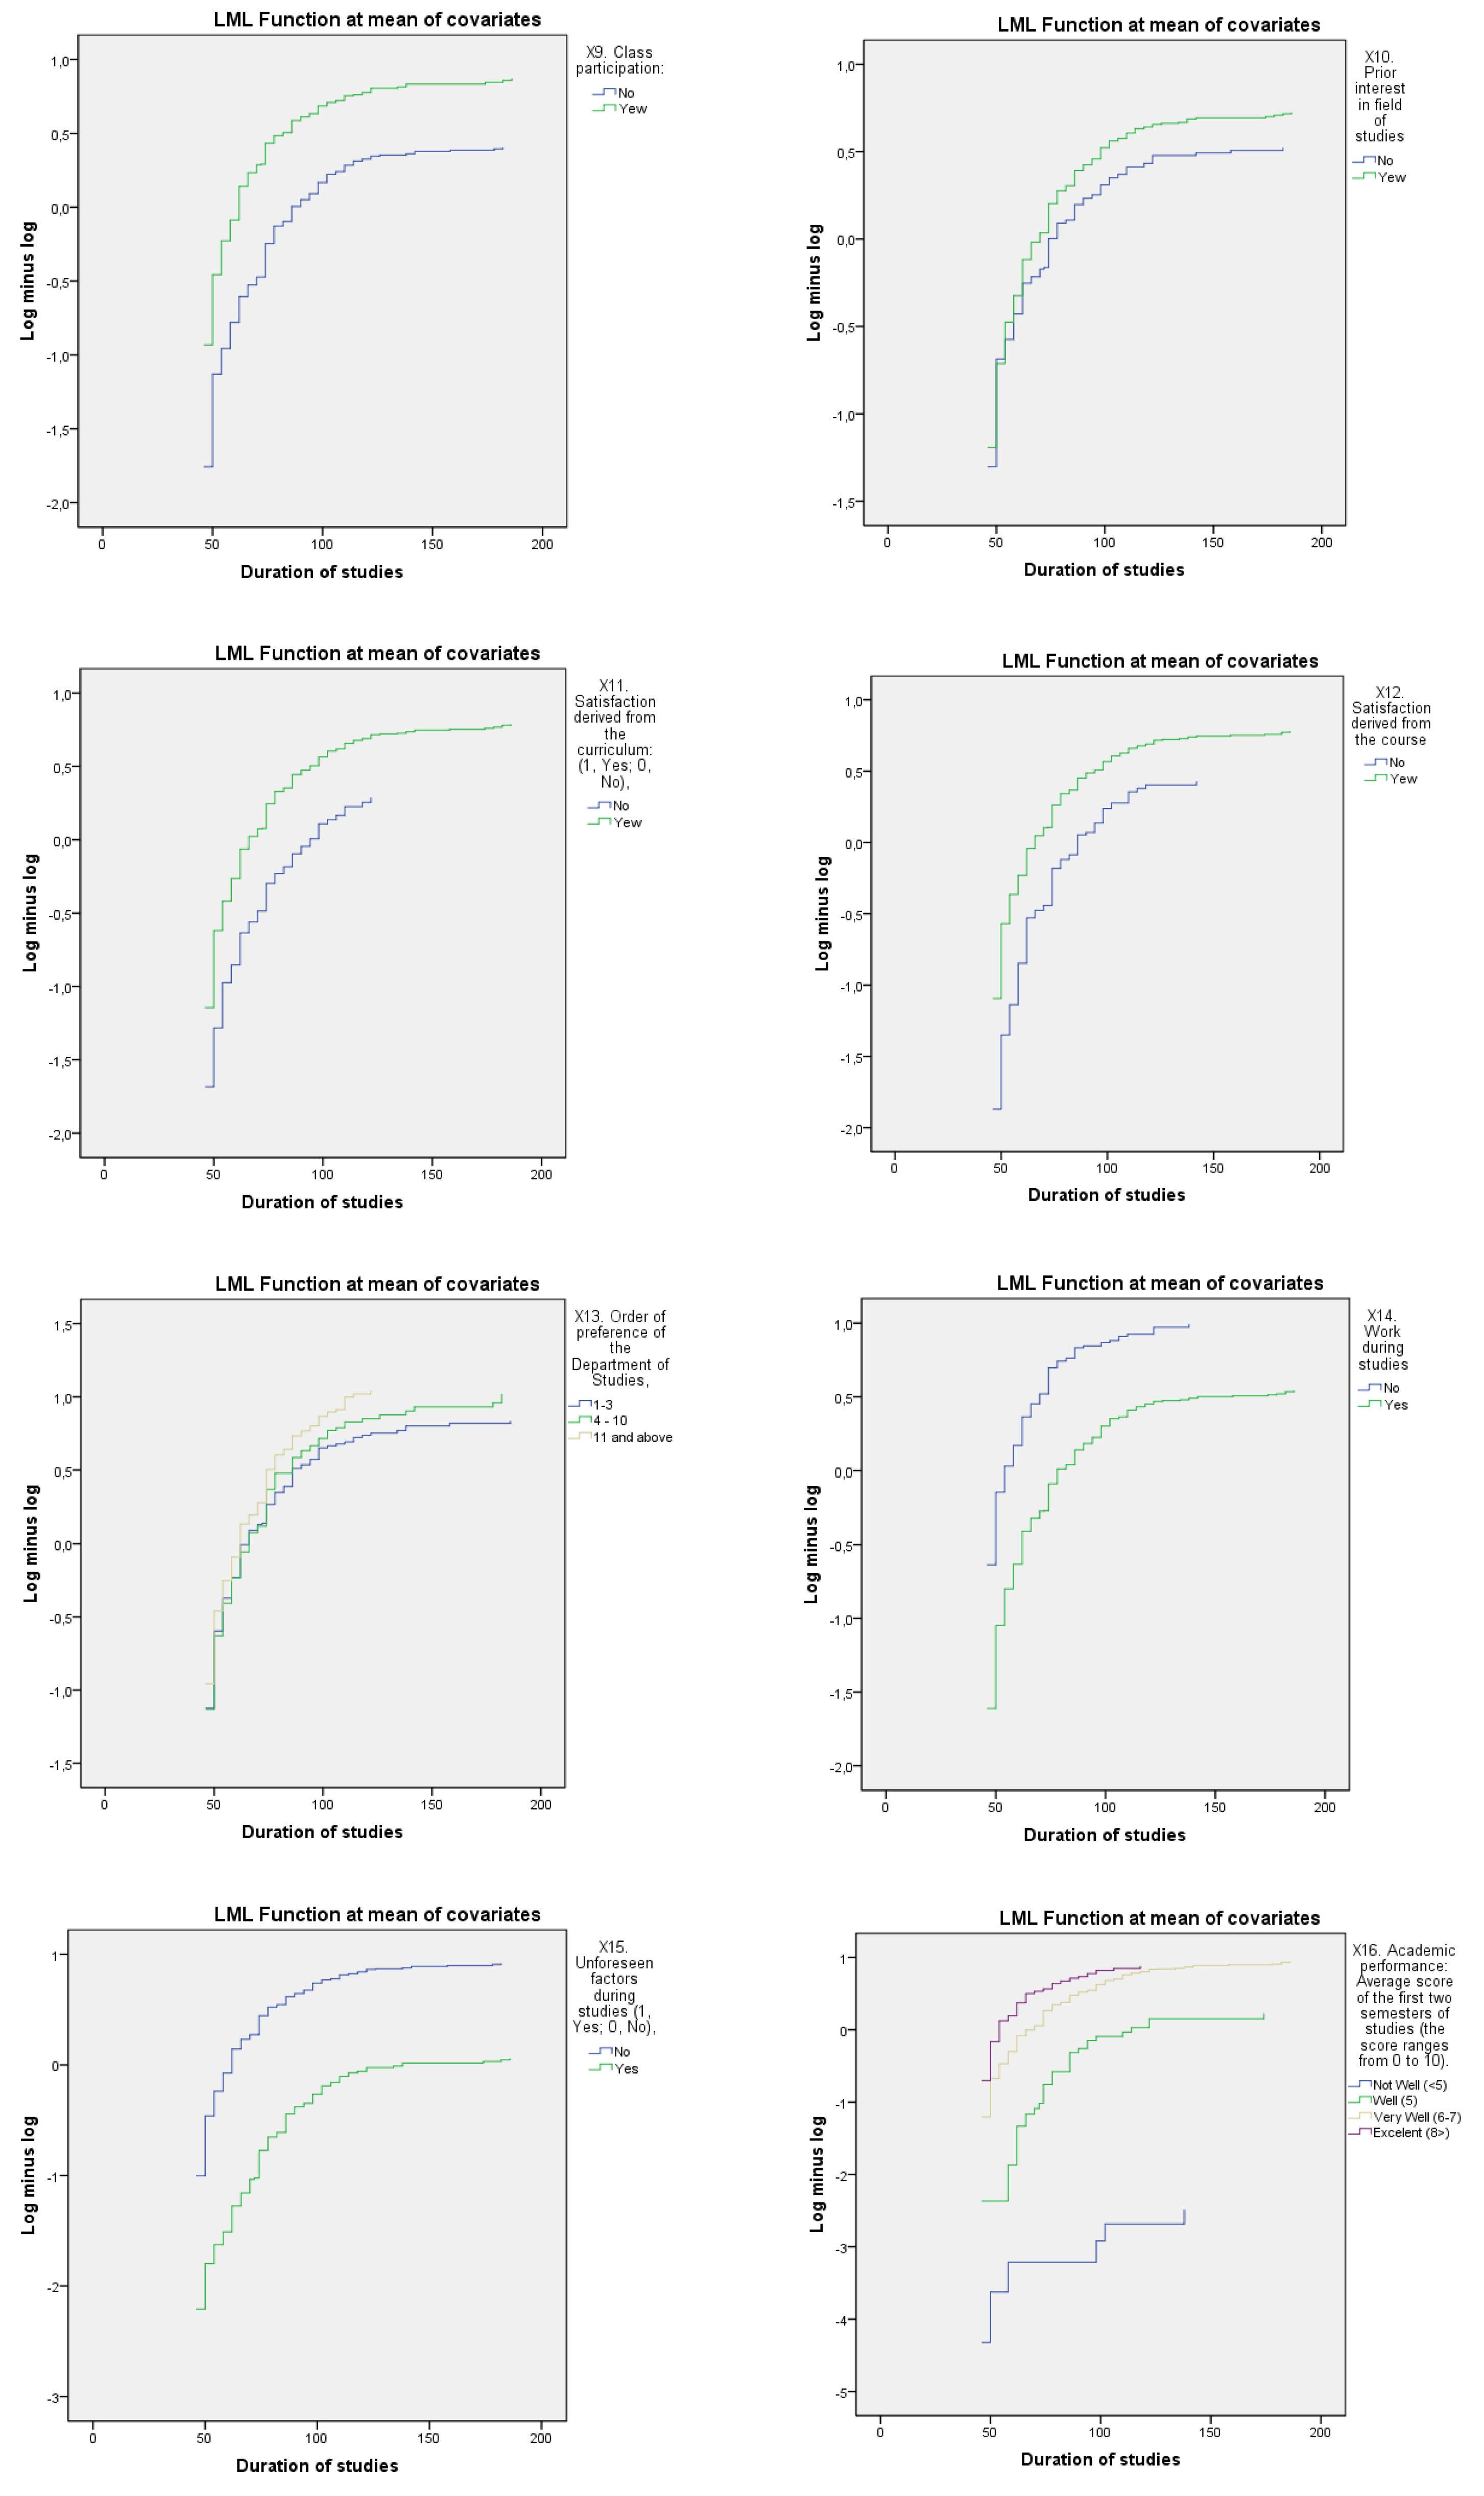
- X9.
- Class participation: (1, Yes; 0, No);
- X10.
- Prior interest in field of studies (1, Yes; 0, No);
- X11.
- Satisfaction derived from the curriculum: (1, Yes; 0, No);
- X12.
- Satisfaction derived from the course (1, Yes; 0, No);
- X13.
- Order of preference of the Department of Studies;
- X14.
- Work during studies (1, Had a job during studies; 0, otherwise);
- X15.
- Unforeseen factors during studies (1, Yes; 0, No);
- X16.
- Academic performance: Average score of the first two semesters of studies (the score ranges from 0 to 10).
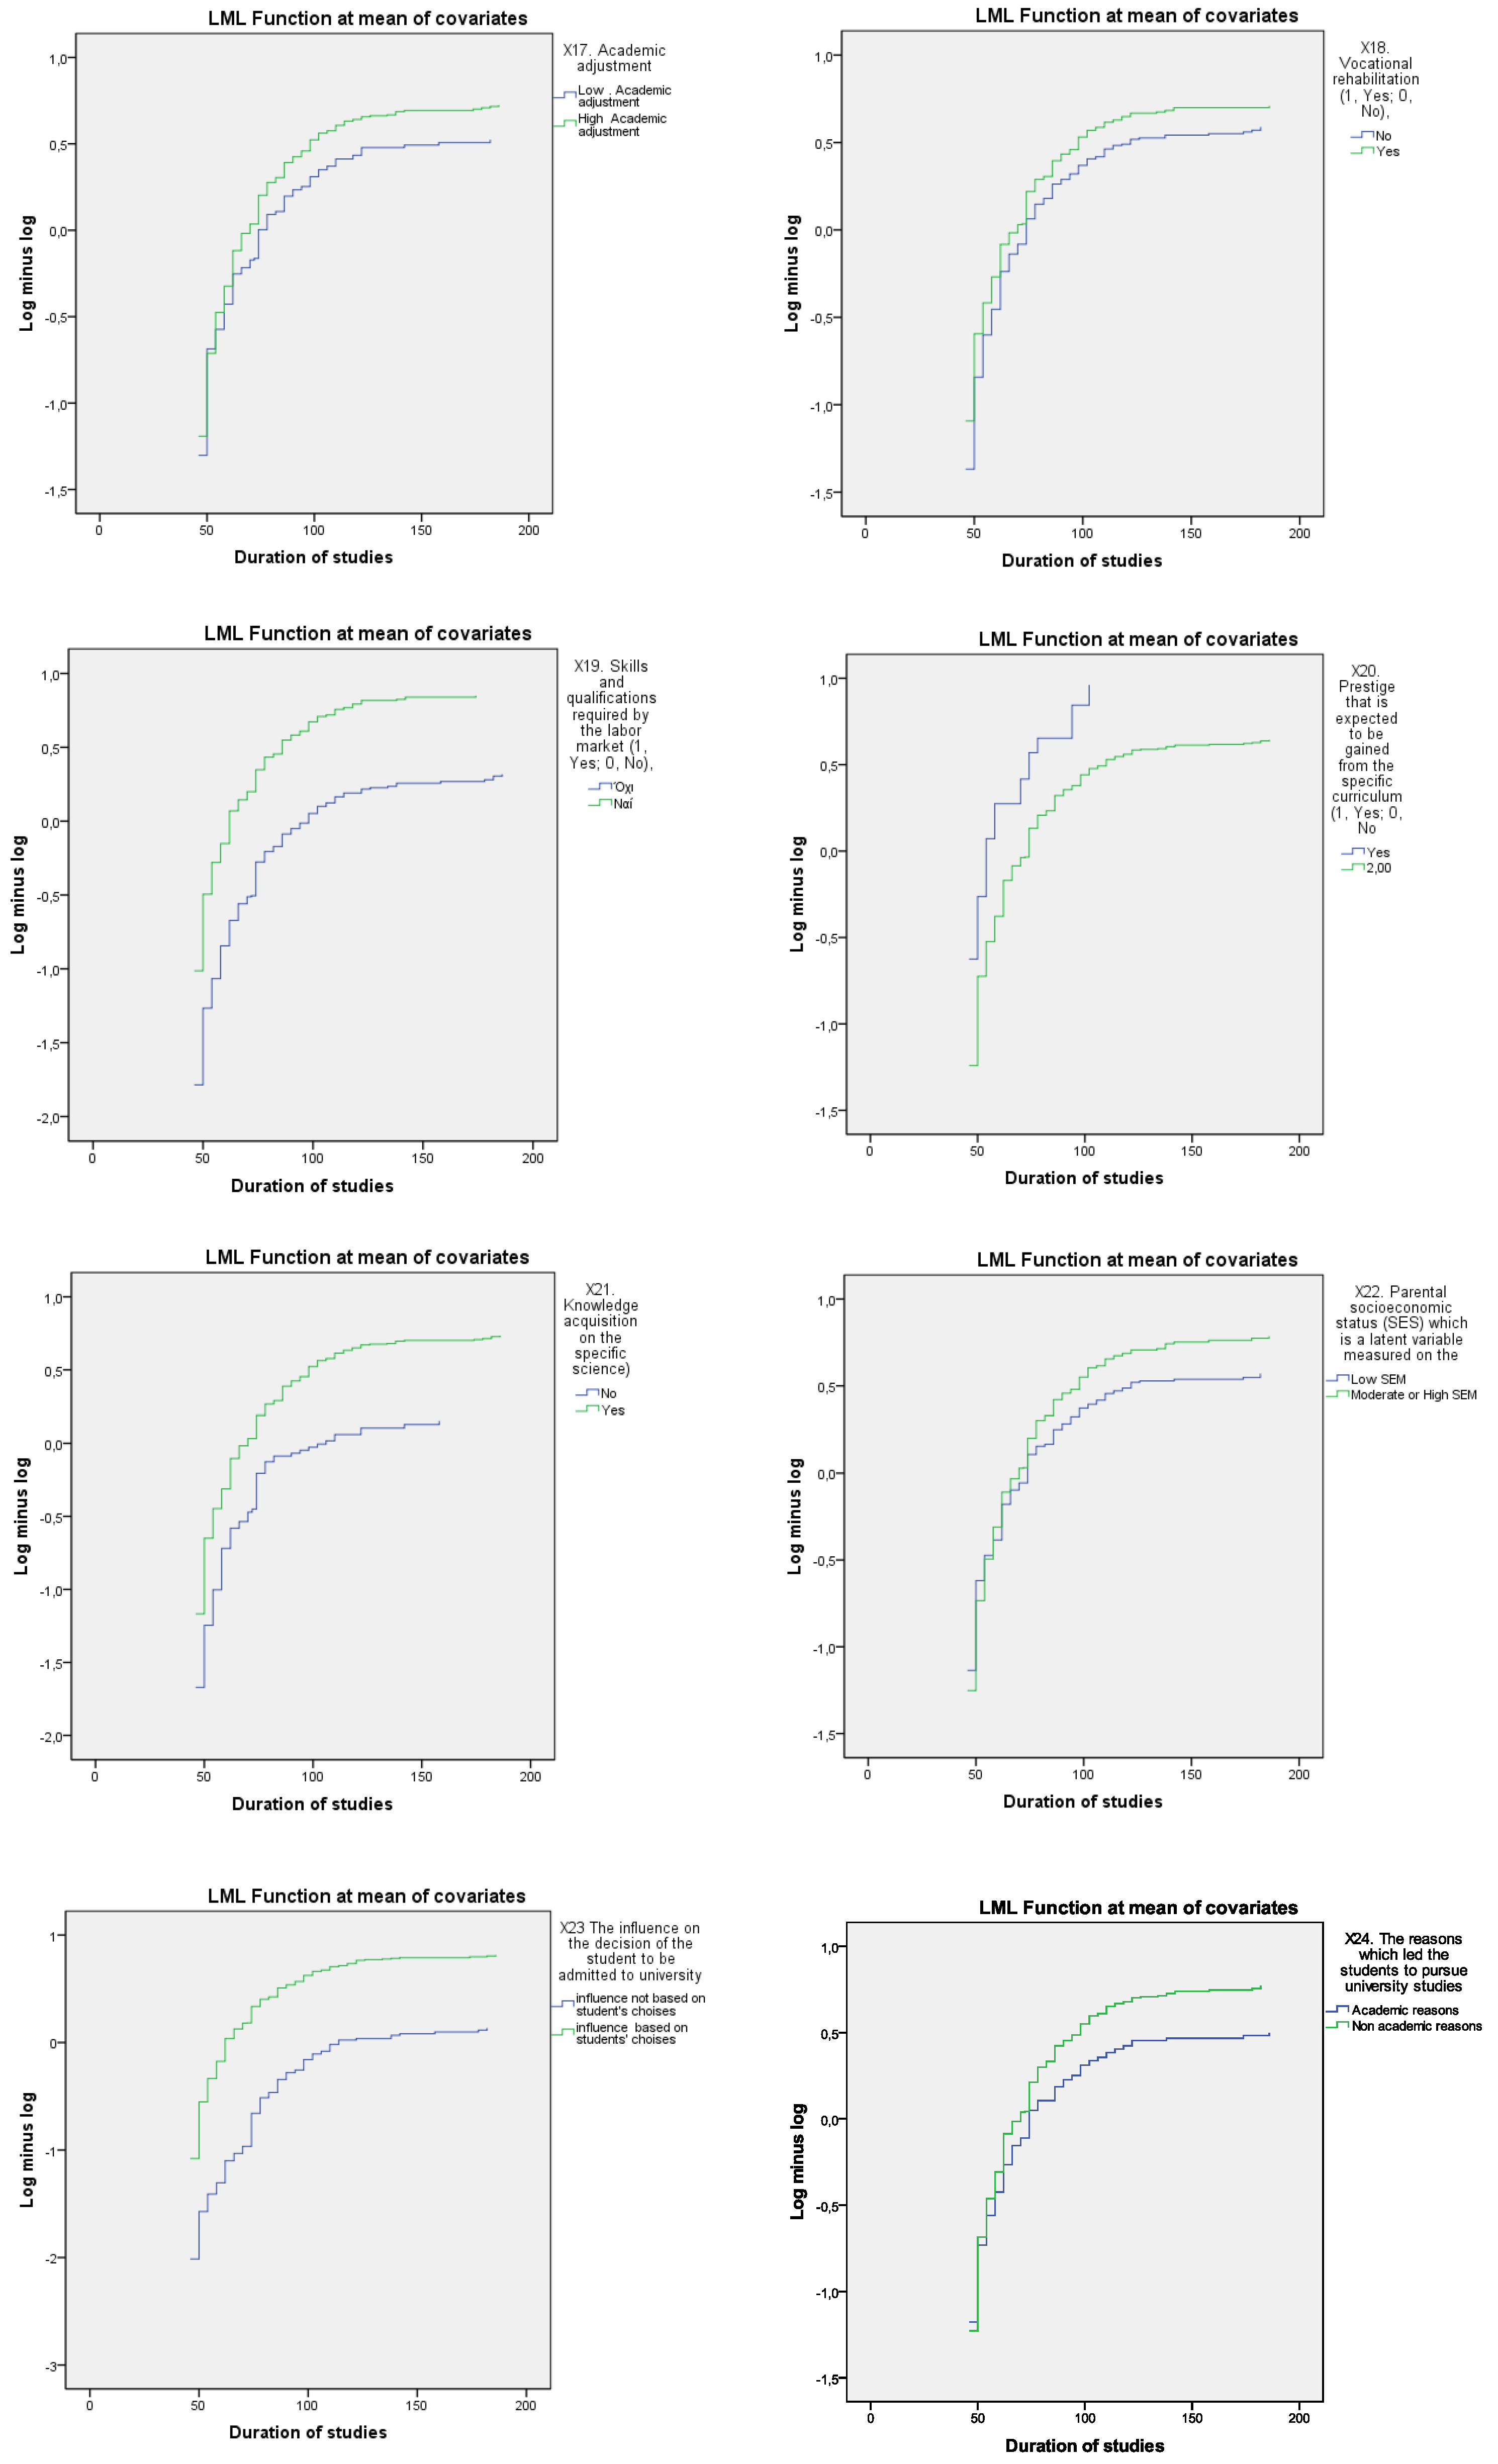
- X17.
- Academic adjustment (Cronbach’s a = 0.71). To capture academic adjustment, five observed variables were scored. These correspond to: Participation to the university events, Participation to students’ parties and other political events, Participation in students’ election activities, “Hanging out” with classmates, and Living in University Campus.
- X18.
- Vocational rehabilitation (1, Yes; 0, No);
- X19.
- Skills and qualifications required by the labor market (1, Yes; 0, No);
- X20.
- Prestige that is expected to be gained from the specific curriculum (1, Yes; 0, No);
- X21.
- Knowledge acquisition on the specific field of science;
- X22.
- Parental socioeconomic status (SES), which is a latent variable measured on the base of parental educational, occupational, and income level (1, High SES; 0, Low SES).
- X23.
- The influence on the decision of the student to be admitted to university (Cronbach’s a = 0.73), was assessed based on the following variables: the extent to which the selection of a specific field of study was driven by the students’ desire for education (measured on a Likert scale from 1 to 5); the extent to which the choice reflected the students’ personal preferences (Likert scale, 1 to 5); and the degree of parental interest in the students’ academic progress throughout their studies (Likert scale, 1 to 5).
- X24.
- The reasons which led the students to pursue university studies (Cronbach’s a = 0.74), were evaluated through the following variables: the pursuit of social advancement (Likert scale, 1 to 5); the aspiration for social recognition (Likert scale, 1 to 5); personal development (Likert scale, 1 to 5); the desire for social mobility (Likert scale, 1 to 5); the perception that attending university is an expected norm within Greek society (Likert scale, 1 to 5); the wish for independence from the family environment (Likert scale, 1 to 5); the acquisition of general knowledge (Likert scale, 1 to 5); the pursuit of prestige associated with being a university graduate (Likert scale, 1 to 5); meeting parental expectations (Likert scale, 1 to 5); and experiencing “student life” (Likert scale, 1 to 5).
2.3. The Statistical Model
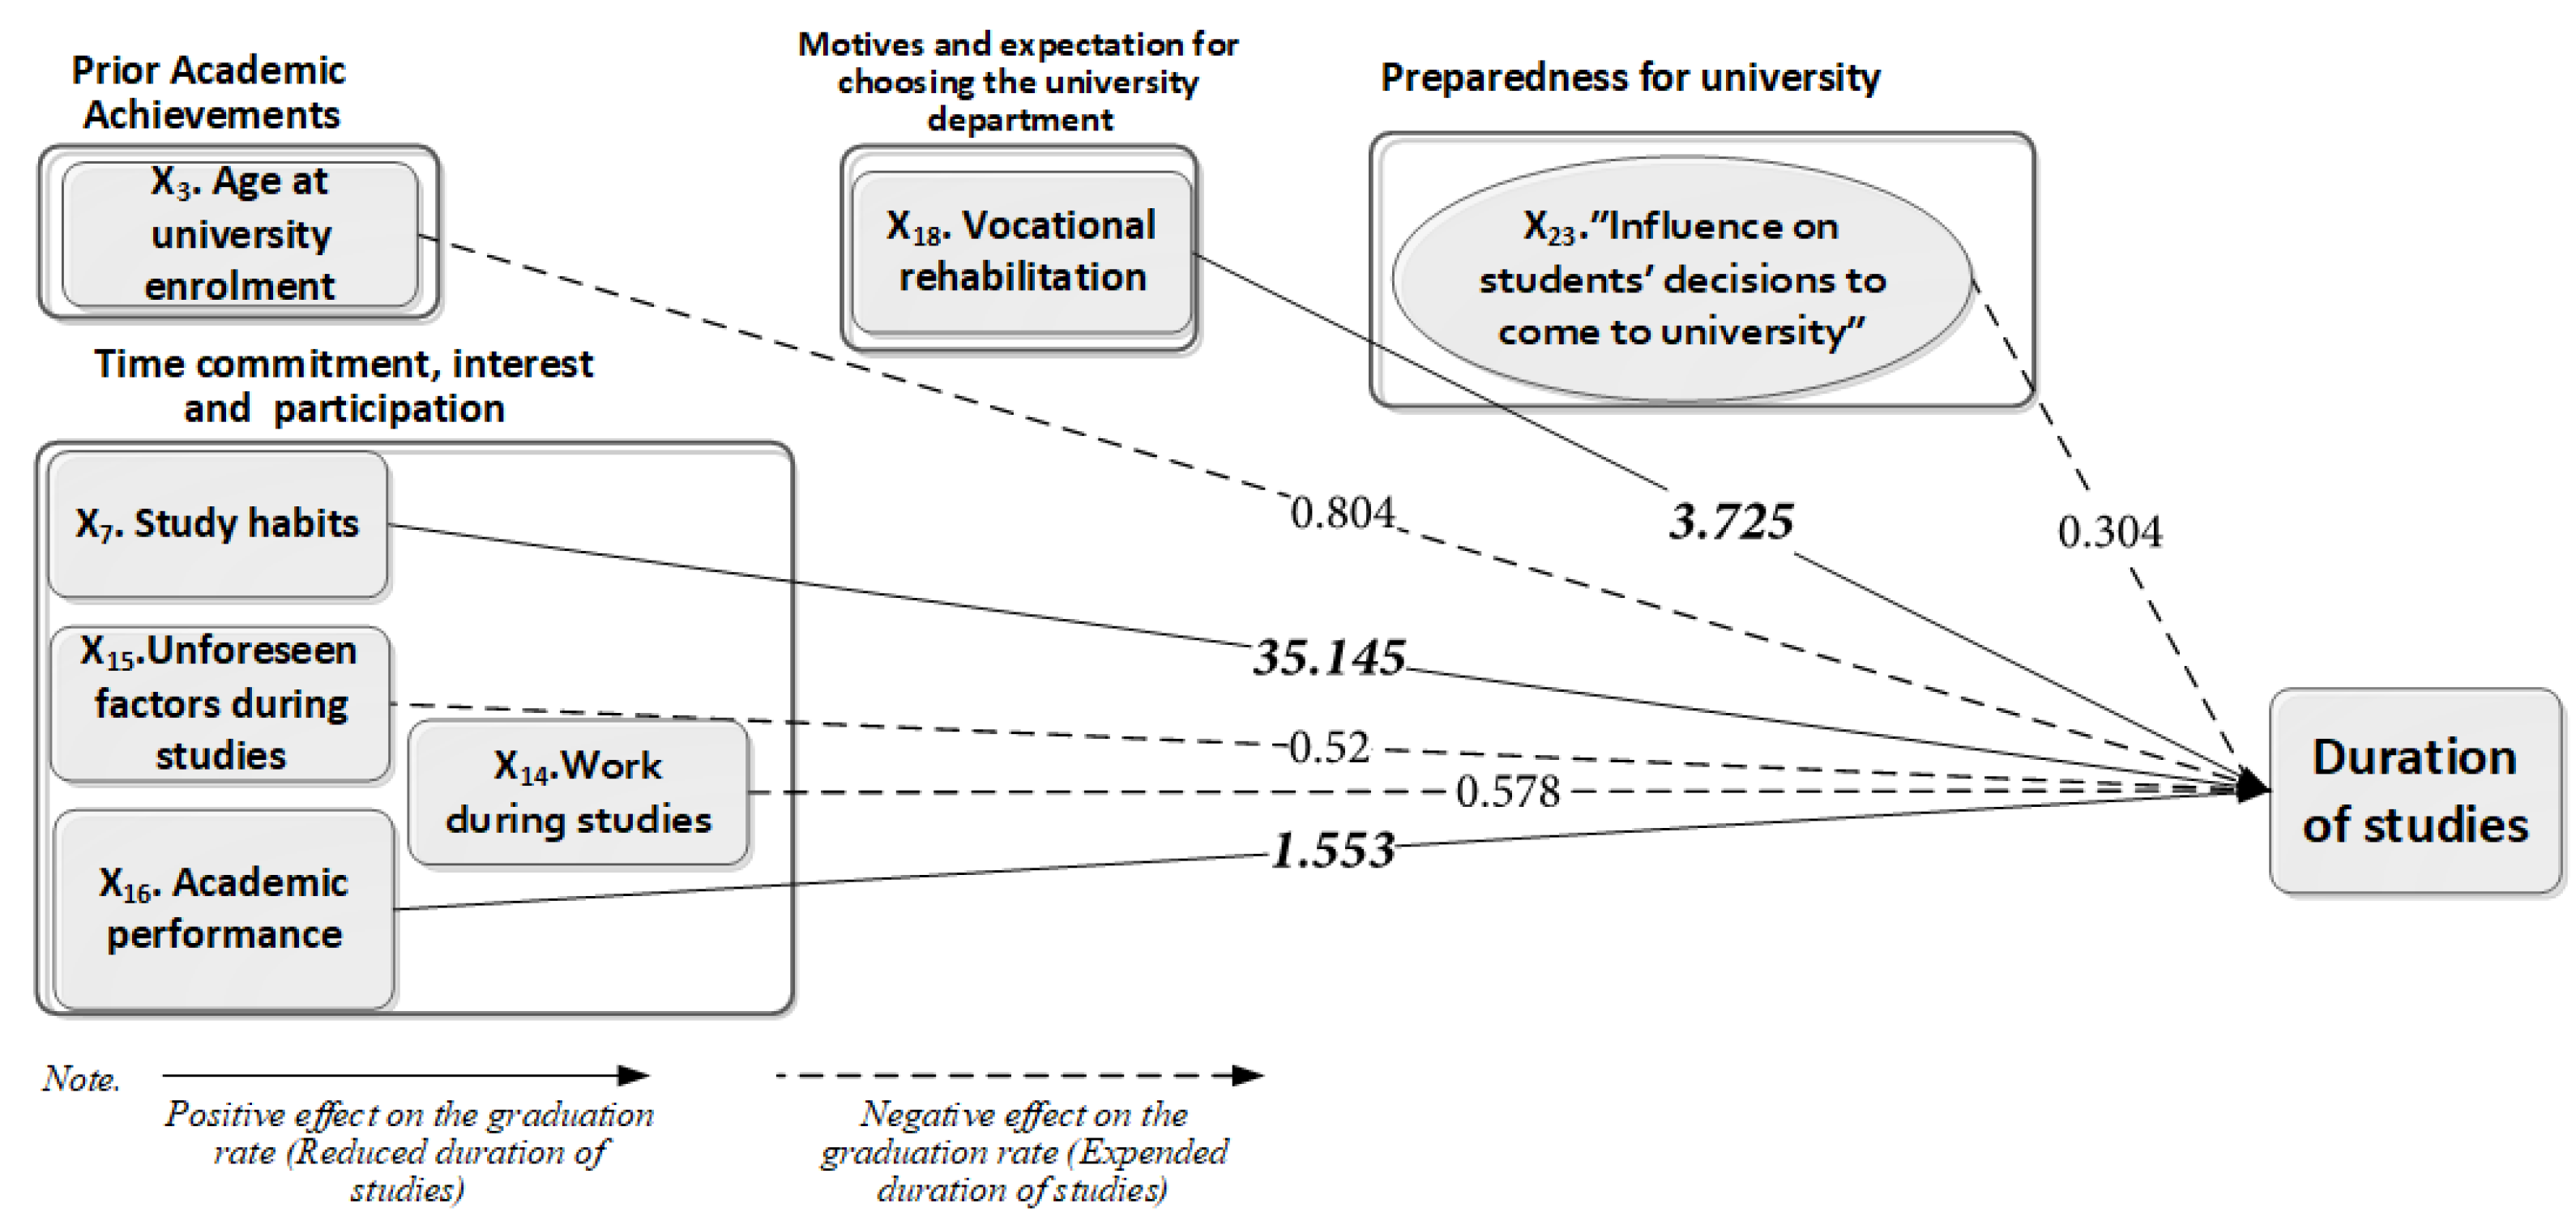
2.4. The Empirical Model
3. Results
4. Conclusions
Author Contributions
Funding
Institutional Review Board Statement
Informed Consent Statement
Data Availability Statement
Conflicts of Interest
Appendix A. Goodness of Fit Test
| Maximum likelihood for the baseline model (when the effect of all covariates is set to zero) | ||||
| 2642.904. | ||||
| Maximum likelihood for the final model | df. | p | Step * | |
| 2515.444 | 117.717 | 13 | 0.000 | 29 |
| Harrell’s C statistic = 0.797 | ||||
- * The method used is Backward Stepwise, which was completed in k steps.
| Correlations among numeric Covariates | |||||
| (X3) Students’ Age at the time of university enrolment | X4. Secondary school grades: (the score ranges from 10, the minimum grade required for admission to university, to 20), | X5. University access score: | (X16) Academic performance: Average score of the first two semesters of studies | ||
| (X3) Students’ Age at the time of university enrolment | Pearson Correlation | 1 | −0.252 | −0.549 | −0.044 |
| Sig. (2-tailed) | 0.000 | 0.000 | 0.123 | ||
| X4. Secondary school grades: (the score ranges from 10, the minimum grade required for admission to university, to 20), | Pearson Correlation | −0.252 | 1 | 0.252 | 0.267 |
| Sig. (2-tailed) | 0.000 | 0.000 | 0.000 | ||
| X5. University access score: | Pearson Correlation | −0.549 | 0.252 | 1 | 0.223 |
| Sig. (2-tailed) | 0.000 | 0.000 | 0.000 | ||
| (X16) Academic performance: Average score of the first two semesters of studies | Pearson Correlation | −0.044 | 0.267 | 0.223 | 1 |
| Sig. (2-tailed) | 0.123 | 0.000 | 0.000 | 0.000 | |

References
- Mcneely, J. College Student Mortality; United States Government Printing Office: Washington, DC, USA, 1938. [Google Scholar]
- Tinto, V. Dropout from Higher Education: A Theoretical Synthesis of Recent Research. Rev. Educ. Res. 1975, 45, 89–125. [Google Scholar] [CrossRef]
- Bayer, A.E.; Astin, A.W.; Bauman, K.E.; Schoenfeldt, L.F. Personal and Environmental Factors Associated with College Dropouts Among High Aptitude Students. J. Educ. Psychol. 1966, 55, 219. [Google Scholar]
- Spady, W.G. Dropouts from Higher Education: Toward an Empirical Model. Interchange 1971, 2, 38–62. [Google Scholar] [CrossRef]
- Aina, C. Parental Background and College Drop Out. Evidence from Italy. Higher Educ. 2005, 65, 1–22. [Google Scholar]
- Vander Schee, B.A. College Student Retention: Formula for Student Success (review). J. Coll. Stud. Dev. 2007, 48, 360–362. [Google Scholar] [CrossRef]
- Reason, R.D. Student Variables that Predict Retention: Recent Research and New Developments. NASPA J. 2009, 46, 482–501. [Google Scholar] [CrossRef]
- Astin, A.W. Student Involvement: A Developmental Theory for Higher Education. J. Coll. Stud. Development. 1999, 40, 518. [Google Scholar]
- Bean, J.P. Dropouts and Turnover: The Synthesis and Test of a Causal Model of Student Attrition. Res. High. Educ. 1980, 12, 155–187. [Google Scholar] [CrossRef]
- Cabrera, A.F.; Nora, A.; Castaneda, M.B. College Persistence: Structural Equations Modeling Test of an Integrated Model of Student Retention. J. High. Education. 1993, 64, 123–139. [Google Scholar] [CrossRef]
- Smith, J.P.; Naylor, R.A. Dropping out of university: A statistical analysis of the probability of withdrawal for UK university students. J. R. Stat. Soc. Ser. A Stat. Soc. 2001, 164, 389–405. [Google Scholar] [CrossRef]
- Voelkle, M.C.; Sander, N. University Dropout: A Structural Equation Approach to Discrete-Time Survival Analysis. J. Individ. Differ. 2008, 29, 134–147. [Google Scholar] [CrossRef]
- Booth, A.L.; Satchell, S.E.; Bootht, A.L. The Hazards of Doing a PhD: An Analysis of Completion and Withdrawal Rates of British PhD Students in the 1980s. J. R. Stat. Soc. Ser. A Stat. Soc. 1995, 158, 297–318. [Google Scholar] [CrossRef]
- Kalamatianou, A.G.; McClean, S. The Perpetual Student: Modeling Duration of Undergraduate Studies Based on Lifetime-Type Educational Data. Lifetime Data Anal. 2003, 9, 311–330. [Google Scholar] [CrossRef] [PubMed]
- Arulampalam, W.; Naylor, R.; Smith, J. Factors affecting the probability of first year medical student dropout in the UK: A logistic analysis for the intake cohorts of 1980–1992. Med. Educ. 2004, 38, 492–503. [Google Scholar] [CrossRef] [PubMed]
- Nikolaidis, P.; Ismail, M.; Shuib, L.; Khan, S.; Dhiman, G. Predicting Student Attrition in Higher Education through the Determinants of Learning Progress: A Structural Equation Modelling Approach. Sustainability 2022, 14, 13584. [Google Scholar] [CrossRef]
- Thies, T.; Falk, S. Article Which Factors Drive Major Change and University Dropout? An Analysis on International Degree-Seeking Students at German Universities. J. Int. Stud. 2024, 14, 326–346. [Google Scholar]
- Visser, M.S.; Luwel, M.; Moed, H.F. The attainment of doctoral degrees at Flemish Universities: A survival analysis. High. Educ. 2007, 54, 741–757. [Google Scholar] [CrossRef]
- Marshall, A.H.; Zenga, M. Simulating Coxian phase-type distributions for patient survival. Int. Trans. Oper. Res. 2009, 16, 213–226. [Google Scholar] [CrossRef]
- Marc, E.B.; Maurice, J.S.; Richard, J.S. Cancer Clinical Trials Methods and Practice; Oxford University Press: New York, NY, USA, 1985. [Google Scholar]
- Snedecor, G.W.; Cochran, W.G. Statistical Methods, 8th ed.; State University Press: Ames, IA, USA, 1989. [Google Scholar]
- Chimka, J.R.; Reed-Rhoads, T.; Barker, K. Proportional hazards models of graduation. J. Coll. Stud. Ret. 2007, 9, 221–232. [Google Scholar] [CrossRef]
- Cox, D.R. Regression models and life tables (with discussion). J. R. Stat. Soc. Ser. B 1972, 34, 187–220. [Google Scholar] [CrossRef]

Disclaimer/Publisher’s Note: The statements, opinions and data contained in all publications are solely those of the individual author(s) and contributor(s) and not of MDPI and/or the editor(s). MDPI and/or the editor(s) disclaim responsibility for any injury to people or property resulting from any ideas, methods, instructions or products referred to in the content. |
© 2025 by the authors. Licensee MDPI, Basel, Switzerland. This article is an open access article distributed under the terms and conditions of the Creative Commons Attribution (CC BY) license (https://creativecommons.org/licenses/by/4.0/).
Share and Cite
Kalamaras, D.; Maska, L.; Nasika, F. A Cox Proportional Hazards Model with Latent Covariates Reflecting Students’ Preparation, Motives, and Expectations for the Analysis of Time to Degree. Stats 2025, 8, 37. https://doi.org/10.3390/stats8020037
Kalamaras D, Maska L, Nasika F. A Cox Proportional Hazards Model with Latent Covariates Reflecting Students’ Preparation, Motives, and Expectations for the Analysis of Time to Degree. Stats. 2025; 8(2):37. https://doi.org/10.3390/stats8020037
Chicago/Turabian StyleKalamaras, Dimitrios, Laura Maska, and Fani Nasika. 2025. "A Cox Proportional Hazards Model with Latent Covariates Reflecting Students’ Preparation, Motives, and Expectations for the Analysis of Time to Degree" Stats 8, no. 2: 37. https://doi.org/10.3390/stats8020037
APA StyleKalamaras, D., Maska, L., & Nasika, F. (2025). A Cox Proportional Hazards Model with Latent Covariates Reflecting Students’ Preparation, Motives, and Expectations for the Analysis of Time to Degree. Stats, 8(2), 37. https://doi.org/10.3390/stats8020037